Abstract
Cardiac resynchronization therapy (CRT) is an established treatment for left bundle branch block (LBBB) resulting in mechanical dyssynchrony. Approximately 1/3 of patients with CRT, however, are non-responders. To understand factors affecting CRT response, an electromechanics-perfusion computational model based on animal-specific left ventricular (LV) geometry and coronary vascular networks located in the septum and LV free wall is developed. The model considers contractility-flow and preload-activation time relationships, and is calibrated to simultaneously match the experimental measurements in terms of the LV pressure, volume waveforms and total coronary flow in the left anterior descending and left circumflex territories from 2 swine models under right atrium and right ventricular pacing. The model is then applied to investigate the responses of CRT indexed by peak LV pressure and (dP/dt)max at multiple pacing sites with different degrees of perfusion in the LV free wall. Without the presence of ischemia, the model predicts that basal-lateral endocardial region is the optimal pacing site that can best improve (dP/dt)max by 20% associated with the shortest activation time. In the presence of ischemia, a non-ischemic region becomes the optimal pacing site when coronary flow in the ischemic region fell below 30% of its original value. Pacing at the ischemic region produces little response at that perfusion level. The optimal pacing site is associated with one that optimizes the LV activation time. These findings suggest that CRT response is affected by both pacing site and coronary perfusion, which may have clinical implication in improving CRT responder rates.
Keywords: Mechanical dyssynchrony, cardiac resynchronization therapy, left ventricular mechanics, coronary perfusion, computational modeling
1. Introduction
Heart failure (HF) is a major health and socio-economic issue affecting more than 26 million people globally and about one-third of adult patients with HF have mechanical dyssynchrony (MD), where contraction is delayed in the left ventricular (LV) free wall relative to septum [1]. Cardiac resynchronization therapy (CRT) where the heart is paced at the right atrium (RA) if the patient is in sinus rhythm [2], right ventricle (RV) and LV epicardium has been an effective treatment to resynchronize contraction and improve LV function, however, approximately 30% of patients fail to respond to the therapy [3]. The lack of CRT response has been attributed to some modifiable factors, such as suboptimal lead position and other patient-specific idiopathic reasons [4].
Experimental [4] and clinical studies [5,6] have provided some insights into CRT optimization, showing that the pacing site plays an important role in CRT response [7,8]. Clinical studies show that lateral wall pacing improves acute systolic function more than pacing at the anterior, inferior and apical regions [9–12]. Other studies found that endocardium pacing improved resynchronization in canine models [13,14] and patients [15] as it produces a more physiological electric wave front propagating from the endocardium to the epicardium. Besides pacing site, there is increasing evidence that coronary perfusion plays an important role in CRT and can affect the response to this treatment [16–18]. Moreover, experimental work on the canine model suggests that response to CRT is dependent on a minimal myocardial perfusion [4]. This has also been observed in clinical study that a minimal perfusion may be required for CRT to exert its benefits [19]. Due to the multiple confounding factors that can affect CRT, predictors of the treatment response remain elusive, hampering patient selection and optimization of the treatment.
To address this issue, computational models have been developed to optimize CRT by investigating the effects of each factor that is difficult, if not impossible, to perform experimentally or clinically. These models have either considered only cardiac electrophysiology or the coupling between cardiac electrophysiology and mechanics: i.e., electromechanics. Computational models of electrophysiology have been applied to investigate the effects of CRT on activation pattern [1,20]. This class of models, however, cannot be used to investigate the effects on LV mechanical function (e.g., ejection fraction, EF). Computational models of cardiac electromechanics can overcome this limitation. This class of models have been used for selection pacing sites that produces the best improvement in LV mechanical function such as maximal myocardial efficiency [21–25], LV pressure gradients (dP/dt)max [26] and electromechanical activation sequence [1,27], as well as electrophysiological function such as LV activation time [28]. These models have also been used to investigate the effects of lead position relative to scar location on LV mechanical function and hemodynamics [29] [24]. Coronary perfusion, however, is not considered in any of these models. As such, these models cannot be used to investigate the effects of CRT on the bi-directional interactions between LV mechanics and coronary perfusion.
Accordingly, we have recently developed a modeling framework that couples a lumped model of the LV with coronary perfusion to investigate their interactions in the presence of MD [30,31]. But the current perfusion cardiac models, however, cannot account for the spatial heterogeneity of cardiac mechanics that is associated with a realistic geometry of the LV. To overcome this limitation, the aim of this study is to develop an electromechanics-perfusion computational modeling framework that, for the first time, couples a finite element LV model (LV FE) and coronary microvascular networks embedded in the myocardium to investigate the effects of CRT on LV activation time, mechanics, coronary perfusion (under fully vasodilated condition) as well as their interactions. Calibrated using experimental measurements acquired from two swine models under RA pacing (to emulate normal sinus rhythm using the normal conduction system) and RV pacing (to emulate MD arising from left branch bundle block, LBBB), the calibrated model is applied to simulate the effects of pacing at different sites with different degree of coronary perfusion. The findings in this study can provide important insights in understanding the underlying mechanisms that affect CRT responses and help optimize the treatment.
2. Methods
2.1. Swine experiment
All animal experiments were performed following the national and local ethical guidelines, including the Institute of Laboratory Animal Research guidelines, the Public Health Service policy on Human Care and Use of Laboratory Animals, the Animal Welfare Act, and an approved California Medical Innovations Institute IACUC protocol regarding to the use of animals in research.
Yorkshire domestic swine (n = 2) was fasted overnight and sedated with TKX (Telazol 10 mg/kg, Ketamine 5 mg/kg, Xylazine 5 mg/kg; IM), intubated, and maintained under anesthesia with Isoflurane and oxygen. All instrumentations and interventions, including sternotomy, were performed while the animals were well anesthetized. A surgical plane was maintained with 1–2% Isoflurane and 100% O2 to keep PCO2 at 35–40 mmHg. Limb and precordial ECG leads were attached to the animal and cardiac electrical activity was monitored on a Physio-Control Lifepak-12 defibrillator. Two introducer sheaths were percutaneously inserted into the jugular vein for administration of fluids and placement of a pacing lead, and to access the right side of the heart. A dual chamber external pacemaker, Pace 203H (Oscor, Palm Harbor, FL, USA) and a 5F, temporary pacing electrode catheter, 008556P (Bard, Lowell, MA, USA) was used. An additional introducer sheath was percutaneously inserted into the right femoral artery to access the coronary arteries and the LV. Heparin 100 IU/kg, IV, was administered before further instrumentation, and was then supplemented as needed. To pace the heart from the RA, the dual pacing, dual sensing, trigger inhibition (DDD) mode was used to increase sinus rhythm, and to pace from the RV, the tip of the pacing catheter was placed in the apical region of the RV and the single chamber ventricular (VVI) pacing mode was used to create dyssynchrony to mimic LBBB in patients. The pacing modes were applied in a random sequence. Pacing was turned on approximately five minutes before adenosine injection. Changes were recorded before, during, and after the effects of adenosine have subsided. In order to compare the LV function and total coronary perfusion over one cardiac cycle at the same heart rate between baseline case with normal conduction and mechanical dyssynchrony case with abnormal conduction, RA pacing only is used to increase the intrinsic heart rate in baseline since RV pacing increases the heart rate. The pacing heart rate was chosen to be higher than the intrinsic heart rate of animals [32]. Measurements were recorded under RA and RV pacing at 100 beats per minute.
2.1.1. Left ventricular pressure
A Millar pressure catheter (Ventri Cath 507), connected to an MPVS Ultra PV loop system (Millar, Houston, Texas, USA), was advanced from the femoral artery via the guiding catheter using a retroaortic approach to cross the aortic valve, and the tip of the catheter was placed in the apical region of the LV. Since we used a 5F Millar catheter, its presence through the aortic valve did not cause aortic regurgitation, and hence, it did not affect our measurements. Pressure waveforms were recorded using a data acquisition system (LabChart Pro, ADInstruments, Colorado Springs, CO, USA). Both LV pressure and volume waveforms were measured with the conductance catheter in the LV.
2.1.2. Coronary flow rate
The swine chest was opened through a midline sternotomy and an incision was made in the pericardium with the creation of a sling to support the heart. The left anterior descending (LAD) and left circumflex (LCX) arteries were carefully dissected free from their surrounding tissue and a flow probe connected to a flow meter (Transonic, Ithaca, NY, USA) was placed around the arteries. Subsequently, intracoronary adenosine, 120μg, was injected into the left main to measure LAD and LCX flow rates under fully vasodilated conditions during RA and RV pacing.
2.1.3. Echocardiography
Transesophageal echocardiograms were obtained using an EPIQ 7C ultrasound system (Philips, Andover, MA) with an X8–2t transducer. Four-chamber two-dimensional (2D) and three-dimensional (3D) echocardiographic images were acquired with the animal placed in the supine position while simultaneously recording LV pressure.
2.1.4. Left ventricular geometry
Anatomical model of the LV was post-processed from the acquired 3D echocardiographic images corresponding to the time point in the cardiac cycle where ventricular pressure was the lowest[33] using TomTec Imaging Systems GmbH (Philips Healthcare, Andover, MA).
2.2. Cardiac-coronary computational framework
2.2.1. Closed loop circulatory system
The computational framework is an extension from that used in previous studies [31,34]. The framework consists of an LV FE model (with animal specific geometry) that is coupled with 4 coronary microvascular networks in a closed loop circulatory system (Figure 1a). The modeled coronary networks are located at different regions based on the ‘assumed’ distributions of LAD and LCX territories. Specifically, the territories perfused by the LAD1 and LCX1 networks are located in the apical-mid region of the septum and LV free wall, respectively (Figure 1b) [35]. On the other hand, the LAD2 and LCX2 networks are associated with the basal regions of the septum and LV free wall, respectively. The LAD1/LCX1 accounts for 2/3 of the total coronary flow in the main LAD/LCX artery, and the LAD2/LCX2 accounts for the remaining flow, respectively. The circulatory system consists of the left atrium (LA), proximal and distal peripheral arteries, and peripheral veins, each represented by their corresponding electrical analogs. Total blood volume in the circulatory system is conserved, so that the sum of the rate of change in each storage compartment is equal to the difference between the inflow and outflow rates of the connecting segments. Flow rates in each segment (representing the aortic and mitral valves, proximal and distal arteries, as well as veins) are determined by its resistance and the pressure difference between the two connecting storage compartments. Pressure in the storage compartments representing the (proximal and distal) arterial and venous networks is given as a function of its compliance, instantaneous and resting volume. Pressure in the LA is given by a time-varying elastance function. Details are in Appendix A.
Figure 1:
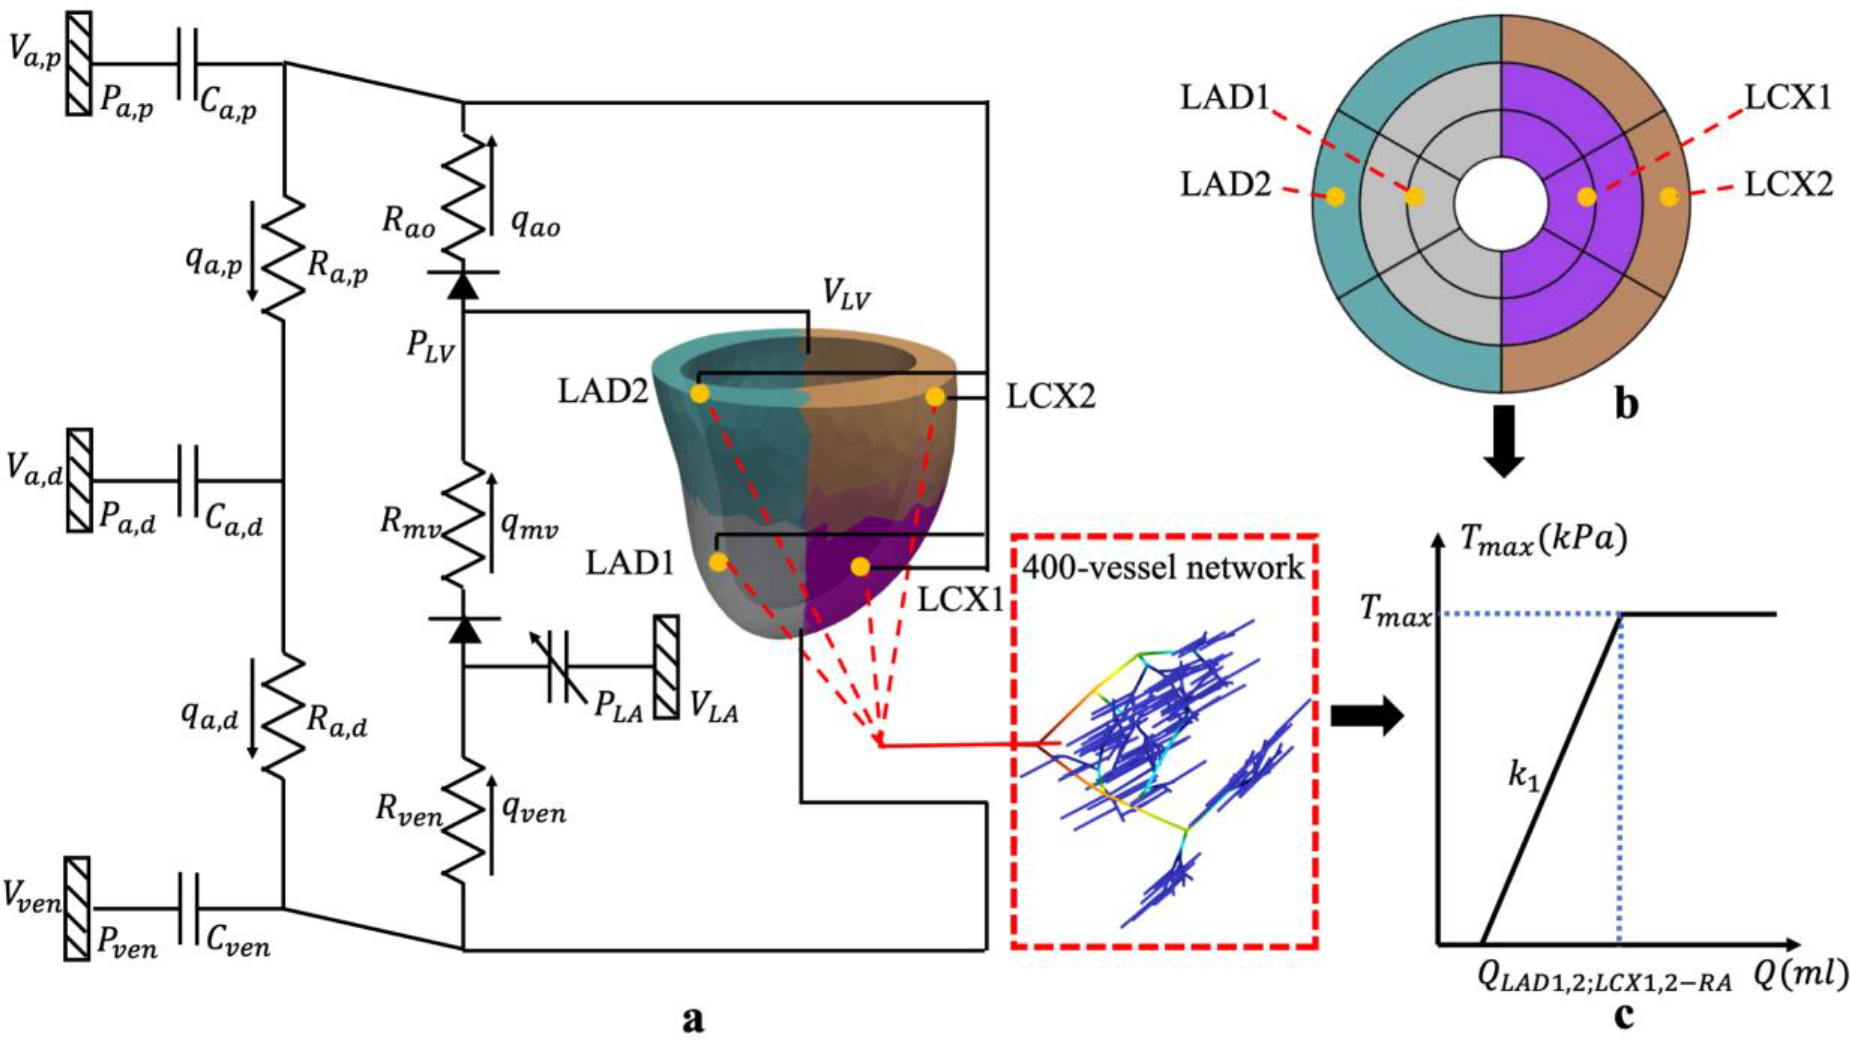
a. Schematic of the cardiac-coronary computational framework that couples the LV FE model and 400-vessel coronary networks in the LAD and LCX in a closed loop system. In the figure, pressures (P), volumes (V), flow rates (q), resistance (R) and compliances (C) are denoted with subscript “a,d, a,p, ao, mv, ven” indicating that of the distal peripheral arteries, proximal peripheral arteries, aortic, mitral valve and peripheral veins, respectively; b. AHA segment of the LV model with the perfusion regions (indicated by different colors) corresponding to the 4 coronary networks LAD1/2 and LCX1/2; c. Prescribed Tmax − Q relationship in the LAD and LCX territories.
2.2.2. Finite element formulation of the left ventricle
The electromechanics model has been described earlier [36]. Since the focus here is on the interaction between cardiac mechanics and coronary blood flow with the interaction between electrophysiology (EP) and coronary flow largely indirect (occurring mostly via mechanics), spatio-temporal evolution of cardiac action potential in the LV was described using a less complex modified Fitzhugh-Nagumo model in the monodomain formulation. This model has been integrated with cardiac mechanics in previous animal- and patient-specific electromechanics models [37–39]. This is also simpler [40] compared to more sophisticated EP models that consider detailed ionic activities [41,42], which can be used if EP changes in the cell during ischemia [43] (e.g., changes in ionic fluxes and the arrhythmogenic effects of ischemia) is considered. Electrical propagation of the action potential is controlled by an anisotropic electrical conductivity tensor and the electrical stimulus/stimuli that is used for prescribing local excitation initiation and pacing. In terms of mechanics, the functional relationship between pressure and volume in the LV (i.e., PLV = f(VLV, t)) is coupled to the circulatory system described earlier. This relationship is obtained by minimizing a Lagrangian function consisting of the myocardial tissue strain energy function and terms associated with the enforcement of constraints on the following 1) Incompressibility of myocardial tissue, 2) Zero-mean rigid body motion and rotation and 3) Cavity volume. Boundary conditions were also imposed to prevent the LV base from moving out of plane. Mechanical behavior of the LV is described using an active stress formulation with an active constitutive model based on a modified time-varying elastance model [34,44] and a passive constitutive model based on a Fung-type strain energy function [45]. Myofiber orientation was prescribed to be helical with a transmural linear variation starting from a helix angle of 60° at the endocardium to −60° at the epicardium [46]. To couple electrophysiology and mechanics, the activation contraction model was modified to incorporate the local activation initiation time that is associated with the propagation of the action potential. The LV FE formulation was solved using the open-source FE library FEniCS [47]. Details of the FE formulation and boundary conditions are given in our earlier work [36,48,49]. The details for postprocessing the myocardial work density and IMP refer to Appendix C.
2.2.3. Coronary flow analysis
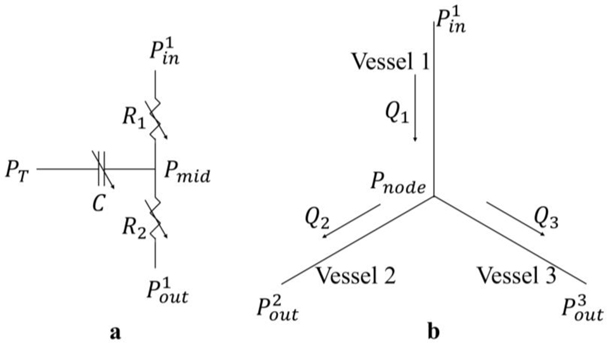
The coronary flow network consisting of 400 vessels, which is described previously [30,50], is used to represent each of the 4 coronary microcirculations (i.e., LAD1, LAD2, LCX1 and LCX2). Morphometry of the arterial tree is pruned from a previously reconstructed coronary network [50]. Briefly, flow in each vessel is represented by a three-element Windkessel model consisting of two identical nonlinear resistors and one nonlinear capacitor, which are functions of the vessel radius and trans-vascular pressure. A homogeneous intramyocardial pressure (IMP) is prescribed in each network. The junction of the three elements in the single vessel is the geometric center of the vessel with an unknown pressure. The bifurcation or trifurcation node with an unknown nodal pressure is located at the junction of the three resistors, each belonging to a different vessel. Invoking mass conservation across different vessels produces a resultant system of ODEs in terms of the unknown nodal pressures. The ODEs are solved using the backward differentiation formula in CVODE (http://www.llnl.gov/casc/sundials/). Details for the coronary flow analysis are given in Appendix B. For parameters used in flow analysis, refer to a previous work [50].
2.2.4. Coupling of the cardiac-coronary framework
The LV and coronary models are coupled bidirectionally at different levels in the framework. First, the proximal arterial pressure Pa,p and venous pressures Pven in the circulatory system (that depends on the LV model) serve as pressure boundary conditions in each coronary network. Total inlet and outlet coronary flow from the LAD and LCX networks computed with these pressure conditions are fed back into the lumped parameter model at each time step in a closed loop manner. Second, IMP in the coronary models is prescribed using the local value of Lagrange multiplier associated with the incompressibility constraint from the LV FE model, as the Lagrange multiplier has been associated with the hydrostatic pressure of the fluid-like ground matrix of the biological tissue [51,52]. We note here that the IMP is different for each network, which is located at different locations in the LV. Third, local myocardial contractility in the LV is determined by the coronary flow based on a contractility-flow relationship that is described next.
Contractility-flow relationship
Based on experimental observations of “perfusion-contraction matching” in the ischemic myocardium as described by Ross et al. [53] and Schulz et al. [54] and other experiments [31,53,55,56], a linear relationship between the regional myocardial contractility, Tmax, and total coronary flow (over a cardiac cycle) in each local region of the LAD (i.e., QLAD1 and QLAD2) and LCX (i.e., QLCX1 and QLCX2) is prescribed (Figure 1c). While a contractility-flow relationship is established largely based on acute ischemia studies, such a relationship also holds in chronic ischemia when viable hibernating myocardium is present even though it is likely to be altered [57,58]. This relationship should also hold in the non-ischemic tissue. To describe this relationship, regional Tmax is prescribed to vary linearly with the corresponding regional total coronary flow with a gradient k1 when the flow is smaller than a prescribed value Q0. Based on experimental finding that myocardial contractility (indexed by % change in LV wall thickness) is unchanged with the injection of adenosine [54], Tmax is prescribed to remain unchanged when coronary flow is greater than Q0. We note that the transition point of the contractility-flow relationship Q0 is different for the LAD (i.e., QLAD1 and QLAD2) and LCX (i.e., QLCX1 and QLCX2) networks, but the slope k1 is prescribed to be the same in each animal. The values of Q0 and k1 are determined based on animal-specific measurements in the swine model as explained later. As such, any changes to the flow in the coronary network will affect the regional contractility associated with it, which in turn, will affect the regional IMPs and the coronary networks’ perfusion pressure that further affect the coronary flow in a closed loop feedback.
2.2.5. Model calibration and simulation cases
The computational framework is first used to simulate RA pacing by assuming the LV myocardium is activated uniformly. Parameters in the framework are calibrated to obtain the waveforms of LV pressure, volume, and total passive coronary flow in the LAD and LCX that agree with those measured from the 2 swine models under RA pacing condition in experiments. In the lumped model, the parameters are selected based on previous work [59], which are then adjusted to match the data. Specifically, the arterial compliance (Cart), the peripheral arterial resistance (Rper), the arterial resting volume (Vart0), and the initial value for the arterial volume (Vart) are varied to adjust both the peak and the end systolic arterial pressures. The LV volume waveforms are adjusted by the initial value of the LV volume (VLV) in a pre-loading phase prior to simulation of the cardiac cycle, as well as the venous compartment’s resting volume (Vven0). The contractility-flow threshold Q0 associated with the LAD and LCX territories are prescribed directly from measurements under fully vasodilated condition during RA pacing. Parameters used in the LV FE model are from previous work [45,60] and adjusted to match the experimental measurements. All parameters used in coronary models are from previous works [30].
The model is then applied to simulate MD in each swine model by stimulating the LV at the septum that is close to the apical region to produce a delayed contraction in the LV free wall with respect to the septum (i.e., mechanical dyssynchrony) that is found in RV pacing match. As explained in Section 3.1, MD associated with RV pacing in the swine model resulted in a reduction in LV peak pressure, preload as well as passive coronary flow in the LAD and LCX. To accommodate the reduction in preload associated with MD (due to atrioventricular dyssynchrony) as seen in the experiment, we define a linear relationship between Vven0 and the change in activation time with respect to that in RA pacing Δt. This approach is similar to a recent study on canine model, which included the ventricular preload variation due to the atrial contribution via alterations of a lumped parameter model of the circulatory system [61]. The slope k2 of the Vven0 − Δt relationship is prescribed to match the measured LV volume reduction under RV pacing. To accommodate the simultaneous reduction in LV peak pressure and passive coronary flow in the LAD and LCX territories, we determined the contractility-flow gradient k1 associated with these territories that can simultaneously reproduce coronary flows and LV pressure waveform as measured under RA and RV pacing in the experiment. We note that only 2 parameters (k1 and k2) are determined in the calibration of model based on measurements in the swine model under RV pacing. Based on the determined slopes k1 and k2 of the contractility-flow and Vven0 − Δt relationships, the computational framework can predict waveforms of LV pressure, volume, and total passive coronary flow in the LAD and LCX acquired under both RA and RV pacing from the same swine model as shown later.
Since the model is calibrated using measurements acquired from the same swine model under both RA and RV pacing, the model is applied to simulate the effects of CRT with different pacing locations in the LV free wall with and without the presence of ischemia. Ischemia is imposed in the LCX2 territory in the framework by increasing the resistance of the most proximal vessel of the corresponding flow network, which in turn, reduces flow to that territory. Electrical conductivity velocity is linearly reduced with the reduction of coronary flow in ischemic region. When the coronary flow in ischemic region is 10% of that original value, electrical conductivity velocity in the ischemic region (0.88mm/ms) is prescribed to be about half of that in the non-ischemic region (2.08mm/ms) [26,62].
3. Results
3.1. Model calibration based on measurements of RA and RV pacing
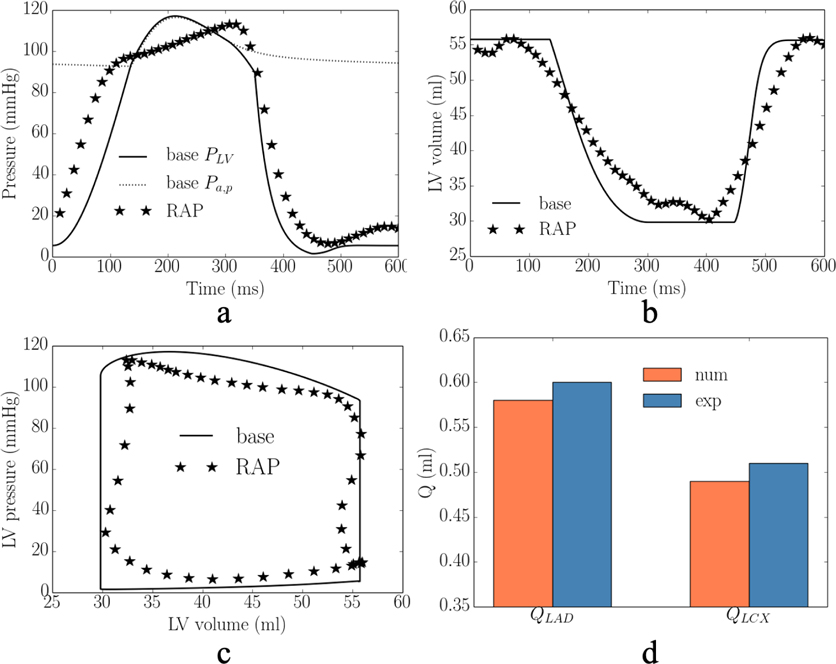
The calibrated model predicted waveforms of the LV pressure, volume, PV loop and total passive coronary flow over one cardiac cycle in the LAD and LCX are close to the corresponding measurements under RA pacing (Figure 2). Specifically, averaged absolute differences (of the 2 swine models) between the measurements and model predictions for the peak LV pressure and (dP/dt)max, are 4% and 6%, respectively. The model predicted LV end-diastolic volume (LVEDV), LV end-systolic volume (LVESV) and ejection fraction (EF) match with the experimental measurements. Difference between model prediction and measurement of the total coronary flow over a cardiac cycle in the LAD (QLAD = QLAD1 + QLAD2) and LCX (QLCX = QLCX1 + QLCX2) are 6% and 4%, respectively.
Figure 2:
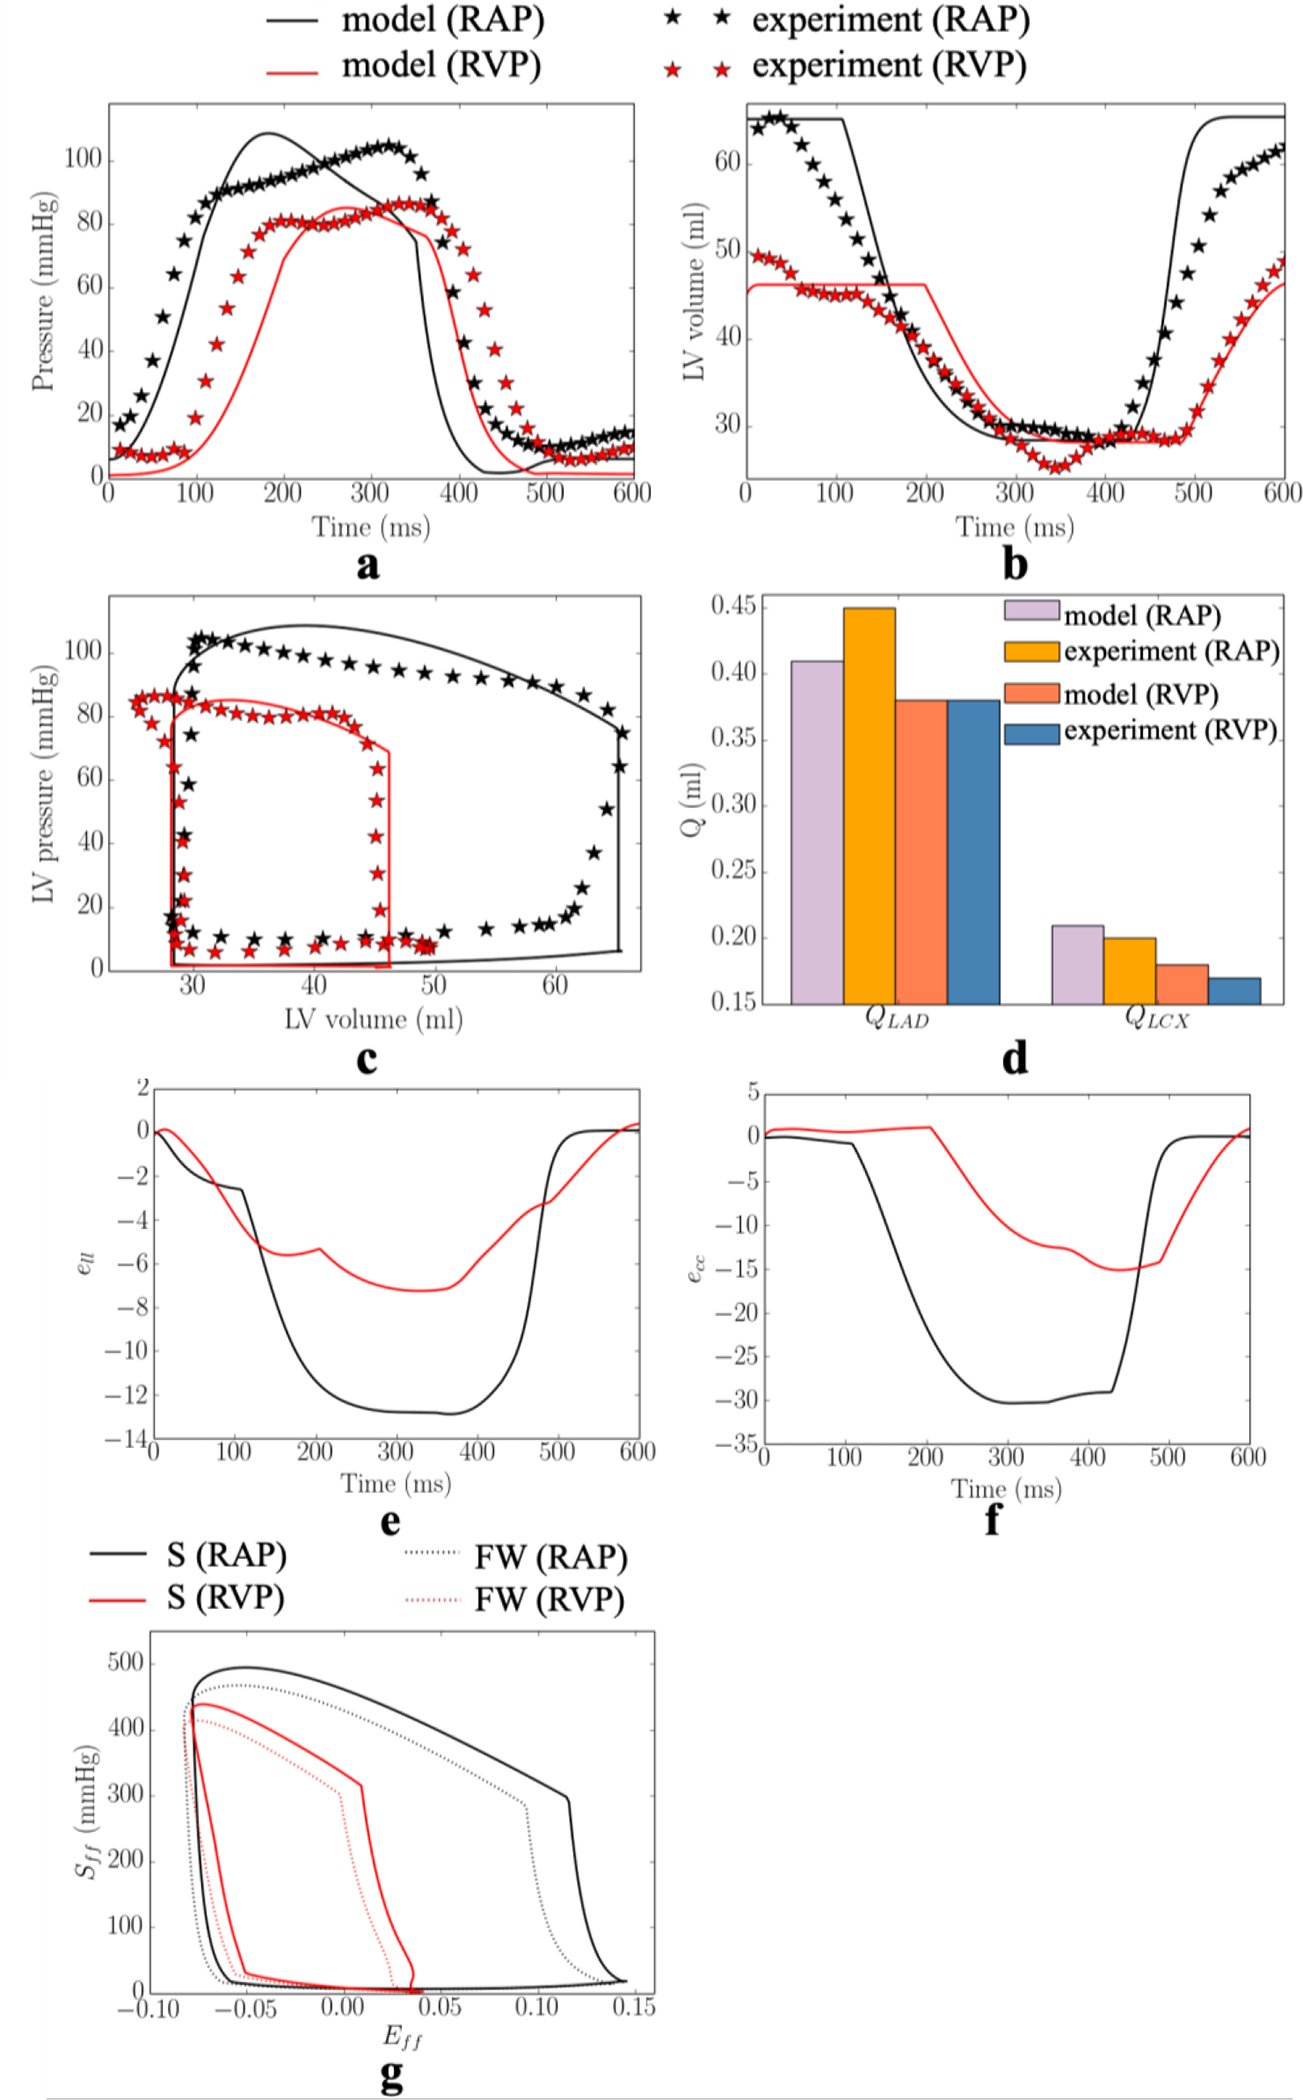
Comparison of the model predicted and experimental results under RA pacing (RAP) and RV (RVP) pacing in one of the swine model. a. LV pressure; b. LV volume; c. LV PV loop; and d. total passive coronary flow in the LAD and LCX. Model predicted a. longitudinal strain; b. circumferential strain; and c. stress-strain loop (S – septum, FW – LVFW)). Refer to Figure D1–D2 in Appendix D for the other swine model.
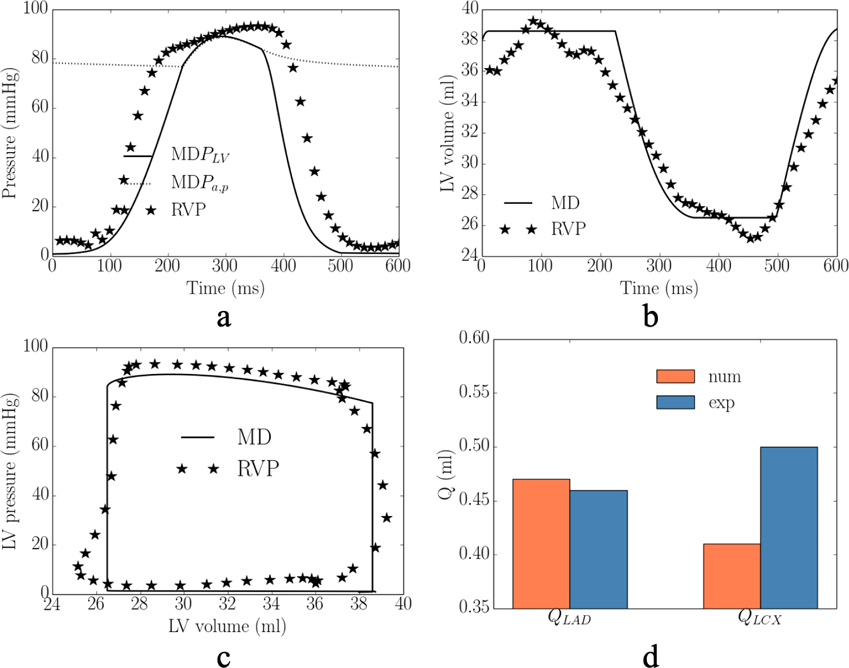
In the experiments, RV pacing reduces (cf. RA pacing) peak LV pressure, (dP/dt)max, LVEDV and passive coronary flow in the LAD and LCX by 19± 1mmHg, 134± 63mmHg/s, 16±1ml, (10±5)× 10−2ml, (2±1)× 10−2ml in the 2 swine models. These changes were applied to calibrate for the gradient of the contractility-flow relationship k1 and Vven0 − Δt relationship k2. With other model parameters fixed from the calibration with measurements of RA pacing, we found that prescribing k1 = 1.25±1.06kPa/ml (for the 2 swine models) and k2 = 5.60±0.19ml/ms (for the 2 swine models) in the computational framework with simulation of MD (that resulted in a longer LV activation time of 82± 3ms) can simultaneously reproduce the hemodynamic changes seen in the experiment (Figure 2). Specifically, the averaged absolute difference between the experiments and simulations of RV pacing in the peak LV pressure, (dP/dt)max, LVEDV, LVESV, EF, and total passive coronary flow over a cardiac cycle in the LAD and LCX (QLAD and QLCX) are 3%, 13%, 4%, 2%, 11%, 1% and 4%, respectively. The calibrated gradient k1 of the contractility-flow relationship resulted in an average reduction of the contractility by 11±5% and 4±3% in the LAD (region 1 and 2) and LCX (region 1 and 2) territories associated with RV pacing. On the other hand, the calibrated gradient k2 of the Vven0 − Δt relationship resulted in an average increase in Vven0 by 8%. In one animal, we found necessary to include an increase in the afterload by increasing the parameter Ra,d by 40% to match the changes in LVESV associated with RV pacing. In the simulation, RV pacing reduces (cf. RA pacing) peak longitudinal strain, peak circumferential strain and regional myocardial work density in the septum and LV free wall by 6%, 15%, 49mmHg and 43mmHg, respectively (Figure 2e–g).
3.2. Model predicted response of CRT
3.2.1. CRT response to MD without ischemia
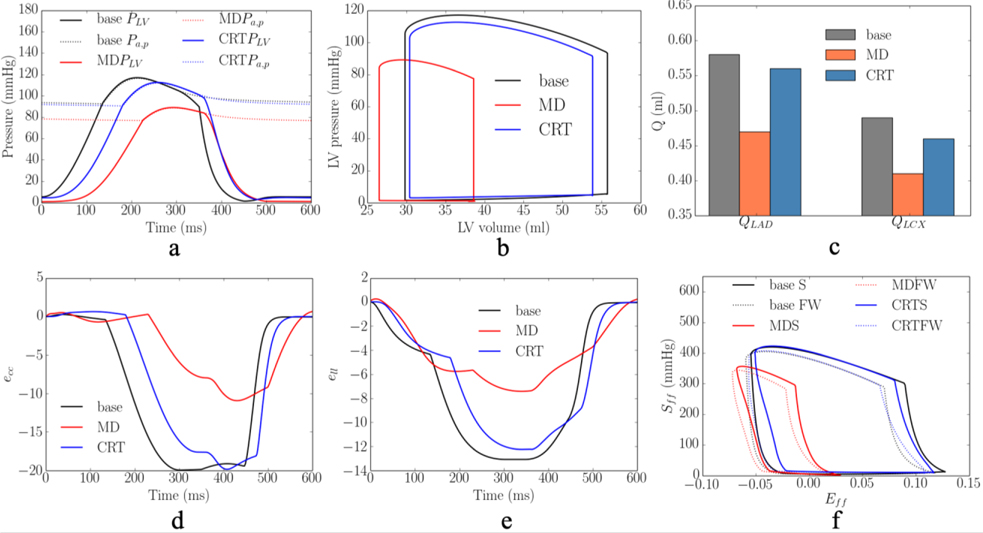
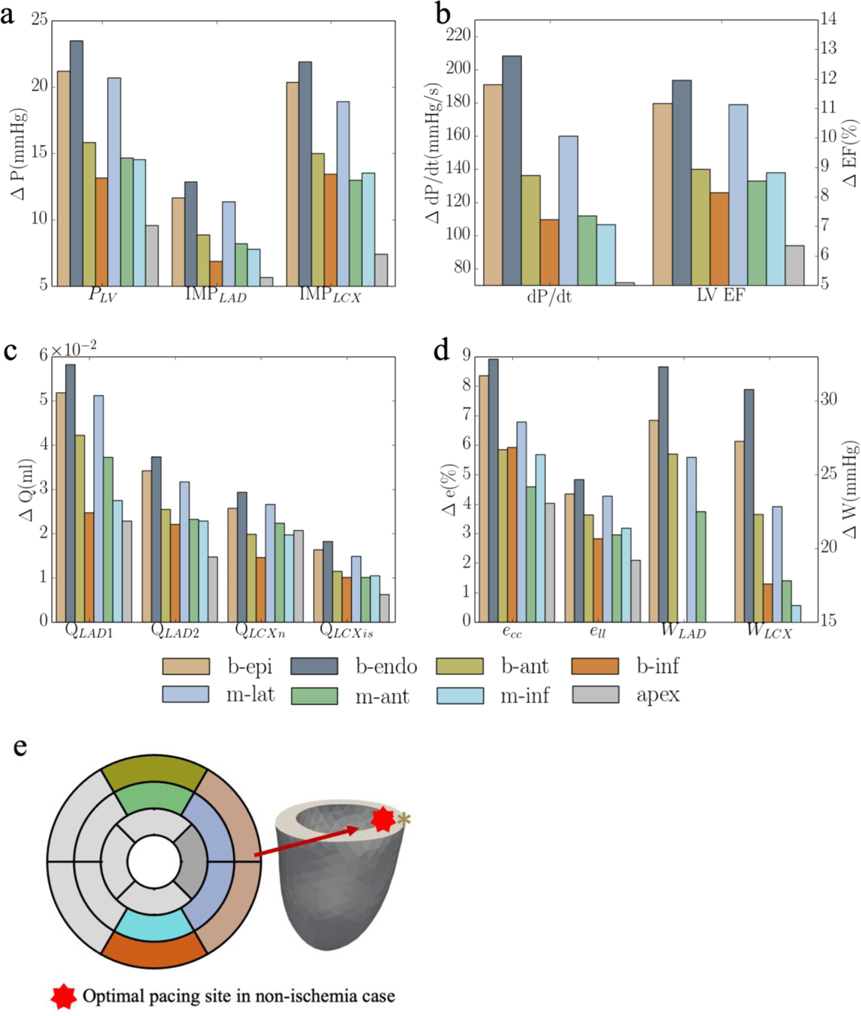
Based on the model parameters as well as the Vven0 − t and Tmax − Q relationships calibrated from the measurements, the computational framework was applied to simulate the effects of multiple different pacing sites in the LV free wall that are each superimposed onto the MD model. The responses at these pacing sites in terms of the peak LV pressure, (dP/dt)max, LV EF, QLAD1, QLAD2, QLCX1, QLCX2, peak ecc and ell, and myocardial work density in septum and LV free wall, WLAD and WLCX, were evaluated (Figure 3). The model predicted that CRT pacing at the endocardium of the basal-lateral wall region elicits the shortest activation time and produces the best improvement in LV function (indexed by peak LV pressure and LV EF) and coronary flow. Specifically, pacing at the basal-lateral endocardial region produces an average increase in the peak LV pressure, (dP/dt)max, LV EF, and total coronary flow in the LAD and LCX (QLAD and QLCX) by 21± 3mmHg, 180± 40mmHg/s, 13± 1%, (7± 2)× 10−2 ml and (3± 1)× 10−2 ml, respectively (Figure 3a–c). Besides, the peak absolute value of the global circumferential and longitudinal strains, ecc and ell, myocardial work density in the septum and LV free wall, WLAD and WLCX, were also improved, on average, by 11±2% and 5%, 36±5% and 35±6%, respectively, when pacing at that location (Figure 3d). The representative LV pressure waveform, PV loop, total coronary flow in the LAD and LCX, ecc and ell waveforms, and myocardial work density under RA pacing, RV pacing and CRT associated with the optimal pacing site are shown (Figure 4a–f). In terms of the activation pattern, pacing at the basal-lateral endocardial region resulted in that region contracting synchronously with the septum. As a result, the latest activated region is located at the apex (cf. LV free wall in MD) (Figure 4g–h). The time taken for the whole LV to be activated is reduced by 34ms when pacing at the basal-lateral endocardial region. We note, however, that pacing at the optimal site cannot fully recover the hemodynamics indices to those at the baseline (i.e., RA pacing).
Figure 3:
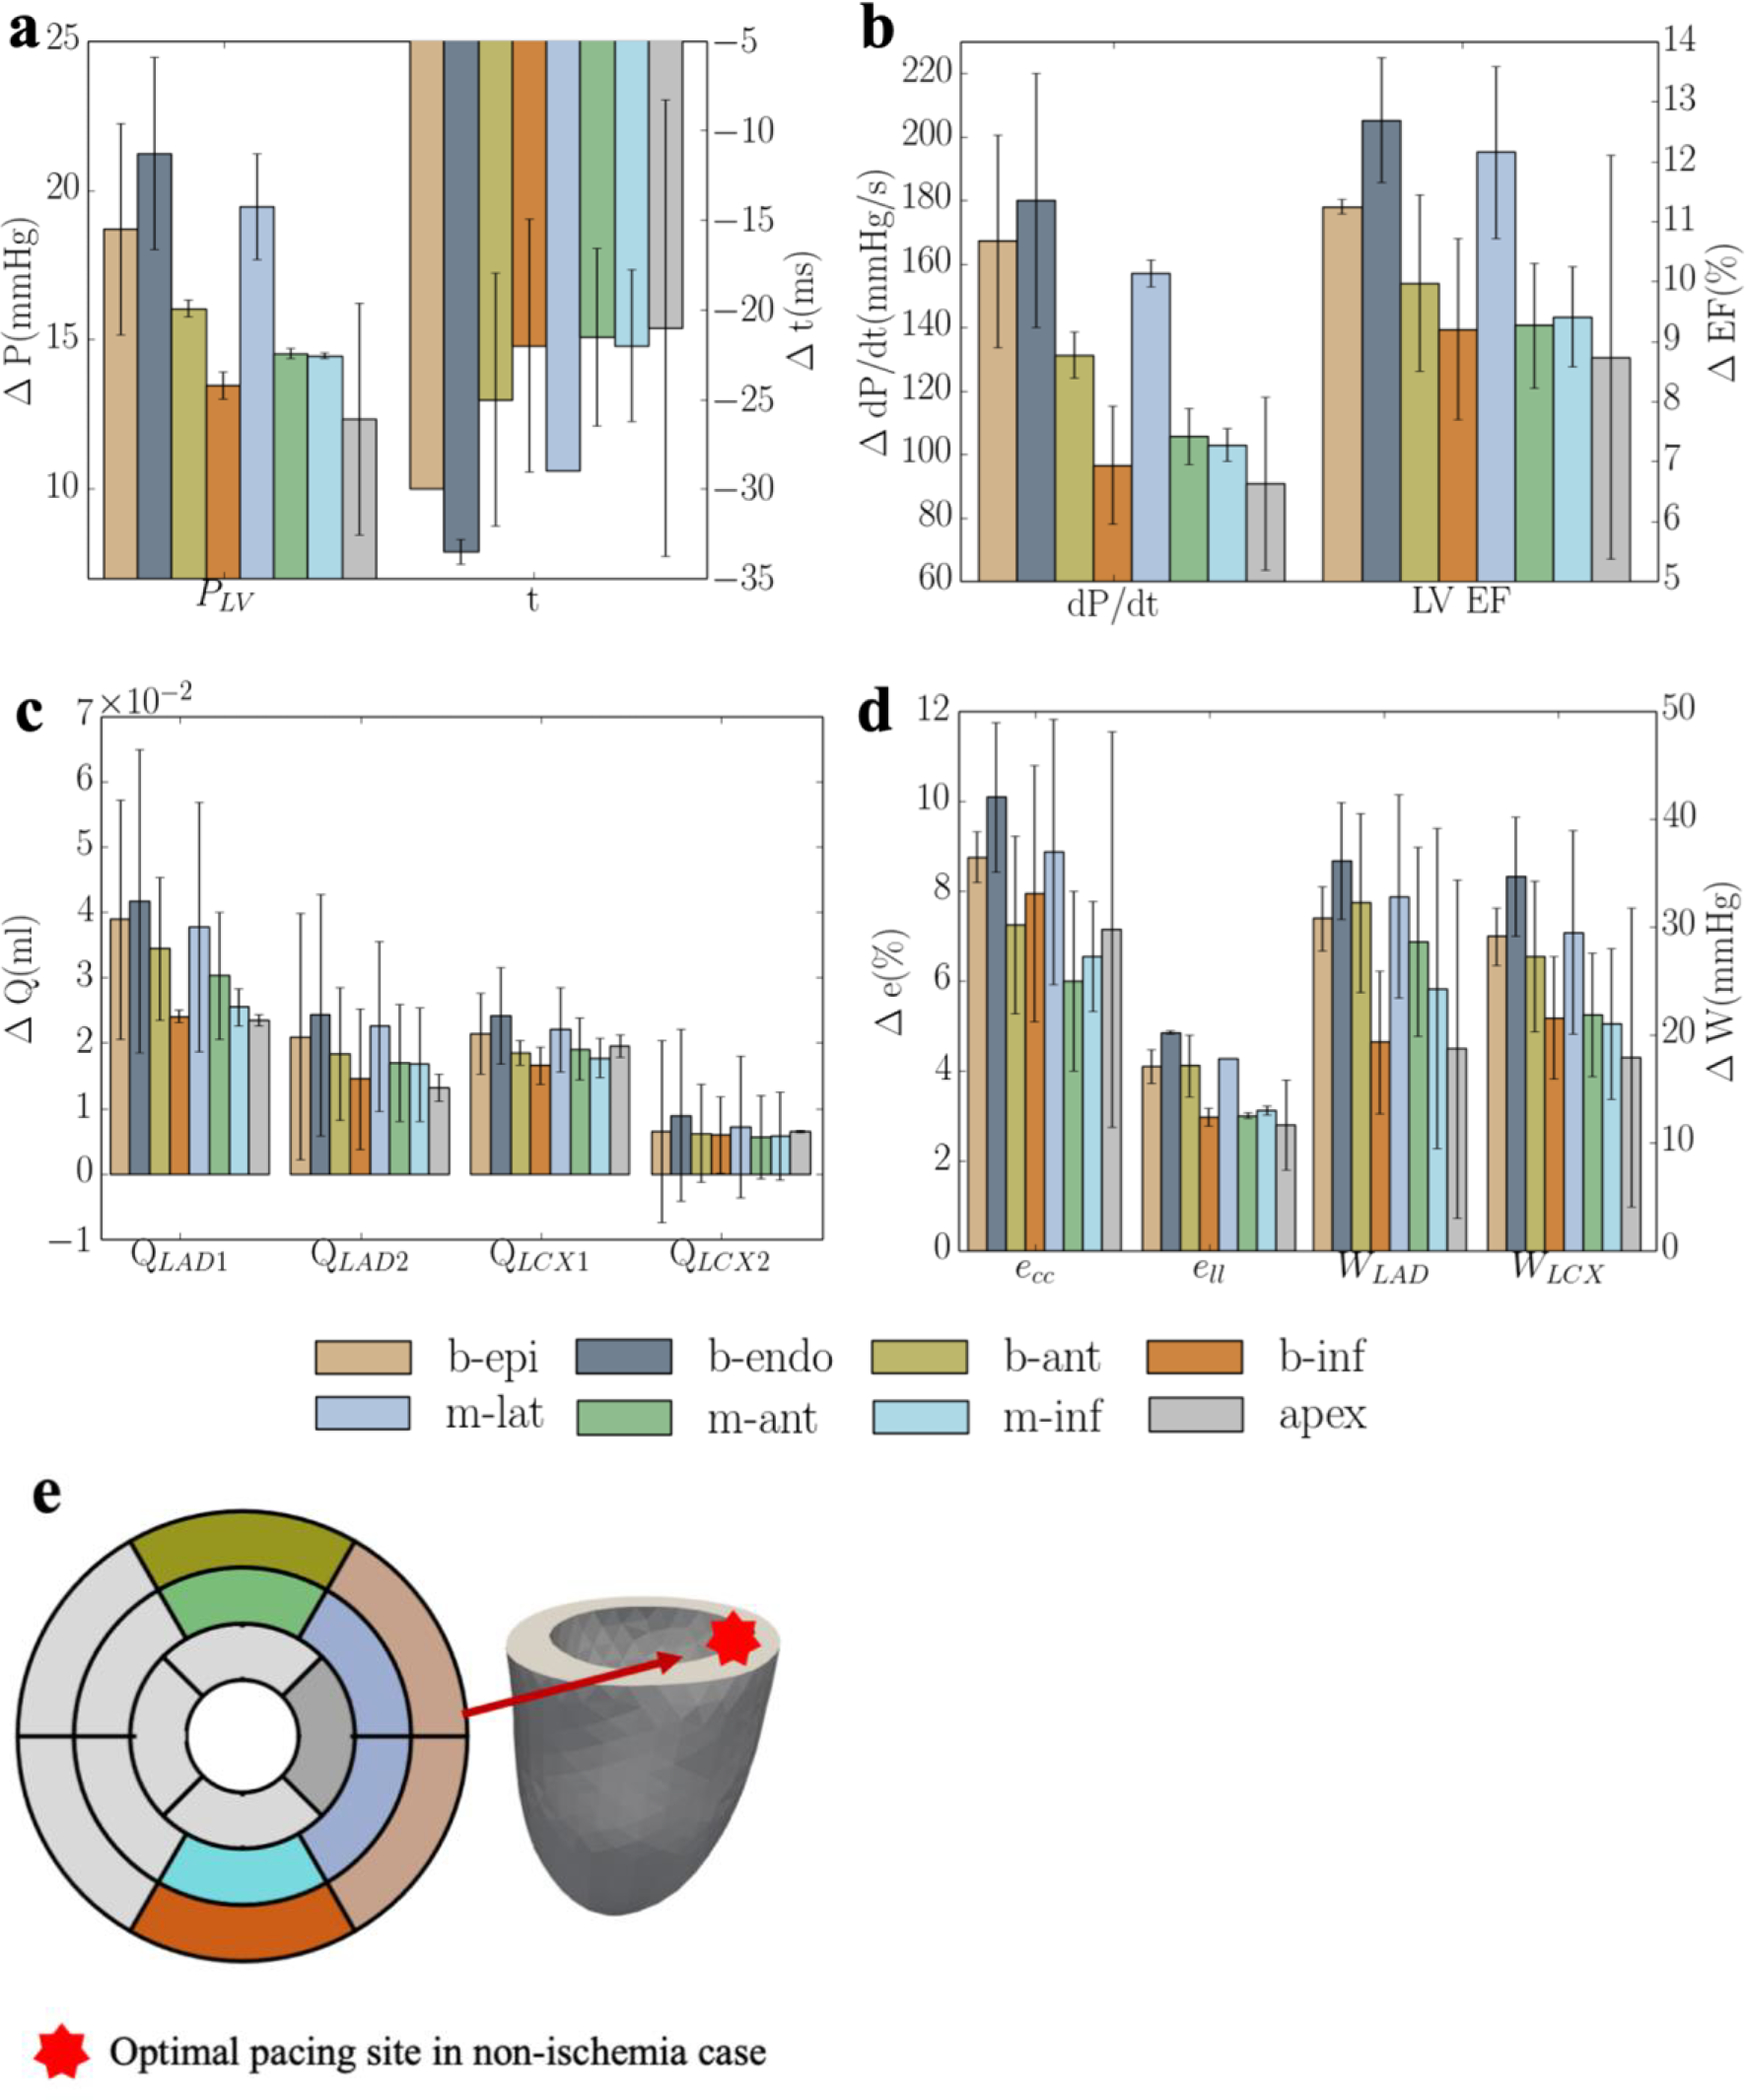
Responses of CRT at multiple pacing sites in terms of a. the peak LV pressure and IMP; b. (dP/dt)max and LV EF; c. QLAD and QLCX; d. ecc, ell, WLAD and WLCX; and “b-epi”, “b-endo”, “b-ant”, “b-inf”, “m-lat”, “m-ant” and “m-inf” denote “basal-epicardium”, “basal-endocardium”, “basal-anterior epicardium region”, “basal-inferior epicardium region”, “mid-lateral epicardium region”, “mid-anterior epicardium region”, “mid-inferior epicardium region”, respectively. Refer to Figure D4 and E1 for the responses of each swine model
Figure 4:
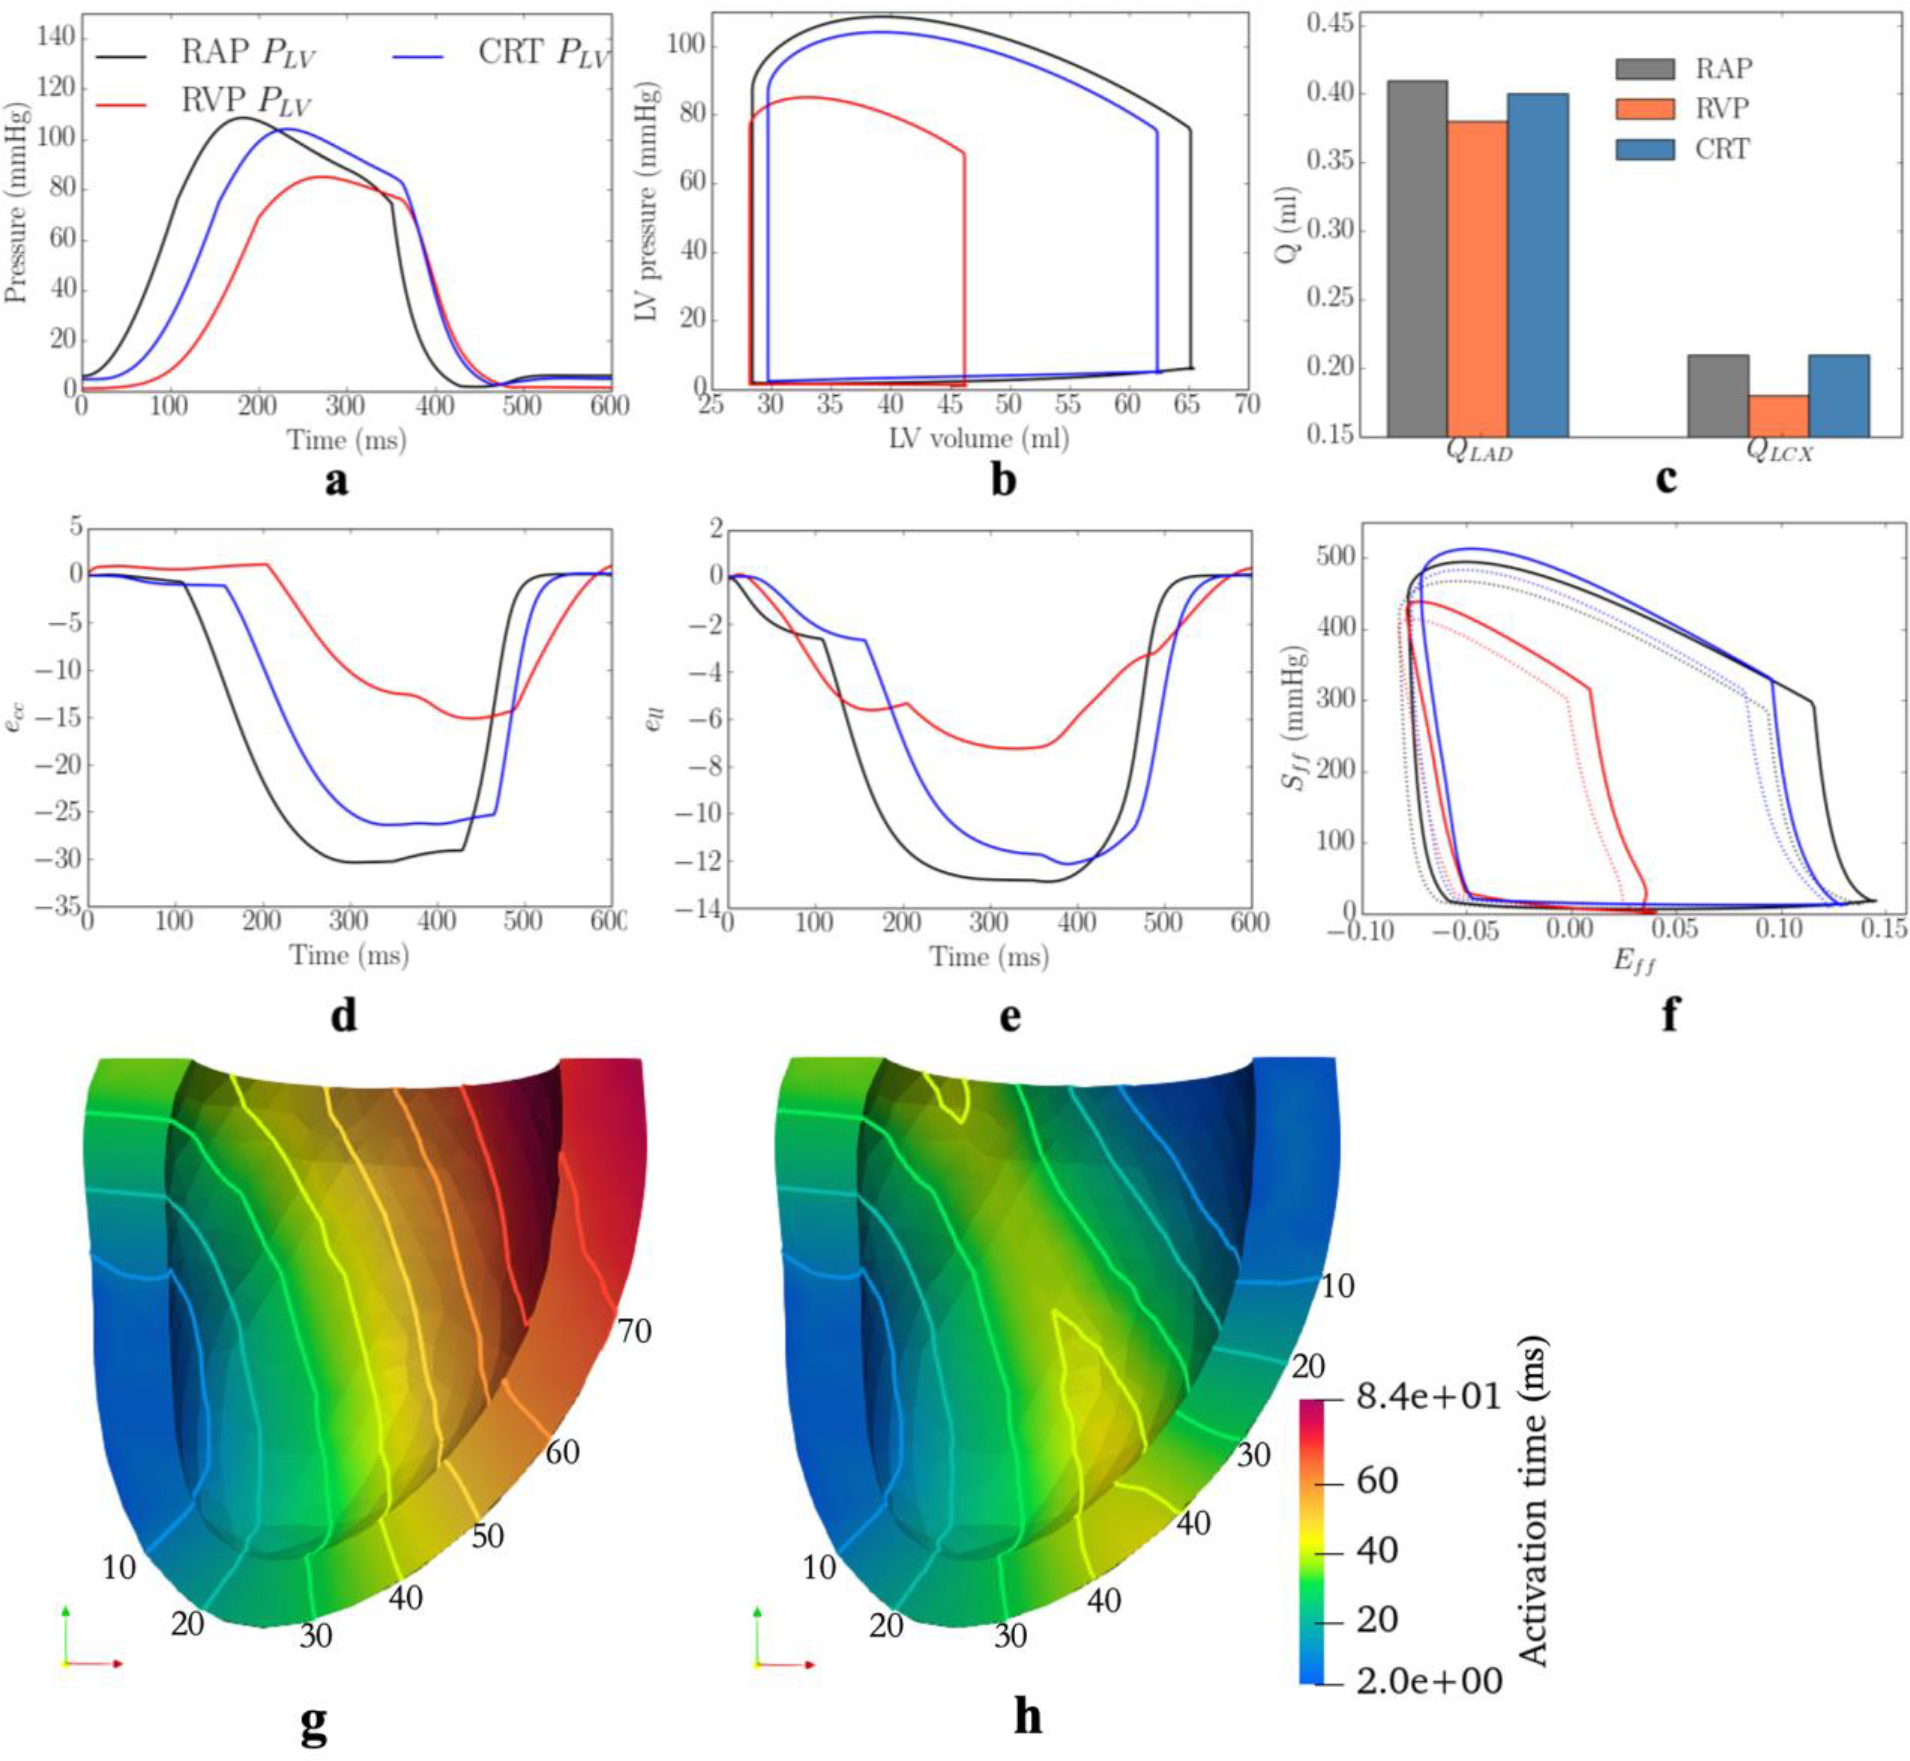
Comparison of the model predicted waveforms in terms of a. LV pressure; b. PV loop; c. total coronary flow rates in the d. ecc; e. ell; and f. Sff-Eff loop in baseline, MD, and CRT cases associated with 1 swine model. Activation pattern of the LV in g. MD; h. CRT cases. Solid lines denote isochronal lines in the activation patterns. Refer to Figure D3 for the other swine model
3.2.2. CRT response to MD with ischemia
In the presence of regional ischemia at the basal-lateral wall region (that corresponds to the optimal pacing location, b-endo, as described above when ischemia is not present), a different optimal pacing location is found among the same sampled pacing sites when total flow of the LCX2 network is reduced below a threshold. The threshold flow at which the optimal pacing location switches from the ischemic basal-lateral endocardial region to the non-ischemic mid-lateral epicardial region is at 30% of that its original value (without occlusion) (Figure 5). When flow is less than 30% of its original value, pacing at the ischemic region becomes sub-optimal as compared to pacing at a non-ischemic region (mid-lateral epicardium) in improving the peak LV pressure, (dP/dt)max, LV EF and activation time, Δt.
Figure 5:
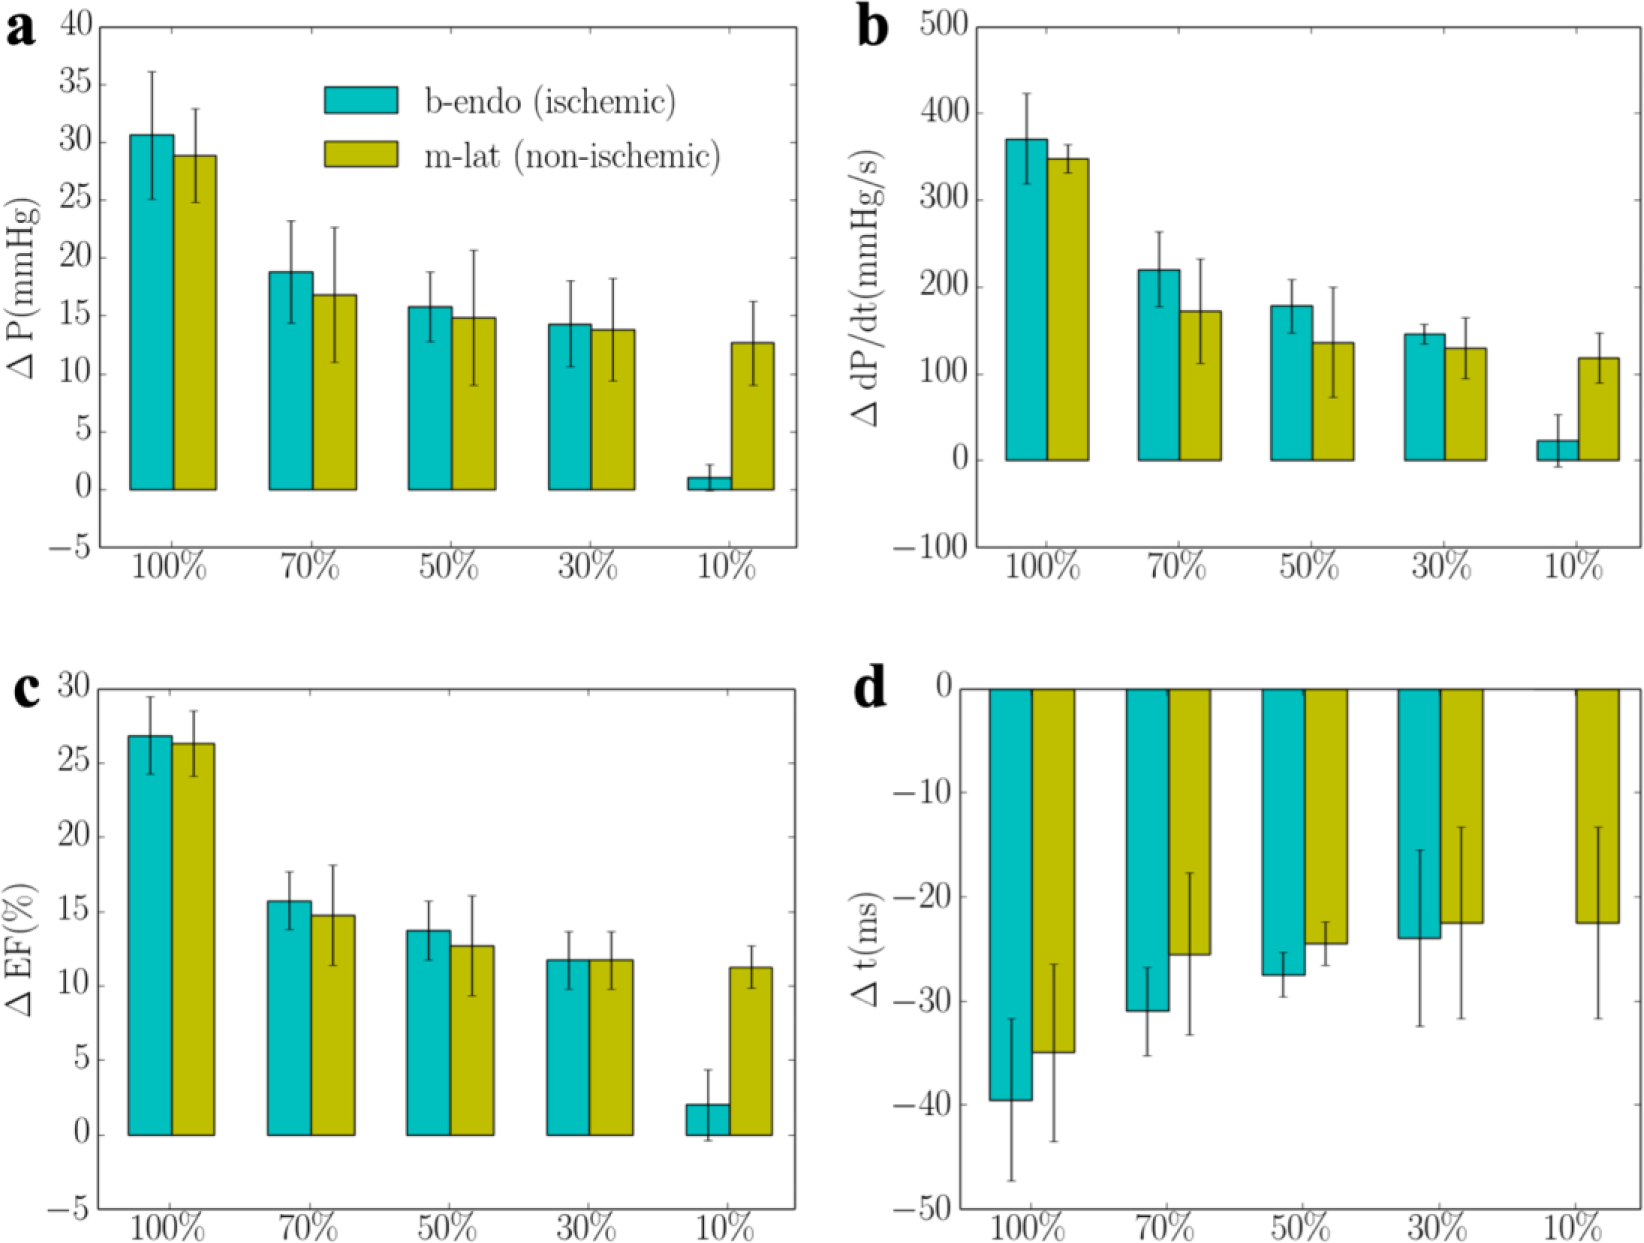
Responses of pacing at the ischemic region (b-endo) with different degrees of ischemia and non-ischemic region (m-lat) in terms of a. the peak LV pressure and IMP; b. (dp/dt)max; c. LV EF and d. activation time. “b-endo” and “m-lat” denote “basal-epicardium” and “mid-lateral epicardium region”, respectively. “%” denotes that the regional flow in the LCX2 is % of that its original value.
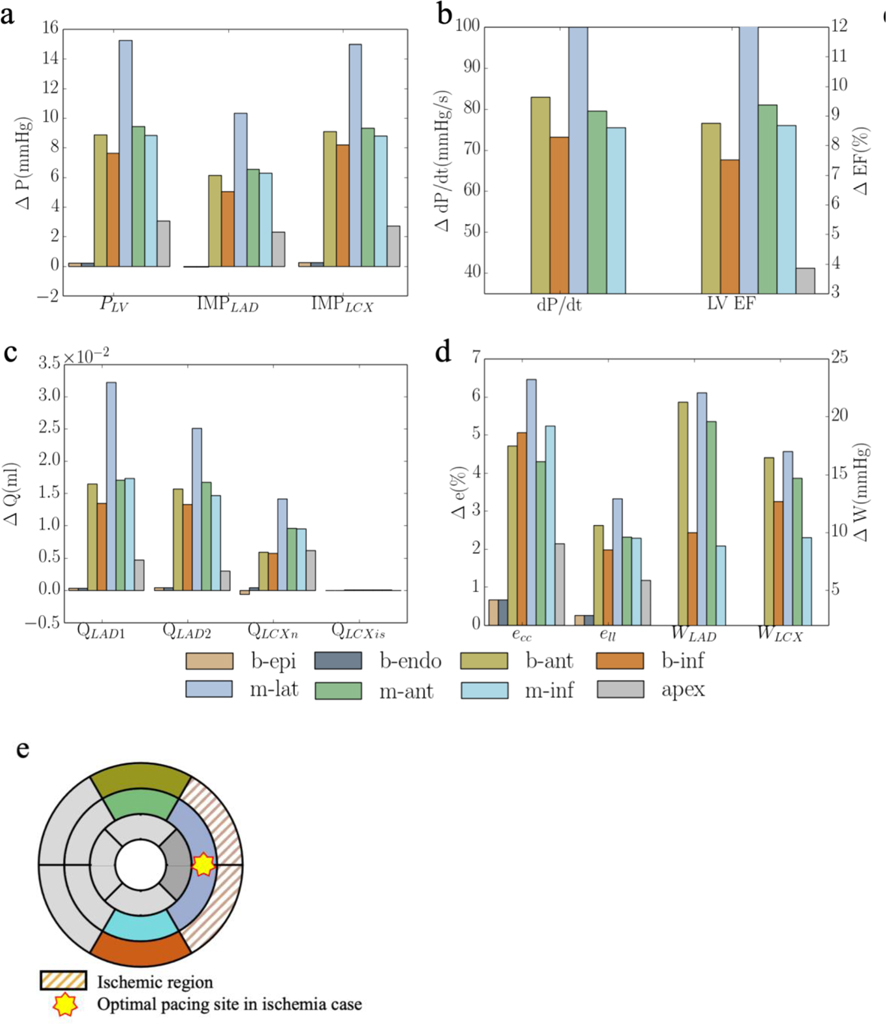
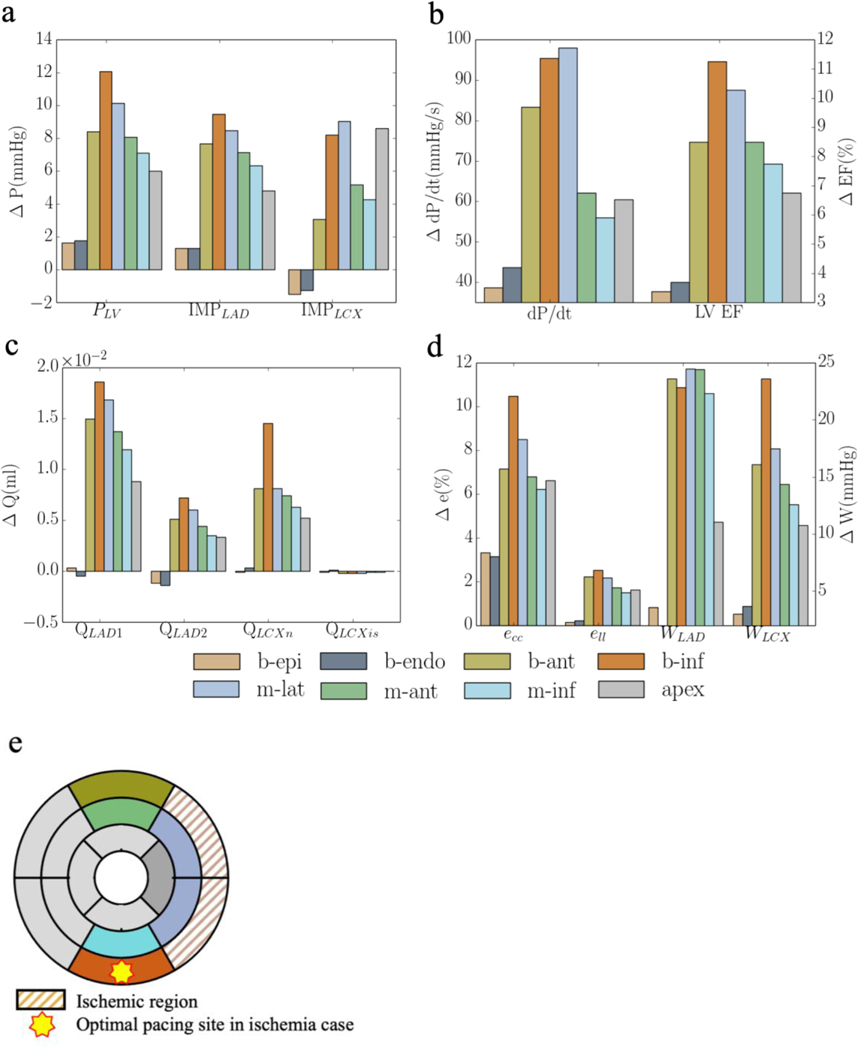
When coronary flow in LCX2 is reduced to 10% of its original value, pacing at the ischemic regions (b-endo and b-epi) elicit little responses in improving the LV function and coronary perfusion as compared to the rest of the pacing sites (Figure 6). Pacing at the epicardium of the non-ischemic mid-lateral region elicits the best improvement in peak LV pressure, LV EF, coronary flow, peak strain and myocardial work density when the responses of the 2 swine models are averaged (Figure 6). Specifically, the peak LV pressure, (dP/dt)max, LV EF, and total coronary flow in the LAD and LCX (QLAD and QLCX) are increased by 13± 4mmHg, 118± 29mmHg/s, 11±1%, (4±1)× 10−2ml and (10±4)× 10−3ml, respectively, with pacing at the mid-lateral region. While pacing at the mid-lateral region produces the best average response across the 2 swine models, we note, however, that the optimal pacing site varies between the models. The optimal pacing site for both models, nevertheless, is located at a non-ischemic region (i.e., basal-inferior epicardial region in one and mid-lateral epicardial region in the other) (Figure 6f). Compared to the case without regional ischemia, optimal pacing also produces less improvement in the peak LV pressure, (dP/dt)max, LV EF, and total coronary flow in the LAD and LCX (QLAD and QLCX) when ischemia is present. Last, a positive linear correlation between the increase in (dP/dt)max and reduction in activation time t is found in the model when tabulating these variables across different pacing sites with or without the presence of ischemia. Because of the optimal response is less when ischemia is present, the gradient of this relationship is lower with ischemia (4.35) than that without ischemia (6.92) (Figure 6e).
Figure 6:
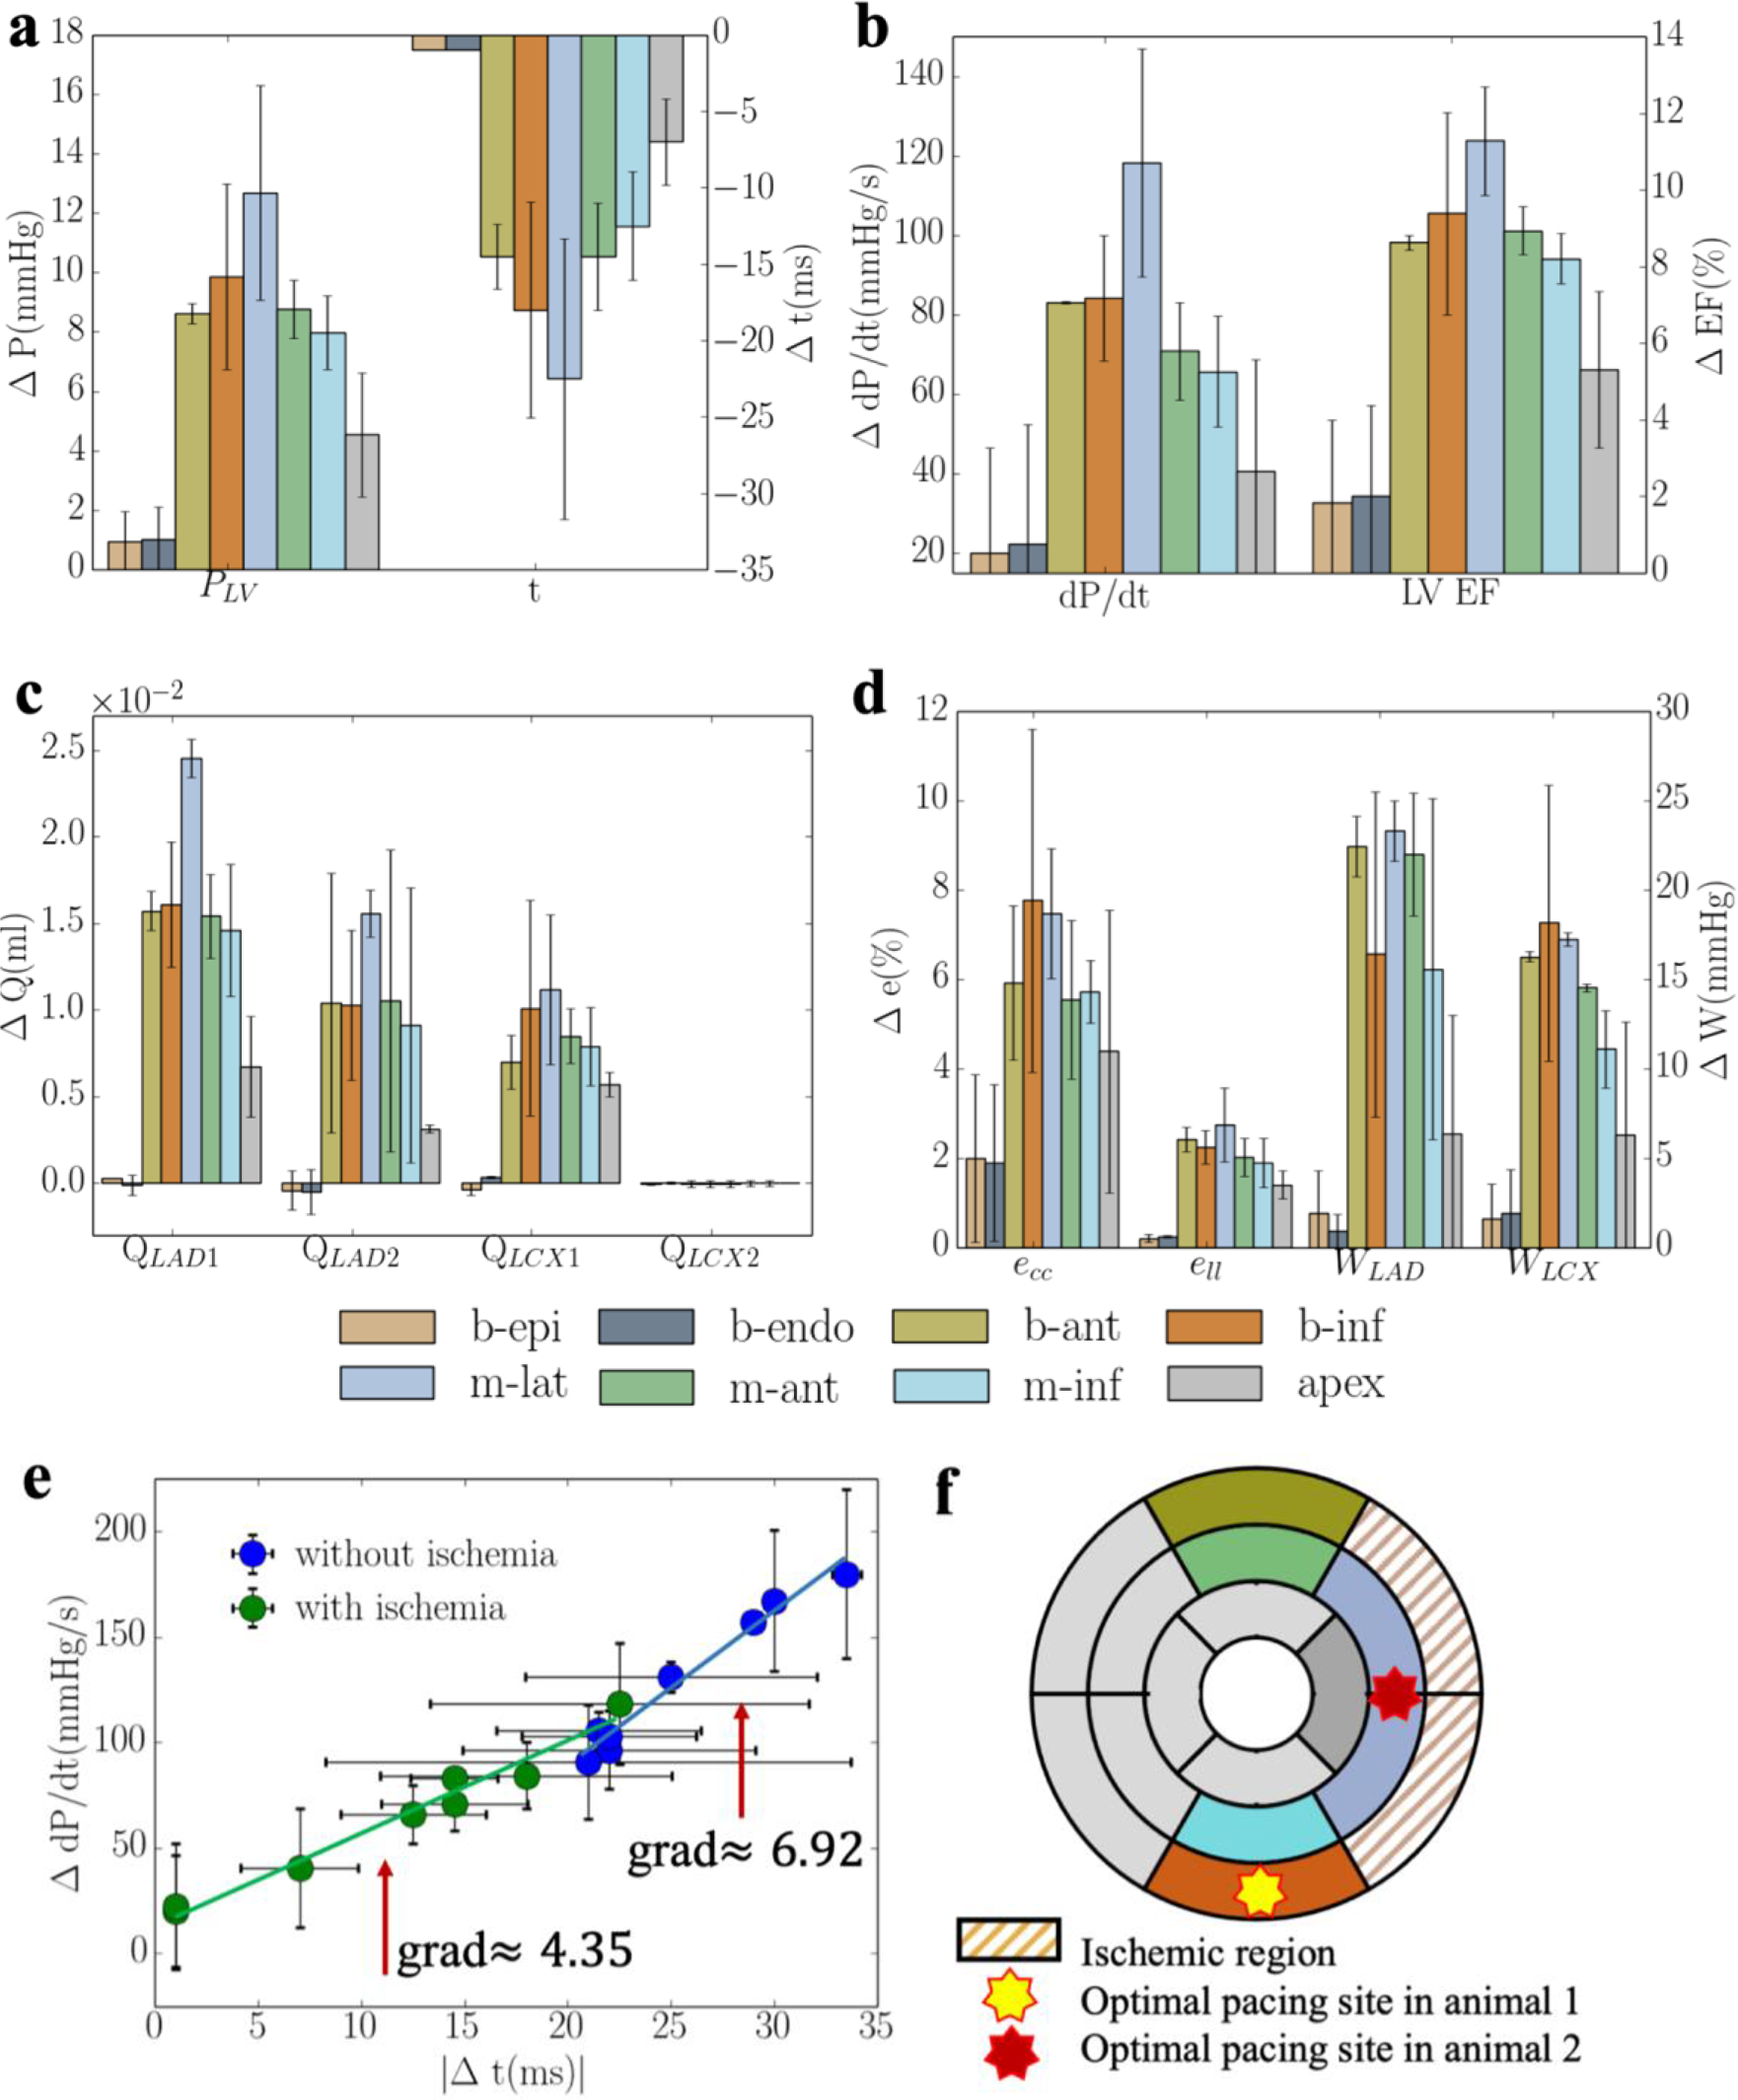
Average responses of CRT at multiple pacing sites (for 2 swine models) in terms of a. the peak LV pressure and IMP; b. (dP/dt)max and LV EF; c. QLAD and QLCX; and d. ecc, ell, WLAD and WLCX. “b-epi”, “b-endo”, “b-ant”, “b-inf”, “m-lat”, “m-ant” and “m-inf” denote “basal-epicardium”, “basal-endocardium”, “basal-anterior epicardium region”, “basal-inferior epicardium region”, “mid-lateral epicardium region”, “mid-anterior epicardium region”, “mid-inferior epicardium region”, respectively. Refer to Figure D2 and E2 for responses associated with individual swine model.
4. Discussion
Based on the model predictions, the major finding is that the response of CRT in improving LV function (including LV volume, deformation and work) is determined by the location of the pacing site and the degree of coronary perfusion at that site. First, we show that the simultaneous decrease in peak LV pressure, (dP/dt)max, LV EF, total coronary flow in the LAD and LCX territories seen in RV pacing swine model with MD can be reproduced in the model by a prescribed contractility-flow relationship and preload-activation time relationship. The latter relationship is to account for a change in preload due to atrioventricular dyssynchrony. Second, without the presence of ischemia, pacing at the basal-lateral endocardial region produces the shortest activation time of the LV that is associated with the best improvement in LV function as indexed by the peak LV pressure and (dP/dt)max. Third, in the presence of ischemia with perfusion dropping below 30% of its original value, pacing at the ischemic region elicits little favorable response and the optimal pacing site is shifted to a non-ischemic region. Fourth, the optimal pacing site is associated with one that minimizes the LV activation time.
To the best of our knowledge, this is the first study where a computational model coupling cardiac electromechanics and coronary perfusion is applied to optimize the acute CRT response. Calibrated based on animal-specific measurements of coronary perfusion and LV function, the model also considers the coupling between contractility and myocardial perfusion in addition to other interactions between LV and coronary perfusion (i.e., IMP and perfusion pressure). Cardiac electromechanics models have been developed in previous studies to optimize CRT and investigate the relationship between LV pacing site and changes in cardiac function such as acute hemodynamic response [29,63,64], stroke work [29], electromechanical delay [27], LV electrical activation time [63]. These models were developed based on canine [27], idealized human [29], patient-specific [63,64] ventricular geometries. A personalized electromechanics model using patient specific estimates of myocardial conductivity and contractility parameters from cardiac MRI was also developed to optimize CRT [26]. None of these studies, however, have considered the coupling of coronary perfusion with cardiac electromechanics. We address this limitation in this study. Based on the electromechanics-perfusion framework calibrated with animal-specific measurements of coronary flow and LV hemodynamics, we show that MD and CRT affect regional coronary perfusion and the corresponding myocardial contractility, which in turn, further affects the IMP and perfusion pressure that cause further changes to coronary perfusion in a feedback loop. The coupling of coronary perfusion and LV mechanics in this computational framework can provide important insights to the underlying mechanisms that affect CRT responses as we now elaborate.
Effects of pacing sites on CRT response
Without the presence of ischemia (defined as regions with low coronary flow), our model predicts that the basal-lateral endocardial region is the optimal pacing site that produces the greatest reduction in activation time (i.e., Δt = 34ms) and elicits the greatest improvement in LV function (Figure 3a). This result is largely in agreement with clinical studies showing that the optimal pacing site in most heart failure patients with MD is the one at the latest activated region, that best correct the activation pattern, and is usually associated with the shortest activation time [5,65,66]. Specifically, Zanon et al. [65] showed in a clinical study that there is an inverse linear correlation between the paced QRS duration (related to the activation time) and (dP/dt)max, that is consistent with the linear relationship between changes in (dP/dt)max and activation time as found here (Figure 6e). Positive linear correlation between improvement in (dP/dt)max and reduction in activation time t has also been reported [29,67,68]. Correspondingly, Zanon et al. proposed that the optimal pacing site should be located at the latest activated region that is also consistent with our findings. In relation to this study, it is also shown that pacing at the apical region is associated with an unfavorable clinical outcome mostly due to its proximity to the RV lead that, in principle, will only have little effect in reducing the activation time [5]. This result is also consistent with our findings that pacing at the LV apex produces the least improvement in LV function (Figure 3) [5]. In terms of chronic response, Gold et al. also showed that left ventricular electrical delay, as measured by the QLV interval, at the site of LV pacing was significantly and independently associated with reverse remodeling and improved outcome with CRT [66]. Besides clinical studies, our findings are also consistent with that from a computational study based on the CircAdapt modeling framework, which showed that in LBBB without ischemia, pacing at the LV free wall region most distant from the septum produces the most improvement in LV function as indexed by stroke volume [22].
Between pacing at the epicardial and endocardial basal-lateral wall regions, our simulation results show that pacing at the latter results in a shorter activation time (50ms vs. 54ms). This result is consistent with those found in computational studies, which show that the hemodynamic function is increased more, and the activation time is shorter when pacing at the endocardium than at the epicardium [13,69]. Clinical studies have also shown that LV endocardial pacing reduces QRS duration and increases LV (dP/dt)max more than pacing at the epicardium [14].
Model predictions of the magnitude of optimal CRT responses with an improvement of (dP/dt)max by 20% when pacing at the basal-lateral wall (Figure 3b) is also comparable to those found in the clinical studies, where optimal pacing placement has been found to be associated with the greatest improvement in (dP/dt)max by 12%−23% in CRT [70,71].
Effects of coronary perfusion on CRT response
With the presence of ischemia caused by a reduction in LCX2 coronary flow to the basal-lateral wall region (Figure 1), our model predicts that the optimal pacing site in CRT switches from the basal-endocardial region to the mid-lateral epicardial region (non-ischemic region) when the flow falls below 30% of its original value (Figure 5). Below that 30% perfusion threshold, pacing at the ischemic (basal-lateral) region elicit only minimal favorable response. This result is consistent with an experimental canine study, which shows that pacing in the ischemic region (induced at the lateral wall region) produces a smaller response in improving (dP/dt)max by 25% when myocardial perfusion in the LCX is less than 66% of its original value[4]. This magnitude is comparable to that found in our model, where the improvement in (dP/dt)max is reduced by 41% when perfusion level is at 70% of its original value (Figure 5b).
The improvement associated with optimal pacing is also less with ischemia when compared to that without ischemia (Figure 3 and 6). Our model predicts that the improvement in (dP/dt)max was reduced from 20% to 4% with optimal pacing when regional flow is reduced by 90% in the LCX2 network (Figure 3b and 6b), which is comparable to previous studies. For example, CRT response is found to be reduced in patients with a posterolateral scar (that impairs contractility) [23] and it is estimated from computer modeling that the improvement in (dP/dt)max decrease from 85% to 21% when a severe scar is present [23]. CRT response is also found to be negatively correlated with scar size [72]. That study, however, does not consider the interaction between coronary perfusion and ventricular mechanics. In the presence of ischemia, our results suggest that below a perfusion threshold, the optimal pacing site resides in a non-ischemic region that can vary between animals (though on average, it is located at the mid-lateral wall region) (Figure 6f). This variation may be attributed to local anatomic variations [73]. Moreover, our result also shows that the positive linear correlation between the increase in (dP/dt)max and reduction in activation time t persists in the presence of ischemia, albeit with a lower gradient due to the reduction in CRT response (Figure 6e). As such, the optimal pacing site still resides at a location that minimizes the activation time of the LV in the presence of ischemia. Our simulation results showing the departure of the best pacing site (with the most optimal activation time) away from the basal lateral region in the presence ischemia may explain, in part, the less favorable outcome of CRT in ischemic HF population. This is because while it is recommended that patients be treated for ischemia either medically or with revascularization prior to CRT [74], a sizable subset of ischemic HF patients either have incomplete revascularization or are deemed sub-optimal candidates for revascularization [75] (e.g., in no-option patients who have refractory angina [76]). As such, a clinically applicable individualized and patient-specific computational model that considers both cardiac electromechanics and perfusion may help optimize CRT so that more patients can benefit from this life-saving therapy.
Limitations
There are some limitations associated with this study. First, coronary flow regulation is not considered and so, the model is only able to predict the effects of CRT on coronary flow under maximally dilated condition. As such, the model results are applicable when coronary flow reserve is close to 1. Second, transmural heterogeneity in coronary flow (i.e., lower passive coronary flow in the subendocardium) and the presence of subendocardial ischemia is not considered here. Third, RV is not considered in this modeling framework and the model does not account for inter-ventricular interactions. We note, nevertheless, that previous computational models [29,77] on MD and CRT are also based on LV only. Fourth, the number of swine model is 2 which may not be sufficient for statistical analysis. Fifth, due to a limited experimental data, only a linear contractility-flow relationship is prescribed in this work. Lastly, we did not consider the effects of remodeling (of the coronary vasculature and heart) that occur in chronic heart failure. We have only considered the effects of CRT on acute ischemia as a first step in coupling cardiac electromechanics and coronary perfusion. Future work will consider remodeling and the effects of CRT on chronic ischemia that is more clinically relevant to CRT patients.
5. Conclusion
In this study, we developed a coupled electromechanics-perfusion computational modeling framework that is calibrated with experimental measurements from a swine model measured under RA and RV pacing. The model was then applied to simulate the effects on LV mechanics and degree of coronary perfusion from pacing at different sites in CRT. The simulation results show that CRT response is affected by the degree of coronary perfusion, and the optimal pacing site is located at a non-ischemic region that minimizes the LV activation time. This model can be translated to optimize CRT offline before the procedure in the clinic with non-invasive estimation of LV geometry, coronary flow, systolic and diastolic LV pressure from 3D Echo, transthoracic Doppler echocardiography [78], blood pressure measurements [79] and Doppler trans-mitral flow velocity [80], respectively. Since CRT implantation involves some form of catherization for lead placement [81], quantities required for calibrating the model can also be acquired during implantation and applied to optimize the treatment in real-time with the construction of a reduced-order model [82] from the computational modeling framework. Given that implanting of two LV pacing leads are shown recently to improve acute hemodynamic response with respect to single-site CRT clinically [83], the model can also be readily extended to simulate dual or multiple-site pacing by including more stimulation sites in future studies. Last, the model can also be extended to consider the propagation of electrical impulses in the Purkinje fiber network and the effects of ischemia on the conduction velocity of the Purkinje cells to simulate new conduction system pacing (CSP) therapies [84]. In summary, this model-based approach is promising to be applied to chronic study for patients.
Highlights.
A novel electromechanics-perfusion computational model based on animal-specific geometry and measurements is developed.
The relationship between contractility and myocardial perfusion is considered.
The calibrated model is applied to optimize cardiac resynchronization therapy (CRT) response.
The effects of pacing site and degree of coronary perfusion on CRT response are investigated.
Acknowledgment
This work was supported by the National Institute of Health (R01 HL134841).
Appendix A. Closed loop systemic circulatory model
The governing equations of the closed loop system are given as follows,
| (1) |
| (2) |
| (3) |
| (4) |
| (5) |
where VLA, VLV, Va,p, Va,d and Vven are the volumes of the five compartments with the subscripts denoting the LA, LV, proximal and distal peripheral arteries and peripheral veins, respectively.
Flow rates in the aortic, proximal and distal peripheral arteries, venous and mitral valve that denoted by qao, qa,p, qa,d, qven and qmv, are determined by each segment’s resistance Rao, Ra,p, Ra,d, Rven and Rmv, and the pressure difference between the two connecting storage compartments as
| (6) |
| (7) |
| (8) |
| (9) |
| (10) |
where PLV, Pa,p, Pa,d, Pven and PLA are the cavity pressures, respectively. In Eq. (3) and (5), qLAD,i and qLCX,i are the flow rates associated with coronary networks of the LAD and LCX at different location i. Pressures in the storage compartments representing the peripheral (proximal and distal) arterial and venous networks are given as
| (11) |
| (12) |
| (13) |
where (Va,p0, Va,d0, Vven0) are the prescribed (arteries and veins) resting volumes, and (Ca,p, Ca,d, Cven) are the prescribed total (arteries and veins) compliances.
Time-varying elastance model of the left atrium
The pumping characteristics of the LA is represented by a time-varying elastance model [30]. The LA’s instantaneous pressure, PLA, is related to the instantaneous volume, VLA, by a time-varying elastance function, eLA(t) given as fellows
| (14) |
where
| (15) |
| (16) |
| (17) |
In Eq. (14), Pes and Ped are the end-systolic and end-diastolic pressures, respectively. Ees,LA is the maximal chamber elastance of LA, VLA0 is the volume at zero end-systolic pressure, and both ALA and BLA are parameters defining the end-diastolic pressure volume relationship of the LA. In Eq. (17), Tmax,LA is the time to end systole and τLA is the relaxation time constant.
Appendix B. Coronary flow
Flow in each vessel of the coronary network is modeled by a non-linear three-element Windkessel electrical representation. Applying mass conservation at the Windkessel’s internal (‘mid’) node in each single vessel i results in the following ordinary differential equation (ODE)
| (1) |
where is the intramyocardial (extravascular) pressure (IMP) imposed on the vessel. In Eq. (1), R1 and R2 are the resistances assumed to be the same and given as
| (2) |
and C is the capacitor as
| (3) |
In Eq. (2) and (3), L and R(t) are the length and radius of a single vessel, and μ is a blood viscosity, which is assumed to be a constant to simplify the flow analysis [85] (Figure B1a). Under passive conditions, mechanical behavior of the vessel consists of the intrinsic passive mechanical behavior. As such, the vessel’s radius is a function of the instantaneous trans-vascular pressure ΔP at each time point of a cardiac cycle given by
| (4) |
where Ap and Bp are, respectively, the asymptotical highest and lowest radii corresponding to the highest positive and lowest negative trans-vascular pressure, φp is the trans-vascular pressure according to the mean radii Ap and Bp, and Cp is the passive response bandwidth. Under passive condition, Rp in Eq. (4) is used to calculated resistances and capacitance in Eq. (2)–(3). Flow in a single vessel is governed by the Poiseuille relation as
| (5) |
where Q(t) is the flow rate and (Pin(t) − Pout(t)) is the pressure difference between the vessel’s inlet and outlet. Mass conservation is satisfied in the coronary network at each nodal position connecting the vessels i.e.,
| (6) |
where Qi is the flow in each vessel and j is the number of vessels connected to the node (e.g., j = 3 for a bifurcation and j = 4 for a trifurcation) (Figure B1b). As the resistance and capacitance are not constants and depend on the flow conditions, the resultant system of ODEs with of the vessels as the unknowns is non-linear. The system of ODEs is solved using the backward differentiation formulas method with pressure at inlet and outlets prescribed. The flow rate Q(t) in the source vessel and the sum of the flow rate Q(t) in all terminal vessels are used as qcor for each vessel network, respectively. For the parameter values used in the flow analysis Eqs. (1)–(6), refer to a previous work [50].
Figure B1:
a. Electrical non-linear analog of the segment lumped model; b. Single bifurcation three-vessel network.
Appendix C. Analysis of strain and myocardial work density
Results from the computational framework were obtained from each simulation case. Following Kerckhoffs et al. [77,86], local myofiber work density in a cardiac cycle is given by the area of the myofiber stress-strain loop i.e.,
| (1) |
where Sff and Eff are PK2 fiber stress and Green-Lagrange fiber strain, respectively. The local myofiber stress-strain loop area represents the net work performed by cells locally in the tissue [87]. As such, there is a basis for using area of the myofiber stress-strain loop as an index for local work density performed by the cell.
Regional myocardial work density Wf was obtained based on the values at around 10.000 randomly distributed locations at the septum and LV free wall. The number of points was determined to be sufficient for convergence (i.e., the distributions do not change with the inclusion of more points). Normal (Euler-Almansi) strains in the circumferential (ecc) and longitudinal (ell) directions were computed with end-diastole serving as the reference configuration. Details of strain calculation can be found in[59]. Total coronary flow from each coronary microvascular network at septum and LV free wall was computed by integrating the flow rate qLADi,LCXi(t) over 930 the cardiac cycle.
Appendix D
Results for one swine model are given in Appendix D. The comparison between experimental measurements under RA pacing and model predictions in baseline case in terms of the LV pressure and volume waveforms, LV PV loop and total coronary flow are shown in Figure D1. The comparison between experimental measurements under RV pacing and model predictions in MD case in terms of the LV pressure and volume waveforms, LV PV loop and total coronary flow are shown in Figure D2. The comparison of model predicted waveforms in baseline, MD and CRT cases is shown in Figure D3. Responses of CRT at multiple pacing sites to MD without ischemia are shown in Figure D4. Responses of CRT at multiple pacing sites to MD with ischemia are shown in Figure D5.
Figure D1:
Comparison of the model predicted (base) and experimentally measured (RAP) waveforms in baseline case in terms of the a. LV pressure; b. LV volume; c. LV PV loop; and d. total coronary flow in the LAD and LCX.
Figure D2:
Comparison of the model predicted (MD) and experimentally measured (RVP) waveforms in mechanical dyssynchrony in terms of the a. LV pressure; b. LV volume; c. LV PV loop; and d. total coronary flow in the LAD and LCX.
Figure D3:
Comparison of the model predicted waveforms in terms of the a. LV pressure; b. PV loop; c. total coronary flow rates in the d. ecc; e. ell; and f. Sff-Eff loop.
Figure D4:
Responses of CRT at multiple pacing sites in terms of a. the peak LV pressure and IMP; b. (dP/dt)max and LV EF; c. QLAD and QLCX; and d. ecc, ell, WLAD and WLCX. “b-epi”, “b-endo”, “b-ant”, “b-inf”, “m-lat”, “m-ant” and “m-inf” denote “basal-epicardium”, “basal-endocardium”, “basal-anterior epicardium region”, “basal-inferior epicardium region”, “mid-lateral epicardium region”, “mid-anterior epicardium region”, “mid-inferior epicardium region”, respectively.
Figure D5:
Responses of CRT at multiple pacing sites in terms of a. the peak LV pressure and IMP; b. (dP/dt)max and LV EF; c. QLAD and QLCX; and d. ecc, ell, WLAD and WLCX. “b-epi”, “b-endo”, “b-ant”, “b-inf”, “m-lat”, “m-ant” and “m-inf” denote “basal-epicardium”, “basal-endocardium”, “basal-anterior epicardium region”, “basal-inferior epicardium region”, “mid-lateral epicardium region”, “mid-anterior epicardium region”, “mid-inferior epicardium region”, respectively.
Appendix E
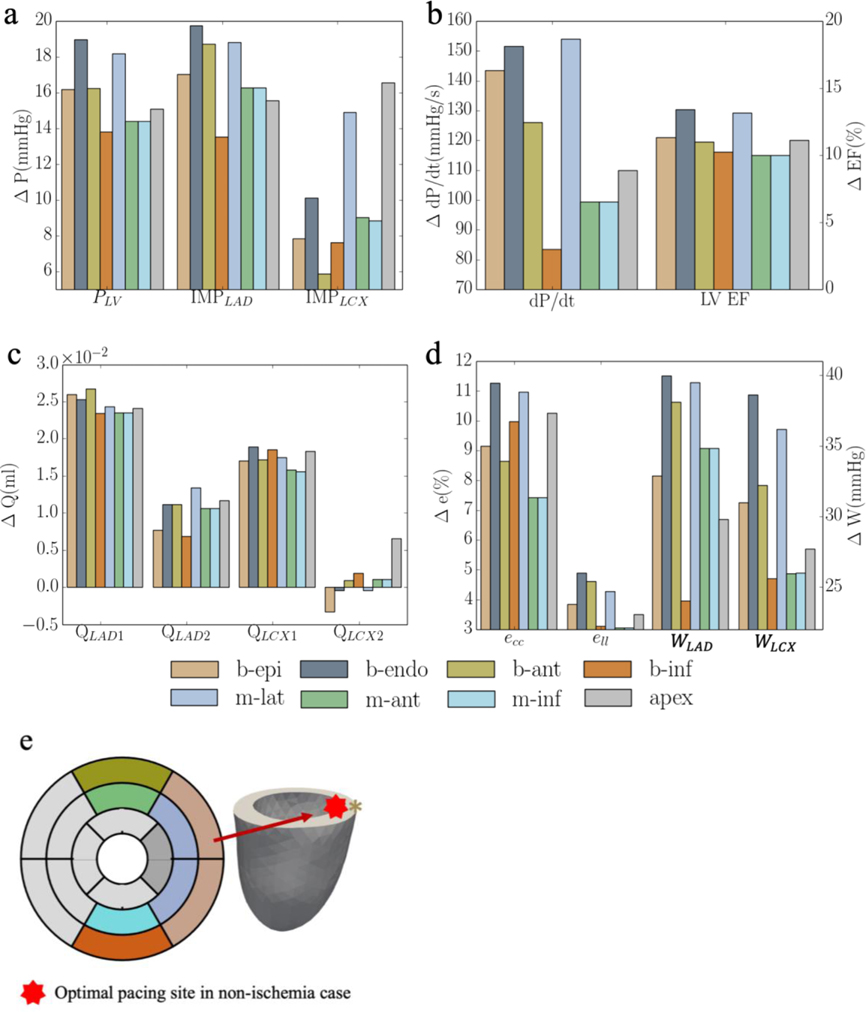
Results for the other swine model are given in Appendix E. Responses of CRT at multiple pacing sites to MD without ischemia are shown in Figure E1. Responses of CRT at multiple pacing sites to MD with ischemia are shown in Figure E2.
Figure E1:
Responses of CRT at multiple pacing sites in terms of a. the peak LV pressure and IMP; b. (dP/dt)max and LV EF; c. QLAD and QLCX; d. ecc, ell, WLAD and WLCX; and “b-epi”, “b-endo”, “b-ant”, “b-inf”, “m-lat”, “m-ant” and “m-inf” denote “basal-epicardium”, “basal-endocardium”, “basal-anterior epicardium region”, “basal-inferior epicardium region”, “mid-lateral epicardium region”, “mid-anterior epicardium region”, “mid-inferior epicardium region”, respectively.
Figure E2:
Responses of CRT at multiple pacing sites in terms of a. the peak LV pressure and IMP; b. (dP/dt)max and LV EF; c. QLAD and QLCX; and d. ecc, ell, WLAD and WLCX. “b-epi”, “b-endo”, “b-ant”, “b-inf”, “m-lat”, “m-ant” and “m-inf” denote “basal-epicardium”, “basal-endocardium”, “basal-anterior epicardium region”, “basal-inferior epicardium region”, “mid-lateral epicardium region”, “mid-anterior epicardium region”, “mid-inferior epicardium region”, respectively.
Footnotes
Declaration of interests
The authors declare that they have no known competing financial interests or personal relationships that could have appeared to influence the work reported in this paper.
Publisher's Disclaimer: This is a PDF file of an unedited manuscript that has been accepted for publication. As a service to our customers we are providing this early version of the manuscript. The manuscript will undergo copyediting, typesetting, and review of the resulting proof before it is published in its final form. Please note that during the production process errors may be discovered which could affect the content, and all legal disclaimers that apply to the journal pertain.
References
- [1].Albatat M, Arevalo H, Bergsland J, Strøm V, Balasingham I, Odland HH, Optimal pacing sites in cardiac resynchronization by left ventricular activation front analysis, Comput. Biol. Med. 128 (2021). 10.1016/j.compbiomed.2020.104159. [DOI] [PubMed] [Google Scholar]
- [2].Morgan JM, Delgado V, Lead positioning for cardiac resynchronization therapy: techniques and priorities., Europace 11 Suppl 5 (2009) 22–28. 10.1093/europace/eup306. [DOI] [PubMed] [Google Scholar]
- [3].Illiam W, Braham A, Estby M, Isher F, Ndrew M, Mith S, Avid MD, Al E, Cardiac resynchronization in chronic heart failure, N. Engl. J. Med. 346 (2002) 305–310. [DOI] [PubMed] [Google Scholar]
- [4].Svendsen M, Prinzen FW, Das MK, Berwick Z, Rybka M, Tune JD, Combs W, Berbari EJ, Kassab GS, Bi-ventricular pacing improves pump function only with adequate myocardial perfusion in canine hearts with pseudo-left bundle branch block., Exp. Biol. Med. (Maywood). 237 (2012) 644–51. 10.1258/ebm.2012.012023. [DOI] [PubMed] [Google Scholar]
- [5].Singh JP, Klein HU, Huang DT, Reek S, Kuniss M, Quesada A, Barsheshet A, Cannom D, Goldenberg I, McNitt S, Daubert JP, Zareba W, Moss AJ, Left ventricular lead position and clinical outcome in the multicenter automatic defibrillator implantation trial-cardiac resynchronization therapy (MADIT-CRT) trial, Circulation. 123 (2011) 1159–1166. 10.1161/CIRCULATIONAHA.110.000646. [DOI] [PubMed] [Google Scholar]
- [6].Saxon LA, Olshansky B, Volosin K, Steinberg JS, Lee BK, Tomassoni G, Guarnieri T, Rao A, Yong P, Galle E, Leigh J, Ecklund F, Bristow MR, Influence of left ventricular lead location on outcomes in the COMPANION study, J. Cardiovasc. Electrophysiol. 20 (2009) 764–768. 10.1111/j.1540-8167.2009.01444.x. [DOI] [PubMed] [Google Scholar]
- [7].Butter C, Auricchio A, Stellbrink C, Schlegl M, Fleck E, Hörsch W, Huvelle E, Ding J, Kramer A, Should stimulation site be tailored in the individual heart failure patient?, Am. J. Cardiol 86 (2000) K144–K151. 10.1016/S0002-9149(00)01385-0. [DOI] [PubMed] [Google Scholar]
- [8].Helm RH, Byrne M, Helm PA, Daya SK, Osman NF, Tunin R, Halperin HR, Berger RD, Kass DA, Lardo AC, Three-dimensional mapping of optimal left ventricular pacing site for cardiac resynchronization, Circulation. 115 (2007) 953–961. 10.1161/CIRCULATIONAHA.106.643718. [DOI] [PubMed] [Google Scholar]
- [9].Claridge S, Chen Z, Jackson T, De Silva K, Behar J, Sohal M, Webb J, Hyde E, Lumley M, Asrress K, Williams R, Bostock J, Ali M, Gill J, O’Neill M, Razavi R, Niederer S, Perera D, Rinaldi CA, Effects of epicardial and endocardial cardiac resynchronization therapy on coronary flow: Insights from wave intensity analysis, J. Am. Heart Assoc. 4 (2015) 1–12. 10.1161/JAHA.115.002626. [DOI] [PMC free article] [PubMed] [Google Scholar]
- [10].Bleeker GB, Bax JJ, Steendijk P, Schalij MJ, van der Wall EE, Left ventricular dyssynchrony in patients with heart failure: Pathophysiology, diagnosis and treatment, Nat. Clin. Pract. Cardiovasc. Med 3 (2006) 213–219. 10.1038/ncpcardio0505. [DOI] [PubMed] [Google Scholar]
- [11].Tracy CM, Epstein AE, Darbar D, Dimarco JP, Dunbar SB, Estes NAM, Ferguson TB, Hammill SC, Karasik PE, Link MS, Marine JE, Schoenfeld MH, Shanker AJ, Silka MJ, Stevenson LW, Stevenson WG, Varosy PD, 2012 ACCF/AHA/HRS focused update of the 2008 guidelines for device-based therapy of cardiac rhythm abnormalities: A report of the American college of cardiology foundation/american heart association task force on practice guidelines, Circulation. 126 (2012) 1784–1800. 10.1161/CIR.0b013e3182618569. [DOI] [PubMed] [Google Scholar]
- [12].P.E.V. (Greece), Brignole (Chairperson) (Italy)* Michele, Auricchio (Switzerland) Angelo, Baron-Esquivias (Spain) Gonzalo, Bordachar (France) Pierre, Boriani (Italy) Giuseppe, Breithardt (Germany) Ole-A, Cleland (UK) John, Deharo (France) Jean-Claude, Victoria Delgado (Ne, 2013ESCGuidelines on cardiac pacing and cardiac resynchronization therapy TheTaskForceoncardiacpacing and resynchronization therapyofthe European Society ofCardiology (ESC). Developed in collaboration with the European Heart Rhythm Association (EHRA), Europace. 15 (2013) 1070–1118. 10.1093/europace/eut206. [DOI] [PubMed] [Google Scholar]
- [13].Howard EJ, Covell JW, Mulligan LJ, McCulloch AD, Omens JH, Kerckhoffs RCP, Improvement in pump function with endocardial biventricular pacing increases with activation time at the left ventricular pacing site in failing canine hearts, Am. J. Physiol. - Hear. Circ. Physiol 301 (2011) 1447–1455. 10.1152/ajpheart.00295.2011. [DOI] [PMC free article] [PubMed] [Google Scholar]
- [14].Prinzen FW, Van Deursen C, Van Geldorp IE, Rademakers LM, Van Hunnik A, Kuiper M, Klersy C, Auricchio A, Left ventricular endocardial pacing improves resynchronization therapy in canine left bundle-branch hearts, Circ. Arrhythmia Electrophysiol. 2 (2009) 580–587. 10.1161/CIRCEP.108.846022. [DOI] [PubMed] [Google Scholar]
- [15].Spragg DD, Dong J, Fetics BJ, Helm R, Marine JE, Cheng A, Henrikson CA, Kass DA, Berger RD, Optimal left ventricular endocardial pacing sites for cardiac resynchronization therapy in patients with ischemic cardiomyopathy, J. Am. Coll. Cardiol. 56 (2010) 774–781. 10.1016/j.jacc.2010.06.014. [DOI] [PubMed] [Google Scholar]
- [16].Yufu K, Kondo H, Shinohara T, Ishii Y, Yoshimura S, Abe I, Saito S, Fukui A, Okada N, Akioka H, Teshima Y, Nakagawa M, Takahashi N, Assessment of coronary flow reserve predicts long-term outcome of responders to cardiac resynchronization therapy, Heart Vessels. 34 (2019) 763–770. 10.1007/s00380-018-1308-0. [DOI] [PubMed] [Google Scholar]
- [17].Claridge S, Chen Z, Jackson T, Sammut E, Sohal M, Behar J, Razavi R, Niederer S, Rinaldi CA, Current concepts relating coronary flow, myocardial perfusion and metabolism in left bundle branch block and cardiac resynchronisation therapy, Int. J. Cardiol 181 (2015) 65–72. 10.1016/j.ijcard.2014.11.194. [DOI] [PubMed] [Google Scholar]
- [18].Dikic AD, Nikcevic G, Raspopovic S, Jovanovic V, Tesic M, Beleslin B, Stepanovic J, Giga V, Milasinovic G, Prognostic role of coronary flow reserve for left ventricular functional improvement after cardiac resynchronization therapy in patients with dilated cardiomyopathy, Eur. Heart J. Cardiovasc. Imaging 15 (2014) 1344–1349. 10.1093/ehjci/jeu136. [DOI] [PubMed] [Google Scholar]
- [19].Claridge S, Briceno N, Chen Z, De Silva K, Modi B, Jackson T, Behar JM, Niederer S, Rinaldi CA, Perera D, Changes in contractility determine coronary haemodynamics in dyssynchronous left ventricular heart failure, not vice versa, IJC Hear. Vasc. 19 (2018) 8–13. 10.1016/j.ijcha.2018.03.002. [DOI] [PMC free article] [PubMed] [Google Scholar]
- [20].Carpio EF, Gomez JF, Sebastian R, Lopez-Perez A, Castellanos E, Almendral J, Ferrero JM, Trenor B, Optimization of lead placement in the right ventricle during cardiac resynchronization therapy. A simulation study, Front. Physiol 10 (2019) 1–17. 10.3389/fphys.2019.00074. [DOI] [PMC free article] [PubMed] [Google Scholar]
- [21].Lee AWC, Costa CM, Strocchi M, Rinaldi CA, Niederer SA, Computational modeling for cardiac resynchronization therapy, J. Cardiovasc. Transl. Res (2018). 10.1007/s12265-017-9779-4. [DOI] [PMC free article] [PubMed] [Google Scholar]
- [22].Huntjens PR, Walmsley J, Ploux S, Bordachar P, Prinzen FW, Delhaas T, Lumens J, Influence of left ventricular lead position relative to scar location on response to cardiac resynchronization therapy: A model study, Europace. 16 (2014) iv62–iv68. 10.1093/europace/euu231. [DOI] [PubMed] [Google Scholar]
- [23].Niederer SA, Shetty AK, Plank G, Bostock J, Razavi R, Smith NP, Rinaldi CA, Biophysical modeling to simulate the response to multisite left ventricular stimulation using a quadripolar pacing lead, PACE - Pacing Clin. Electrophysiol. 35 (2012) 204–214. 10.1111/j.1540-8159.2011.03243.x. [DOI] [PMC free article] [PubMed] [Google Scholar]
- [24].Kerckhoffs RCP, McCulloch AD, Omens JH, Mulligan LJ, Effects of biventricular pacing and scar size in a computational model of the failing heart with left bundle branch block, Med. Image Anal. 13 (2009) 362–369. 10.1016/j.media.2008.06.013. [DOI] [PMC free article] [PubMed] [Google Scholar]
- [25].Hu Y, Gurev V, Constantino J, Trayanova N, Optimizing cardiac resynchronization therapy to minimize ATP consumption heterogeneity throughout the left ventricle: A simulation analysis using a canine heart failure model, Hear. Rhythm. 11 (2014) 1063–1069. 10.1016/j.hrthm.2014.03.021. [DOI] [PMC free article] [PubMed] [Google Scholar]
- [26].Sermesant M, Chabiniok R, Chinchapatnam P, Mansi T, Billet F, Moireau P, Peyrat JM, Wong K, Relan J, Rhode K, Ginks M, Lambiase P, Delingette H, Sorine M, Rinaldi CA, Chapelle D, Razavi R, Ayache N, Patient-specific electromechanical models of the heart for the prediction of pacing acute effects in CRT: A preliminary clinical validation, Med. Image Anal. 16 (2012) 201–215. 10.1016/j.media.2011.07.003. [DOI] [PubMed] [Google Scholar]
- [27].Constantino J, Hu Y, Trayanova NA, A computational approach to understanding the cardiac electromechanical activation sequence in the normal and failing heart, with translation to the clinical practice of CRT, Prog. Biophys. Mol. Biol. 110 (2012) 372–379. 10.1016/j.pbiomolbio.2012.07.009. [DOI] [PMC free article] [PubMed] [Google Scholar]
- [28].Villongco CT, Krummen DE, Omens JH, McCulloch AD, Non-invasive, model-based measures of ventricular electrical dyssynchrony for predicting CRT outcomes, Europace. 18 (2016) iv104–iv112. 10.1093/europace/euw356. [DOI] [PMC free article] [PubMed] [Google Scholar]
- [29].Pluijmert M, Bovendeerd PHM, Lumens J, Vernooy K, Prinzen FW, Delhaas T, New insights from a computational model on the relation between pacing site and CRT response, Europace. 18 (2016) iv94–iv103. 10.1093/europace/euw355. [DOI] [PubMed] [Google Scholar]
- [30].Fan L, Namani R, Choy S, Kassab GS, Lee LC, Effects of mechanical dyssynchrony on coronary flow: insights from a computational model of coupled coronary perfusion with systemic circulation, Front. Physiol 11 (2020) 915. [DOI] [PMC free article] [PubMed] [Google Scholar]
- [31].Fan L, Namani R, Choy JS, Awakeem Y, Kassab GS, Lee LC, Role of coronary flow regulation and cardiac-coronary coupling in mechanical dyssynchrony associated with right ventricular pacing, Am. J. Physiol. - Hear. Circ. Physiol 320 (2021) H1037–H1054. 10.1152/ajpheart.00549.2020. [DOI] [PMC free article] [PubMed] [Google Scholar]
- [32].Tomioka H, Liakopoulos OJ, Buckberg GD, Hristov N, Tan Z, Trummer G, The effect of ventricular sequential contraction on helical heart during pacing: high septal pacing versus biventricular pacing, Eur. J. Cardio-Thoracic Surg 29 (2006) 198–206. 10.1016/j.ejcts.2006.02.051. [DOI] [PubMed] [Google Scholar]
- [33].Shavik SM, Zhong L, Zhao X, Lee LC, In-silico assessment of the effects of right ventricular assist device on pulmonary arterial hypertension using an image based biventricular modeling framework, Mech. Res. Commun 97 (2019) 101–111. 10.1016/j.mechrescom.2019.04.008. [DOI] [PMC free article] [PubMed] [Google Scholar]
- [34].Shavik SM, Wall S, Sundnes J, Guccione JM, Sengupta P, Solomon SD, Burkhoff D, Lee LC, Computational Modeling Studies of the Roles of Left Ventricular Geometry, Afterload, and Muscle Contractility on Myocardial Strains in Heart Failure with Preserved Ejection Fraction, J. Cardiovasc. Transl. Res (2021). 10.1007/s12265-021-10130-y. [DOI] [PMC free article] [PubMed] [Google Scholar]
- [35].Villa AD, Sammut E, Nair A, Rajani R, Bonamini R, Chiribiri A, Coronary artery anomalies overview: The normal and the abnormal, World J. Radiol 8 (2016) 537. 10.4329/wjr.v8.i6.537. [DOI] [PMC free article] [PubMed] [Google Scholar]
- [36].Arumugam J, Mojumder J, Kassab G, Lee LC, Model of anisotropic reverse cardiac growth in mechanical dyssynchrony, Sci. Rep 9 (2019) 1–12. 10.1038/s41598-019-48670-8. [DOI] [PMC free article] [PubMed] [Google Scholar]
- [37].Kuhl GS,E, Computational modeling of cardiac electrophysiology: A novel finite element approach, Int. J. Numer. Methods Eng. (2009) 156–178. 10.1002/nme. [DOI] [Google Scholar]
- [38].Baillargeon B, Rebelo N, Fox DD, Taylor RL, Kuhl E, The living heart project: A robust and integrative simulator for human heart function, Eur. J. Mech. A/Solids. 48 (2014) 38–47. 10.1016/j.euromechsol.2014.04.001. [DOI] [PMC free article] [PubMed] [Google Scholar]
- [39].Kerckhoffs RCP, Lumens J, Vernooy K, Omens JH, Mulligan LJ, Delhaas T, Arts T, McCulloch AD, Prinzen FW, Cardiac resynchronization: Insight from experimental and computational models, Prog. Biophys. Mol. Biol. 97 (2008) 543–561. 10.1016/j.pbiomolbio.2008.02.024. [DOI] [PMC free article] [PubMed] [Google Scholar]
- [40].McCulloch AD, Functionally and structurally integrated computational modeling of ventricular physiology, Jpn. J. Physiol. 54 (2004) 531–539. 10.2170/jjphysiol.54.531. [DOI] [PubMed] [Google Scholar]
- [41].Tomek J, Bueno-Orovio A, Passini E, Zhou X, Minchole A, Britton O, Bartolucci C, Severi S, Shrier A, Virag L, Varro A, Rodriguez B, Development, calibration, and validation of a novel human ventricular myocyte model in health, disease, and drug block, Elife. 8 (2019) 1–48. 10.7554/eLife.48890. [DOI] [PMC free article] [PubMed] [Google Scholar]
- [42].Ten Tusscher KHWJ, Noble D, Noble PJ, Panfilov AV, A model for human ventricular tissue, Am. J. Physiol. - Hear. Circ. Physiol 286 (2004) 1573–1589. 10.1152/ajpheart.00794.2003. [DOI] [PubMed] [Google Scholar]
- [43].Niederer S, Regulation of Ion Gradients across Myocardial Ischemic Border Zones: A Biophysical Modelling Analysis, PLoS One. 8 (2013). 10.1371/journal.pone.0060323. [DOI] [PMC free article] [PubMed] [Google Scholar]
- [44].Guccione JM, Waldman LK, McCulloch AD, Mechanics of actiwe contraction in cardiac muscle: Part II—cylindrical models of the systolic left ventricle, J. Biomech. Eng. 115 (1993) 82–90. 10.1115/1.2895474. [DOI] [PubMed] [Google Scholar]
- [45].Guccione JM, Costa KD, a D. McCulloch, Finite element stress analysis of left ventricular mechanics in the beating dog heart, J. Biomech. 28 (1995) 1167–1177. 10.1016/0021-9290(94)00174-3. [DOI] [PubMed] [Google Scholar]
- [46].Streeter DD, Spotnitz HM, Patel DP, Ross J, Sonnenblick EH, Fiber orientation in the canine left ventricle during diastole and systole., Circ. Res. 24 (1969) 339–47. [DOI] [PubMed] [Google Scholar]
- [47].Logg A, Mardal KA, Wells G, Automated Solution of Differential Equations by the Finite Element Method: The FEniCS Book (Lecture Notes in Computational Science and Engineering), 2012. 10.1007/978-3-642-23099-8. [DOI] [Google Scholar]
- [48].Shavik SM, Tossas-Betancourt C, Figueroa CA, Baek S, Lee LC, Multiscale Modeling Framework of Ventricular-Arterial Bi-directional Interactions in the Cardiopulmonary Circulation, Front. Physiol 11 (2020) 2. 10.3389/fphys.2020.00002. [DOI] [PMC free article] [PubMed] [Google Scholar]
- [49].Mojumder J, Choy JS, Leng S, Zhong L, Kassab GS, Lee LC, Mechanical Stimuli for Left Ventricular Growth During Pressure Overload, Exp. Mech 61 (2021) 131–146. 10.1007/s11340-020-00643-z. [DOI] [PMC free article] [PubMed] [Google Scholar]
- [50].Namani R, Kassab G, Lanir Y, Integrative model of coronary flow in anatomically based vasculature under myogenic, shear, and metabolic regulation, J. Gen. Physiol. 150 (2018) 145–168. 10.1085/jgp.201711795. [DOI] [PMC free article] [PubMed] [Google Scholar]
- [51].Hollander Y, Durban D, Lu X, Kassab GS, Lanir Y, Experimentally Validated Microstructural 3D Constitutive Model of Coronary Arterial Media, J. Biomech. Eng. 133 (2011) 31007–31014. [DOI] [PMC free article] [PubMed] [Google Scholar]
- [52].Huyghe JM, Van Loon R, Baaijens FTP, Fluid-solid mixtures and electrochemomechanics: The simplicity of lagrangian mixture theory, Comput. Appl. Math. 23 (2004) 235–258. 10.1590/s1807-03022004000200008. [DOI] [Google Scholar]
- [53].Ross J Jr, Point of view myocardial perfusion-contraction matching implications for coronary heart disease and hibernation, Circulation. 83 (1991) 1076–1084. [DOI] [PubMed] [Google Scholar]
- [54].Schulz R, Miyazaki S, Miller M, Thaulow E, Heusch G, Ross J, Guth BD, Consequences of regional inotropic stimulation of ischemic myocardium on regional myocardial blood flow and function in anesthetized swine, Circ. Res. 64 (1989) 1116–1126. 10.1161/01.RES.64.6.1116. [DOI] [PubMed] [Google Scholar]
- [55].Heusch G, Myocardial ischemia: Lack of coronary blood flow, myocardial oxygen supply-demand imbalance, or what?, Am. J. Physiol. - Hear. Circ. Physiol 316 (2019) H1439–H1446. 10.1152/ajpheart.00139.2019. [DOI] [PMC free article] [PubMed] [Google Scholar]
- [56].Heusch G, Schulz R, The relation of contractile function to myocardial perfusion: Perfusion- contraction match and mismatch, Herz. 24 (1999) 509–514. 10.1007/BF03044221. [DOI] [PubMed] [Google Scholar]
- [57].Gil VM, Hibernating myocardium. An incomplete adaptation to ischemia., Rev. Port. Cardiol. 17 (1998) 293–294. [PubMed] [Google Scholar]
- [58].Canty JM, Suzuki G, Myocardial perfusion and contraction in acute ischemia and chronic ischemic heart disease, J. Mol. Cell. Cardiol. 52 (2012) 822–831. 10.1016/j.yjmcc.2011.08.019. [DOI] [PMC free article] [PubMed] [Google Scholar]
- [59].Shavik SM, Wall ST, Sundnes J, Burkhoff D, Lee LC, Organ-level validation of a cross-bridge cycling descriptor in a left ventricular finite element model: Effects of ventricular loading on myocardial strains, Physiol. Rep 5 (2017). 10.14814/phy2.13392. [DOI] [PMC free article] [PubMed] [Google Scholar]
- [60].Guccione JMJM, Costa KD, McCulloch AD, Finite element stress analysis of left ventricular mechanics in the beating dog heart, J. Biomech. 28 (1995) 1167–1177. 10.1016/0021-9290(94)00174-3. [DOI] [PubMed] [Google Scholar]
- [61].Hu Y, Gurev V, Constantino J, Trayanova N, Efficient preloading of the ventricles by a properly timed atrial contraction underlies stroke work improvement in the acute response to cardiac resynchronization therapy, Hear. Rhythm 10 (2013) 1800–1806. 10.1016/j.hrthm.2013.08.003. [DOI] [PMC free article] [PubMed] [Google Scholar]
- [62].Holmes JW, Laksman Z, Gepstein L, Making better scar: Emerging approaches for modifying mechanical and electrical properties following infarction and ablation, Prog. Biophys. Mol. Biol. 120 (2016) 134–148. 10.1016/j.pbiomolbio.2015.11.002. [DOI] [PMC free article] [PubMed] [Google Scholar]
- [63].Crozier A, Blazevic B, Lamata P, Plank G, Ginks M, Duckett S, Sohal M, Shetty A, Rinaldi CA, Razavi R, Smith NP, Niederer SA, The relative role of patient physiology and device optimisation in cardiac resynchronisation therapy: A computational modelling study, J. Mol. Cell. Cardiol. 96 (2016) 93–100. 10.1016/j.yjmcc.2015.10.026. [DOI] [PMC free article] [PubMed] [Google Scholar]
- [64].Lee AWC, Crozier A, Hyde ER, Lamata P, Truong M, Sohal M, Jackson T, Behar JM, Claridge S, Shetty A, Sammut E, Plank G, Rinaldi CA, Niederer S, Biophysical Modeling to Determine the Optimization of Left Ventricular Pacing Site and AV/VV Delays in the Acute and Chronic Phase of Cardiac Resynchronization Therapy, J. Cardiovasc. Electrophysiol. 28 (2017) 208–215. 10.1111/jce.13134. [DOI] [PMC free article] [PubMed] [Google Scholar]
- [65].Zanon F, Baracca E, Pastore G, Fraccaro C, Roncon L, Aggio S, Noventa F, Mazza A, Prinzen F, Determination of the longest intrapatient left ventricular electrical delay may predict acute hemodynamic improvement in patients after cardiac resynchronization therapy, Circ. Arrhythmia Electrophysiol. 7 (2014) 377–383. 10.1161/CIRCEP.113.000850. [DOI] [PubMed] [Google Scholar]
- [66].Gold MR, Birgersdotter-Green U, Singh JP, Ellenbogen KA, Yu Y, Meyer TE, Seth M, Tchou PJ, The relationship between ventricular electrical delay and left ventricular remodelling with cardiac resynchronization therapy, Eur. Heart J. 32 (2011) 2516–2524. 10.1093/eurheartj/ehr329. [DOI] [PMC free article] [PubMed] [Google Scholar]
- [67].Ypenburg C, van Bommel RJ, Delgado V, Mollema SA, Bleeker GB, Boersma E, Schalij MJ, Bax JJ, Optimal Left Ventricular Lead Position Predicts Reverse Remodeling and Survival After Cardiac Resynchronization Therapy, J. Am. Coll. Cardiol. 52 (2008) 1402–1409. 10.1016/j.jacc.2008.06.046. [DOI] [PubMed] [Google Scholar]
- [68].Gold MR, Leman RB, Wold N, Sturdivant JL, Yu Y, The effect of left ventricular electrical delay on the acute hemodynamic response with cardiac resynchronization therapy, J. Cardiovasc. Electrophysiol. 25 (2014) 624–630. 10.1111/jce.12372. [DOI] [PubMed] [Google Scholar]
- [69].Gurev V, Constantino J, Rice JJ, Trayanova NA, Distribution of electromechanical delay in the heart: Insights from a three-dimensional electromechanical model, Biophys. J. 99 (2010) 745–754. 10.1016/j.bpj.2010.05.028. [DOI] [PMC free article] [PubMed] [Google Scholar]
- [70].Butter C, Auricchio A, Stellbrink C, Fleck E, Ding J, Yu Y, Huvelle E, Spinelli J, Effect of resynchronization therapy stimulation site on the systolic function of heart failure patients, Circulation. 104 (2001) 3026–3029. 10.1161/hc5001.102229. [DOI] [PubMed] [Google Scholar]
- [71].Kass DA, Chen CH, Curry C, Talbot M, Berger R, Fetics B, Nevo E, Improved left ventricular mechanics from acute VDD pacing in patients with dilated cardiomyopathy and ventricular conduction delay, Circulation. 99 (1999) 1567–1573. 10.1161/01.CIR.99.12.1567. [DOI] [PubMed] [Google Scholar]
- [72].White JA, Yee R, Yuan X, Krahn A, Skanes A, Parker M, Klein G, Drangova M, Delayed Enhancement Magnetic Resonance Imaging Predicts Response to Cardiac Resynchronization Therapy in Patients With Intraventricular Dyssynchrony, J. Am. Coll. Cardiol. 48 (2006) 1953–1960. 10.1016/j.jacc.2006.07.046. [DOI] [PubMed] [Google Scholar]
- [73].Usyk TP, McCulloch AD, Relationship between Regional Shortening and Asynchronous Electrical Activation in a Three-Dimensional Model of Ventricular Electromechanics, J. Cardiovasc. Electrophysiol. 14 (2003). 10.1046/j.1540.8167.90311.x. [DOI] [PubMed] [Google Scholar]
- [74].Daubert JC, Saxon L, Adamson PB, Auricchio A, Berger RD, Beshai JF, Breithard O, Brignole M, Cleland J, Delurgio DB, Dickstein K, Exner DV, Gold M, Grimm RA, Hayes DL, Israel C, Leclercq C, Linde C, Lindenfeld J, Merkely B, Mont L, Murgatroyd F, Prinzen F, Saba SF, Shinbane JS, Singh J, Tang AS, Vardas PE, Wilkoff BL, Zamorano JL, Anand I, Blomström-Lundqvist C, Boehmer JP, Calkins H, Cazeau S, Delgado V, Estes NAM, Haines D, Kusumoto F, Leyva P, Ruschitzka F, Stevenson LW, Torp-Pedersen CT, 2012 EHRA/HRS expert consensus statement on cardiac resynchronization therapy in heart failure: Implant and follow-up recommendations and management, Europace. 14 (2012) 1236–1286. 10.1093/europace/eus222. [DOI] [PubMed] [Google Scholar]
- [75].Williams B, Menon M, Satran D, Hayward D, Hodges JS, Burke N, Johnson RK, Poulose AK, Traverse JH, Henry TD, Patients with coronary artery disease not amenable to traditional revascularization: Prevalence and 3-year mortality, Catheter. Cardiovasc. Interv 75 (2010) 886–891. 10.1002/ccd.22431. [DOI] [PubMed] [Google Scholar]
- [76].Mrak M, Pavšič N, Štublar J, Bunc M, Žižek D, Resynchronization therapy with His bundle pacing in a patient after coronary sinus reducer implantation, J. Cardiol. Cases. 22 (2020) 226–229. 10.1016/j.jccase.2020.06.015. [DOI] [PMC free article] [PubMed] [Google Scholar]
- [77].Kerckhoffs RCP, Faris OP, Bovendeerd PHM, Prinzen FW, Smits K, McVeigh ER, Arts T, Electromechanics of paced left ventricle simulated by straightforward mathematical model: comparison with experiments, Am. J. Physiol. - Hear. Circ. Physiol 289 (2005) 1889–1897. 10.1152/ajpheart.00340.2005. [DOI] [PMC free article] [PubMed] [Google Scholar]
- [78].Voci P, Pizzuto F, Romeo F, Coronary flow: A new asset for the echo lab?, Eur. Heart J. 25 (2004) 1867–1879. 10.1016/j.ehj.2004.07.029. [DOI] [PubMed] [Google Scholar]
- [79].Kelly RP, Ting CT, Yang TM, Liu CP, Maughan WL, Chang MS, Kass DA, Effective arterial elastance as index of arterial vascular load in humans, Circulation. 86 (1992) 513–521. 10.1161/01.CIR.86.2.513. [DOI] [PubMed] [Google Scholar]
- [80].Mulvagh S, Quinones MA, Kleiman NS, Jorge Cheirif B, Zoghbi WA, Estimation of left ventricular end-diastolic pressure from Doppler transmitral flow velocity in cardiac patients independent of systolic performance, J. Am. Coll. Cardiol. 20 (1992) 112–119. 10.1016/0735-1097(92)90146-E. [DOI] [PubMed] [Google Scholar]
- [81].Zou F, Brar V, Worley SJ, Interventional device implantation, Part I: Basic techniques to avoid complications: A hands-on approach, J. Cardiovasc. Electrophysiol. 32 (2021) 523–532. 10.1111/jce.14748. [DOI] [PMC free article] [PubMed] [Google Scholar]
- [82].Manzoni A, Bonomi D, Quarteroni A, Reduced Order Modeling for Cardiac Electrophysiology and Mechanics: New Methodologies, Challenges and Perspectives, in: Math. Numer. Model. Cardiovasc. Syst. Appl, 2018. [Google Scholar]
- [83].Padeletti L, Colella A, Michelucci A, Pieragnoli P, Ricciardi G, Porciani MC, Tronconi F, Hettrick DA, Valsecchi S, Dual-Site Left Ventricular Cardiac Resynchronization Therapy, Am. J. Cardiol 102 (2008) 1687–1692. 10.1016/j.amjcard.2008.08.016. [DOI] [PubMed] [Google Scholar]
- [84].Sharma PS, Vijayaraman P, Conduction system pacing for cardiac resynchronisation, Arrhythmia Electrophysiol. Rev. 10 (2021) 51–58. 10.15420/AER.2020.45. [DOI] [PMC free article] [PubMed] [Google Scholar]
- [85].Pries AR, Secomb TW, Geßner T, Sperandio MB, Gross JF, Gaehtgens P, Resistance to blood flow in microvessels in vivo, Circ. Res. 75 (1994) 904–915. 10.1161/01.RES.75.5.904. [DOI] [PubMed] [Google Scholar]
- [86].Walmsley J, Arts T, Derval N, Bordachar P, Cochet H, Ploux S, Prinzen FW, Delhaas T, Lumens J, Fast simulation of mechanical heterogeneity in the electrically asynchronous heart using the multipatch module, PLoS Comput. Biol 11 (2015) 1–23. 10.1371/journal.pcbi.1004284. [DOI] [PMC free article] [PubMed] [Google Scholar]
- [87].Wang VY, Ennis DB, Cowan BR, Young AA, Nash MP, Myocardial contractility and regional work throughout the cardiac cycle using FEM and MRI, Lect. Notes Comput. Sci. (Including Subser. Lect. Notes Artif. Intell. Lect. Notes Bioinformatics). 7085 LNCS (2012) 149–159. 10.1007/978-3-642-28326-0_15. [DOI] [Google Scholar]


