Abstract
One of the prominent uses of Predictive Analytics is Health care for more accurate predictions based on proper analysis of cumulative datasets. Often times the datasets are quite imbalanced and sampling techniques like Synthetic Minority Oversampling Technique (SMOTE) give only moderate accuracy in such cases. To overcome this problem, a two-step approach has been proposed. In the first step, SMOTE is modified to reduce the class imbalance in terms of Distance-based SMOTE (D-SMOTE) and Bi-phasic SMOTE (BP-SMOTE) which were then coupled with selective classifiers for prediction. An increase in accuracy is noted for both BP-SMOTE and D-SMOTE compared to basic SMOTE. In the second step, Machine learning, Deep Learning and Ensemble algorithms were used to develop a Stacking Ensemble Framework which showed a significant increase in accuracy for Stacking compared to individual machine learning algorithms like Decision Tree, Naïve Bayes, Neural Networks and Ensemble techniques like Voting, Bagging and Boosting. Two different methods have been developed by combing Deep learning with Stacking approach namely Stacked CNN and Stacked RNN which yielded significantly higher accuracy of 96–97% compared to individual algorithms. Framingham dataset is used for data sampling, Wisconsin Hospital data of Breast Cancer study is used for Stacked CNN and Novel Coronavirus 2019 dataset relating to forecasting COVID-19 cases, is used for Stacked RNN.
Keywords: Predictive analytics, Health care, Imbalanced data, D-SMOTE, BP-SMOTE, Ensemble methods, Stacking, CNN, RNN
Introduction
Data Analytics methods have been found to be extremely useful in health care domain for early diagnosis to impart better medical treatment and thereby minimize the death rate in cases like breast cancer, diabetes, coronary diseases, kidney disorders, etc. A critical survey of existing models reveals that there exists some knowledge gaps in both data treatment analysis and also in supervised learning classification algorithms that cause reduction in the efficiency of prediction analytics from achieving optimized results. Available datasets usually display considerable class imbalance. Analysis of such imbalanced datasets yields less reliable results, due to several parameters, which can be remedied through proper Exploratory Data Analysis (EDA) involving Data pre-processing (Napierala and Stefanowski 2016; Mrudula and Mary Sowjanya 2020a), algorithmic and feature selection approaches. Imbalanced datasets cause four challenges in terms of Bias, overlap, dataset size and feature vector size. Although, Synthetic Minority Oversampling Technique (SMOTE) was reported in literature to deal with such imbalanced datasets with numerical values chosen randomly to compensate for the imbalance. This causes overlapping between majority and minority classes while generating synthetic samples (Chon Ho 2010).
In view of the inadequacy to handle imbalanced datasets, two new sampling techniques are now proposed to address this issue. One is Distance-based SMOTE (D-SMOTE) and the other is Bi-phasic SMOTE (BP-SMOTE). Further objective of this study is to compare the results of classification algorithms and combinations of these algorithms using Stacking technique, which is one of the Ensemble approaches where multiple models are combined for synergetic effect. In the present study, stacking ensemble approach is combined with deep learning algorithms to arrive at a hybrid system for more accurate prediction of disease in terms of stacking. Two predictive models have been developed—one as Stacked CNN (Stacked ensemble with Convolutional Neural Network), and the other is Stacked RNN (Stacked ensemble with Recurrent Neural Network) for time-series forecasting datasets. Performance of the proposed models was assayed in terms of accuracy and other evaluation metrics. Both Stacked CNN and Stacked RNN methods gave significantly higher accuracy compared to individual methods.
Background literature
The purpose of classification is to identify the class to which the new data may be assigned. However, class imbalance is one data property that significantly complicates classification problems. More often, the class of minority instances will be of more importance and improper classification might lead to false predictions (Burez and Poel 2009) which can cause severe consequences especially in areas like Health care. To deal with imbalanced data, two approaches in terms of data-level approach and algorithmic-level approach have been suggested in literature (Ali et al. 2015). Nevertheless, because of the ease of adaptability, data-level approaches comprising of either Undersampling of majority instances or Oversampling of minority instances have become common practice (Skryjomski and Krawczyk 2017). Usually in order not to avoid elimination of significant majority of instances, Oversampling algorithms are preferred, and Synthetic Minority Oversampling Technique (SMOTE) algorithm proposed by Chawla et al. (2002) is the most widely used. Subsequently more than 85 variants of SMOTE have been reported in literature to further improve the basic form of SMOTE in terms of different classification metrics (Fernández et al. 2018) like borderline-SMOTE1 and borderline-SMOTE2, advanced SMOTE (A-SMOTE), Distributed version of SMOTE (Han et al. 2005; Hooda and Mann 2019; Hussein 2019), etc. There seems to be only few literature reports dealing with detailed critical comparison of these proposed methods (Bajer et al. 2019; Kovács 2019). Another approach in Oversampling is called Random Oversampling method (Batista et al. 2004), which suffers from overfitting (Seiffert et al. 2014). Even though SMOTE is simple, it has its own drawback that when only minority instances are considered, without due consideration of majority instances, it may lead to possible over generalization or increased overlap in classes (Bunkhumpornpat et al. 2009; García et al. 2008). Mario Dudjak and Goran Martinovi (2020) made a critical study on Oversampling algorithms related to SMOTE for binary classification.
According to Chen et al. (2017), a new multimodal disease risk prediction model using CNN algorithm was proposed, which made predictions based on structured and unstructured data collected in a hospital setting. These authors developed a disease prediction system for a variety of regions with the help of a variety of machine learning algorithms such as Nave Bayes, Decision Trees, and the KNN algorithm. They also performed predictions for heart disease, type 2 diabetes, and cerebral infarction using a variety of machine learning algorithms. Following the findings, it was discovered that using the decision tree produced results that were significantly better than those obtained using either the Nave Bayes or the KNN approaches. An investigation into text data revealed that the likelihood of having a cerebral infarction could be predicted using a CNN-based multi-model disease risk prediction technique based on text data. Using the CNN-based unimodal disease risk prediction algorithm, it was found that the accuracy of disease prediction increased to 94.8 percent when compared to the previous algorithms. Furthermore, the algorithm was able to operate at a faster rate than before. The findings of a comparative study of various machine learning techniques, including fuzzy logic, fuzzy neural networks, and decision trees (Leoni Sharmila et al. 2017), were presented. Fuzzy logic, fuzzy neural networks, and decision trees were among the techniques studied. According to their research, they discovered that Fuzzy Neural Networks outperformed other machine learning algorithms in terms of classification accuracy in a liver disease dataset, with an accuracy of 91 percent. With the assistance of a machine learning algorithm such as Naive Bayes, Shraddha Subhash Shirsath (2018) developed the CNN-MDRP algorithm for disease prediction. The algorithm was trained on a large volume of both structured and unstructured data during the development process. CNN-MDRP, in contrast to CNNUDRP, which only uses structured data, makes use of both structured and unstructured information, resulting in a more accurate prediction. CNN-MDRP has been shown to be more accurate at disease prediction when compared to CNNUDRP, which was previously the only algorithm available. When compared to CNNUDRP, CNN-MDRP appears to be more responsive as well as more accurate. For the prediction of the development of heart disease, Vincent and colleagues (2020) used an ensemble of machine learning algorithms (Yao et al. 1901; Masud et al. 2020). Following the model’s predictions, the outcome was predicted to be either normal or risky, depending on the situation.
For the purpose of combining the results of these algorithms, the random forest (Leoni Sharmila et al. 2017) is used as the meta-classifier. In terms of precision, it improved from 85.53 percent to 87.64 percent over the course of the study. Using a parallel structure, the authors (Yao et al. 1901) developed a new deep learning model to classify images into four categories. The model consisted of a convolutional neural network (CNN) and a recurrent neural network (RNN) for feature extraction and classification, respectively, both of which were used in conjunction with a recurrent neural network (RNN) for classification. This model is more refined as a result of the replacement of the switchable normalization method with general batch normalization in the convolution layer and the use of targeted dropout, the most recent regularization technology, in all three fully connected layers of the final three fully connected layers of the model. According to Masud et al. (2020), they developed a shallow custom convolutional neural network that outperformed the pre-trained models in a variety of performance metric comparisons, including classification accuracy. With 100 percent accuracy and an AUC of 1, the proposed model beat out the best pre-trained model, which was only 92% accurate but scored only 0.972 on the AUC measure. This model was trained more quickly than the pre-trained models when the fivefold cross validation technique was used, and it only required a small number of trainable parameters to be effective. The researchers proposed an alternative model for stock return prediction that included a non-linear model (a recurrent neural network) as well as two linear models (autoregressive moving average and exponential smoothing models). It was discovered during the course of their research that their model outperformed the competition by being both durable and innovative (Rather et al. 2015). They combined predictions obtained from three different prediction-based models into a single prediction model, as described in the literature. Using an ensemble architecture, Krstanovic et al. (2017) were able to produce a better final estimate that outperformed many individual LSTM base learners also being consistent across multiple datasets. Stacking ensemble models can be used in many applications like prediction of breast cancer, cardiovascular disease admissions and hepatitis (Valluri Rishika 2019; Hu et al. 2020; Folake et al. 2019).
Proposed methodology
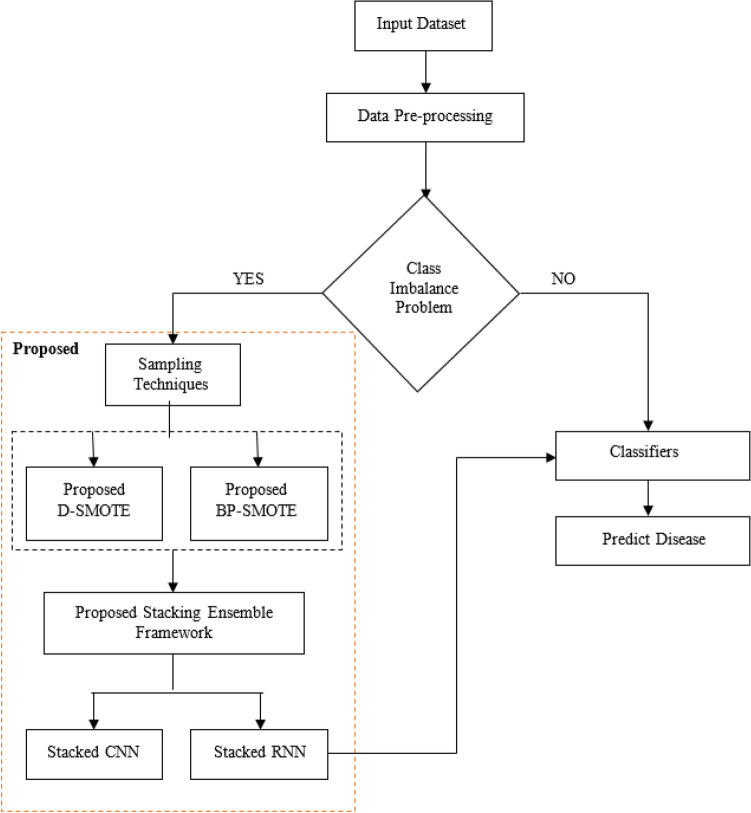
To improve the sampling technique in class imbalanced datasets, two new approaches, Distance-based SMOTE (D-SMOTE) and Bi-phasic SMOTE (BP-SMOTE) are now proposed. A brief discussion of these two methods is given below, followed by the discussion of the proposed ensemble methods Stacked CNN and Stacked RNN (Fig. 1).
Fig. 1.
Schematic diagram of methodology depicting the proposed modifications
Proposed techniques
Distance-based SMOTE
When used in conjunction with an oversampling technique, the SMOTE technique provides a reasonably good solution to the problem of unequal data distribution. Among the fundamental assumptions made by the SMOTE to identify features that are similar across minority classes is that: each minority sample is measured in terms of its centroid (c), and the distance (di) between each minority sample and the centroid is calculated separately for each minority sample and the centroid. This is followed by the computation of the average (avg) of the distance matrix. Specifically, it is represented as a distance from the class center (c) that is greater than the average distance and the sample distance. Using a random number generator between (0, 1), a synthetic sample is created by multiplying the difference in centroid (c) and distance (di) for each of the N centroids by a number between (0, 1), where ‘σ’ is a number between (0, 1). The value of this seed is added to the value of the original seed to determine its total value. Listed below are the mathematical steps of the algorithm, as depicted in the illustration:
| 1 |
| 2 |
| 3 |
| 4 |
| 5 |
However, the D-SMOTE technique that is currently being proposed generates new examples rather than duplicating the minority class examples, which is a significant improvement. Newly generated “synthetic” samples are generated in the vicinity of minority classes (Hu and Li 2013), as illustrated in Fig. 2, and these synthetic samples operate within the “feature space”. Following the selection of each minority class, the introduction of synthetic samples into the minority class closest neighbors across the line segment is carried out, thereby bringing them into the minority class closest neighbors across the line segment. Whenever it comes to synthetic samples, the amount varies from one situation to another. In addition, the number of k minority classes that are selected to generate the closest t neighbor synthetic samples is taken into consideration in accordance with the requirements of the proposed D-SMOTE method, to make certain that the closest t neighbor synthetic samples are generated in a very short time.
Fig. 2.
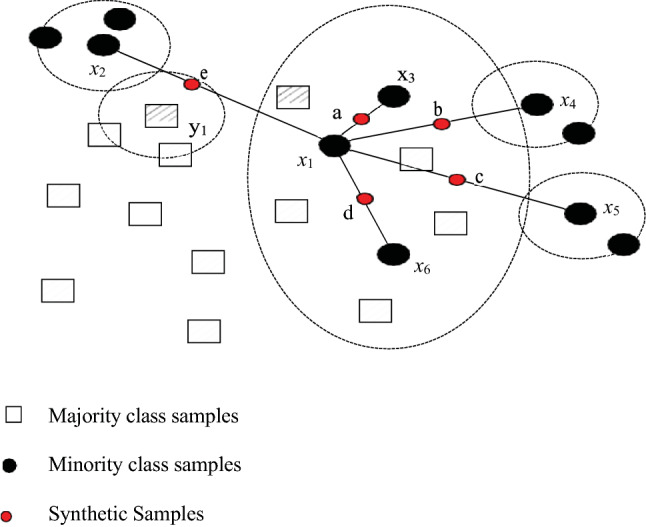
Schematic representation of D-SMOTE
As a result of the scarcity of positive examples in the training set, when learning from imbalanced data, there is a greater chance of being close to a negative example, and even being close to the mode of the positive distribution for a new query x when learning from imbalanced data, as shown in Figure 2. The proposed approach involves adjusting the distance between the examples based on the hierarchy of the classes.
For the purpose of compensating for an imbalance in the dataset, it is proposed that the distance between the two points be modified by computing positive examples of the relationship. Positive examples can be made more effective by artificially bringing them nearer to a positive one to increase their effectiveness. This can be done by providing a definition for the new proposed measure dγ, which is founded on a distance d as its underlying basis:
| 6 |
In comparison to positive examples, the query is only used once, which allows it to compensate for any imbalances in the classes that might be present. This is due to the fact that the distance between the two objects in question cannot be correctly represented by the new proposed measure. No separate parameters are required for the negative class because only relative distances are used. If you are working in a multi-class environment, it is necessary to fine-tune values that are as complex as K-1 levels. D-SMOTE algorithm takes advantage of the proposed measure, by using an approximate nearest neighbour binary classifier that takes into account the distance dγ. For a dataset with only two datapoints (one positive and other negative), 1-NN, is a conventional solution. As the value keeps decreasing below one, the decision boundary also moves nearer and nearer to the negative datapoint, ultimately touching it. A decision boundary is defined as the point at which the decision boundary becomes increasingly near to the negative datapoint. For more complex datasets, with few positive datapoints and several negative datapoints in each, the parameter can be used to control how much time is spent attempting to push towards the negative datapoint. Then D-SMOTE algorithm, having the same overall complexity as the kNN algorithm can be used instead. It is necessary to identify both the nearest negative neighbors and the nearest positive neighbors of a query x to classify it. Then dγ, is calculated by multiplying the distance between two positive neighbors with a factor d. These 2k neighbors are then ranked according to their distance from the center, and the k-nearest ones are classified according to their ranking.
Though D-SMOTE is advantageous over the original SMOTE, it uses a distance-based algorithm with a parameter γ which can be used to control the degree of overlap between majority and minority classes. But this introduces additional noise in the form of unimportant variables while creating new synthetic examples. As such another new sampling technique, BP-SMOTE has been proposed.
Bi-phasic SMOTE
Based on the prevailing inadequacies associated with SMOTE and D-SMOTE, a new technique, Bi-Phasic-Synthetic Minority Oversampling Technique (BP-SMOTE) is proposed which consists of two levels, i.e., SMOTE followed by instance selection.
Phase 1: Original SMOTE is used to maximize the minority cases in the original data.
Phase 2: In Instance Selection, the representative instances are chosen with greedy selection as the final training dataset.
SMOTE has been discussed earlier and the details of instance selection are given below: given a training dataset, the proposed Bi-Phasic-SMOTE technique permits classifiers to obtain the same output with a subset of training datasets only. For each iteration, the first subset of candidates combine with other desired subsets of candidates until the combination of that subset cannot further increase classification performance.
Each instance from the original datasets is considered for inclusion greedily to create final training dataset. Specifically, an example is chosen if it increases the classifier's predictive accuracy in the final training dataset. Accordingly, the previously considered instance should be given a greater chance than the later ones to belong to the final training dataset. Therefore, some cases which are considered too late can never be chosen. To handle this situation, a single subset of candidates for each scenario is initially created. If there are m subsets of candidates in total, then each case is included in its subset of index applicants. In at least one candidate each, subset instance shall be selected. Generally, imbalanced datasets are processed by gathering more examples, which results in underestimating or simply ignoring the minority community. Therefore, it is proposed to implement an instance-based selection technique. Once the imbalanced classification data are matched to the predefined classification, the exactness is estimated based on the same classifier training dataset. For this purpose, a previously isolated test dataset can be used but it also fits better on training datasets.
SMOTE and instance selection are effective methods for managing imbalanced data sets. However, if applied in different applications, the process behind the selection of instances includes the selection of representative instances near the decision limit of the two levels. These are the primary points for separating the two levels, called vector support points. However, as the prediction points increase, support points also increase which means that the points are no longer close to the decision boundary. To detect the minority class, the selected instances are enough for a classifier to fit an appropriate model. In the original SMOTE technique, the majority of cases typically work with under-sampling to obtain the final training set of truly balanced data. This weakens the majority class decision area and encourages a generic class to concentrate more on minority cases. Increasing the instances in the dataset will not increase the overall classification performance of a classifier because a majority of instances generated are duplicated.
Proposed Bi-Phasic SMOTE provides a solution to improve these two approaches by reducing and integrating their drawbacks. With an imbalanced data set, allowing a classifier to be sensitive to the minority class is very important. Taking the features and characteristics of the minority class into account considering minority oversampling is important because the real density can no longer be taken from example. The oversampling with substitution is, however, done to give the minority class a much more precise decision without increasing the sensitivity of a classifier. So, the model fitted detects only the particular decision area and ignores other minority class general decision zone i.e., BP-SMOTE alters the functional vectors of the sampled instances by multiplying a parameter to adjust the data set feature spaces, but not to modify the data space. This helps the minority class to divide their area and enter the border of the majority class.
When instance selection is combined with the original SMOTE algorithm, the selection of the instances usually selects the best instances from the two classes, and establishes an ideal decision boundary from the k-nearest neighbor. However, in n-dimensional space, the selected instances may be far away from the k-nearest neighbor decision boundary when n is very large. This leads to a poor prediction. Dataset has been extended to include such synthetic minority instances. To overcome this problem, the proposed distance-based SMOTE sampling technique is used to collect all the far away selected instances as synthetic minority instances to fit the model classifier for higher quality instances which provides higher accuracy of a classifier and leads to better predictions. Also, BP-SMOTE maintains more balance in identifying the two classes (majority and minority) ensuring an optimal best collection of instances from the training dataset and can be used to expand the number of minority instances to wider minority-class decision-making areas.
Stacking ensemble framework
The combination of various classifiers from various classification algorithms is fundamental to Stacking algorithmic classification system. A classification mapping technique is a classification technique in which the base-level classifiers’ outputs are used to map the outputs of meta-level classifier. Examples of classification mapping techniques include stacking and recursive clustering. In the current proposed work, stacking is accomplished through the use of a combination of three classifiers, namely the Decision Tree, the Naive Bayes, and the Neural Network.
It is possible that the advantages and disadvantages of one classifier will be beneficial to the other classifier if the two classifiers are used in conjunction with one another. One can create a powerful ensemble model based on stacking by combining two or more of these classifiers in a single model. First- and second-level learners collaborate to complete the task using the stacking approach. When training second-level learners to make predictions, as shown in Fig. 3, the training data set is used as input for the first-level learners, and its output is used as input for training second-level learners to make final predictions.
Fig. 3.
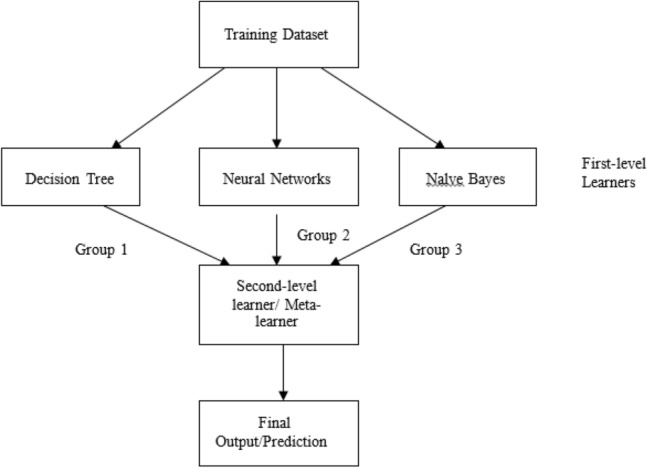
Schematic representation of generation of final output from training dataset
This whole process involves the following steps as illustrated in Fig. 4.
Fig. 4.
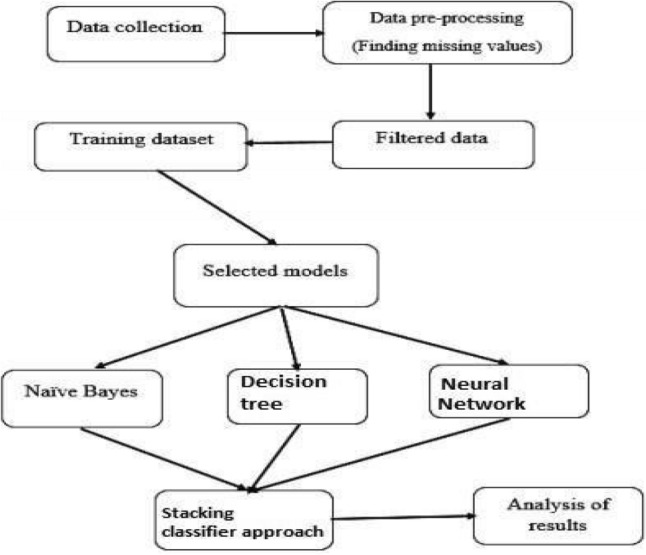
Stacking approach with a combination of Naïve Bayes, Decision Tree, Neural Network classifiers
Step 1: Data are pre-processed and the missing values are replaced using the imputation technique.
Step 2: The dataset is split into training and test sets.
Step 3: The train set comprises of 70% of the dataset.
Step 4: A base model (e.g., a decision tree) is fit on the whole training set and predictions are made on the remaining 30% testing set. This is done for each part of the training set.
Step 5: Steps 3–5 are repeated for other base models (Neural Network and naïve Bayes) which results in another set of predictions.
Step 6: All base model predictions are collected in the stack.
Step 7: These predictions are used as features for building the new model.
Step 8: The new model is used for final predictions on the test set to increase the accuracy.
Stacked CNN
Using the proposed stacking ensemble framework, a stacked ensemble with Convolutional Neural Network is developed. The stacking framework is shown in Fig. 5. Here, a simple CNN is incorporated as a meta-learner.
Fig. 5.
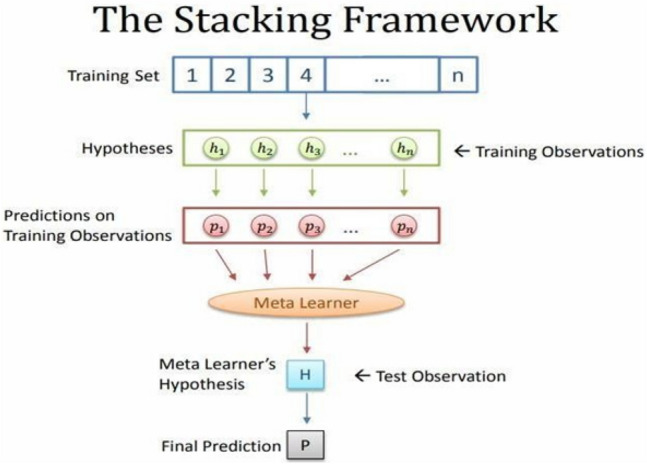
Schematic of Stacking framework
Apart from being generalized and highly accurate, the proposed Stacked Ensemble CNN model will also be highly accurate because the different CNN’s sub-models learn non-linear discriminative features and semantic representation at different levels of abstraction. As part of the solution for the problem of class imbalance, class weights have been assigned to the networks while they are still in the training phase, allowing them to gain a better understanding of their respective classes. A class weighting scheme is established for the variable COVID-19, the Pneumonia class, and the Normal class, with the weights distributed in the ratios of 30:1:1 and 1:1, respectively. An ensemble approach, which is used in the context of stacked generalization, is used to teach a new model how to incorporate the best predictions from a variety of different existing models into its own predictions. The dataset is divided into three groups, the first of which is the train set, the second of which is the validation set, and the third which is the test set. It is trained for 1530 iterations on the training set, where first sub-model#1 is extracted after 765 iterations and second sub-model#2 is extracted after training set is completed. The output of this sub-model is combined with the result of logistic regression to produce a generalized model that is extremely accurate and reliable in its predictions.
Stacked RNN
Using the proposed stacking ensemble framework, a stacked ensemble with Recurrent Neural Network is developed for time-series data. In this stacking framework, a simple RNN is incorporated as meta-learner. RNN is somewhat equivalent to a single-layer regular neural network. Therefore, multiple RNNs are stacked to form a Stacked RNN. The cell state of an RNN cell at level l at time t take the output of the RNN cell from level and previous cell state of the cell at the same level l as the input:
An unfolded stacked RNN can be represented as in Figure 6.
Fig. 6.
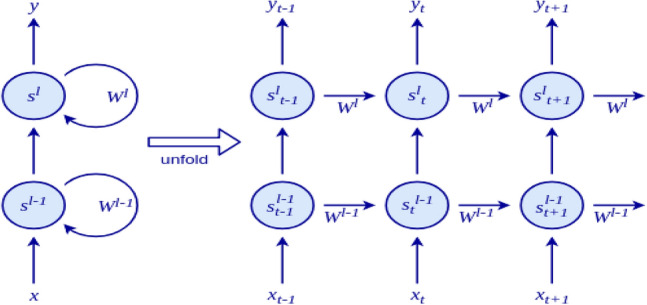
Architecture of stacked-recurrent neural network
Results and discussion
Description of datasets used
Framingham dataset has been taken from Kaggle (https://www.kaggle.com/amanajmera1/framingham-heart-study-dataset). It comprises 16 variables and 4240 observations. Out of which, 3596 are in the majority class (negative) and 644 in the minority class (positive).
Breast cancer dataset taken from the UCI Repository (https://archive.ics.uci.edu/ml/datasets/breast+cancer+wisconsin+%28original%29) comprises of 36 variables and 799 observations. This data set provides the required amount of information for the prediction of cancer.
COVID-19 Data were first made available by John Hopkins University for the research community. It was collected from reliable sources like the World Health Organization (WHO) (https://www.kaggle.com/sudalairajkumar/novel-corona-virus-2019-dataset).
Performance evaluation of proposed D-SMOTE and BP-SMOTE
After data pre-processing, the Framingham dataset is checked to see whether it is balanced or not. The output as shown in Fig. 7 indicates that out of 4240 observations, 3596 are in majority class (negative) and 644 are in minority class (positive) which clearly shows that it is an imbalanced dataset.
Fig. 7.

Checking Framingham dataset for imbalance
To balance this imbalanced dataset, three sampling techniques namely Oversampling, Undersampling and hybrid sampling were processed to examine which method provides better evaluation metrics, in terms of Accuracy, Kappa, Sensitivity, Specificity, Recall, Error Rate, Precision, F-measure and ROC Curve. It was observed that Oversampling is a better technique compared to Undersampling or hybrid sampling (Mrudula and Mary Sowjanya 2020b).
Since SMOTE is reported to be a well-known sampling technique where minority class is oversampled by synthetic minority oversampling in feature vector, it is proposed to modify the original SMOTE further, in terms of Distance-based SMOTE (D-SMOTE) and Bi-phasic SMOTE (BP-SMOTE). The proposed techniques are then evaluated with different classifiers, Linear regression (LR), Decision tree (BT), Boosting and Random Forest (RF) to see which classifier provides better evaluation metrics (Fig. 8). The data obtained related to Accuracy, Precision, Recall and ROC Curve for D-SMOTE and BP-SMOTE in combination with LR, DT, Boosting and RF classifiers are listed in Table 1 .
Fig. 8.
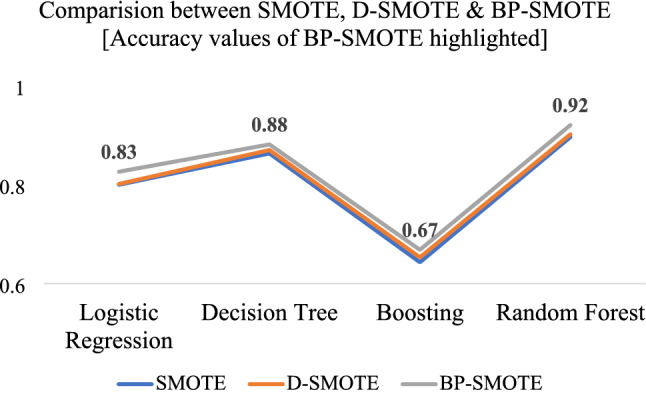
Comparison between SMOTE, D-SMOTE and BP-SMOTE
Table 1.
Performance metrics for proposed techniques with various classifiers
| Proposed techniques with classifiers | Evaluation metrics | |||
|---|---|---|---|---|
| Accuracy | Precision | Recall | ROC Curve | |
| D-SMOTE + LR | 0.8013 | 0.7812 | 0.7049 | 0.8309 |
| D-SMOTE + DT | 0.8699 | 0.8427 | 0.8133 | 0.8827 |
| D-SMOTE + BOOSTING | 0.6529 | 0.6379 | 0.6252 | 0.6756 |
| D-SMOTE + RF | 0.9018 | 0.8817 | 0.8723 | 0.9102 |
| BP-SMOTE + LR | 0.8261 | 0.7973 | 0.7206 | 0.8610 |
| BP-SMOTE + DT | 0.8713 | 0.8532 | 0.8301 | 0.8942 |
| BP-SMOTE + BOOSTING | 0.6681 | 0.6482 | 0.6407 | 0.6893 |
| BP-SMOTE + RF | 0.9204 | 0.8932 | 0.8816 | 0.9196 |
Among the four classifiers, RF proved to yield high values for evaluation metrics both for D-SMOTE and BP-SMOTE. Finally, a comparison of accuracy values obtained for SMOTE, D-SMOTE and BP-SMOTE in comparison with LR, DT, Boosting and RF classifiers are given in Table 2.
Table 2.
Accuracy metrics for SMOTE, D-SMOTE and BP-SMOTE
| SMOTE | D-SMOTE | BP-SMOTE | |
|---|---|---|---|
| LR | 0.7998 | 0.8013 | 0.8261 |
| DT | 0.8631 | 0.8699 | 0.8813 |
| Boosting | 0.6430 | 0.6529 | 0.6681 |
| RF | 0.8963 | 0.9018 | 0.9204 |
From the data presented in Table 2, it is apparent that the accuracy obtained for BP-SMOTE is higher than that of D-SMOTE which in turn is higher than that for SMOTE. Though the observed increase in accuracy is only 3% from 79 to 82%, it is still significant in Health care.
Disease prediction accuracy
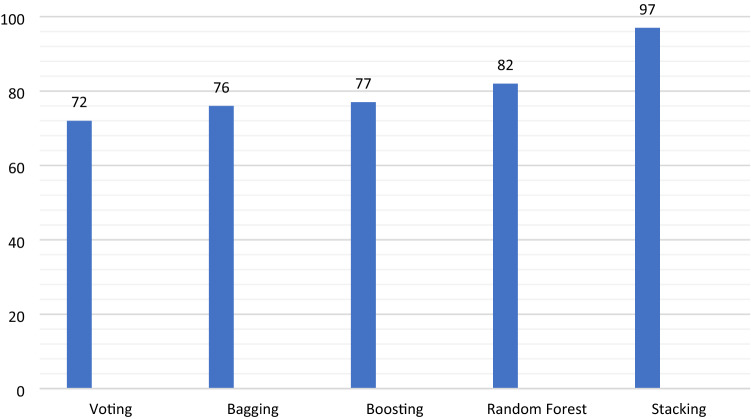
Breast cancer dataset used in the Ensemble framework is trained and tested for every individual classifier (Logistic Regression, SVM, Naïve Bayes, etc.). Tenfold cross-validation is used for accurate prediction and to limit problems like overfitting. For both training and validation, repeated random sub-sampling is done so each observation is used exactly once for validation. The accuracy values obtained for the ensemble methods Voting, Bagging, Boosting, Random Forest and Stacking are depicted in Fig. 9.
Fig. 9.
Comparison of ensemble methods with stacking
From the observed variations in accuracy, it may be observed that stacking provides accuracy as high as 97%. The observed trend in accuracy may be denoted as
Figure 10 gives the performance of individual classifiers as compared to stacking ensemble of the same classifiers under study in terms of accuracy. From the figure, it is apparent that neural network classifier gave the lowest accuracy of 69%, while decision tree and Naive Bayes classifiers yielded approximately the same accuracy of 94%. Nevertheless, the stacking ensemble comprising the three showed higher accuracy of 97%. The observed trend in accuracy may be represented as
Fig. 10.
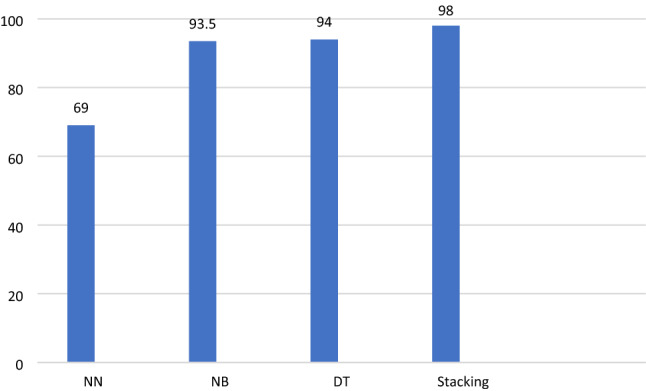
Meta-classifier stacking with individual classifiers
The increased accuracy due to Stacking suggests that more accurate predictions can be done in the case of tumors as to whether they are cancerous or non-cancerous using stacking approach which provided a synergetic effect in augmenting the accuracy.
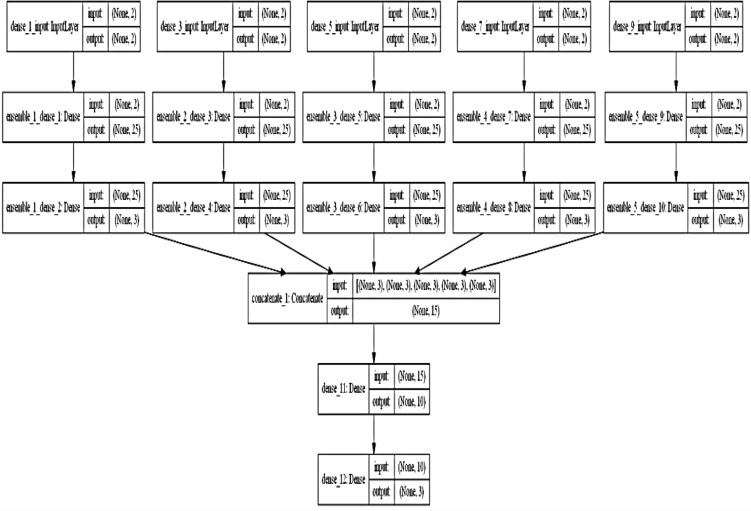
The dense layer constructed for stacked CNN model on the breast cancer dataset is shown in Fig. 11.
Fig. 11.
Dense layer for Stacked CNN for breast cancer dataset
Figure 12 shows a comparison of accuracy obtained from the proposed stacked CNN model with other individual classifiers like Naïve Byes, Decision Tree, SVM and Neural Network.
Fig. 12.
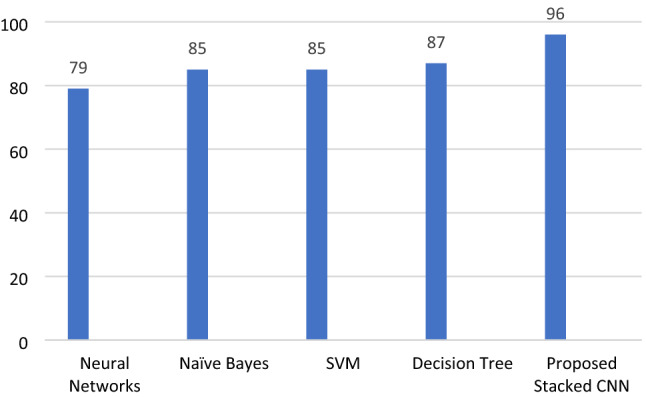
Comparing the proposed Stacked CNN with other classifiers
The proposed Stacked RNN model uses COVID-19 Data for time-series forecasting and is compared with the available state of the art models like Simple RNN, LSTM, a combination of RNN and LSTM in view of accuracy, Mean Squared Error (MSE), F1-Score and Kappa Score as shown in Table 3.
Table 3.
Evaluation metrics obtained for RNN, LSTM, RNN + LSTM and Stacked RNN
| Evaluation metrics | Simple RNN | LSTM Model | RNN + LSTM | Stacked RNN |
|---|---|---|---|---|
| Accuracy | 0.77 | 0.84 | 0.89 | 0.97 |
| MSE | 0.23 | 0.15 | 0.11 | 0.03 |
| F1-score | 0.77 | 0.85 | 0.90 | 0.94 |
| Kappa score | 0.54 | 0.65 | 0.83 | 0.90 |
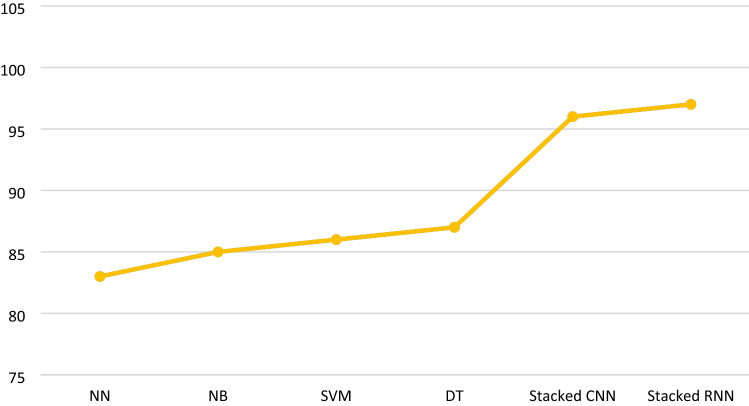
From the data presented in Table 3, it can be clearly concluded that Stacked RNN provides better evaluation metrics when compared to other classifiers. Finally, a overall comparison of accuracy values obtained for different classifiers Naïve Bayes, Decision Tree, SVM, Neural Networks, Stacked CNN and Stacked RNN are portrayed in Fig. 13.
Fig. 13.
Comparison of accuracy obtained with individual classifiers and proposed models
From the above figure, it can be seen that proposed Stacked CNN and Stacked RNN methods provide much higher accuracy around 96–97%, while all other methods yield an accuracy of 83–87%. Such an increase in accuracy due to stacking shall be of prime importance in Health care.
Conclusions
Analysis of imbalanced datasets leads to less accurate predictions unless the datasets are properly balanced after pre-processing. The sampling techniques normally used in such cases are Oversampling, Undersampling and hybrid sampling. SMOTE is one of the most commonly used Oversampling technique for dealing with unbalanced datasets. In the current study, two modifications to SMOTE have been proposed in terms of distance-based and instance-based sampling, respectively, to generate new synthetic positive samples. Different classifiers have been studied in combination with SMOTE, D-SMOTE and BP-SMOTE for performance comparison in terms of accuracy. Both D-SMOTE and BP-SMOTE yielded slightly higher accuracy compared to original SMOTE. To further increase the accuracy, a stacking approach has been proposed in terms of Stacked CNN and Stacked RNN. Compared to individual classifiers, stacking ensemble yielded significantly higher accuracy displaying a synergetic effect. The individual classifiers of Neural Networks, SVM, Naïve Bayes and Decision Tree showed accuracies of 83, 86, 85 and 87%, respectively, whereas Stacked CNN and Stacked RNN yielded accuracies of 96 and 97%, respectively. The enhanced increment in accuracy is significant since this provides a better prediction in Health care.
Declarations
Conflict of interest
Author declared there is no conflict of interest statement.
Footnotes
Publisher's Note
Springer Nature remains neutral with regard to jurisdictional claims in published maps and institutional affiliations.
References
- Ali A, Shamsuddin SM, Ralescu AL. Classification with class imbalance problem: a review. Int J Adv Soft Comput Appl. 2015;7(3):176–204. [Google Scholar]
- Bajer D, Zorić B, Dudjak M, Martinović G (2019) Performance analysis of SMOTE-based oversampling techniques when dealing with data imbalance. In: Proceedings of the 26th International Conference on Systems, Signals and Image Processing, Osijek, Croatia, p 265–271
- Batista GE, Prati RC, Monard MC. A study of the behavior of several methods for balancing machine learning training data. ACM SIGKDD Explor Newsl. 2004;6(1):20–29. doi: 10.1145/1007730.1007735. [DOI] [Google Scholar]
- Bunkhumpornpat C, Sinapiromsaran K, Lursinsap C (2009) Safe-level-smote: safe-level-synthetic minority over-sampling technique for handling the class imbalanced problem. In: Proceedings of the 13th Pacific-Asia Conference on Knowledge Discovery and Data Mining, Bangkok, Thailand, p 475–482
- Burez J, Van den Poel D. Handling class imbalance in customer churn prediction. Expert Syst Appl. 2009;36(3):4626–4636. doi: 10.1016/j.eswa.2008.05.027. [DOI] [Google Scholar]
- Chawla NV, Bowyer KW, Hall LO, Kegelmeyer WP. SMOTE: synthetic minority over-sampling technique. J Artif Intell Res. 2002;16:321–357. doi: 10.1613/jair.953. [DOI] [Google Scholar]
- Chen M, Hao Y, Hwang K, Wang L, Wang L. Disease prediction by machine learning over big data from healthcare communities. IEEE Access. 2017;5(1):8869–8879. doi: 10.1109/ACCESS.2017.2694446. [DOI] [Google Scholar]
- Chon Ho Yu. Exploratory data analysis in the context of data mining and resampling. Int J Psychol Res. 2010;3(1):9–22. doi: 10.21500/20112084.819. [DOI] [Google Scholar]
- Dudjak M, Martinović G. In-depth performance analysis of SMOTE-based oversampling algorithms in binary classification. Int J Electr Comput Eng Syst. 2020 doi: 10.32985/ijeces.11.1.2. [DOI] [Google Scholar]
- Fernández A, García S, Herrera F, Chawla NV. SMOTE for learning from imbalanced data: progress and challenges, marking the 15 year anniversary. J Artif Intell Res. 2018;61:863–905. doi: 10.1613/jair.1.11192. [DOI] [Google Scholar]
- Folake A, Ambrose A, Oyinloye OE. Stacked ensemble model for hepatitis in healthcare system. Int J Comput Organ Trends. 2019;9(4):25–29. doi: 10.14445/22492593/IJCOT-V9I4P305. [DOI] [Google Scholar]
- García V, Mollineda RA, Sánchez JS. On the k-NN performance in a challenging scenario of imbalance and overlapping. Pattern Anal Appl. 2008;11(3–4):269–280. doi: 10.1007/s10044-007-0087-5. [DOI] [Google Scholar]
- Han H, Wang WY, Mao BH. Borderline-SMOTE: a new over-sampling method in imbalanced data sets learning. In: Huang DS, Zhang XP, Huang GB, editors. Advances in intelligent computing. ICIC 2005. Lecture notes in computer science. Berlin, Heidelberg: Springer; 2005. [Google Scholar]
- Hooda S, Mann S. Distributed synthetic minority oversampling technique. Int J Comput Intell Syst. 2019;12(2):929–936. doi: 10.2991/ijcis.d.190719.001. [DOI] [Google Scholar]
- https://archive.ics.uci.edu/ml/datasets/breast+cancer+wisconsin+%28original%29
- https://www.kaggle.com/amanajmera1/framingham-heart-study-dataset
- https://www.kaggle.com/sudalairajkumar/novel-corona-virus-2019-dataset
- Hu F, Li H. A novel boundary oversampling algorithm based on neighborhood rough set model: NRSBoundary-SMOTE. Math Probl Eng. 2013 doi: 10.1155/2013/694809. [DOI] [Google Scholar]
- Hu Z, Qiu H, Su Z, Shen M, Chen Z. A stacking ensemble model to predict daily number of hospital admissions for cardiovascular diseases. IEEE Access. 2020;8:138719–138729. doi: 10.1109/ACCESS.2020.3012143. [DOI] [Google Scholar]
- Hussein AS, Li T, Yohannese CW, Bashir K. A-SMOTE: a new preprocessing approach for imbalanced datasets by improving SMOTE. Int J Comput Intell Syst. 2019;12(2):1412–1422. doi: 10.2991/ijcis.d.191114.002. [DOI] [Google Scholar]
- Kovács G. An empirical comparison and evaluation of minority oversampling techniques on a large number of imbalanced datasets. Appl Soft Comput. 2019;83:105662. doi: 10.1016/j.asoc.2019.105662. [DOI] [Google Scholar]
- Krstanovic S, Paulheim H. Ensembles of recurrent neural networks for robust time series forecasting, artificial intelligence XXXIV. SGAI 2017. Lecture notes in computer science. Cham: Springer; 2017. pp. 34–46. [Google Scholar]
- Leoni Sharmila S, Dharuman C, Venkatesan P. Disease classification using machine learning algorithms—a comparative study. Int J Pure Appl Math. 2017;114(6):1–10. [Google Scholar]
- Eldin Masud M, Rashed AE, Hossain MS. Convolutional neural network-based models for diagnosis of breast cancer. Neural Comput Appl. 2020 doi: 10.1007/s00521-020-05394-5. [DOI] [PMC free article] [PubMed] [Google Scholar]
- Mrudula O, Mary Sowjanya A. Understanding clinical data using exploratory analysis. Int J Recent Technol Eng (IJRTE) 2020;8(5):5434–5437. doi: 10.35940/ijrte.E6827.018520. [DOI] [Google Scholar]
- Mrudula O, Mary Sowjanya A. A prediction model for imbalanced datasets using machine learning. J Crit Rev. 2020;07(08):2132–2140. [Google Scholar]
- Napierala K, Stefanowski J. Types of minority class examples and their influence on learning classifiers from imbalanced data. J Intell Inf Syst. 2016;46:563–597. doi: 10.1007/s10844-015-0368-1. [DOI] [Google Scholar]
- Rather AM, Arun Agarwal VN, Sastry, Recurrent neural network and a hybrid model for prediction of stock returns. Expert Syst Appl. 2015;42(6):3234. doi: 10.1016/j.eswa.2014.12.003. [DOI] [Google Scholar]
- Seiffert C, Khoshgoftaar TM, Hulse JV, Folleco A. An empirical study of the classification performance of learners on imbalanced and noisy software quality data. Inf Sci. 2014;259:571–595. doi: 10.1016/j.ins.2010.12.016. [DOI] [Google Scholar]
- Shirsath SS. Disease prediction using machine learning over big data. Int J Innov Res Sci. 2018;7(6):6752–6757. [Google Scholar]
- Skryjomski P, Krawczyk B (2017) Influence of minority class instance types on SMOTE imbalanced data oversampling. In: Proceedings of the 1st International Workshop on Learning with Imbalanced Domains: Theory and Applications, Skopje, Macedonia, 74, p 7–21
- Valluri Rishika A, Sowjanya M. Prediction of breast cancer using stacking ensemble approach. Int J Manag Technol Eng. 2019;IX(I):1857–1867. [Google Scholar]
- Vincent P M D, Abirami R. Heart disease prediction system using ensemble of machine learning algorithms. Recent Pat Eng. 2020 doi: 10.2174/1872212113666190328220514. [DOI] [Google Scholar]
- Yao H, et al. Parallel structure deep neural network using CNN and RNN with an attention mechanism for breast cancer histology image classification. Cancers. 2019;11(12):1901. doi: 10.3390/cancers11121901. [DOI] [PMC free article] [PubMed] [Google Scholar]


