

Abstract
The severe acute respiratory syndrome coronavirus 2 (SARS‐CoV‐2) causes the coronavirus disease 2019 (COVID‐19), known to be more common in the elderly, who also show more severe symptoms and are at higher risk of hospitalization and death. Here, we show that the expression of the angiotensin converting enzyme 2 (ACE2), the SARS‐CoV‐2 cell receptor, increases during aging in mouse and human lungs. ACE2 expression increases upon telomere shortening or dysfunction in both cultured mammalian cells and in vivo in mice. This increase is controlled at the transcriptional level, and Ace2 promoter activity is DNA damage response (DDR)‐dependent. Both pharmacological global DDR inhibition of ATM kinase activity and selective telomeric DDR inhibition by the use of antisense oligonucleotides prevent Ace2 upregulation following telomere damage in cultured cells and in mice. We propose that during aging telomere dysfunction due to telomeric shortening or damage triggers DDR activation and this causes the upregulation of ACE2, the SARS‐CoV‐2 cell receptor, thus contributing to make the elderly more susceptible to the infection.
Keywords: Ace2, aging, COVID‐19, DNA damage response, telomere
Subject Categories: DNA Replication, Recombination & Repair; Microbiology, Virology & Host Pathogen Interaction; Molecular Biology of Disease
During aging, telomere dysfunction accumulates and activates a DNA damage response, leading to increase of ACE2, the human SARS‐CoV‐2 receptor. This mechanism may explain the higher susceptibility of elderly to COVID‐19.

Introduction
The severe acute respiratory syndrome coronavirus 2 (SARS‐CoV‐2) is responsible for the recent coronavirus disease 2019 (COVID‐19) pandemic. Patients infected by SARS‐CoV‐2 show a range of symptoms including dry cough, fever, headache, dyspnea, and pneumonia with an estimated mortality rate ranging from 3 to 5% (Huang et al, 2020; Wang et al, 2020).
Recent studies highlighted the important role of the human angiotensin converting enzyme 2 (ACE2) molecule, a regulator of the renin‐angiotensin system (RAS), in mediating cell entry of SARS‐CoV‐2 (Hoffmann et al, 2020; Lan et al, 2020; Walls et al, 2020; Yan et al, 2020). This mechanism is conserved in other viruses, including the closely related SARS‐CoV, although SARS‐CoV‐2 has a ten times higher affinity to ACE2, which is consistent with its higher infectiousness (Hoffmann et al, 2020; Zhou et al, 2020). Indeed, HeLa cells become susceptible to SARS‐CoV‐2 infection only if expressing ACE2 (Zhou et al, 2020). These findings indicate that binding to the ACE2 receptor is a critical initial step for SARS‐CoV‐2 to infect target cells and is crucial for human infection and that the expression and distribution of the ACE2 receptor may be relevant for the progression and prognosis of COVID‐19. An analysis of single‐cell RNA sequencing data obtained from 43,134 human lung cells revealed that only 0.64% of cells in lungs express Ace2, which was mostly found on the surface of alveolar epithelial type II cells (ATII). Other types of cells, including alveolar epithelial type I cells (ATI), airway epithelial cells, fibroblasts, endothelial cells, and macrophages, also express ACE2 but at lower levels (Zhao et al, 2020). This indicates that ATII cells are likely to be the primary target of SARS‐CoV‐2 infection in the lungs. Since SARS‐CoV‐2 mainly spreads via respiratory droplets, and ACE2 is mostly expressed by ATII cells, the lung is the first target organ for SARS‐CoV‐2 infection, and indeed, pneumonia is the most common complication seen in COVID‐19 patients with an occurrence of 91.1% (Guan et al, 2020).
The severity of the infection correlates with the age of patients, suggesting that aging is an important risk factor influencing the outcome of the disease (Verity et al, 2020). According to a study of 1,099 patients with COVID‐19, the average age of the patients that develop severe symptoms was significantly higher than the age of those with non‐severe symptoms (Wang et al, 2020). Among the COVID‐19 patients with severe symptoms, the age of non‐survivors (64.6 years) was higher than the survivors (51.9 years) (Verity et al, 2020). These results indicate that aging correlates with the severity of pathological progression and poor prognosis of COVID‐19. The reasons for the development of severe symptoms in the elderly compared with young individuals are still under intense investigation. ACE2 expression has been positively related to patients’ age (Lukassen et al, 2020; Beyerstedt et al, 2021). Indeed, there is evidence showing age‐dependent expression of ACE2 in nasal epithelium, the first point of contact for SARS‐CoV‐2 (Bunyavanich et al, 2020). Lower ACE2 expression in children relative to adults may help explain why COVID‐19 is less prevalent in children (Lingappan et al, 2020). These results were also confirmed experimentally in mice, with ACE2 expression increasing with age in different organs, including lungs (Yee et al, 2020). However, some reports have questioned the increase in ACE2 levels in lung during aging (Xudong et al, 2006; Chen et al, 2020). Since age‐dependent ACE2 expression is a feature conserved across species, mouse models can be used to further investigate this phenomenon and to elucidate the underlying molecular mechanisms, and design possible interventions.
During aging, telomeres progressively shorten and/or accumulate damage in several tissues and organs in different species including humans (Demanelis et al, 2020; Vaiserman & Krasnienkov, 2021). Telomeres are the regions at the ends of linear chromosomes and in vertebrates are composed of large track of canonical TTAGGG repeats. A protein complex named shelterin is bound to telomeric DNA and protects it from being recognized as DNA damage (DD), thus preventing DNA damage responses (DDR) (Palm & De Lange, 2008). Standard DNA polymerases cannot fully replicate linear DNA templates; thus, in the absence of the reverse transcriptase telomerase and also due to additional exonucleolytic activities, DNA replication results in the generation of chromosomes with progressively shortened telomeres (Harley et al, 1990). When telomeres become critically short, they are sensed as DNA double‐stranded breaks (DSBs) and activate DDR pathways (d’Adda di Fagagna et al, 2003; Herbig et al, 2004). This involves the activation of protein kinase ataxia telangiectasia mutated (ATM), which phosphorylates the histone variant H2AX at serine 139 (named γH2AX), favoring the secondary recruitment of additional DDR factors including p53‐binding protein 1 (53BP1) to form so‐called DDR foci (Polo & Jackson, 2011; Dantuma & van Attikum, 2016).
Non‐coding RNA is emerging as a novel key regulator of the DDR pathways. Damage‐induced long non‐coding RNAs (dilncRNAs) and their processed forms named DNA damage response RNAs (DDRNAs) are generated at sites of DSBs, and they are necessary for full DDR activation, as demonstrated by the observation that antisense oligonucleotides (ASOs) against them inhibit DDR foci formation downstream of γH2AX (Francia et al, 2012; Michelini et al, 2017; Pessina et al, 2019). Similar to DSBs, telomere dysfunction induces their transcription and inhibition of telomeric ncRNA (tncRNA) by sequence‐specific telomeric ASOs (tASOs) prevents DDR activation in cultured cells and in vivo in mice (Rossiello et al, 2017).
The impact of telomere shortening on organismal aging in animal models has been studied upon genetic inactivation of telomerase, for instance by deletion of the RNA component Terc (Terc−/−) in mice. Successive inbreedings of these mice lead to progressive telomere shortening and DDR activation at telomeres, and the accumulation of features of aging and aging‐related diseases (Blasco et al, 1997). In addition, telomeres are prone to accumulate DNA damage and markers of DDR activation independently from their length (Fumagalli et al, 2012; Hewitt et al, 2012). This is also because telomeric DNA is more prone to oxidative DNA damage (8‐oxodG) (Barnes et al, 2019), and since damage at telomeres is less repairable, this causes persistent DD and protracted DDR activation (Fumagalli et al, 2012).
In the present study, we aimed to better characterize the regulation of ACE2 expression during aging following telomere shortening and DDR activation.
Results and Discussion
In order to better characterize the modulation of ACE2 expression during aging, and the underlying potential molecular mechanisms, we studied the expression of ACE2 in mouse and human lungs at different ages.
We observed an increase in Ace2 mRNA levels (Fig 1A) in lungs of old mice (22–24 months) compared with young mice (2–3 months) as detected by RT‐qPCR. Immunohistochemistry (IHC) of the same lungs confirmed and extended this observation to the ACE2 protein, which was detected in both pneumocytic and stromal/inflammatory elements in the lungs of old mice (Fig 1B). Quantitative analyses of IHC staining showed a significant increase in terms of signal density in old mice compared with young ones (Fig 1B).
Figure 1. ACE2 expression increases during aging in mouse and human lungs.
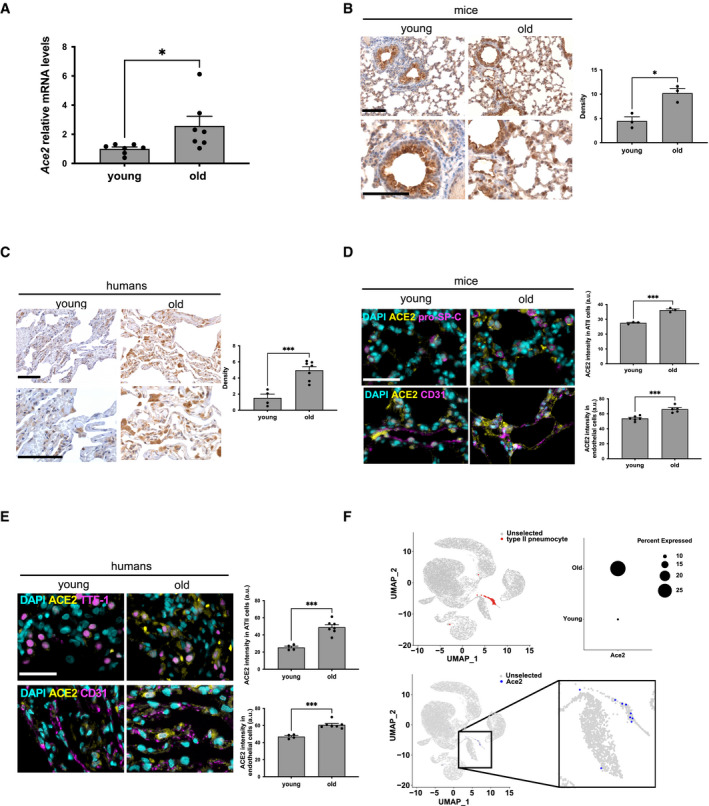
- RT‐qPCR detection of Ace2 mRNA expression levels in lungs from young (2–3 months) and old (22–24 months) mice (n = 7 mice per group).
- Representative microphotographs and quantitative analyses of ACE2 immunohistochemical staining in lungs from young (2 months) and old (22 months) mice (n = 3 mice per group). Scale bar, 200 µm.
- Representative microphotographs and quantitative analyses of ACE2 immunohistochemical staining in lung parenchyma of young (20–35 years old) and old (60–80 years old) humans (n = 4–7 individuals per group). Scale bar, 200 µm.
- Double‐marker immunofluorescence and quantitative analyses of ACE2 intensity level in pro‐SP‐C‐positive type II pneumocytic and CD31‐positive endothelia in lungs from young and old mice (n = 3–6 mice per group). Scale bar, 100 µm. a.u. = arbitrary units.
- Double‐marker immunofluorescence and quantitative analyses of ACE2 intensity level in TTF‐1‐positive type II pneumocytic and CD31‐positive endothelia in lungs from young and old humans (n = 4–7 individuals per group). Scale bar, 100 µm. a.u. = arbitrary units.
- Single‐cell transcriptomic data from aging tissues in the mouse lung from Tabula Muris Senis. Upper left panel: uniform manifold approximation and projection (UMAP) of cell identity with ATII cells represented as red dots. Upper right panel: dot plot of Ace2 expression according to age (young = 3 months; old = 30 months). Dot size represents fraction of cells expressing a given gene. Lower panel: UMAP of Ace2 expressing cells depicted as blue dots.
Data information: In (A–E), data are presented as mean ± SEM. *P < 0.05, ***P < 0.001 two‐sided unpaired Student's t‐test.
Prompted by these observations in mice, we extended them to human lung tissue samples by comparing ACE2 immunostaining in histologically normal lung parenchyma of old (60–80 years old) and young (20–35 years old) subjects. ACE2 protein expression levels in old subjects were higher than that of young subjects, as shown and quantified in Fig 1C.
Emerging evidence can be interpreted to suggest that the severity of SARS‐CoV‐2 infection correlates with high rates of alveolar epithelial type II (ATII) cell infection (Yee et al, 2020). To confirm that ACE2 increase occurs in ATII cells, we performed double‐marker immunofluorescence for ACE2 and markers identifying ATII cells (pro‐SP‐C in mice or TTF‐1 in humans) in lung samples at different ages. Immunofluorescence revealed that ACE2 expression in ATII pneumocytes increased with aging (Fig 1D and E), and a similar increase was observed in other cell types (Fig EV1A and B), including endothelial CD31‐positive cells (Fig 1D and E). To further investigate the differential expression of Ace2 transcripts, we took advantage of the single‐cell transcriptomic mouse atlas spanning different ages (Almanzar et al, 2020) and we focused on lung expression data. We observed that Ace2 showed an ATII pneumocyte‐preferential expression that increased upon aging, while the housekeeping gene Gapdh was widely expressed in almost all cell types and did not change at the analyzed ages (Figs 1F and EV1C and D). These conclusions are consistent with similar analyses performed on non‐human primates (Ziegler et al, 2020).
Figure EV1. ACE2 expression analysis in non‐ATII cells in human and mouse lung by immunofluorescence, and in ATII cells by single‐cell transcriptomic analysis in mouse lung.
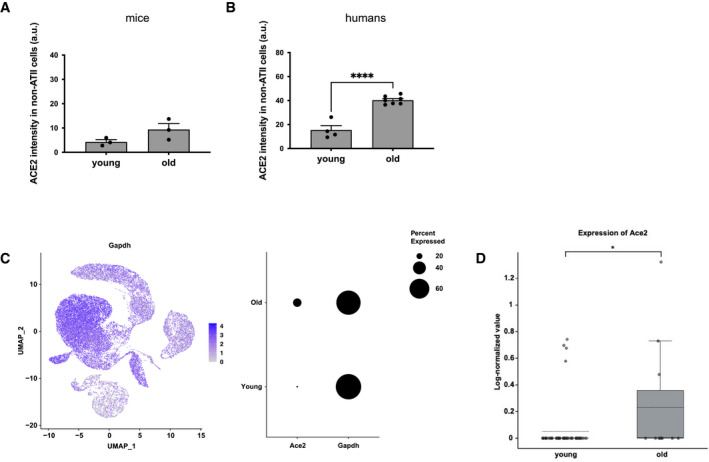
- Quantitative analysis of ACE2 intensity level in pro‐SP‐C‐negative cells in lungs from young and old mice (n = 3 mice per group).
- Quantitative analysis of ACE2 intensity level in TTF‐1‐negative cells in lungs from young and old humans (n = 4–7 individuals per group).
- Single‐cell transcriptomic data in the mouse lung from Tabula Muris Senis. Left panel: UMAP of Gapdh expressing cells depicted as blue dots, with increasing color gradient according to expression intensity. Right panel: dot plot of Ace2 and Gapdh expression according to age (young = 3 months; old = 30 months). Dot size represents fraction of cells expressing a given gene.
- Boxplot of Ace2 expression levels in type II pneumocytes of young (3 months) and old (30 months) mice from single‐cell transcriptomic data of aging tissues in the mouse lung from Tabula Muris Senis. The central dashed line, box edges, and whiskers indicate, respectively, the mean, upper and lower quartiles, and upper and lower fences.
Data information: In (A, B), data are presented as mean ± SEM. *P < 0.05, ****P < 0.0001. Two‐sided unpaired Student's t‐test (A,B) or one‐tailed Wilcoxon test (D).
In order to unravel the molecular mechanism controlling the upregulation of ACE2 during aging, we took advantage of in vitro and in vivo models, which recapitulate some key aspects of aging. Aging is associated with telomere shortening and damage in several tissues (Fumagalli et al, 2012; Hewitt et al, 2012; Demanelis et al, 2020; Vaiserman & Krasnienkov, 2021), and COVID‐19 patients with short telomeres measured in leukocytes have been proposed to be at increased risk of death (Aviv, 2020). To test whether telomere shortening is sufficient to modulate ACE2 expression, we measured its mRNA levels in human fibroblasts (BJ) and human bronchial epithelial cells (HBECs) at different population doublings—both cell types lack telomere maintenance mechanisms and undergo progressive telomere shortening upon proliferation (Fig EV2A and B) (Huffman et al, 2000; Peters‐Hall et al, 2018). Both late passage BJ and HBEC had increased levels of ACE2 mRNA, compared to cells at early passages (Fig 2A and B). Recently, a shorter human ACE2 splicing isoform has been described and proposed to be upregulated by interferon response upon infection by different viruses (but not SARS‐CoV‐2). Such shorter splice isoform lacks the extracellular domain used as viral binding site by SARS‐CoV‐2 (Blume et al, 2021). The use of isoform‐specific primers in RT‐qPCR allowed us to demonstrate that the long isoform was confirmed to increase with passage number, while the short one was expressed at lower levels and did not increase in late passages cells (Fig EV2C).
Figure EV2. Telomere length and ACE2 isoform expression in human senescent cells.
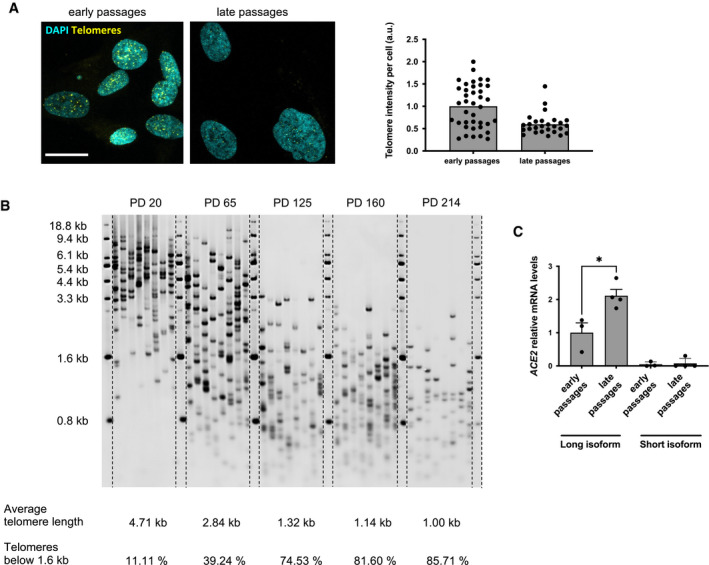
- Representative image and quantification of the FISH signal using a telomeric PNA probe in early (PD 36.5) and late (PD 62) passage BJ. Scale bar, 20 µm. a.u. = arbitrary units.
- The average and shortest telomere distribution in HBEC at the indicated PDs, as detected by Telomere Shortest Length Assay (TeSLA).
- RT‐qPCR detection of ACE2 mRNA expression levels in early passages (PD 35) and late passages (PD 61–64) BJ, using primers specific for the long and short isoform (n = 3–4 replicates per group).
Data information: In (C), data are presented as mean ± SEM. *P < 0.05. Two‐sided unpaired Student's t‐test.
Figure 2. ACE2 levels increase upon telomere shortening in human cells and in lungs of G3 Terc−/− mice.
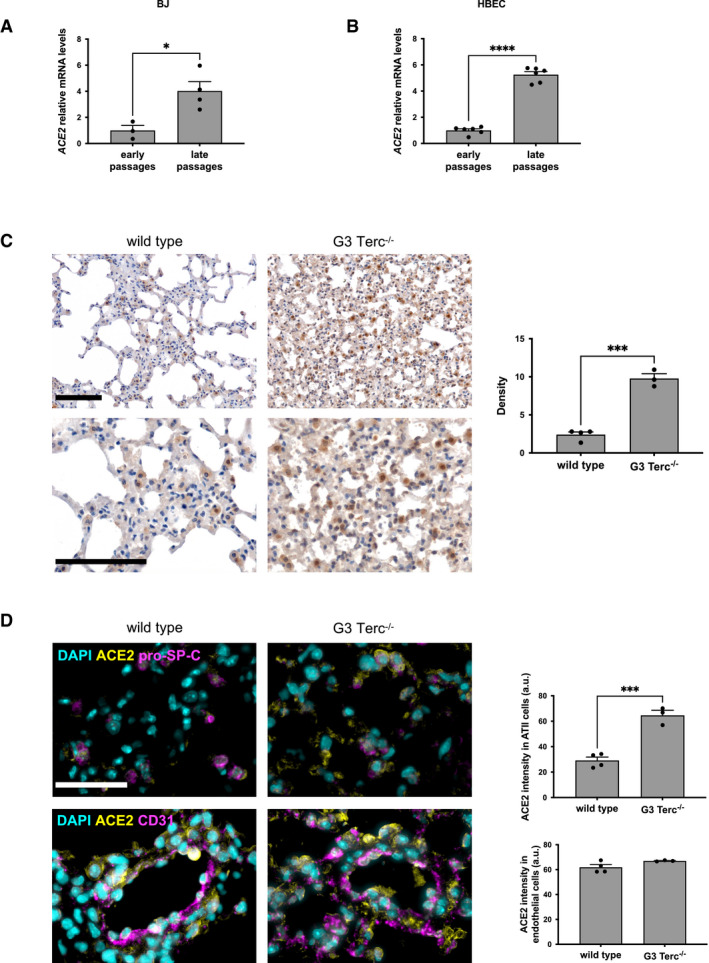
- RT‐qPCR detection of ACE2 mRNA expression levels in early passages (PD 34–37) and late passages (PD 61‐64) human normal fibroblasts (BJ) (n = 3–4 replicates per group).
- ddPCR detection of ACE2 mRNA expression levels in early passages (PD 22.37) and late passages (PD 140) human bronchial epithelial cells (HBEC) (n = 6 replicates per group).
- Representative images and quantitative analyses of ACE2 immunohistochemical staining in lungs of age‐matched wild‐type and G3 Terc−/− mice (n = 3–4 mice per group). Scale bar, 200 µm.
- Double‐marker immunofluorescence and quantitative analyses of ACE2 intensity level in pro‐SP‐C‐positive type II pneumocytic and CD31‐positive endothelia in lungs of age‐matched wild‐type and G3 Terc−/− mice (n = 3–4 mice per group). Scale bar, 100 µm. a.u. = arbitrary units.
Data information: In (A–D), data are presented as mean ± SEM. *P < 0.05, ***P < 0.001, ****P < 0.0001. Two‐sided unpaired Student's t‐test.
We next extended our studies to a mouse model lacking the RNA component of telomerase (Terc−/−), which, at late generations, shows telomere shortening (Fig EV3A) and recapitulates several features of human aging in different tissues (Lee et al, 1998; Rudolph et al, 1999; Giorgio et al, 2016), including lungs (Piñeiro‐Hermida et al, 2020). When we analyzed the expression level of ACE2 protein in the lungs of the third generation (G3) of Terc−/− mice, we observed a consistent increase in ACE2 expression when compared to age‐ and sex‐matched wild‐type animals (Fig 2C). Immunofluorescence imaging with specific cell markers demonstrated that ACE2 increased mainly in ATII pneumocytes expressing pro‐SP‐C (Fig 2D), with a significant increase also in pro‐SP‐C‐negative cells (Fig EV3B), although no significant difference was observed specifically in the endothelial cells (Fig 2D). The results obtained in vitro and in vivo clearly point to the role of telomeric shortening in the regulation of ACE2 levels in human cells and mouse tissues.
Figure EV3. Telomere length and ACE2 levels in non‐ATII cells in the lung of G3 Terc−/− mice.
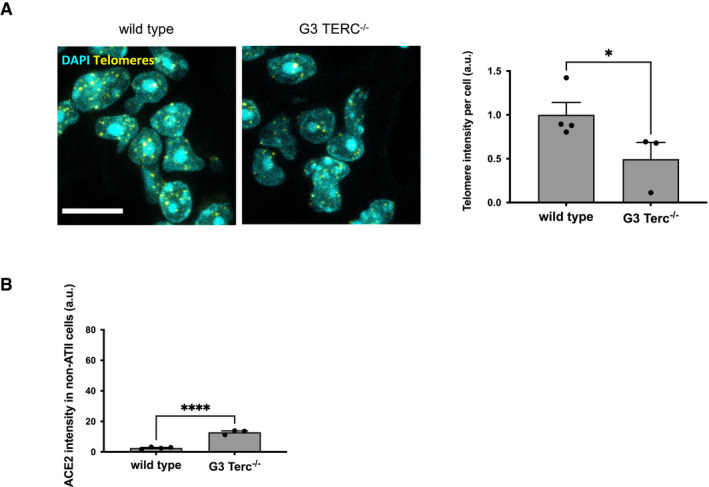
- Representative image and quantification of the FISH signal using a telomeric PNA probe in the lungs from wild‐type or G3 Terc−/− mice. Scale bar, 10 µm. a.u. = arbitrary units (n = 3–4 mice per group).
- Quantitative analysis of ACE2 intensity level in pro‐SP‐C‐negative cells in lungs from wild‐type or G3 Terc−/− mice. a.u. = arbitrary units (n = 3–4 mice per group).
Data information: In (A‐B), data are presented as mean ± SEM. *P < 0.05, ****P < 0.0001. Two‐sided unpaired Student's t‐test.
When telomeres become critically short, they activate the DNA damage response (DDR) pathway (d’Adda di Fagagna et al, 2003; Herbig et al, 2004). To test whether telomeric DDR is sufficient to increase ACE2 mRNA levels, we used two mammalian cell systems, which allow the activation of the DDR specifically at telomeres, in the absence of telomere shortening. TRF2, a component of the shelterin complex, prevents telomeric DNA from being recognized as DD and thus preventing the activation of DDR (Palm & De Lange, 2008).
We used Trf2 conditional knockout mouse embryonic fibroblasts (MEFs Trf2F/F) carrying a Cre recombinase (Rosa26‐CreERT2) inducible by 4‐hydroxytamoxifen (4OHT) (Okamoto et al, 2013) and HeLa cells with a doxycycline‐regulated expression of a short hairpin against TRF2 (HeLa shTRF2) to knockdown TRF2 expression (Grolimund et al, 2013).
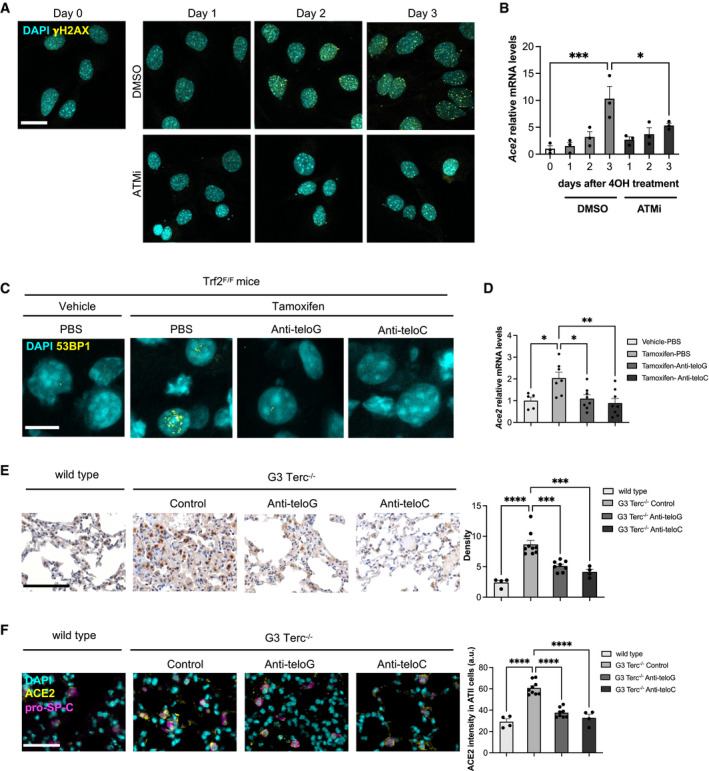
TRF2 knockout or knockdown led to telomeric DDR activation as shown by increased levels of γH2AX foci and telomeric damage‐induced long non‐coding RNA (tdilncRNA) in both cell systems (Rossiello et al, 2017) (Figs 3A and C, and EV4A–D). In both models, DDR foci increase accompanied an increase in ACE2 mRNA levels (Fig 3B and D). Interestingly, DDR activation following ionizing radiation (IR) in the same cell lines (Fig EV5A and C) drove a similar increase in ACE2 mRNA levels (Fig EV5B and D), indicating that DDR signaling pathways mediate this response. To verify the effects of telomeric DDR in vivo, we next used an inducible Trf2 knockout mouse model (Trf2F/F mice) (Rossiello et al, 2017) in which, following tamoxifen administration, Trf2 expression is lost, leading to DDR activation at telomeres as shown by the accumulation of foci of 53BP1 (Fig 3E). Parallel to DDR activation, we observed an increase in Ace2 mRNA levels in the liver upon tamoxifen administration (Fig 3F), demonstrating that also in vivo the activation of DDR at telomeres leads to increased Ace2 expression. Taken together, these results in human and mouse cell lines and in mouse tissues indicate a conserved role for the activated DDR pathways in modulating ACE2 levels. Since during physiological aging telomeric DDR accumulates, this likely contributes to the increased ACE2 levels.
Figure 3. DDR activation induces ACE2 expression in cultured cells and in vivo .
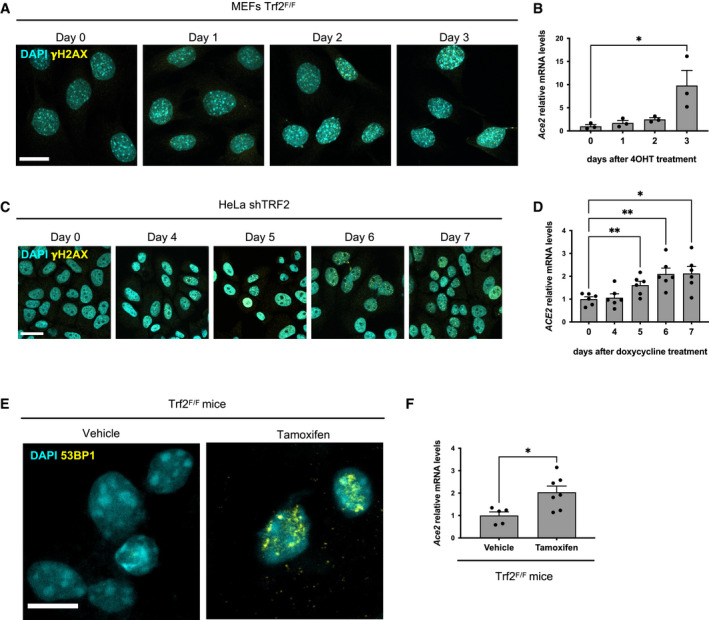
- Immunofluorescence showing γH2AX foci in MEFs Trf2F/F at the indicated time points following 4OHT treatment and consequent TRF2 knockout. Scale bar, 25 µm.
- RT‐qPCR detection of Ace2 mRNA expression levels in MEFs Trf2F/F treated as in A (n = 3 independent experiments).
- Immunofluorescence showing γH2AX foci in HeLa shTRF2 cells at the indicated time points following doxycycline treatment and consequent TRF2 knockdown. Scale bar, 25 µm.
- RT‐qPCR detection of ACE2 mRNA expression levels in HeLa shTRF2 cells treated as in C (n = 6 independent experiments).
- Representative immunofluorescence images of 53BP1 staining in liver from Trf2F/F mice treated with tamoxifen (to induce TRF2 loss and telomere uncapping) or vehicle. The animals have been injected also with PBS. Scale bar, 10 µm.
- RT‐qPCR detection of Ace2 mRNA expression levels in livers of mice treated as in E (n = 5–7 mice per group).
Data information: In (B, D, F), data are presented as mean ± SEM. *P < 0.05, **P < 0.01. Two‐sided unpaired Student's t‐test (F) or two‐way paired ANOVA (B, D).
Figure EV4. DDR and tdilncRNA levels upon telomere uncapping in human and mouse cells.
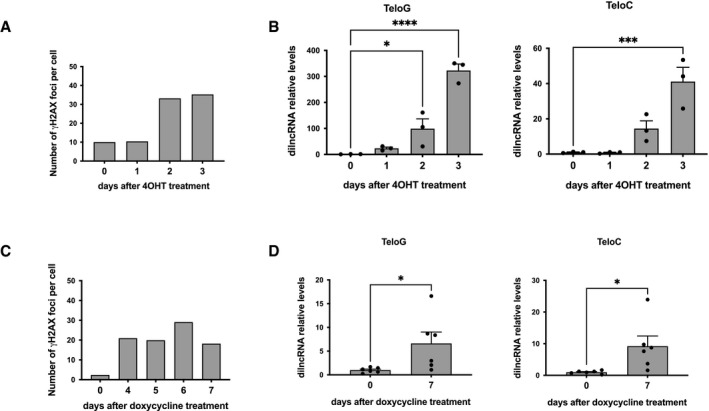
- Quantification of the number of γH2AX foci per cell related to Fig 3A.
- RT‐qPCR detection of telomeric dilncRNA expression levels in MEFs Trf2F/F following 4OHT treatment (n = 3 independent experiments).
- Quantification of the number of γH2AX foci per cell related to Fig 3C.
- RT‐qPCR detection of telomeric dilncRNA expression levels in HeLa shTRF2 following doxycycline treatment (n = 6 independent experiments).
Data information: In (B, D), data are presented as mean ± SEM. *P < 0.05, ***P < 0.001, ****P < 0.0001. Two‐sided paired Student's t‐test (D), two‐way paired ANOVA (B).
Figure EV5. DDR and ACE2 levels upon ionizing irradiation in human and mouse cells.
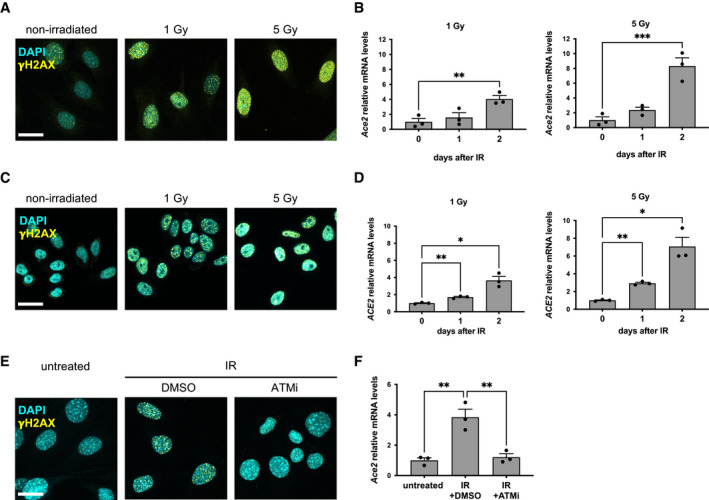
- Immunofluorescence showing γH2AX foci 6 h after the indicated dose of ionizing radiation in MEFs Trf2F/F. Scale bar, 25 µm.
- RT‐qPCR detection of Ace2 expression levels in MEFs Trf2F/F treated as in A (n = 3 independent experiments).
- Immunofluorescence showing γH2AX foci 6 h after the indicated dose of ionizing radiation in HeLa shTRF2. Scale bar, 25 µm.
- RT‐qPCR detection of ACE2 expression levels in HeLa shTRF2 treated as in C (n = 3 independent experiments).
- Immunofluorescence showing γH2AX foci 6 h after 5 Gy of ionizing radiation in MEFs Trf2F/F, treated with DMSO or ATMi. Scale bar 25 µm.
- RT‐qPCR detection of Ace2 expression levels in MEFs Trf2F/F treated as in E (n = 3 independent experiments).
Data information: In (B, D, F), data are presented as mean ± SEM. *P < 0.05, **P < 0.01, ***P < 0.001. Two‐way paired ANOVA.
One possibility is that the increase in ACE2 mRNA levels is caused by augmented activity of its transcriptional promoter. In order to determine whether the ACE2 promoter responds to DDR activation, we performed an in silico analysis to identify the transcription factors whose DNA‐binding motifs are significantly enriched in the promoter region of ACE2. Gene set enrichment analysis of the top 100 transcription factors (Table EV1) potentially associated with the ACE2 promoter revealed the presence of pathways related to the DNA damage response among the ones significantly enriched (Fig 4A) (Dicks et al, 2015; Karimaian et al, 2017; Wang et al, 2017; Mullenders, 2018).
Figure 4. DDR activation mediates transcriptional upregulation of ACE2 gene.
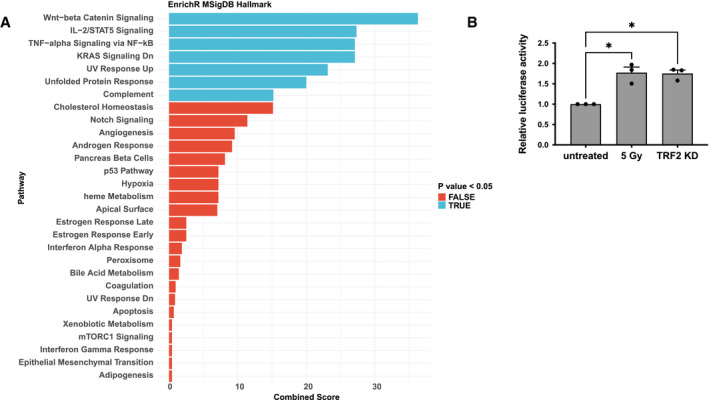
- Gene set enrichment analysis showing enriched pathways from the MSigDB_Hallmark gene set library. Bars are colored according to P‐value, with significantly enriched pathways (P < 0.05) in blue. Combined score: combined value of both the P‐value and z‐score.
- Relative luciferase activity in HeLa shTRF2 following ionizing radiation (5 Gy) or TRF2 knockdown upon doxycycline‐induced shTRF2 expression (n = 3 independent experiments). Error bars represent the SEM. *P < 0.05. Two‐way paired ANOVA.
To experimentally demonstrate that the ACE2 promoter responds to the activation of the DDR pathways, we transfected a plasmid carrying the luciferase reporter gene under the control of human ACE2 promoter in HeLa shTRF2 cells, and we induced telomeric DDR by TRF2 knockdown. Importantly, we observed an increase in luciferase signal upon telomere dysfunction (Fig 4B). Since a similar transcriptional activation was observed also upon DDR activation in irradiated uninduced HeLa cells, this indicates that DDR pathway engagement controls ACE2 promoter activity (Fig 4B).
To further demonstrate that key components of DDR pathways are responsible for the observed increase in Ace2 mRNA levels, we treated MEFs Trf2F/F with the ATM kinase inhibitor KU‐60019 (ATMi) when inducing Trf2 knockout by 4OHT treatment or generating DSBs by IR. While this treatment prevented DDR foci formation as expected (Figs 5A and EV5E), it also significantly reduced Ace2 mRNA level increase (Figs 5B and EV5F), demonstrating ATM kinase activity involvement in the regulation of Ace2 transcript levels.
Figure 5. Selective inhibition of telomeric DDR decreases ACE2 expression in cultured cells and in vivo .
- Immunofluorescence showing γH2AX foci in Trf2F/F MEFs at the indicated time points following 4OHT treatment and consequent TRF2 knockout and treated with DMSO or ATMi. Scale bar, 25 µm.
- RT‐qPCR detection of Ace2 mRNA expression levels in MEFs Trf2F/F treated as in A (n = 3 independent experiments).
- Representative immunofluorescence images of 53BP1 staining in liver from Trf2F/F mice treated with tamoxifen (to induce telomere uncapping) or vehicle and injected with the indicated ASOs or PBS as control. Scale bar, 10 µm.
- RT‐qPCR detection of Ace2 mRNA levels in livers of mice treated as in C (n = 5–8 mice per group).
- Representative microphotographs and quantitative analyses of ACE2 immunohistochemical staining in lungs of age‐matched wild‐type and G3 Terc−/− mice, treated with the indicated ASOs (n = 4–9 mice per group). Scale bar, 200 µm.
- Double‐marker immunofluorescence and quantitative analyses of ACE2 intensity level in pro‐SP‐C‐positive type II pneumocytic cells in lungs of age‐matched wild‐type and G3 Terc−/− mice, treated with the indicated ASOs (n = 4–9 mice per group). Scale bar, 100 µm. a.u. = arbitrary units.
Data information: In (B, D–F), data are presented as mean ± SEM. *P < 0.05, **P < 0.01, ***P < 0.001, ***P < 0.0001. Two‐way paired (B) or unpaired (D‐F) ANOVA.
In order to investigate whether inhibition of telomeric DDR affects the expression of ACE2 also in vivo, we took advantage of telomeric antisense oligonucleotides (tASOs), which allow the specific inhibition of telomeric DDR by targeting tncRNA generated at dysfunctional telomeres and necessary for full DDR activation at telomeres (Michelini et al, 2017; Rossiello et al, 2017; Aguado et al, 2019). To test the impact of selective telomeric DDR inhibition on ACE2 expression following tamoxifen‐induced Trf2 loss, mice were treated with a systemic dose of anti‐teloG or anti‐teloC tASOs, or phosphate‐buffered saline (PBS) as negative control, delivered by intraperitoneal injection. Four days later, when telomeric DDR reached the maximal activation in this model, mice were sacrificed and tissues analyzed. Both tASO treatments were highly effective, as demonstrated by decreased numbers of 53BP1 foci (Fig 5C, Rossiello et al, 2017), that correlate with the downregulation of Ace2 mRNA levels in vivo (Fig 5D).
Stimulated by this result, we extended our studies to the G3 Terc−/− mouse model. We treated 3‐month‐old G3 Terc−/− mice with anti‐teloG or anti‐teloC tASOs or an ASO with an unrelated sequence (Control) by intraperitoneal injection, and we sacrificed them at 12 months of age. Quantitative IHC analyses of ACE2 expression in lungs revealed high levels of the protein in control G3 Terc−/− mice, compared to age‐ and sex‐matched wild‐type animals. Such an expression was significantly reduced by the treatment with either tASOs (Fig 5E), and this occurred also in pro‐SP‐C‐positive ATII cells, as shown by double‐marker immunostaining (Fig 5F). These results also support the notion that it is the ensuing DDR activation, rather than telomeric shortening per se, that is responsible for ACE2 regulation.
Taken together, these results demonstrate that the expression of ACE2, the SARS‐CoV‐2 receptor, is directly modulated by the activation of the DDR pathway at the transcriptional level and that telomere dysfunction is a physiological event able to engage the DDR pathways modulating ACE2 levels.
ACE2 is a potent negative regulator of the renin‐angiotensin system (RAS), which maintains the homeostasis of blood pressure and the balance of fluid and salts (Patel et al, 2017). The homeostasis of RAS is critical for the physiological and pathological regulation in various organs, including the heart, kidneys, and lungs (Patel et al, 2017). ACE2 can degrade angiotensin (Ang) II, which causes vasoconstriction, inflammation, and fibrosis, and converts it into Ang (1‐7), which leads to vasodilation, reduced proliferation, and apoptosis, suggesting that its increase might represent a mechanism to counteract the molecular changes related to aging (Hamming et al, 2007). Although the ACE2 increase in physiological conditions may have positive homeostatic effects, being also the SARS‐CoV‐2 receptor, it favors infectability, thus causing more severe symptoms in the elderly.
The evidence that blocking the interaction between SARS‐CoV‐2 S protein and ACE2 (Monteil et al, 2020) or modulating ACE2 level by different means, including androgen receptor and BET inhibitors (Qiao et al, 2021), can in turn regulate the SARS‐CoV‐2 cell entry suggests that reducing ACE2 expression can have a beneficial effect on COVID‐19 infection rates and on the severity of symptoms.
Here, we have shown that another pathway, the DDR, can be targeted to reduce ACE2 expression and that tASOs are agents effective in controlling ACE2 levels in vivo in mouse tissues, including the lung. In perspective, as ASOs are established medicines approved for a number of disorders (Crooke et al, 2021) and as telomeric DDR increases with age in normal and pathological conditions (Chakravarti et al, 2021) (Rossiello et al, Nature Cell Biology, in press), we suggest that, upon additional validation, tASOs have a potential as therapeutic agents to reduce susceptibility to COVID‐19.
Our evidence that DDR controls ACE2 levels in different organs and in cells of different species and origin suggests that this mechanism is conserved across species and cell types. Since ACE2 is normally expressed also outside the lungs (such as intestine, liver, kidney, testicles, placenta and others), our observations may have a broader impact, beyond COVID‐19. Furthermore, our findings may be relevant also for all those conditions associated with increased DDR, such as those characterized by chronic inflammation, or cancer patients undergoing chemotherapy or radiotherapy.
Materials and Methods
Cells and treatments
Foreskin fibroblast BJ cells (The American Type Culture Collection) were grown in MEM supplemented with 10% fetal bovine serum, 1% glutamine, 10 mM non‐essential amino acids, and 1 mM sodium pyruvate.
Primary human bronchial epithelial cells (HBECs) were co‐cultured with irradiated 3T3 J2 feeder cells with ROCK inhibitor and 2% O2 (ROCKi conditions) as described previously (Peters‐Hall et al, 2018).
MEFs Rosa26‐CreERT2 Trf2F/F (Okamoto et al, 2013), a kind gift from Eros Lazzerini Denchi (National Cancer Institute, NIH, Bethesda, USA), were grown in DMEM supplemented with 10% fetal bovine serum and 1% glutamine; for CreER activation, cells were treated with 600 nM 4‐hydroxytamoxifen (4OHT, H7904, Sigma‐Aldrich).
HeLa‐inducible shTRF2 cells (Grolimund et al, 2013), a kind gift from Joachim Lingner (ISREC‐EPFL, Lausanne, Switzerland), expressing the tTR‐KRAB construct, the dsRED marker and the doxycycline‐inducible shTRF2 and GFP marker, were grown in DMEM supplemented with 10% Tet system‐approved fetal bovine serum and 1% glutamine; for shTRF2 and GFP induction, cells were treated with doxycycline (1 μg/ml).
All cell lines used in this study were grown under standard cell culture conditions (37°C, 5% CO2) and were tested negative for mycoplasma contaminations.
Ionizing radiation was induced by a high‐voltage X‐ray‐generator tube (Faxitron X‐Ray Corporation).
ATM kinase inhibitor KU‐60019 (S1570 Selleckchem), or dimethyl sulfoxide as negative control, was used at 10 μM concentration.
Animals and treatments
Experiments involving animals have been done in accordance with the Italian Laws (D.lgs. 26/2014), which enforce Directive 2010/63/EU (Directive 2010/63/EU of the European Parliament and of the Council of 22 September 2010 on the protection of animals used for scientific purposes). Accordingly, the project has been authorized by the Italian Competent Authority (Ministry of Health).
For the analysis of young and old mice, C57BL/6J mice (females and males) were purchased from the Charles River Laboratories. Young animals were sacrificed at 2–3 months of age, while old animals at 22–24 months of age. After collection, lungs were snap‐frozen for RNA extraction and formalin‐fixed and paraffin‐embedded for histological analysis.
Terc+/− mice (B6. Cg‐Terctm1Rdp/J Stock No: 004132 | mTR−/−) (Blasco et al, 1997) were purchased by Jackson Laboratory. Terc+/− mice were intercrossed to generate first‐generation (G1) homozygous Terc−/− knockout mice. Second‐generation (G2) Terc−/− mice were generated by successive breeding of G1 Terc−/− and then G3 Terc−/− mice by crosses between G2 Terc−/− mice. Finally, wild‐type C57BL/6J and G3 Tert−/− mice were used for the experiments. The 8‐ to 10‐week‐old mice were injected intraperitoneally (i.p.) with a control, anti‐teloG, and anti‐teloC ASO at a final concentration of 15 mg/kg twice a week for 4 weeks. The animals were sacrificed at 12 months of age. The lungs were collected, and part of it was snap‐frozen for RNA extraction and part was washed in PBS and collected for fixation in 10% neutral‐buffered formalin overnight, washed in water, and paraffin‐embedded for histological analysis.
Rosa26‐CreERT mice (Jackson Laboratory) and TRF2 conditional knockout mice (Celli & de Lange, 2005) and mice carrying a p53 conditional allele (Jackson Laboratory) were crossed to generate Trf2/p53/Rosa26 mice. Mice were maintained in 129/c57Bl6 genetic background. Mice were bred and maintained under pathogen‐free condition at the Scripps Research Institute and were handled according to Institutional Animal Care and Use Committee guidelines. The animals were provided by Eros Lazzerini Denchi (National Cancer Institute, NIH, Bethesda, USA). To activate CreER, 8‐ to 10‐week‐old mice were injected intraperitoneally (i.p.) with tamoxifen dissolved in sunflower oil or with vehicle at a final concentration of 75 mg/kg. After 24 h vehicle (PBS), anti‐teloG and anti‐teloC ASO dissolved in PBS were administrated by i.p. injection at a concentration of 15 mg/kg. Mice were sacrificed after 5 days post‐tamoxifen injection. Tissues were collected and frozen in dry ice and embedded in OCT tissue TEC (Sakura).
Human samples
Human lung tissue samples were collected from the archives of the Department of Clinical and Molecular Medicine, Pathology Unit, Sant'Andrea Hospital, Sapienza University, Rome, Italy. Samples were relative to histologically normal parenchyma adjacent to either foci of subpleural emphysema (young subjects) or non‐small‐cell lung cancer (old subjects). The samples were collected and handled according to the Helsinki Declaration. Patients provided written informed consent to the use of their tissue samples for research purposes (Ethical Approval SA250).
Antisense oligonucleotides (ASOs) sequences
The locked nucleic acid‐modified oligonucleotides with a fully phosphorothioate backbone were produced by Qiagen as described (Rossiello et al, 2017).
Sequences were as follows (5′–3′ orientation):
control: ACTGATAGGGAGTGGTAAACT.
anti‐teloG: CCCTAACCCTAACCCTAACCC.
anti‐teloC: GGGTTAGGGTTAGGGTTAGGG.
Immunolocalization and quantitative analyses for mouse and human paraffin‐embedded tissues
Four‐micrometer‐thick human and mouse tissue sections were deparaffinized, rehydrated, and unmasked using Novocastra Epitope Retrieval Solutions pH8 in thermostatic bath at 98°C for 30 min. Subsequently, the sections were brought to room temperature and washed in PBS. After neutralization of the endogenous peroxidase with 3% H2O2 and Fc blocking by a specific protein block (Leica Novocastra), the samples were incubated with the primary antibodies.
IHC staining was revealed using Novolink Polymer Detection Systems (Leica Novocastra) or IgG (H&L)‐specific secondary antibodies (Life Technologies, 1:500) and DAB (3,3′‐diaminobenzidine, Leica Novocastra) as substrate chromogen.
For multiple‐marker immunostainings, sections were incubated with ACE2 and TTF‐1 primary antibodies and the binding of the primary antibodies to their respective antigenic substrates was revealed by made‐specific secondary antibodies conjugated with Alexa‐488 (Life Technologies, 1:250) and Alexa‐568 (Life Technologies, 1:300) fluorochromes. In order to multiplex antibodies raised in the same species (ACE2 and pro‐SP‐C or CD31), Opal Multiplex IHC kit was developed. After deparaffinization, antigen retrieval in pH8 buffer was brought to a boil at 100% power, followed by 20% power for 15 min using microwave technology (MWT). Sections were treated with blocking buffer for 10 min at room temperature before primary antibody incubation. Slides were then incubated with polymeric horseradish peroxidase‐conjugated (HRP) secondary antibody for 10 min, and the signal was visualized using Opal 520 fluorophore‐conjugated tyramide signal amplification (TSA) at 1:100 dilution. The HRP catalyzes covalent deposition of fluorophores around the marker of interest. The slides were again processed with the microwave treatment to strip primary/secondary antibody complex and allow the next antigen‐antibody staining. Another round of staining was performed with the second primary antibody incubation, followed by Polymeric horseradish peroxidase‐conjugated (HRP) secondary antibody and Opal 620 fluorophore‐conjugated tyramide signal amplification (TSA) at 1:100 dilution for signal visualization. Finally, slides were again microwaved in antigen retrieval buffer and nuclei were subsequently visualized with DAPI (4′,6‐diamidino‐2‐fenilindole).
Slides were analyzed under a Zeiss Axioscope A1 microscope equipped with four fluorescence channels widefield IF. Microphotographs were collected using a Zeiss Axiocam 503 Color digital camera with the Zen 2.0 Software (Zeiss).
Quantitative analyses of ACE2 immunohistochemical stainings were performed by calculating the average percentage of positive signals in five non‐overlapping fields at medium‐power magnification (×200) using the Positive Pixel Count v9 Leica Software Image Analysis. Multiple‐marker immunofluorescence stainings were analyzed through the use of the segmentation‐based algorithm “HighPlex FL v4.13” of HALO software (Indica Labs), quantifying the intensity of ACE2 expression in type II pneumocytic pro‐SP‐C‐ or TTF‐1‐positive cells. For endothelial cell ACE2 quantitative analyses, the area quantification algorithm “Area Quantification FL v2.1.7” of the HALO software was adopted, which allowed scoring of ACE2 signal intensity in the CD31‐positive endothelial lining independently of cell segmentation.
Immunofluorescence for OCT‐embedded mouse tissues
A measure of 4‐mm tissue sections was fixed for 10 min in 4% paraformaldehyde (PFA) and incubated in blocking solution (2% BSA, 0.1% Tween in PBS) for 1 h at RT. Then, sections were incubated for 1 h at RT with primary antibodies, washed in blocking solution, and incubated for 1 h at RT with secondary antibody. Nuclei were stained with 4,6‐diamidino‐2‐phenylindole (DAPI; 1 mg/ml). Samples were mounted with glycerol solution. Image acquisition was performed in a Leica TCS SP5 confocal microscope. The detection parameters were set in the control samples and were kept constant across specimens.
Immunofluorescence for cultured cells
Cells were fixed with 4% PFA. After incubation with blocking solution, cells were stained with primary antibody for 1 h at RT, washed, and incubated with secondary antibodies for 40 min at RT. Nuclei were stained with DAPI (1 mg/ml). Samples were mounted in mowiol. Image acquisition was performed in a Leica AOBS SP2 confocal microscope. The detection parameters were set in the control samples and were kept constant across specimens. The quantification of the number of DDR foci per cell was performed in a semi‐quantitative manner by CellProfiler software.
FISH for cultured cells and mouse tissues
Cells were fixed with 4% PFA. Mouse lungs were fixed with 4% PFA and cryoprotected with Sucrose 30% before freezing. Fixed cells and 7‐mm tissue sections were permeabilized with triton 0.1% for 20 min RT, incubated with glycine 10 mM for 30 min RT, washed, denatured at 80°C for 5 min, and incubated with Cy5‐conjugated TelC PNA probe (F1003—Panagene). After washes, nuclei were stained with 4,6‐diamidino‐2‐phenylindole (DAPI; 1 mg/ml). Lung slide was mounted with VECTASHIELD® Antifade Mounting Medium (H‐1000‐10), and cells were mounted with mowiol. Image acquisition was performed in a Leica TCS SP5 confocal microscope. The detection parameters were set in the control samples and were kept constant across specimens. The quantification of the signal was performed in a semi‐quantitative manner by CellProfiler software.
Antibodies
The following primary antibodies were adopted for IHC and IF on mouse and human samples: rabbit polyclonal ACE2 (1:500 pH8, ab15348, Abcam), rabbit polyclonal Prosurfactant Protein C (1:200 pH9, AB3786, Merck Millipore), mouse monoclonal TTF‐1 (clone SPT24, 1:100 pH6, NCL‐L‐TTF‐1, Leica Novocastra), rabbit polyclonal anti CD31 (1:50 pH9, ab28364, Abcam), rabbit polyclonal anti‐53BP1 (1:1,000, sc‐22760, Santa Cruz), and mouse monoclonal anti‐phospho‐Histone H2A.X (1:500, 05‐636, Sigma‐Aldrich).
Telomere Shortest Length Assay (TeSLA)
Genomic DNA was extracted using the Gentra Puregene DNA Extraction Kit (Qiagen) according to the manufacturer's instructions and quantified on a NanoDrop (Thermo Scientific). TeSLA measurements were performed as previously described (Lai et al, 2017). In brief, T4 DNA ligase (New England Biolabs), 1 mM ATP, 10 − 3 μM of TeSLA‐Ts, and 50 ng of isolated genomic DNA were mixed in 1× CutSmart buffer (New England Biolabs) and incubated at 35°C for 12–16 h. The mixture was then digested with CviAII, BfaI, NdeI, and MseI (New England Biolabs) to generate DNA fragments with 5′ AT and TA overhangs. Shrimp alkaline phosphatase (rSAP; New England Biolabs) was added to the digested mixture to remove 5′ phosphate from each DNA fragment. The mixture was combined with T4 DNA ligase, 1 mM ATP, 1 μM of AT adapter, and 1 μM of TA adapter in 1× CutSmart buffer to incubate at 16°C for 12–16 h. Multiple PCRs were then performed using FailSafe Enzyme Mix (Lucigen) with 1× FailSafe buffer H containing 0.25 μM AP/TeSLA‐TP primers and 40 pg of ligated DNA. PCR products were resolved on a 0.85% agarose gel (1.5 V/cm for 19 h). After gel electrophoresis, Southern blot is applied to detect amplified telomeres.
RNA extraction from mouse tissues
To isolate RNA, 20–30 mg lung tissue was homogenized in TRIzol (Life Technologies) with Tissue Lyzer II (Qiagen) and processed with RNeasy Kit (Qiagen) according to the manufacturer’s specifications. To increase the purity of the RNA extracted, a convenient on‐column DNase (Qiagen) treatment was performed to remove the residual amounts of DNA. NanoDrop spectrophotometer was used to detect RNA quantity and purity. RNA purity was ascertained via NanoDrop 260/280 and 260/230 ratios.
RNA extraction from cultured cells
For MEFs, HeLa, and BJ cells, total RNA was extracted using Maxwell® RSC Instrument, with Maxwell® RSC simplyRNA Tissue Kit (AS134, Promega), following manufacturer’s instructions. NanoVueTM Plus Spectrophotometer (GE Healthcare) was used to detect RNA quantity and purity. RNA purity was ascertained via NanoVue 260/280 and 260/230 ratios.
For HBEC, total RNA was extracted using QIAGEN RNeasy Plus Kit (74034, Qiagen) following manufacturer’s instructions. NanoDrop spectrophotometer was used to detect RNA quantity and purity. RNA purity was ascertained via NanoDrop 260/280 and 260/230 ratios.
Reverse Transcription Quantitative PCR (RT‐qPCR)
1–2 μg of total cell RNA was reverse transcribed into cDNA using SuperScript VILO cDNA Synthesis Kit (11754050, Thermo Fisher). A volume corresponding to 25–50 ng of cDNA was used for each RT‐qPCR using Roche LightCycler 480 SYBR Green I Master (04707516001, Roche) sequence detection system. Each reaction was performed in triplicate.
Primer sequences (5′–3′ orientation) were as follows:
Total ACE2 as described in (Ma et al, 2020).
Mouse ACE2_Forward: TCCATTGGTCTTCTGCCATCC.
Mouse ACE2_Reverse: AACGATCTCCCGCTTCATCTC.
Human ACE2_Forward: TCCATTGGTCTTCTGCCATCC.
Human ACE2_Reverse: AACGATCTCCCGCTTCATCTC.
Specific primers for ACE2 isoforms as described in Blume et al (2021)
ACE2_Short_Fw: GTGAGAGCCTTAGGTTGGATTC.
ACE2_Short_Rv: TAAGGATCCTCCCTCCTTTGT.
ACE2_Long_Fw: CAAGAGCAAACGGTTGAACAC.
ACE2_Long_Rv: CCAGAGCCTCTCATTGTAGTCT.
Ribosomal protein large P0 (Rplp0) RNA was used as control transcript for normalization:
Mouse/Human Rplp0_Forward: TTCATTGTGGGAGCAGAC.
Mouse/Human Rplp0_Reverse: CAGCAGTTTCTCCAGAGC.
Digital droplet PCR
For HBEC, 200 ng of RNA was reverse transcribed into cDNA with iScript cDNA synthesis kit (1708890. Bio‐Rad) following manufacturer’s instructions.
ddPCR of 20 and 30 ng cDNA were performed using QX 200 ddPCR EvaGreen SuperMix according to standard protocols (Ludlow et al, 2014).
Primer sequences (5′–3′ orientation) were as follows:
ACE2 forward primer: TGTTGGGGAAATCATGTCACT.
ACE2 reverse primer: GAGCAGGAAGTTTATTTCTGTTTCA.
Amplicon size was 112 nt. Primers were designed, via primer‐blast (Ye et al, 2012) and Roche assay design center, to be intron spanning and specific to ACE2 mRNA.
Strand‐specific real‐time quantitative PCR
Detection of tdilncRNAs was performed as previously described (Rossiello et al, 2017), with some modifications. Briefly, RNA samples were treated with DNase I (Thermo Scientific) at 37°C for 1 h. Next, 1 μg of total RNA was reverse transcribed using the Superscript First‐Stranded cDNA Synthesis Kit (Invitrogen) with strand‐specific primers. cDNA was passed on a MicroSpin™ G‐50 columns (Cytiva), and qPCR was performed using SYBR Green I Master Mix (Roche). A volume of cDNA corresponding to 20 ng of initial RNA was used. Each reaction was performed in triplicate. Rplp0 was used as a control gene for normalization.
qPCR primer sequences (5′−3′ orientation):
Rplp0 Fw TTCATTGTGGGAGCAGAC.
Rplp0 Rv CAGCAGTTTCTCCAGAGC.
teloC Rv CCCTAACCCTAACCCTAA.
teloG Rv GGGTTAGGGTTAGGGTTA.
RT primer sequences (5′−3′ orientation):
telo Fw CGGTTTGTTTGGGTTTGGGTTTGGGTTTGGGTTTGGGTT.
telo Rv GGCTTGCCTTACCCTTACCCTTACCC TTACCCTTACCCT.
Luciferase assay
HeLa shTRF2 cells were treated with doxycycline to induce shTRF2 expression or with ionizing radiation (5 Gy). 5 or 1 day later, respectively, they were transfected with Lipofectamine 3000 Reagent (Thermo Fisher Scientific), accordingly to the manufacturer instruction, with ACE2(−1119)‐luc plasmid, a gift from Gerhart Ryffel (Addgene plasmid # 31110; http://n2t.net/addgene:31110; RRID:Addgene_31110). Luciferase activity was measured 24 h post‐transfection using the Luciferase Assay System (E4550, Promega) accordingly to the manufacturer instructions. Luciferase activity was normalized on total protein quantities.
Single‐cell transcriptomic analyses
Single‐cell transcriptomic data from aging tissues in the mouse lung were downloaded from Tabula Muris Senis (https://cellxgene.cziscience.com/collections/0b9d8a04‐bb9d‐44da‐aa27705bb65b54eb, Almanzar et al, 2020). Seurat (v4.0.1, Hao et al, 2021) was used for downstream analyses.
In silico transcription factor binding site analysis
The tool Pscan (Zambelli et al, 2009) was used to look for over‐represented transcription factor binding site (TFBS) motifs in nucleotide sequences. TFBS motifs for the human Ace2 gene (refseq ID: NM_021804) were searched around −450 +50 of the TSS, using the Jaspar 2018_NR matrix as a descriptor.
The EnrichR tool (Kuleshov et al, 2016) was used to perform a gene set enrichment analysis of the resulting Top100 significantly over‐represented transcription factors.
Statistical analyses
Results are shown as mean ± standard error of the mean (SEM). P‐value was calculated by the indicated statistical tests, using Prism software. P‐values for single‐cell data analyses were calculated using the indicated statistical tests using the R software environment or with the default tests of the tools used.
Author contributions
SS, FR, and FdAdF conceptualized the study, designed the experiments, interpreted the results, and wrote the manuscript. SS, FR, VC, VM, GC, MC, EM, BRA, and AdL performed the experiments. FI performed the bioinformatic analyses. ADN provided the human lung samples. JWS supervised BRA. CT supervised the histopathological analyses. FdAdF provided the funding for the study. All authors edited the manuscript.
Conflict of interest
F.R. and F.d’A.d.F. are inventors on the patent applications PCT/EP2013/059753 and PCT/EP2016/068162.
Supporting information
Expanded View Figures PDF
Table EV1
Acknowledgements
We thank Joachim Lingner and Marco Giorgio for sharing reagents and all F.d’A.d.F. laboratory members for discussions. S.S. is supported by Fondazione Umberto Veronesi (FUV) and was previously supported by SIPOD 2 (Structural International Post Doc Program 2)—the People Programme (Marie Curie Actions) of the European Union’s Seventh Framework Programme FP7 under grant agreement no 600399. F.d’A.d.F laboratory is supported by: ERC advanced grant (TELORNAGING—835103); AIRC‐IG (21762); Telethon (GGP17111); AIRC 5X1000 (21091); ERC PoC grant (FIREQUENCER—875139); Progetti di Ricerca di Interesse Nazionale (PRIN) 2015 “ATR and ATM‐mediated control of chromosome integrity and cell plasticity”; Progetti di Ricerca di Interesse Nazionale (PRIN) 2017 “RNA and genome Instability”; Progetto AriSLA 2021 “DDR & ALS”; POR FESR 2014‐2020 Regione Lombardia (InterSLA project); FRRB—Fondazione Regionale per la Ricerca Biomedica—under the frame of EJP RD, the European Joint Programme on Rare Diseases with funding from the European Union's Horizon 2020 research and innovation program under the EJP RD COFUND‐EJP NO 825575. J.W.S. is supported by the lung cancer SPORE from NIH 50CA070907. The synopsis image has been created with BioRender.com.
EMBO Reports (2022) 23: e53658.
Data availability
This study has not produced novel datasets.
References
- Aguado J, Sola‐Carvajal A, Cancila V, Revêchon G, Ong PF, Jones‐Weinert CW, Wallén Arzt E, Lattanzi G, Dreesen O, Tripodo C et al (2019) Inhibition of DNA damage response at telomeres improves the detrimental phenotypes of Hutchinson‐Gilford Progeria Syndrome. Nat Commun 10: 4990–5000 [DOI] [PMC free article] [PubMed] [Google Scholar]
- Almanzar N, Antony J, Baghel AS, Bakerman I, Bansal I, Barres BA, Beachy PA, Berdnik D, Bilen B, Brownfield D et al (2020) A single‐cell transcriptomic atlas characterizes ageing tissues in the mouse. Nature 583: 590–595 [DOI] [PMC free article] [PubMed] [Google Scholar]
- Aviv A (2020) Telomeres and COVID‐19. FASEB J 34: 7247–7252 [DOI] [PMC free article] [PubMed] [Google Scholar]
- Barnes RP, Fouquerel E, Opresko PL (2019) The impact of oxidative DNA damage and stress on telomere homeostasis. Mech Ageing Dev 177: 37–45 [DOI] [PMC free article] [PubMed] [Google Scholar]
- Beyerstedt S, Casaro EB, Rangel ÉB (2021) Barbosa Casaro E & Bevilaqua Rangel É (2021) COVID‐19: angiotensin‐converting enzyme 2 (ACE2) expression and tissue susceptibility to SARS‐CoV‐2 infection. Eur J Clin Microbiol Infect Dis 40: 905–919 [DOI] [PMC free article] [PubMed] [Google Scholar]
- Blasco MA, Lee HW, Hande MP, Samper E, Lansdorp PM, DePinho RA, Greider CW (1997) Telomere shortening and tumor formation by mouse cells lacking telomerase RNA. Cell 91: 25–34 [DOI] [PubMed] [Google Scholar]
- Blume C, Jackson CL, Spalluto CM, Legebeke J, Nazlamova L, Conforti F, Perotin J‐M, Frank M, Butler J, Crispin M et al (2021) A novel ACE2 isoform is expressed in human respiratory epithelia and is upregulated in response to interferons and RNA respiratory virus infection. Nat Genet 53: 205–214 [DOI] [PubMed] [Google Scholar]
- Bunyavanich S, Do A, Vicencio A (2020) Nasal gene expression of angiotensin‐converting enzyme 2 in children and adults. JAMA 323: 2427–2429 [DOI] [PMC free article] [PubMed] [Google Scholar]
- Celli GB, de Lange T (2005) DNA processing is not required for ATM‐mediated telomere damage response after TRF2 deletion. Nat Cell Biol 7: 712–718 [DOI] [PubMed] [Google Scholar]
- Chakravarti D, LaBella KA, DePinho RA (2021) Telomeres: history, health, and hallmarks of aging. Cell 184: 306–322 [DOI] [PMC free article] [PubMed] [Google Scholar]
- Chen J, Jiang Q, Xia X, Liu K, Yu Z, Tao W, Gong W, Han JDJ (2020) Individual variation of the SARS‐CoV‐2 receptor ACE2 gene expression and regulation. Aging Cell 19: 1–12 [DOI] [PMC free article] [PubMed] [Google Scholar]
- Crooke ST, Baker BF, Crooke RM, Liang X‐H (2021) Antisense technology: an overview and prospectus. Nat Rev Drug Discov 20: 427–453 [DOI] [PubMed] [Google Scholar]
- d’Adda di Fagagna F, Reaper PM, Clay‐Farrace L, Fiegler H, Carr P, Von Zglinicki T, Saretzki G, Carter NP, Jackson SP (2003) A DNA damage checkpoint response in telomere‐initiated senescence. Nature 426: 194–198 [DOI] [PubMed] [Google Scholar]
- Dantuma NP, van Attikum H (2016) Spatiotemporal regulation of posttranslational modifications in the DNA damage response. EMBO J 35: 6–23 [DOI] [PMC free article] [PubMed] [Google Scholar]
- Demanelis K, Jasmine F, Chen LS, Chernoff M, Tong L, Delgado D, Zhang C, Shinkle J, Sabarinathan M, Lin H et al (2020) Determinants of telomere length across human tissues. Science 369: eaaz6876 [DOI] [PMC free article] [PubMed] [Google Scholar]
- Dicks N, Gutierrez K, Michalak M, Bordignon V, Agellon LB (2015) Endoplasmic reticulum stress, genome damage, and cancer. Front Oncol 5: 1–8 [DOI] [PMC free article] [PubMed] [Google Scholar]
- Francia S, Michelini F, Saxena A, Tang D, de Hoon M, Anelli V, Mione M, Carninci P, d’Adda di Fagagna F (2012) Site‐specific DICER and DROSHA RNA products control the DNA‐damage response. Nature 488: 231–235 [DOI] [PMC free article] [PubMed] [Google Scholar]
- Fumagalli M, Rossiello F, Clerici M, Barozzi S, Cittaro D, Kaplunov JM, Bucci G, Dobreva M, Matti V, Beausejour CM et al (2012) Telomeric DNA damage is irreparable and causes persistent DNA‐damage‐response activation. Nat Cell Biol 14: 355–365 [DOI] [PMC free article] [PubMed] [Google Scholar]
- Giorgio M, Stendardo M, Migliaccio E, Pelicci PG (2016) P66SHC deletion improves fertility and progeric phenotype of late‐generation TERC‐deficient mice but not their short lifespan. Aging Cell 15: 446–454 [DOI] [PMC free article] [PubMed] [Google Scholar]
- Grolimund L, Aeby E, Hamelin R, Armand F, Chiappe D, Moniatte M, Lingner J (2013) A quantitative telomeric chromatin isolation protocol identifies different telomeric states. Nat Commun 4: 2848 [DOI] [PubMed] [Google Scholar]
- Guan W‐J, Ni Z‐Y, Hu YU, Liang W‐H, Ou C‐Q, He J‐X, Liu L, Shan H, Lei C‐L, Hui DSC et al (2020) Clinical characteristics of coronavirus disease 2019 in China. N Engl J Med 382: 1708–1720 [DOI] [PMC free article] [PubMed] [Google Scholar]
- Hamming I, Cooper M, Haagmans B, Hooper N, Korstanje R, Osterhaus A, Timens W, Turner A, Navis G, van Goor H (2007) The emerging role of ACE2 in physiology and disease. J Pathol 212: 1–11 [DOI] [PMC free article] [PubMed] [Google Scholar]
- Hao Y, Hao S, Andersen‐Nissen E, Mauck WM, Zheng S, Butler A, Lee MJ, Wilk AJ, Darby C, Zager M et al (2021) Integrated analysis of multimodal single‐cell data. Cell 184: 3573–3587.e29 [DOI] [PMC free article] [PubMed] [Google Scholar]
- Harley CB, Futcher AB, Greidert CW (1990) Telomeres shorten during ageing of human fibroblasts. Nature 345: 458–460 [DOI] [PubMed] [Google Scholar]
- Herbig U, Jobling WA, Chen BPC, Chen DJ, Sedivy JM (2004) Telomere shortening triggers senescence of human cells through a pathway involving ATM, p53, and p21CIP1, but not p16INK4a. Mol Cell 14: 501–513 [DOI] [PubMed] [Google Scholar]
- Hewitt G, Jurk D, Marques FDM, Correia‐Melo C, Hardy T, Gackowska A, Anderson R, Taschuk M, Mann J, Passos JF (2012) Telomeres are favoured targets of a persistent DNA damage response in ageing and stress‐induced senescence. Nat Commun 3: 708 [DOI] [PMC free article] [PubMed] [Google Scholar]
- Hoffmann M, Kleine‐Weber H, Schroeder S, Krüger N, Herrler T, Erichsen S, Schiergens TS, Herrler G, Wu N‐H, Nitsche A et al (2020) SARS‐CoV‐2 Cell Entry Depends on ACE2 and TMPRSS2 and Is Blocked by a Clinically Proven Protease Inhibitor. Cell 181: 271–280.e8 [DOI] [PMC free article] [PubMed] [Google Scholar]
- Huang C, Wang Y, Li X, Ren L, Zhao J, Hu YI, Zhang LI, Fan G, Xu J, Gu X et al (2020) Clinical features of patients infected with 2019 novel coronavirus in Wuhan, China. Lancet 395: 497–506 [DOI] [PMC free article] [PubMed] [Google Scholar]
- Huffman KE, Levene SD, Tesmer VM, Shay JW, Wright WE (2000) Telomere shortening is proportional to the size of the G‐rich telomeric 3’‐overhang. J Biol Chem 275: 19719–19722 [DOI] [PubMed] [Google Scholar]
- Karimaian A, Majidinia M, Bannazadeh Baghi H, Yousefi B (2017) The crosstalk between Wnt/β‐catenin signaling pathway with DNA damage response and oxidative stress: Implications in cancer therapy. DNA Repair 51: 14–19 [DOI] [PubMed] [Google Scholar]
- Kuleshov MV, Jones MR, Rouillard AD, Fernandez NF, Duan Q, Wang Z, Koplev S, Jenkins SL, Jagodnik KM, Lachmann A et al (2016) Enrichr: a comprehensive gene set enrichment analysis web server 2016 update. Nucleic Acids Res 44: W90–W97 [DOI] [PMC free article] [PubMed] [Google Scholar]
- Lai T‐P, Zhang N, Noh J, Mender I, Tedone E, Huang E, Wright WE, Danuser G, Shay JW (2017) A method for measuring the distribution of the shortest telomeres in cells and tissues. Nat Commun 81: 1–14 [DOI] [PMC free article] [PubMed] [Google Scholar]
- Lan J, Ge J, Yu J, Shan S, Zhou H, Fan S, Zhang QI, Shi X, Wang Q, Zhang L et al (2020) Structure of the SARS‐CoV‐2 spike receptor‐binding domain bound to the ACE2 receptor. Nature 581: 215–220 [DOI] [PubMed] [Google Scholar]
- Lee HW, Blasco MA, Gottlieb GJ, Horner JW, Greider CW, DePinho RA (1998) Essential role of mouse telomerase in highly proliferative organs. Nature 392: 569–574 [DOI] [PubMed] [Google Scholar]
- Lingappan K, Karmouty‐Quintana H, Davies J, Akkanti B, Harting MT (2020) Understanding the age divide in COVID‐19: Why are children overwhelmingly spared? Am J Physiol‐Lung Cell Mol Physiol 319: L39–L44 [DOI] [PMC free article] [PubMed] [Google Scholar]
- Ludlow AT, Robin JD, Sayed M, Litterst CM, Shelton DN, Shay JW, Wright WE (2014) Quantitative telomerase enzyme activity determination using droplet digital PCR with single cell resolution. Nucleic Acids Res 42: 1–12 [DOI] [PMC free article] [PubMed] [Google Scholar]
- Lukassen S, Chua RL, Trefzer T, Kahn NC, Schneider MA, Muley T, Winter H, Meister M, Veith C, Boots AW et al (2020) SARS ‐CoV‐2 receptor ACE 2 and TMPRSS 2 are primarily expressed in bronchial transient secretory cells. EMBO J 39: e105114 [DOI] [PMC free article] [PubMed] [Google Scholar]
- Ma D, Chen CB, Jhanji V, Xu C, Yuan XL, Liang JJ, Huang Y, Cen LP, Ng TK (2020) Expression of SARS‐CoV‐2 receptor ACE2 and TMPRSS2 in human primary conjunctival and pterygium cell lines and in mouse cornea. Eye 34: 1212–1219 [DOI] [PMC free article] [PubMed] [Google Scholar]
- Michelini F, Pitchiaya S, Vitelli V, Sharma S, Gioia U, Pessina F, Cabrini M, Wang Y, Capozzo I, Iannelli F et al (2017) Damage‐induced lncRNAs control the DNA damage response through interaction with DDRNAs at individual double‐strand breaks. Nat Cell Biol 19: 1400–1411 [DOI] [PMC free article] [PubMed] [Google Scholar]
- Monteil V, Kwon H, Prado P, Hagelkrüys A, Wimmer RA, Stahl M, Leopoldi A, Garreta E, Hurtado del Pozo C, Prosper F et al (2020) Inhibition of SARS‐CoV‐2 Infections in Engineered Human Tissues Using Clinical‐Grade Soluble Human ACE2. Cell 181: 905–913.e7 [DOI] [PMC free article] [PubMed] [Google Scholar]
- Mullenders LHF (2018) Solar UV damage to cellular DNA: from mechanisms to biological effects. Photochem Photobiol Sci 17: 1842–1852 [DOI] [PubMed] [Google Scholar]
- Okamoto K, Bartocci C, Ouzounov I, Diedrich JK, Yates JR, Denchi EL (2013) A two‐step mechanism for TRF2‐mediated chromosome‐end protection. Nature 494: 502–505 [DOI] [PMC free article] [PubMed] [Google Scholar]
- Palm W, De Lange T (2008) How shelterin protects mammalian telomeres. Annu Rev Genet 42: 301–334 [DOI] [PubMed] [Google Scholar]
- Patel S, Rauf A, Khan H, Abu‐Izneid T (2017) Renin‐angiotensin‐aldosterone (RAAS): The ubiquitous system for homeostasis and pathologies. Biomed Pharmacother 94: 317–325 [DOI] [PubMed] [Google Scholar]
- Pessina F, Giavazzi F, Yin Y, Gioia U, Vitelli V, Galbiati A, Barozzi S, Garre M, Oldani A, Flaus A et al (2019) Functional transcription promoters at DNA double‐strand breaks mediate RNA‐driven phase separation of damage‐response factors. Nat Cell Biol 21: 1286–1299 [DOI] [PMC free article] [PubMed] [Google Scholar]
- Peters‐Hall JR, Coquelin ML, Torres MJ, Laranger R, Alabi BR, Sho S, Calva‐Moreno JF, Thomas PJ, Shay JW (2018) Long‐term culture and cloning of primary human bronchial basal cells that maintain multipotent differentiation capacity and CFTR channel function. Am J Physiol ‐ Lung Cell Mol Physiol 315: L313–L327 [DOI] [PMC free article] [PubMed] [Google Scholar]
- Piñeiro‐Hermida S, Autilio C, Martínez P, Bosch F, Pérez‐Gil J, Blasco MA (2020) Telomerase treatment prevents lung profibrotic pathologies associated with physiological aging. J Cell Biol 219: 1–21 [DOI] [PMC free article] [PubMed] [Google Scholar]
- Polo SE, Jackson SP (2011) Dynamics of DNA damage response proteins at DNA breaks: a focus on protein modifications. Genes Dev 25: 409–433 [DOI] [PMC free article] [PubMed] [Google Scholar]
- Qiao Y, Wang X‐M, Mannan R, Pitchiaya S, Zhang Y, Wotring JW, Xiao L, Robinson DR, Wu Y‐M, Tien JC‐Y et al (2021) Targeting transcriptional regulation of SARS‐CoV‐2 entry factors ACE2 and TMPRSS2. Proc Natl Acad Sci USA 118: e2021450118 [DOI] [PMC free article] [PubMed] [Google Scholar]
- Rossiello F, Aguado J, Sepe S, Iannelli F, Nguyen Q, Pitchiaya S, Carninci P, d’Adda di Fagagna F (2017) DNA damage response inhibition at dysfunctional telomeres by modulation of telomeric DNA damage response RNAs. Nat Commun 10.1038/ncomms13980 [DOI] [PMC free article] [PubMed] [Google Scholar]
- Rudolph KL, Chang S, Lee HW, Blasco M, Gottlieb GJ, Greider C, DePinho RA (1999) Longevity, stress response, and cancer in aging telomerase‐deficient mice. Cell 96: 701–712 [DOI] [PubMed] [Google Scholar]
- Vaiserman A, Krasnienkov D (2021) Telomere length as a marker of biological age: state‐of‐the‐art, open issues, and future perspectives. Front Genet 11: 1816–1835 [DOI] [PMC free article] [PubMed] [Google Scholar]
- Verity R, Okell LC, Dorigatti I, Winskill P, Whittaker C, Imai N, Cuomo‐Dannenburg G, Thompson H, Walker PGT, Fu H et al (2020) Estimates of the severity of coronavirus disease 2019: a model‐based analysis. Lancet Infect Dis 20: 669–677 [DOI] [PMC free article] [PubMed] [Google Scholar]
- Walls AC, Park YJ, Tortorici MA, Wall A, McGuire AT, Veesler D (2020) Structure, function, and antigenicity of the SARS‐CoV‐2 spike glycoprotein. Cell 181: 281–292.e6 [DOI] [PMC free article] [PubMed] [Google Scholar]
- Wang D, Hu BO, Hu C, Zhu F, Liu X, Zhang J, Wang B, Xiang H, Cheng Z, Xiong Y et al (2020) Clinical characteristics of 138 hospitalized patients with 2019 novel coronavirus‐infected pneumonia in Wuhan, China. J Am Med Assoc 323: 1061–1069 [DOI] [PMC free article] [PubMed] [Google Scholar]
- Wang W, Mani AM, Wu Z‐H (2017) DNA damage‐induced nuclear factor‐kappa B activation and its roles in cancer progression. J Cancer Metastasis Treat 3: 45 [DOI] [PMC free article] [PubMed] [Google Scholar]
- Xudong X, Junzhu C, Xingxiang W, Furong Z, Yanrong L (2006) Age‐ and gender‐related difference of ACE2 expression in rat lung. Life Sci 78: 2166–2171 [DOI] [PMC free article] [PubMed] [Google Scholar]
- Yan R, Zhang Y, Li Y, Xia L, Guo Y, Zhou Q (2020) Structural basis for the recognition of SARS‐CoV‐2 by full‐length human ACE2. Science 367: 1444–1448 [DOI] [PMC free article] [PubMed] [Google Scholar]
- Ye J, Coulouris G, Zaretskaya I, Cutcutache I, Rozen S, Madden TL (2012) Primer‐BLAST: a tool to design target‐specific primers for polymerase chain reaction. BMC Bioinformatics 13: 134–144 [DOI] [PMC free article] [PubMed] [Google Scholar]
- Yee M, David Cohen E, Haak J, Dylag AM, O’Reilly MA (2020) Neonatal hyperoxia enhances age‐dependent expression of SARS‐CoV‐2 receptors in mice. Sci Rep 10: 1–14 [DOI] [PMC free article] [PubMed] [Google Scholar]
- Zambelli F, Pesole G, Pavesi G (2009) Pscan: Finding over‐represented transcription factor binding site motifs in sequences from co‐regulated or co‐expressed genes. Nucleic Acids Res 37: 247–252 [DOI] [PMC free article] [PubMed] [Google Scholar]
- Zhao Y, Zhao Z, Wang Y, Zhou Y, Ma Y, Zuo W (2020) Single‐cell RNA expression profiling of ACE2, the receptor of SARS‐CoV‐2. Am J Respir Crit Care Med 202: 756–759 [DOI] [PMC free article] [PubMed] [Google Scholar]
- Zhou P, Yang X‐L, Wang X‐G, Hu B, Zhang L, Zhang W, Si H‐R, Zhu Y, Li B, Huang C‐L et al (2020) A pneumonia outbreak associated with a new coronavirus of probable bat origin. Nature 579: 270–273 [DOI] [PMC free article] [PubMed] [Google Scholar]
- Ziegler CGK, Allon SJ, Nyquist SK, Mbano IM, Miao VN, Tzouanas CN, Cao Y, Yousif AS, Bals J, Hauser BM et al (2020) SARS‐CoV‐2 receptor ACE2 is an interferon‐stimulated gene in human airway epithelial cells and is detected in specific cell subsets across tissues. Cell 181: 1016–1035.e19 [DOI] [PMC free article] [PubMed] [Google Scholar]