Abstract
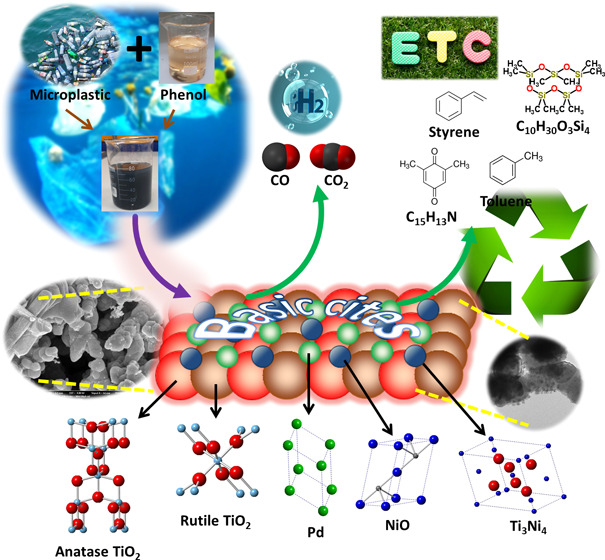
Solvent-based recycling of plastic can offer the main improvement when it is employed for pyrolysis-catalytic steam reforming. In this research, plastic waste dissolved in phenol was used as a feed for catalytic cracking and steam reforming reactions for valuable liquid fuels and hydrogen production, which is gaining the attention of researchers globally. Microplastic wastes (MPWs) are tiny plastic particles that arise due to product creation and breakdown of larger plastics. They can be found mainly in several habitats, including seas and freshwater ecosystems. MPWs harm aquatic species, turtles, and birds and were chosen to recover in this study that can be reacted on the catalyst surface. Biphasic anatase-rutile TiO2 with spherical-shaped support for Ni and Pd metals with nanosized particles was synthesized via the hydrothermal treatment method, and its chemical and physical properties were characterized accordingly. According to temperature-programmed desorption of carbon dioxide (CO2-TPD) and temperature-programmed reduction of hydrogen (H2-TPR) results, the incorporation of Pd into Ni/TNPs enhanced the basicity of the support surface and the redox properties of catalysts, which were strongly linked to the improved hydrogen yield (71%) and phenol conversion (79%) at 600 °C. The Ni-Pd/TNPs nanocatalyst, with remarkable stability for 72 h of time on stream, is a promising catalyst for the MPW-phenol cracking and steam reforming reactions toward H2 production for clean energy generation and other environmental applications. Besides, this study has also highlighted the opportunities of overcoming the risk of microplastic waste and converting it into valuable fuels such as decamethyltetrasiloxane, phenanthrene, methyl palmitate, benzenepropanoic acid, benzoic acid, azulene, xanthene, anisole, biphenyl, phthalic acid, diisooctyl phthalate, etc.
Introduction
Plastics have been manufactured worldwide since the 1950s, with 311 million tonnes produced in 2014 alone.1 Global commercial plastic output reached 359 million tonnes (Mt) in 2018,2 and it is expected to double in the following 20 years.3 Because plastic waste is typically chemically inert, it is estimated that current material will take 250–500 years to disintegrate wholly.4 The recycling of plastic wastes is moving toward increasing recycling rates, with plastic package recycling rates predicted to reach 55% by 2030, promoting the emerging notion of circular economy.5 When plastic waste is released into the environment, it is broken down into smaller particles through solar rays, oxidation mechanisms, biodegradation processes, or mechanical pressure, resulting in microplastic waste (MPW). Microplastics, polymer particles less than 5 mm in diameter, have attracted much attention in recent years because of their possible environmental dangers.6 Primary microplastics, which are generated in micro sizes for various reasons, and secondary microplastics, formed from the breakdown of macroplastics and mesoplastics via photo-oxidative, biological, chemical, and mechanical interactions, are two types of microplastics.7 Microplastics will impact human health due to their chemical characteristics and infections clinging to their surfaces, while macroplastic entanglement and digesting endanger wild creatures.8 According to a study published by the United Nations Environment Programme (UNEP) in 2018, 99% of seabirds have swallowed microplastics waste (MPW). By 2050, over 600 aquatic animals (nearly 15%) will be affected by microplastic ingestion or entanglement in microplastic marine debris.9 Many islands, which serve as sinks for ocean-borne plastics, have also been severely affected by plastic waste from far away. Furthermore, soil sensitivity to MPW may significantly impact pollution absorption and transportation,10,11 as well as seed germination.12 Thus, any novel treatment of MPW may be critical to the ecosystem, and this is one of the most significant aspects of the current research. As a result, numerous plastic to fuel (PTF) techniques such as plasma arc gasification, pyrolysis, refuse-derived fuel, and chemical recycling approaches such as glycolysis, methanolysis, and hydrolysis have attracted significant attention in recent years for plastic waste management.
Pyrolysis, also known as thermolysis, is one of the most effective chemical recycling processes. Pyrolysis is the oxidation of carbon-based components in the absence of oxygen. Under the influence of heat, it can be considered a favorite choice because it converts carbon-based solid wastes into three-phase pyrolytic oil, syngas, and char.13 Thermal degradation is not typically observed in MPW because temperatures will not reach the levels necessary for degradation.14 Hence, the dissolution of MPW in a dissolving agent may be a brilliant idea for MPW recycling issues and renewable and clean energy production. As studied previously,15,16 one of the effective dissolving agents is phenol because it is corrosive to lead, aluminum and its alloys, certain plastics, and rubber. On the other hand, phenolic compounds are commonly discharged from coal chemical mills, pharmaceutical manufacturers, oil refineries, and phenolic resin synthesis facilities. As a result, they are among the most prevalent harmful contaminants in water setting.17 Phenols are also one of the primary materials of bio-oil that could be a suitable source for hydrogen production in the future.18−20 In reality, using bio-oil as a fuel source, a kind of liquid fuel derived from biomass, is a promising way to address world energy demand while simultaneously lowering carbon emissions.21 Another issue for the pyrolysis of MPW is that thermal pyrolysis necessitates high temperatures, often resulting in low-quality materials, rendering this procedure unfeasible. This happens since uncatalyzed thermal oxidation produces low-molecular-weight compounds, which can be used in a wide variety of materials. The addition of catalysts will enhance this process by lowering the temperature and reaction time, allowing the development of higher-value hydrocarbons, including fuel oils and petrochemical feedstocks. As an import, pyrolysis-catalytic steam reforming of MPW and phenol is a successfully valued liquid and hydrogen gas development method that can utilize phenol for MPW recovery and provide long-term development with renewable energy.
The addition of catalyst support can enhance the quality and yield of fuel products from the pyrolysis of MPW with phenol and hydrogen gas. According to the Web of Science (WOS) database, there is a lack of investigation to develop suitable catalysts for MPW cracking reactions. Using keywords such as “microplastic”, “catalyst”, and “cracking” in the topic search, which includes title, abstract, author keywords, and keywords plus an investigation of the published works for the period of 1970 to 2021, only three published works were detected.13,22,23 A significant impediment to scaling up phenol and MPW reforming and cracking reactions for the generation of hydrogen and valuable fuels is the lack of cost-effective, considerably stable and active catalysts. However, a wide variety of catalysts, including nanosized Ni-Co/CeO2,2424 nano Ni–Co/ZrO2,25 Ni–Pt/Al-TiO2,1919 Ni/Al2O3-La2O3,26,27 and Ni/Al2O3,16 were used for polyethylene terephthalate waste cracking reaction in our previous works. We also developed Ni-Co/ZrO2,28−31 Ni-Co/La2O3-Al2O3,3232 and Ni-Co over various metal oxide33 catalysts for hydrogen generation from steam reforming reaction of phenol. Among supports, titanium dioxide (TiO2) is a naturally occurring metal oxide used in waste plastic-catalyzed pyrolysis.19,34,35 TiO2, a reducible metal oxide support, has recently gained popularity due to its cost-effectiveness, high metal–support interactions, abundance, acid–base characteristics, chemical stability, and nontoxicity.36,37 Ni metal, for example, has displayed strong ability in breaking C–H, O–H, and C–C bonds and, being cost-friendly, can add extra advantage for reforming and cracking reactions. Despite the wide availability of Ni metals, they are deactivated easily by coke deposition during the catalytic reaction. The addition of other metals as promoters will usually result in the formation of dual or even multiple active sites, thus improving the catalyst efficiency.38 We discovered that dispersion of metal particles in bimetallic samples resulted in a decrease in metal particle size, which improved catalytic activity and resistance to coke forming.29 Park et al.39 employed a noble metal Pd for the pyrolysis of polyethylene terephthalate and reported that it caused the ring-opening reaction and free radical mechanism, resulting in high activity in pyrolysis reaction. In another study for pyrolysis of waste rubber,40 Ayman et al. found that Pd metal improved the catalyst morphology, surface area, and pore size of Pd/HBeta catalyst, resulting in the enhancement of dehydrogenation–hydrogenation reactions.
This work aims to develop highly active bimetallic Ni–Pd supported on titanium nanocatalyst for hydrogen and useful liquid fuel production from cracking and catalytic steam reforming reaction of MPW-phenol. Catalysts were prepared through the hydrothermal treatment method, and the physical and chemical properties were analyzed via transmission electron microscopy (TEM), Brunauer–Emmett–Teller (BET), X-ray diffraction (XRD), high-resolution TEM (HRTEM), Fourier transform infrared (FTIR), field emission scanning electron microscopy (FESEM), temperature-programmed reduction of hydrogen (H2-TPR), temperature-programmed desorption of carbon dioxide (CO2-TPD), FTIR, temperature-programmed desorption of ammonia (NH3-TPD), inductively coupled plasma (ICP), thermogravimetric analysis (TGA), and carbon, hydrogen, nitrogen, and sulfur (CHNS), proving their suitability in catalytic reaction for 3 days of reaction on stream. In addition, reaction studies were carried out in the temperature range of 500–700 °C, and the composition of liquid and gas products was analyzed by GC-MS, FTIR, gas chromatography with flame-ionization detection (GC-FID), and gas chromatography with thermal conductivity detector (GC-TCD). The findings of this study will provide information regarding a possible way to utilize MPW while producing valuable fuels effectively. Therefore, this study proposed an innovative method and feasible routes for recycling MPW into hydrogen and liquid fuels that are cost-effective and environmentally friendly and promote energy and environmental and ocean protection as well as a new frontier for the development of valuable nanocatalysts.
Materials and Methods
Synthesis of Ni-Pd/TNPs Nanocatalysts
TNPs were prepared through a hydrothermal method, and the starting reagents of nickel nitrate (Ni(NO3)2·6H2O), palladium, TiO2, and NaOH were acquired from Sigma-Aldrich. The catalyst preparation of the hydrothermal treatment method was followed with a few modifications from our previous research.18,19,24,25 Concisely, 10 g of TiO2 was stirred in 90 mL of deionized water first and 4 M NaOH pellets were added for an hour at room temperature to obtain a homogeneous mixture. The solution was then shifted into an autoclave reactor equipped with a 100 mL Teflon cylinder, sealed, and kept in an oven for 48 h at 140 °C. After cooling down the autoclave, the solution was filtered in a separating funnel equipped with filter paper and a vacuum pump, washed 20 times, dried at 110 °C for 12 h, and calcination for 4 h at 800 °C. White titanium nanoparticles (TNPs) were then used to support Ni and Pd active metals. Subsequently, 8 wt % Ni and 2 wt % Pd metals over 90 wt % TNPs were prepared through conventional impregnation technique, and details are reported in the previous works conducted by co-authors.31−33,41,42 The prepared samples were dried overnight at 110 °C and calcined for 4 h at 800 °C, pelletized to the size fraction of 1–1.4 mm, and named TNPs, Ni/TNPs, and Ni-Pd/TNPs.
Characterization of the Catalysts
X-ray powder diffraction (XRD) profiles were obtained on a Bruker D8 Advance diffractometer. The crystalline phases were identified by JCPDS-ICDD (International Center for Diffraction Database) by X’Pert Highscore Plus software, and crystal size was calculated via the Scherrer equation. An inductively coupled plasma (ICP) analyzer was utilized to identify the trace metal contents of Ni and Pd in the catalysts. The functional groups present in the catalysts and metal–support interactions were determined via Fourier transform infrared (FTIR) absorption spectra recorded on a Shimadzu IR-Prestige-21 model spectrometer using pure KBr as a reference background record with the scanning range of 400–4000 cm–1. The temperature-programmed reduction of hydrogen (H2-TPR) analysis was performed to determine the reducibility of the catalysts with Micromeritics Chemisorb 2720 apparatus. 10%H2 in argon at a flow rate of 20 mL/min was introduced for the reduction. The basicity and acidity of the samples were also measured through temperature-programmed desorption of carbon dioxide (CO2-TPD) and temperature-programmed desorption of ammonia (NH3-TPD) techniques, respectively, via the same apparatus, and the details of these analyses are reported in our previous research.25 Transmission electron microscopy (TEM) and high-resolution transmission electron microscopy (HRTEM) images were acquired with a JEOL JEM-ARM200F instrument at 200 kV. Field emission scanning electron microscopy (FESEM, Zeiss, model Crossbeam 340) was used to observe the surface morphology of Ni-Pd/TNPs nanocatalysts, and the size distribution was estimated using ImageJ software. The mass loss of spent catalysts was analyzed by thermogravimetric analysis (TGA) using a Shimadzu TG-50 thermogravimetric equipment. The dependence of SBET of the calcined samples was measured by a FlowSorb III surface area analyzer instrument for SBET measurement by the dynamic single-point method. Each sample (200–300 mg) was first purified by degassing at 250 °C for 12 h using nitrogen flow before the BET test. The BET surface area, functional groups, metal contents, and carbon content of spent catalysts were also analyzed by Micromeritics (FlowSorb III), FTIR spectra, ICP test, and CHNS elemental analysis, respectively.
Preparation of the MPW and Phenol Mixture
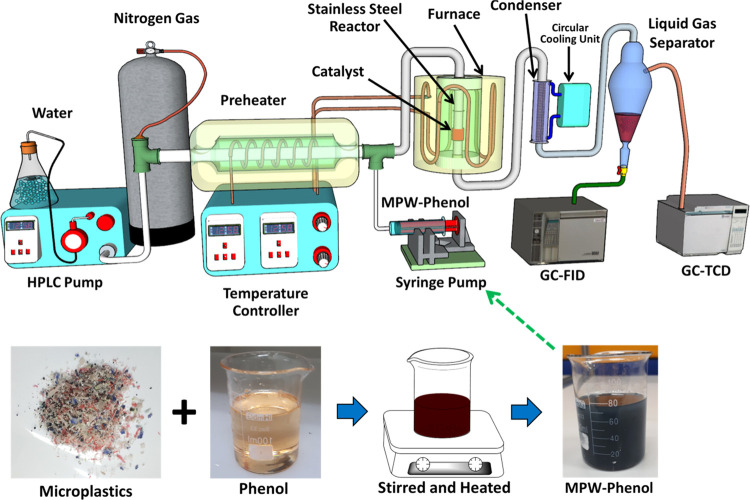
Microplastics made of plastic wastes such as plastic bottles, bottle caps, plastic plates and cups, styrofoam items, ropes, plastic bags, and straws were collected from Desaru beach, Johor, Malaysia. Using an industrial blender, these trash items were washed, dried, and crushed to produce plastics with less than 5 mm2 pieces. The produced plastics were then gently poured into phenol while stirring at 80 °C for an hour with a volume ratio of 0.005:1. The produced dark blue solution was then shifted into an injection pump for the experimental test (see Figure 1).
Figure 1.
Flow diagram of the catalytic MPW-phenol cracking and steam reforming reactor, adapted and reproduced from our previous works with permission.18,19
Procedures for the Catalytic Performance Test
The MPW-phenol cracking and reforming reaction was conducted in a fixed-bed reactor with an internal diameter of 6 mm, and a schematic diagram is shown in Figure 1. The reaction was conducted at 500–700 °C under atmospheric pressure. Generally, 0.25 g of catalyst diluted with 0.4 g of silicon carbide (SiC) was placed into the reactor because the SiC dilution helps improve the catalytic performance.31,42 The catalyst was reduced in a 30 mL/min stream of hydrogen at 600 °C for 1 h, and then hydrogen was displaced by nitrogen (carrier gas) with the same flow, and a reaction was initiated. Water was vaporized through a preheater at 200 °C and transferred into the reactor by an HPLC pump with a flow rate of 0.4 mL/min. One temperature controller controlled the temperature of the preheater and the reactor. The MPW-phenol mixture was inserted into the reactor with the volume ratio to water molecule of 1:9. After passing all reactants through the catalyst, the reaction products were chilled down to 10 °C by the condensers equipped with a circular water cooling system and the two phases separated. Online gas chromatography analyzed the noncondensed gas (Agilent 6890N) fitted with a TCD detector and equipped with a Carboxen Plot 1010 capillary column (fused silica, 30 m × 0.53 mm). The liquid products were analyzed by gas chromatography (HP 5890 Series II) fitted with a FID detector and equipped with a 0.53 mm × 30 m CP-Wax capillary column. GC/MS (Agilent 7890B) analysis also evaluated the liquid products to detect the formed constituents after the catalytic MPW-phenol reforming reaction. Phenol conversion and product distribution of H2, CO, and CO2 in yield were calculated as shown in eq 1, 2, 3, and 4, respectively.
| 1 |
| 2 |
| 3 |
| 4 |
The stoichiometric moles are the number of moles of each compound that need to react so that the reaction can go to completion. So, for instance, we have the balance steam reforming equation as shown in eq 5.
| 5 |
| 6 |
| 7 |
For example, we used 10 mL of phenol and tried to convert it to stoichiometric moles of hydrogen using the following calculation. The same method can be used for CO and CO2 stoichiometric moles.
Results
Catalyst Characterization
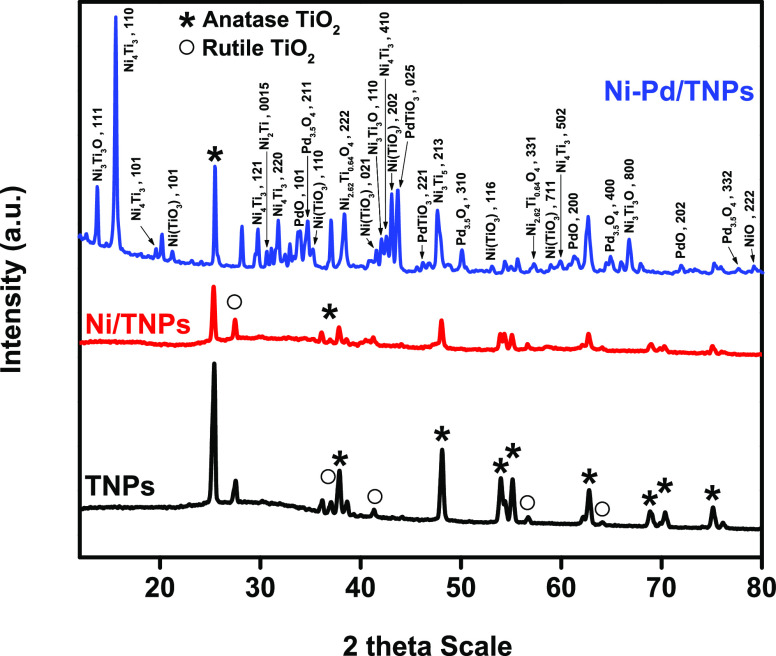
The powder X-ray diffraction method was used to examine the phase purity and crystallinity of Ni-Pd/TNPs nanocatalysts, as shown in Figure 2. The XRD curves of all three catalysts show the two most common polymorphs of anatase and rutile phases with sharp peaks. The XRD curves showed characteristics peaks at 2θ angles of 25.44, 37.06, 37.9, 48.15, 53.98, 55.17, 62.77, 68.83, 70.36, and 75.13° corresponding to 101, 112, 004, 200, 211, 105, 204, 301, 220, and 215 diffractions of anatase phase, which are in good agreement with the standard JCPDS card number 01-071-1168 for TiO2 and 57.1 nm of crystal size. Meanwhile, the peaks appearing at 27.54, 37.06, 41.26, 55.1, and 64.1° can be ascribed to the characteristic peaks of 110, 101, 111, 220, and 310 crystal phases and in agreement with the JCPDS number of 01-078-1510 for rutile TiO2 and 53.8 nm of crystal size. By introducing Pd metal, multiple peaks of various crystal structures have been detected. The results showed that some diffraction peaks had been assigned to the cubic ternary oxide (Ni3Ti3O) at 2θ angles of 13.79° (111), 42.09° (110), 58.94° (711), and 66.73° (800) (JCPDS 01-075-0399) and matched the grain size of 33.8 nm, whereas crystalline Ni3TiO5 (JCPDS 00-030-0865 and crystal size of 23.6 nm) with tetragonal phase was found at 2θ angles of 47.65° (213). Metastable Ni4Ti3 precipitates are observed at 15.64, 19.67, 29.8, 31.81, 44.57, and 59.9°, which can be ascribed to the characteristic peaks of 110, 101, 121, 220, 410, and 502 rhombohedral phase structures, respectively, and match with the crystal size of 27.7 nm. Ni4Ti3 is a NiTi alloy intermediate phase that occurs as lenticular precipitates with the central plane parallel to the crystallographic [111]B2 directions in the B2 matrix.43−45 The Ni4Ti3 precipitate is typically formed during the thermomechanical method of Ni-rich Ni–Ti alloys.46 Panton47 stated that “metastable Ni4Ti3 is the preferred phase to strengthen the microstructure, forming coherent lenticular precipitates in the matrix”. The diffraction lines owing to rhombohedral phase structures of NiTiO3 for two JCPDS card numbers of 01-083-0202 at 2θ angles of 21.26° (101) and 43.09° (202) and JCPDS card number of 01-083-0204 at 2θ angles of 35.25° (110), 41.56° (021), and 53.11 (116) can be observed in the XRD pattern of Ni-Pd/TNPs nanocatalysts. It has been reported that NiTiO3 phases improve the carbon tolerance of solid oxide fuel cells.48 Nevertheless, the analysis of the peaks of the Ni-Pd/TNPs nanocatalysts also detected Bragg peaks at 34.77, 50.09, 64.88, and 77.6°, with a grain size of 47.1 nm, representing the 211, 310, 400, and 332 diffractions of the Pd3.5O4 cubic (01-071-1866), respectively. At the same time, the presence of reflections at 33.98° (with 19.5 nm of crystal size) corresponds to reviews in the 101 diffraction of tetragonal PdO (JCPDS 00-043-1024), whereas weaker Bragg peaks at 61.28° (200) and 71.87° (202) are corresponding to tetragonal PdO with JCPDS card number of 01-085-0713 and a crystal size of 40.8 nm. The XRD peaks matched well with the two distinct cubic phases of nickel titanate (Ni2.62Ti0.64O4) from the JCPDS card number of 01-084-0297 at 2θ angles of 37.38° (222) and 57.3° (331) and a crystal size of 25.8 nm. The cubic structure of NiO at a 2θ angle of 79.14° (222) with JCPDS card number of 00-004-0835 and a crystal size of 102.1 nm was also observed. There are peaks that are centered at 2θ values of 43.73° (025) and 46.22° (221), which are characteristic of the orthorhombic crystal system of the PdTiO3 phase structure (JCPDS 00-044-0489) and a crystal size of 33 nm. The XRD findings revealed Ni crystals with small sizes and strong dispersion and no noticeable growth of Ni crystals during the synthesis procedure, indicating that the TiO2 coating still keeps nickel stable. The average crystallite sizes obtained from the Scherrer equation for each crystal plane recommend that the catalysts comprise nanocrystal fractions.
Figure 2.
XRD curves of TNPs, Ni/TNPs, and Ni-Pd/TNPs nanocatalysts.
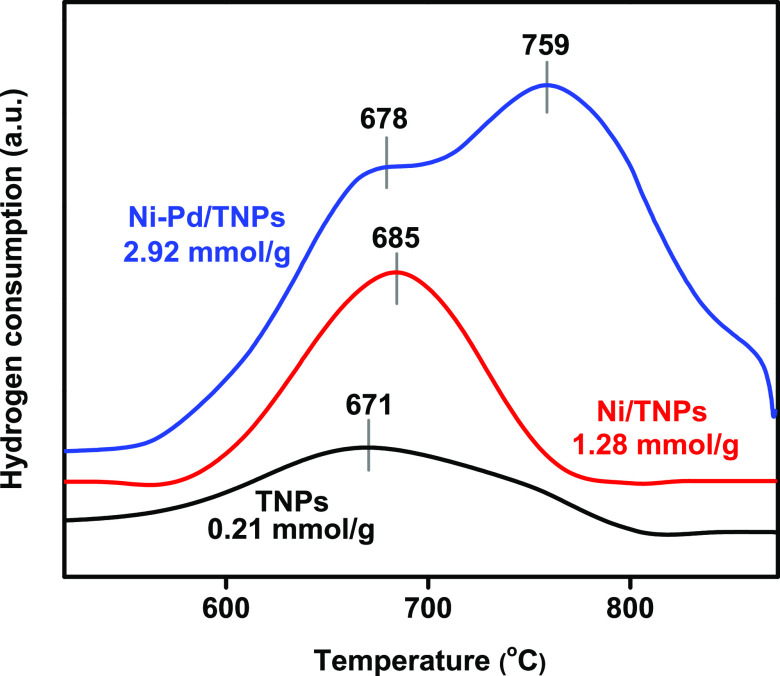
Hydrogen-temperature-programmed reduction (H2-TPR) was conducted to examine the surface redox properties of TNPs, Ni/TNPs, and Ni-Pd/TNPs nanocatalysts. Figure 3 depicts the thermograms of H2-TPR, and the quantitative data of hydrogen consumption calculated based on the peak areas below the H2-TPR curves are displayed in Table 1. The catalysts show different reduction processes; broad peaks are observed at 671 °C for TNPs, which could be assigned to the partial reduction of Ti4+ to Ti3+,49 and the dehydroxylation of TiO2 on the surface50 with little consumption of H2 was found on the TNPs sample. The low hydrogen consumption of TNPs catalyst can be caused by the formation of hardly reducible TiO2 as it is known that above 500 °C, TiO2 is moderately reduced to TiO2–x by hydrogen (TiO2 + xH2 → TiO2–x + xH2O (x < 2)).51 The TPR peak was shifted to 685 °C for Ni/TNPs sample, revealing the reduction of titanium at a higher temperature in the presence of nickel species, giving evidence of metal–support interaction. The absence of a Ni reduction peak here could be due to the good dispersion of Ni particles. In the Ni-Pd/TNPs, a reduction shoulder is shown at around 678 °C and is also ascribed to the partial reduction of TiO2 and might correspond to the reduction of surface oxygen. The absence of reduction peaks for palladium might be due to the low content of Pd metal in catalysts and might be reduced at temperatures below 200 °C. The 759 °C reduction peak may be due to the reduction of nickel titanate in which NiO particles interact with TiO2 and form the surface species Ni–TiO3. Another probability for the 759 °C reduction peak is the further reduction of TiO2 assisted by Pd, which enhances the dissociation of H2 and efficiently provides H atoms to the TiO2 matrix. However, it was better to estimate the reducibility of the catalysts by measuring the H2 consumption level.52 It is seen that hydrogen consumption increases for the Ni-Pd/TNPs nanocatalyst, indicating that adding Pd facilitates this reduction process and causes a further increase in metal–support interaction. This statement can be described by H2 absorption on the Pd or Ni–Pd surfaces, which strengthen the H–H bond. As a result, the increased reduction potential of TNPs seems to be the cause of the improved catalytic efficiency of Ni-Pd/TNPs nanocatalysts, as good interactions between the metals help typically improve the catalytic operation of reforming reactions.
Figure 3.
Temperature-programmed reduction (H2-TPR) patterns of TNPs, Ni/TNPs, and Ni-Pd/TNPs nanocatalysts.
Table 1. Metal Contents, BET Surface Area, Basicity, Reducibility, Acidity, and Data of TNPs, Ni/TNPs, and Ni-Pd/TNPs nanocatalysts.
| catalysts | Ni (wt %) | Pd (wt %) | surface area (m2/g) | H2 consumption (mmol/g) | CO2 uptake (mmol/g) | NH3 uptake (mmol/g) |
|---|---|---|---|---|---|---|
| TNPs | 0 | 0 | 87.4 | 0.21 | 32.93 | 89.3 |
| Ni/TNPs | 10.86 | 0 | 91.2 | 1.28 | 128.7 | 81.6 |
| Ni-Pd/TNPs | 7.84 | 2.08 | 103.1 | 3.42 | 293.1 | 28.4 |
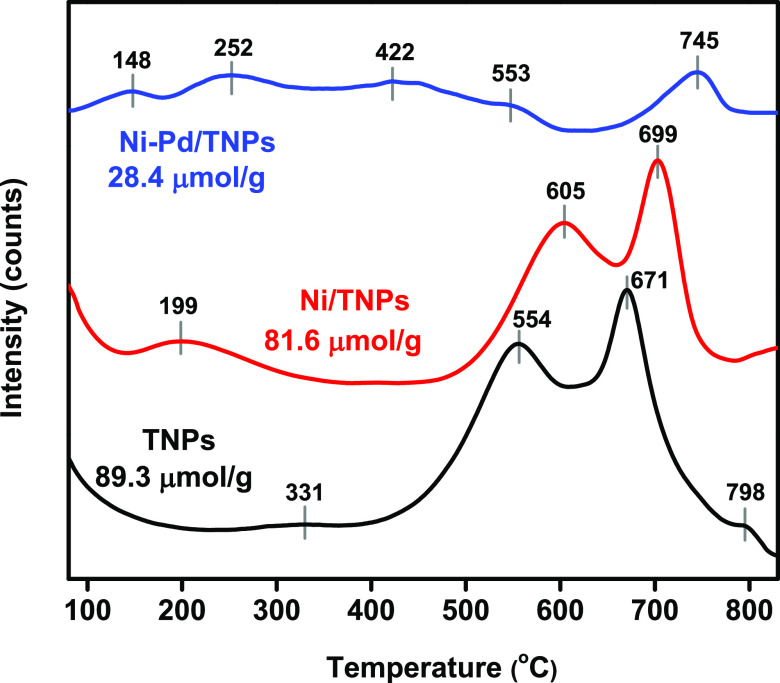
The surface acidity of the TNPs, Ni/TNPs, and Ni-Pd/TNPs nanocatalysts were examined by the temperature-programmed desorption (TPD) of the NH3 technique, and the curves are depicted in Figure 4 and quantified in Table 1. Typically acid sites can be sorted into weak (100–200 °C), medium (200–350 °C), and strong (above 350 °C) acid sites. In the reforming reactions, the strong acidic phase resulted in rapid carbon deposition and unwanted side reactions, while the medium acid sites are favorable to generating hydrogen from MPW-phenol steam reforming reaction. On the one hand, weak acid sites over catalysts were only conducive to coking and not cracking.53 As shown in Figure 4, all prepared catalysts have two or three strong NH3 desorption peaks, which proposed abundant acidic sites on the catalysts due to ample acidic areas of TiO2.54 As shown in the NH3-TPD chart and NH3 uptake data, the addition of Pd will significantly decrease the number of surface acid phases and the total amount of adsorbed NH3 was reduced as follows: TNPs > Ni/TNPs > Ni-Pd/TNPs. The peak intensity given to the medium and strong acids declines after nickel loading, while the content of weak-strength acid is increased. This pattern may be linked to the existence of agglomerates in Ni/TNPs and Ni-Pd/TNPs, which could have blocked the active sites and made it more difficult for NH3 to reach the pores, resulting in a decrease in their desorption patterns. After introducing Pd metal, the profiles became almost flat, suggesting that the acidic amount of the catalyst was significantly decreased with the incorporation of Pd atoms because of the loss of −OH groups upon interaction of Pd2+ ions to the support surface.55 It might be due to heavy metal–support interactions and acidic-site blockage by Pd particles, limiting the capacity of acidic sites to adsorb NH3.5656 However, Pd metal leads to a noticeable growth in the strong-acid sites at 745 °C. The broad peak of about 422 °C is due to the NH4+ desorption from the Brnsted acid sites, while another peak between 553 and 745 °C is ascribed to the NH3 coordination with the Lewis acid sites.57 The reduction in the fraction of exposed Pd due to encapsulation, where the surface acidity appears dominant, could explain these effects.
Figure 4.
NH3-TPD patterns of TNPs, Ni/TNPs, and Ni-Pd/TNPs nanocatalysts.
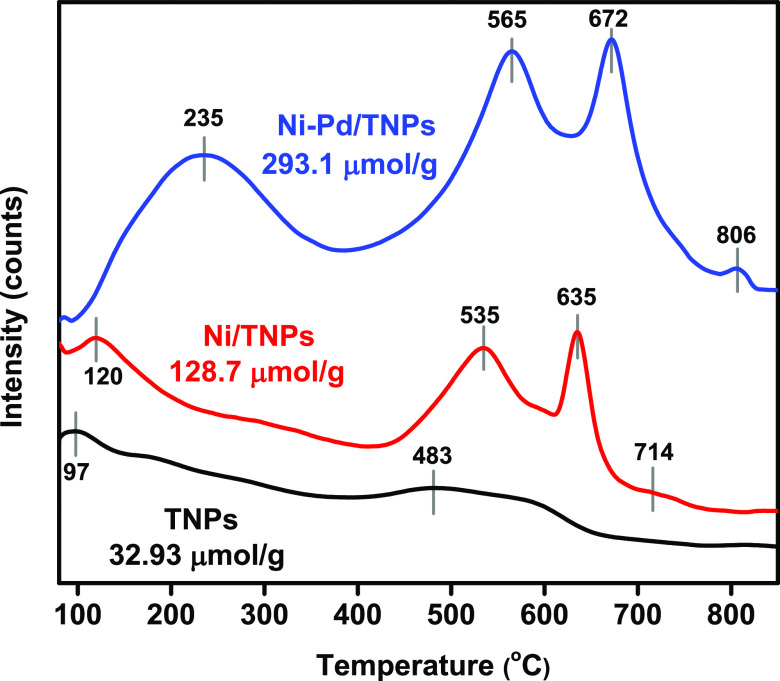
The basicity of the TNPs, Ni/TNPs, and Ni-Pd/TNPs nanocatalysts was studied using carbon dioxide as a gas for acidic analysis. CO2 interacts with basic surface phases by absorption and is then discharged from the sample surface at various temperatures depending on the frequency of the Lewis basic phases. Preceding research has indicated that basic phases are essential in preventing carbon deposition on catalysts in reforming reactions.33,58 The desorption peaks detected at 50–200, 200–400, and 400–860 °C can be attributed to the weak, medium, and strong basic sites, respectively, and the quantitative data of CO2 uptake calculated based on the peak areas below the TPD curves are displayed in Table 1. The peaks at 400–860 °C could also be ascribed to the decomposition of carbonates, which were not eliminated during the calcination process.59,60Figure 5 shows that all catalytic samples have different desorption peaks that can be separated into three adsorption sections corresponding to three distinct types of sites with different specific characteristics. The diverse intensities of weak basic peaks (OH– groups) were detected due to the altered pore volumes and surface areas properties of the nanocatalysts. The weak basic sites are insufficiently active to sever chemical bonds, while they find it difficult to desorb the reaction materials.61 The TNPs and Ni/TNPs nanocatalysts display peaks matching weak and strong basic sites, whereas Ni-Pd/TNPs nanocatalysts display peaks conforming to the medium (e.g., OH and O groups) and strong basic sites (e.g., O2– groups). The addition of the Pd content increased the basic site due to the increase of active palladium sites and proved that the palladium crystallite is not formed.62 Two desorption peaks with a highest at 97 °C and 483 °C were observed in the CO2-TPD curve of the bare TNPs, which specified very low absorption of the basic phases (32.93 mmol/g). The intensity of the low and medium basic sites is determined by the OH– bond present on the surface and the Lewis acid-basic paring, while the higher basic nature is caused by the low surface O2– coordination.63 The promotion with Ni and Pd led to a drastic increase in the number of strong basic sites, with the peaks becoming broader and more intense for Ni/TNPs and Ni-Pd/TNPs nanocatalysts. The trend of basicity results is the same as the redox properties of the catalysts. Ni/TNPs have a higher quantity of desorbed CO2 and strong basic sites than bare TNPs probably because of the good distribution of Ni active elements. With the introduction of Pd content, the contribution from weak basic sites decreased, whereas that from medium strength and strong basic sites increased due to increased active palladium sites. This is due to the more basic nature of Pd in comparison to Ni. Changes in the basicity of catalysts due to the addition of Pd can therefore be related to compositional and bulk changes in catalyst systems. This trend demonstrates that more Lewis base pairings and surface O2– in the presence of Pd metal generates anions. It is well known that the larger the amount of basic sites, the more efficient the CO2 adsorption will be. Following the activity of catalysts (Figure 10) and basic amounts summarized in Table 1, it can be realized that the performance of Ni-Pd/TNPs nanocatalysts is more related to the strong basic phases.
Figure 5.
CO2-TPD patterns of TNPs, Ni/TNPs, and Ni-Pd/TNPs nanocatalysts.
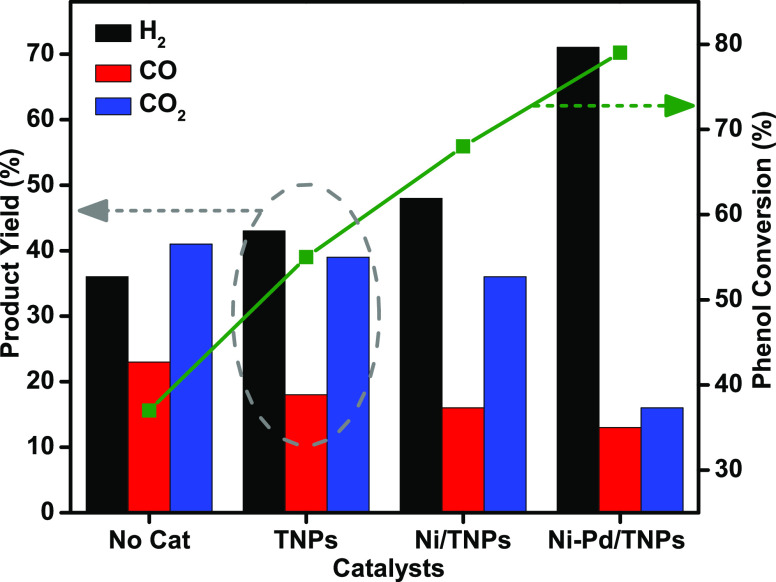
Figure 10.
Concentrations of gaseous products in yield % and phenol conversion for TNPs, Ni/TNPs, and Ni-Pd/TNPs nanocatalysts and without catalyst. Reaction conditions: catalyst, 0.25 g; pressure, 1 atm; reaction temperature, 600 °C; feed (MPW-phenol mixture)-to-water volume ratio, 1:9.
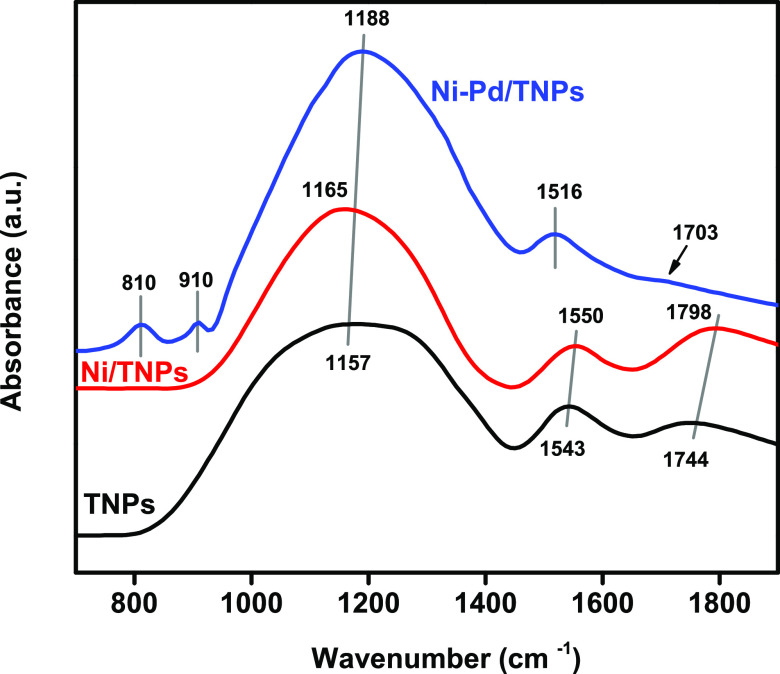
Fourier transform infrared (FTIR) spectra utilizing the KBr pellet method were recorded in the wavenumber range of 4000–500 cm–1 to examine functional groups present in the synthesized TNPs, Ni/TNPs, and Ni-Pd/TNPs nanocatalysts, and the results are presented in Figure 6. This figure shows a broad band at 1157 cm–1, which specifies the existence of C–O–O stretching on the adsorbent surface.64 The peak in this area shifted to a higher wavenumber by adding Ni at 1165 cm–1 due to the C–H bending vibration.65 This peak is shifted further by introducing the Pd component at 1188 cm–1 due to the C–O asymmetric stretching vibration66 and OH bending of COOH groups.67 The 1188 cm–1 band can also be assigned to coordinated NH3 on Lewis acid sites,68,69 which approve the acidity data for Ni-Pd/TNPs nanocatalyst. It should be noted that the intensities of FTIR bands in the N–O stretch region at 1543 cm–1 for the TNPs samples shifted to 1550 cm–1 for the Ni/TNPs nanocatalysts and to 1516 cm–1 for the Ni-Pd/TNPs nanocatalysts, assigned to the asymmetric stretching mode (νas) of bidentate nitrates.70 The appearance of two peaks at 1744 cm–1 in the IR spectrum of TNPs indicates the formation of carboxylic groups on the outer surface of TNPs, and peaks at 1744 and 1703 cm–1 confirm the formation of formate for both TNPs and Ni-Pd/TNPs nanocatalysts.71 The peak at 1744 cm–1 belongs to C=O vibrations of the acyl bond,72 and the peak at 1798 cm–1 consigned to the bending vibration of C–O stretching73 along with a weaker band at 1703 cm–1 (C = O stretching74). The impregnation of Pd noble metal results in two new peaks at 910 and 810 cm–1; a band at 910 cm–1 indicates a trans configuration around the C=C bond75 and asymmetric T–O–T vibrations,76 where the latter one is assigned to the acrylate group of the C=C bond.77
Figure 6.
Illustrative FTIR spectrum of the fresh TNPs, Ni/TNPs, and Ni-Pd/TNPs nanocatalysts.
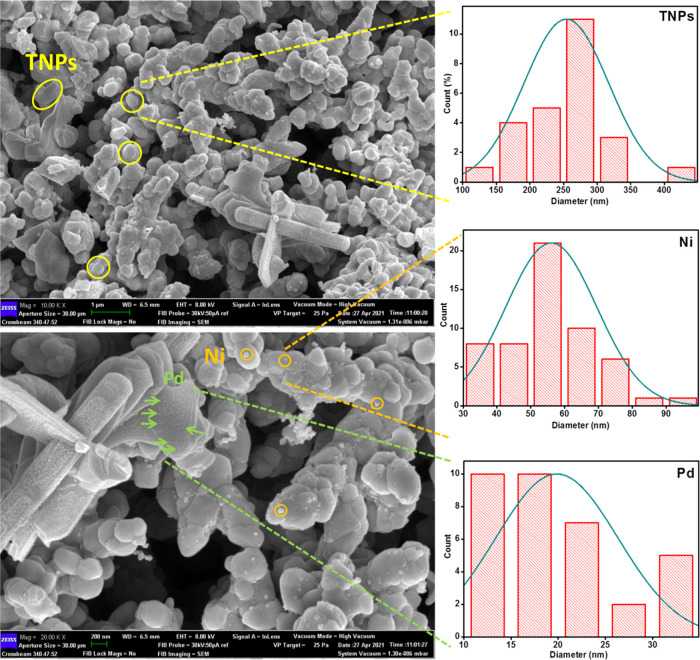
FESEM microscopy images of the Ni-Pd/TNPs nanocatalyst, which are continuous and distributed evenly throughout the matrix, can be seen in Figure 7. According to the FESEM images of the TNPs sample, the particles were widely agglomerated with spherically formed nanostructures organized uniformly with particle sizes varying from 100 to 350 nm. The FESEM image shows that Pd, with tiny dots shown by olive-colored arrows, has better been dispersed than Ni. Moreover, the distribution of Pd particles is relatively uniform; no obvious sintering and aggregation were observed. The histogram pattern of the average area shows that the standard deviations of TNPs, Ni, and Pd components were 270, 55, and 17 nm, respectively. To acquire further insights into the morphology of the Ni-Pd/TNPs nanocatalyst, the TEM technique was used, and the results are presented in Figure 8, which confirms their solid type similar to those with FESEM images.
Figure 7.
FESEM images of the Ni-Pd/TNPs nanocatalyst and the corresponding size distribution histograms of TNPs, Ni, and Pd components.
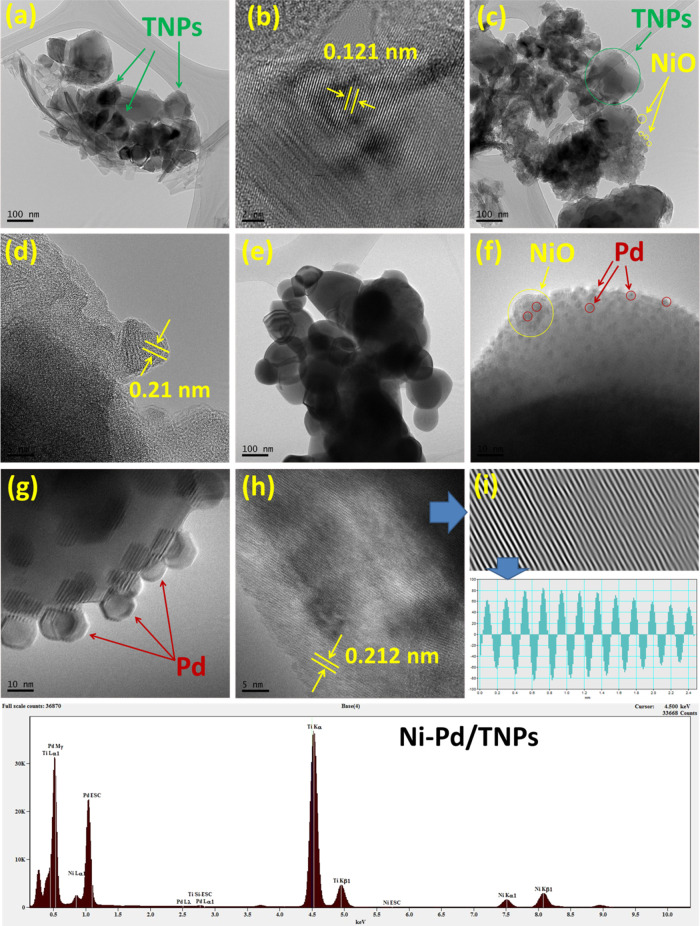
Figure 8.
TEM images of (a) TNPs, (c) Ni/TNPs, and (e) Ni-Pd/TNPs; HRTEM images of (b) TNPs, (d) Ni/TNPs, and (f–h) Ni-Pd/TNPs sample along with (i) d-spacing and energy-dispersive X-ray (EDX) spectrum.
To gain more insight into the structure of the surface morphology and particle size distribution of NiO and Pd metals, the three TNPs, Ni/TNPs, and Ni-Pd/TNPs nanocatalysts were characterized by TEM and HRTEM, and the results are shown in Figure 8. The Ni and Pd metals had no impact on the morphology of the TNPs, as demonstrated by the fact that the samples maintained their spherical and globular form in all three catalysts. The TNPs structure had a spherical or globular shape with sizes in the range 80–300 nm, as can be seen in Figure 8a,c,e, confirming the formation of the nanoparticles and that the TNPs morphology of all samples, before and after metal loading, was not changed with the lattice d-spacing of 0.121 nm. Different sorts of TNPs, such as high-crystallinity TNPs and TNPs with numerous lattice defects, were observed in all samples. The nanosized conduct of the catalysts is shown by selected area electron diffraction (SAED) pattern obtained from the section presented in Figure 9. The SAED images in Figure 9a–c show the polycrystals class of TNPs in good agreement with the biphasic anatase-rutile structure acquired in the X-ray diffraction curve. Some of the particles seen in the TEM images are quite bigger than those derived from XRD, which might be attributed to the fact that the crystal size determined from XRD data was related to the crystallized feature, but TEM images disclosed the morphological structure of produced nanoparticle clusters. The TEM analysis shown in Figure 8c,d indicates that nickel nanoparticles were well dispersed onto the TNPs surface with a lattice d-spacing of 0.21 nm. The EDX spectrum also confirmed the presence of nickel particles. The TEM images of the Ni-Pd/TNPs nanocatalyst in Figure 8g–i depict uniform distributions of cubic structures of Pd nanoparticles on the TNPs surface with a lattice d-spacing of 0.212 nm. The nanoparticle size of Pd was about 5 nm, which slightly increased to approximately 10 nm upon interacting with the TEM beam light. The presence of Pd particles can also be seen in the EDX spectrum.
Figure 9.
SAED images of (a) TNPs, (b) Ni/TNPs, and (c) Ni-Pd/TNPs nanocatalysts.
Catalytic Performance Test
The activities of TNPs, Ni/TNPs, and Ni-Pd/TNPs nanocatalysts were initially examined in terms of phenol steam reforming at 600 °C, and the results are shown in Figure 10. It was found that H2 was the main gas product while CO2 and CO were present in less volume during the entire reaction. No significant phenol conversion was observed in the noncatalytic condition reaction. The utilization of bare TNPs catalyst causes 43% hydrogen yield and 55% phenol conversion. Chutirat et al.78 titanium has a high degree of active facets and facilitates a faster mass transfer, resulting in a remarkable catalytic activity. The phenol conversion and hydrogen yield improved with the introduction of the nickel component. The hydrogen yield and phenol conversion increased from 43 and 55% for the TNPs sample to 48 and 68% for the Ni/TNPs sample. One of the reasons for this improvement is probably the formation of catalytically active metal centers in the catalysts, resulting in the rise in the conversion of condensable intermediate compounds to synthesis gas. This might come because active sites for phenol conversion are dependent on the basicity of Ni/TNPs catalysts (oxygen anion sites), which is a vital characteristic for forming hydrogen and, to a degree, breaking C–C bonds. The results shown in Figure 10 highlight the best performance of the catalyst Ni-Pd/TNPs nanocatalyst having a 79% phenol conversion and a high hydrogen yield of 71%. The conversion of phenol increased 11%, hydrogen yield by 23%, and CO2 yield decreased by 20% when Pd impregnated to Ni/TNPs, indicating that the C–C and C–H bond cleavage was facilitated Pd metal doping. The catalytic behavior observed for the Ni-Pd/TNPs sample is possibly due to a sufficiently uniform distribution of active Pd phase on the catalyst surface that remarkably covers the outer TNPs as confirmed by FESEM (green circle, Figure 7) and TEM (Figure 8) images. The reaction data can also be well explained by the physicochemical properties of the catalysts determined by several characterizations such as surface area, CO2-TPD, and H2-TPR. As seen in the XRD analysis (Figure 2), the rhombohedral nickel (II) titanate (NiTiO3) phase structures were detected for the Ni-Pd/TNPs sample, which the advantage of improving the carbon tolerance of solid oxide fuel cells.48 The NiTiO3 could be used as an anode-reforming layer to facilitate the carbon tolerance and effectively avoid the carbon depositing on the Ni catalyst. The rutile TiO2-supported Ni has stable crystalline structures,79 and the anatase-TiO2 form increases the active metal interaction; however, both anatase and rutile TiO2 are significant for achieving high catalytic activity and stability. The XRD (Figure 2) and H2-TPR (Figure 3) result also showed a very high interaction between metals and support for Ni-Pd/TNPs, which could be associated with higher activity compared to Ni/TNPs and TNPs samples. Generally, the catalytic activity of the three synthesized catalysts follows the same trend of their basicity and reducibility properties. In this trend, the decrease of CO2 yield can be ascribed to the exothermic water gas shift reaction (CO + H2O ↔ CO2 + H2, ΔH° = −41 kJ/mol). As shown in H2-TPR (Figure 3) and CO2-TPD (Figure 5) characterizations, the Ni-Pd/TNPs sample had excellent redox properties and highest basic sites compared to other catalysts, resulting in better performance in catalytic activity. As seen in the basicity and reducibility investigations, the presence of Pd noble metal results in the formation of more Lewis base pairings and surface O2– anions and cause a further increase in metal–support interactions that correlated with the best catalytic performance. The increase in the phenol conversion in the presence of Pd metal suggests that these catalytic systems are stronger and resistant against coke formation during the cracking and steam reforming of MPW-phenol. The behavior of this catalyst proves its outstanding activity toward C–C and C–H bond scission for extending products. Hence, according to the performance in a high percentage of phenol conversion and hydrogen yield, the Ni-Pd/TNPs nanocatalyst was chosen for further investigation in the effect of temperature and stability.
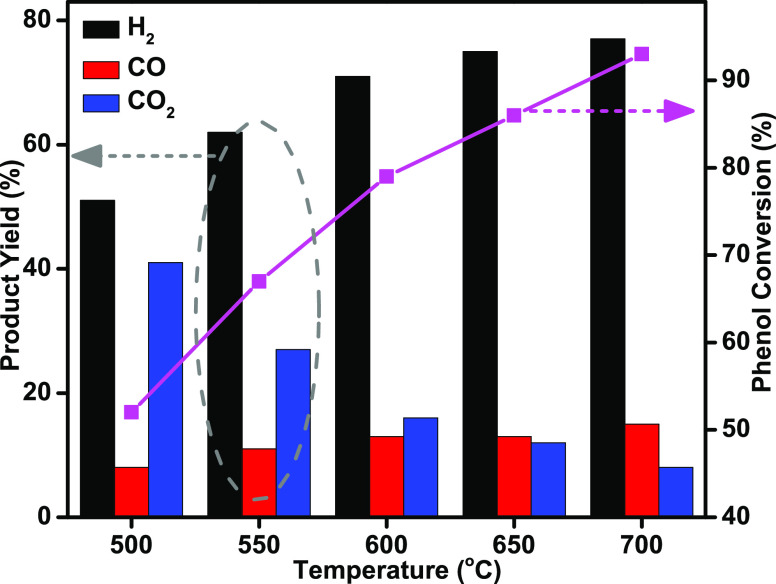
The temperature has essential impacts on the activity of the biphasic anatase-rutile Ni-Pd/TNPs nanocatalyst for hydrogen generation from MPW-phenol steam reforming and cracking reactions. The yields of gas products with phenol conversion as a function of temperature over Ni-Pd/TNPs nanocatalyst are illustrated in Figure 11. It indicates that our catalysts are even active at relatively low temperatures. Due to the endothermic character of phenol steam reforming reaction (C6H5OH + 5H2O → 6CO + 8H2, ΔH° = 710.91 kJ/mol), the phenol conversion, H2 yield, and CO yield were improved with increasing temperature, from 52, 51, and 8% at 500 °C to 93, 77, and 15% at 700 °C, respectively. There are possible reaction mechanisms that might happen for the increase of H2 and CO yields: the O–H dissociation at the beginning and then the cleavage of C–O bonds. C–H and C=C cleavage at the O–H bond division step as well as C–H and C=C cleavage resulted in ring opening and the breakage of C=C and C–H bonds.80 Meanwhile, CO2 yield showed the opposite trend and was significantly decreased from 41% at 500 °C to 8% at 700 °C, with increasing CO yield confirming the occurrence of reverse water gas shift reaction (CO + H2O ↔ CO2 + H2). The CO2 and CO products suggest that more CO was also formed by the MPW-phenol steam reforming and cracking reactions, which were favorable at high temperatures. We can assume that the steam reforming reaction of eq 6 is more probable than eq 5. CO2 was decreasing and CO was increasing, which suggest that more CO was also formed by the MPW-phenol steam reforming and cracking reactions, which was favorable at high temperatures.
Figure 11.
Influence of reaction temperature on the phenol conversion and product yield.
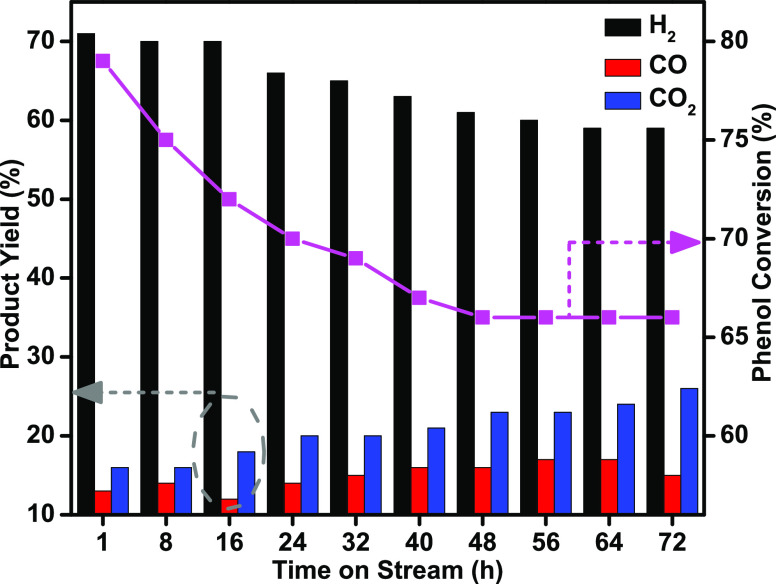
The catalytic performance for MPW-phenol steam reforming and cracking reactions was investigated under severe reaction conditions for 72 h at 600 °C to validate carbon deposition resistance on the catalysts. Figure 12 displays the catalytic performance of time on stream (TOS) over the Ni-Pd/TNPs nanocatalyst. Phenol conversion slightly decreased during 48 h of TOS (from 79 to 66%) and became stable for the rest of the experiment. The catalyst performance in terms of hydrogen yield drops notably from 71% during 64 h to 59% but remains constant for the rest of the time. This decrease is most possibly due to a quick transition to a stable state that occurred under the reaction conditions in the catalyst. According to the above findings, the Ni-Pd/TNPs nanocatalyst was durable and resistant to carbon deposition under experimental conditions.
Figure 12.
Phenol conversion and H2, CO, and CO2 yields with TOS in the hydrogen production from MPW-phenol steam reforming over the Ni-Pd/TNPs nanocatalyst at 600 °C.
Composition of Liquid Products
GC-MS data of liquid fuel produced from the MPW-phenol steam reforming and cracking reactions are shown in Table 2. The equivalent peaks areas of the compounds can be associated to expose their yields. Hydrocarbons that exist in liquid fuel are valuable components for fuel applications. Some compounds were formed during the reactions that are not found in noncatalytic experiments. Despite phenol, the most significant chemical compound used in the reaction, the data display that most chemical components are decamethyltetrasiloxane (C10H30O3Si4) for the Ni/TNPs dimethylbenzoquinoline (C15H13N) for the TNPs and Ni-Pd/TNPs nanocatalysts. However, the identified chemical components and their yields are different. As seen in Table 2, aromatics such as phenanthrene (C14H10), methyl palmitate (C17H34O2), benzenepropanoic acid, 3,5-bis(1,1-dimethylethyl)-4-hydroxymethyl ester (C18H28O3), 7-(tert-butyldimethylsilyl)oxy-4-methylcoumarin-3-acetic acid (C16H22O3Si), hexadecamethyl octasiloxane (C16H48O7Si8), maybridge4_000855(C8H13N7), and decamethyltetrasiloxane (C10H30O3Si4) are favored with the Ni/TNPs nanocatalyst. More interestingly, the impregnation of Pd in the catalyst encouraged the formation of benzoic acid (C8H8O2), azulene (C10H8), and xanthene (C13H10O) and increased the contents of anisole (C7H8O), biphenyl (C12H10), phthalic acid (C19H28O4), diisooctyl phthalate (C24H38O4), and dimethylbenzoquinoline (C15H13N). The Ni-Pd/TNPs nanocatalyst also causes a significant decrease in the formation of phenol component. Therefore, the liquid product of MPW-phenol steam reforming and cracking reaction is not just a pyrolysis oil or reaction byproduct but mixtures of valuable compounds that can be utilized for industrial applications.
Table 2. Composition of Liquid Products (Mass %).
| compound | no catalyst | TNPs | Ni/TNPs | Ni-Pd/TNPs |
|---|---|---|---|---|
| toluene | 0.05 | 0.3 | 0.13 | 0.14 |
| styrene | 0 | 0.28 | 0 | 0.1 |
| 1,3,5,7-cyclooctatetraene | 0 | 0 | 0.1 | 0 |
| 2-butoxyethanol | 0 | 0.095 | 0.06 | 0.02 |
| acetic acid, 2-[2-[(trimethylsilyl)oxy]ethoxy]-, trimethylsilyl ester | 0 | 0.042 | 0 | 0 |
| anisole | 0 | 0 | 0.03 | 0.04 |
| phenol | 97.63 | 93.26 | 96.91 | 81.2 |
| 2-vinylfuran | 0.01 | 0.046 | 0 | 0 |
| benzoic acid, methyl ester | 0.01 | 0.061 | 0.03 | 0.02 |
| azulene | 0 | 0 | 0 | 0.21 |
| naphthalene | 0.59 | 0.485 | 0.22 | 0 |
| biphenyl | 0 | 0.019 | 0 | 0.02 |
| dibenzofuran | 0 | 0.167 | 0.08 | 0.1 |
| phenanthrene | 0 | 0 | 0.2 | 0 |
| phthalic acid, hex-3-yl isobutyl ester | 0 | 0.048 | 0.06 | 0.11 |
| methyl pentadecanoate | 0.12 | 0.145 | 0 | 0 |
| methyl palmitate | 0 | 0 | 0.07 | 0.06 |
| benzenepropanoic acid, 3,5-bis(1,1-dimethylethyl)-4-hydroxy-, methyl ester | 0 | 0.023 | 0.03 | 0 |
| 9H-Xanthene | 0 | 0 | 0 | 0.03 |
| 7-(tert-butyldimethylsilyl)oxy-4-methylcoumarin-3-acetic acid, tert-butyldimethylsilyl ester | 0 | 0 | 0.11 | 0 |
| pyrene | 0.21 | 0.335 | 0.17 | 0.11 |
| diisooctyl phthalate | 0 | 0 | 0.12 | 0.46 |
| hexadecamethyl octasiloxane - | 0 | 0.094 | 0.23 | 0 |
| 1,2,4-triazol-3-amine, 5-(1,3,5-trimethyl-4-pyrazolyl)amino- | 0 | 0 | 0.06 | 0 |
| cyclohexane-1,3-dione, 2-allylaminomethylene-5,5-dimethyl- | 1.22 | 1.16 | 0.13 | 0 |
| bis(2-ethylhexyl) phthalate | 0 | 0.01 | 0 | 0 |
| tris(tert-butyldimethylsilyloxy)arsane | 0 | 0.23 | 0 | 0 |
| 2,4-dimethylbenzoquinoline | 0 | 2.24 | 0 | 17.36 |
| decamethyltetrasiloxane | 0 | 0.62 | 1.26 | 0 |
| methyltris(trimethylsiloxy)silane | 0.16 | 0.34 | 0 | 0 |
| total | 100 | 100 | 100 | 100 |
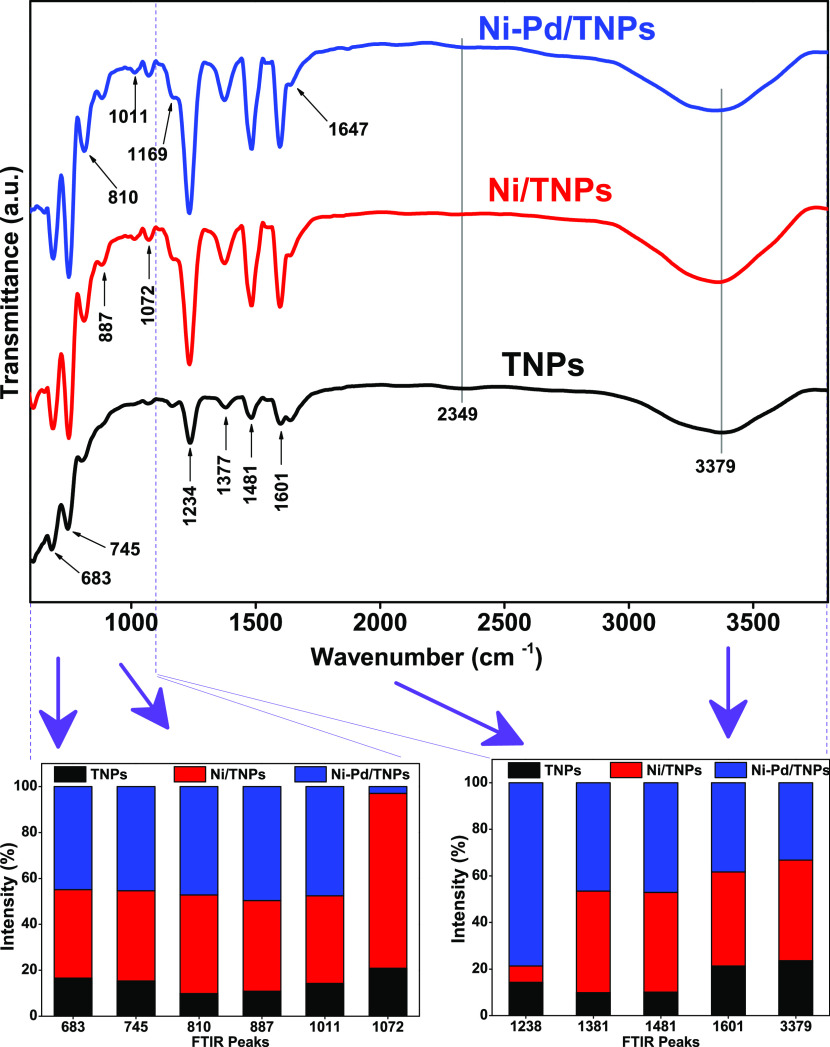
We tried to record the FTIR spectra with the scanning range of 400–4000 cm–1 to analyze further the liquid products obtained from MPW-phenol steam reforming and cracking reaction. The corresponding wavenumbers for different bands are taken from the previous works.81 The FTIR transmittance curves for the liquid products over TNPs, Ni/TNPs, and Ni-Pd/TNPs nanocatalysts, along with the summary of bands intensities, are illustrated in Figure 13. The bands at 683, 745, and 810 cm–1 indicate that the C–H out-of-plane bending of single-ring aromatics results in the highest intensities for the Ni-Pd/TNPs nanocatalyst. The 887 cm–1 peaks for Ni/TNPs and Ni-Pd/TNPs nanocatalysts belong to the C=C stretching of alkenes. The transmittance peaks at wavenumbers 1169 and 1234 cm–1 ascribed to oxygenated compounds related to alcohol and ethers.82 C–H bending or deformation of alkenes are also seen in the 1377 and 1481 cm–1 bands. The 1601 and 1647 cm–1 peaks match the C=C stretching of alkenes, and strong and broad peaks at 3379 cm–1 illustrate the O–H stretching of alcohols, phenols, or carboxylic acids. Finally, the 2349 cm–1 peaks with low intensities correspond to CO2 components present in the liquid fuel, which is primarily produced by the reforming and cracking of the functional groups of carbonyl (C–O–C) and carboxyl (C=O)83 that disappeared after using the Ni-Pd/TNPs nanocatalyst. In general, the liquid product over the TNPs sample produced very low peak intensities, signifying that the catalyst played a significant part in promoting cracking reactions and influencing the quantities of components existing in the liquid fuel. As a result, different liquid compounds are formed directly from the breaking of side chains of big molecules and aromatics, and they differ depending on the catalysts employed in the process.
Figure 13.
FTIR spectra of total pyrolysis products using TNPs, Ni/TNPs, and Ni-Pd/TNPs nanocatalysts with the summary of band intensities.
Characterizations of Used Catalysts
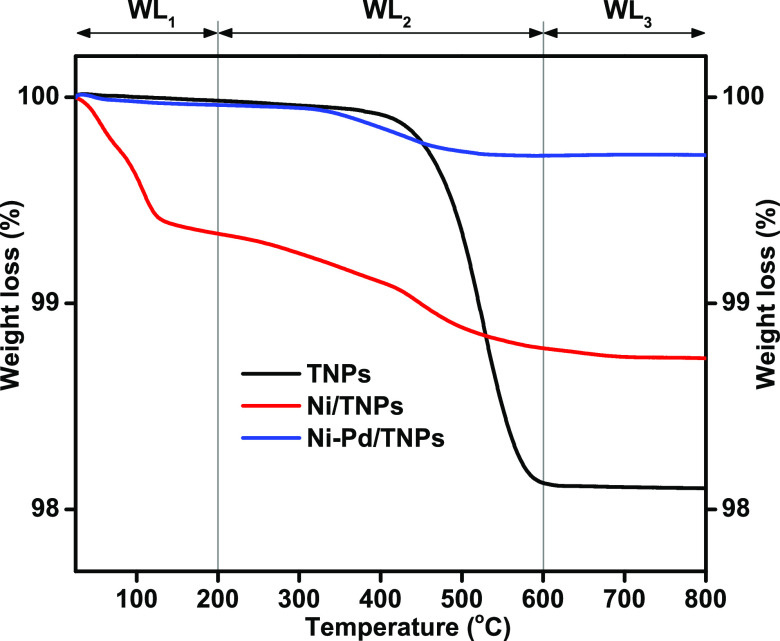
Thermogravimetric analysis (TGA) was used to examine the amount of the coke deposition during MPW-phenol steam reforming and cracking reaction on the TNPs, Ni/TNPs, and Ni-Pd/TNPs nanocatalyst surface after reaction at 600 °C, and the results are displayed in Figure 14 and Table 3. The BET surface area, ICP, and CHNS data of the spent catalysts are also given in Table 3. The sample weight behavior reveals the weight loss in the sample due to the carbon gasification and suggests various forms of carbonaceous species produced on the catalysts. As explained previously,19,25 the diverse performances of TGA curves by temperature difference are as follows. Weight losses (WL) below 200 °C, between 200 and 600 °C, and above 600 °C can be ascribed to the removal of the water molecule (WL1), removal of less stable deposits (WL2), and removal of highly stable cokes (WL3), respectively. More water molecules were formed on the Ni/TNPs nanocatalyst than two other samples. These losses can be linked to water molecules stuck inside the catalyst’s structure during the reverse water gas shift (RWGS) side reaction. For the TNPs and Ni/TNPs nanocatalysts, the coke physically blocks or interferes with the flow of reactants and products. Hence, these two catalysts had lower catalytic activity than the Ni-Pd/TNPs nanocatalyst (see Figure 10). Carbon deposition indicates that the minimum volume of coke (1.6%) was formed on the Ni-Pd/TNPs, while the highest amount of coke (4.1%) was deposited on the bare TNPs surface. The sintering of Ni seems to be one of the key causes for the deactivation of the Ni/TNPs catalyst, while the deactivation of the TNPs catalyst is mainly attributed to the formation of coke, although sintering can also play a role. Adding Pd metal has an essential influence on the inhibition of coke deposition on the catalyst surface with the minimum change in the surface area (1.7). The addition of Pd metal increases Ni particle dispersion, resulting in good interaction with the support (see Figure 3); hence, strongly scattered Ni particles are difficult to oxidize. The addition of a slight amount of metal oxides with high basicity was intended to improve the catalyst’s capacity to chemisorb more CO2 and aid in the oxidation of carbon formed on the catalyst surface. It has been shown that the catalyst basicity (see Figure 5) was boosted with the addition of Pd, which would help CO2 activation and simplify the deposited carbon gasification. Therefore, coke deposition on the Ni-Pd/TNPs catalyst surface would be effectively suppressed. Catalyst deactivation is primarily caused by the formation of coke, particularly at lower reaction temperatures. Further coke conversion is preferred kinetically when the reaction temperature is comparatively high, as shown in the Boudouard reaction (2CO → C + CO2). Since catalyst acidity is strongly linked to coke forming through cracking and polymerization reactions,84 this finding can also be clarified by the decrease in acidity promoted by Pd addition.
Figure 14.
TGA curves of used TNPs, Ni/TNPs, and Ni-Pd/TNPs nanocatalysts.
Table 3. Weight Loss, Carbon and Metal Contents, and Surface Area of the Used Catalysts.
| weight
loss (%) |
||||||||||
|---|---|---|---|---|---|---|---|---|---|---|
| catalysts | WL1 | WL2 | WL3 | total weight loss (%) | Ni (wt %) | Pd (wt %) | carbon content (wt %) | fresh catalyst surface area (m2/g)a | spent catalyst surface area (m2/g)b | difference between surface areaa,b |
| TNPs | 0.02 | 1.85 | 0.03 | 1.9 | 0 | 0 | 4.1 | 87.4 | 68.9 | 18.5 |
| Ni/TNPs | 0.66 | 0.56 | 0.05 | 1.27 | 7.19 | 0 | 3.8 | 91.2 | 84.7 | 6.5 |
| Ni-Pd/TNPs | 0.04 | 0.24 | 0 | 0.28 | 6.45 | 1.98 | 1.6 | 103.1 | 101.4 | 1.7 |
Surface area of the calcined catalysts before the reactions.
Surface area of the catalysts after the reactions.
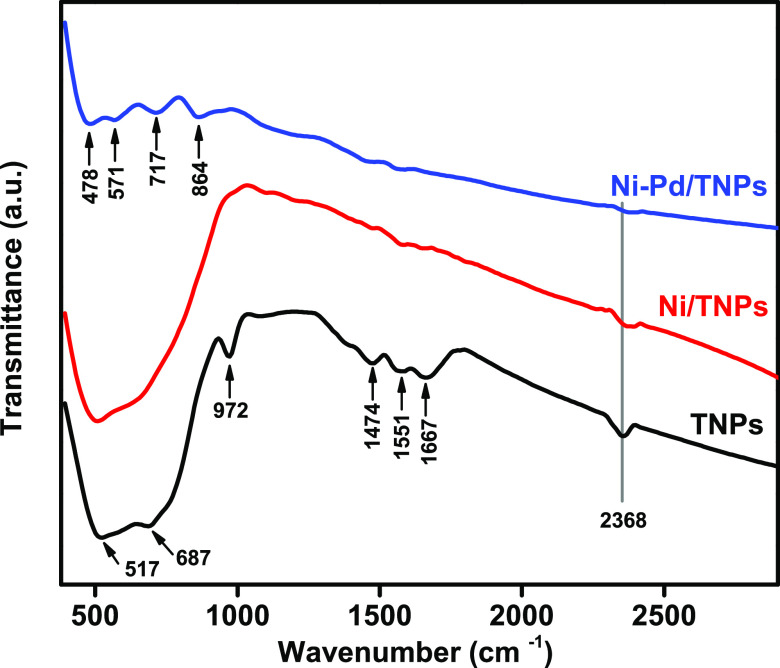
The results of the FTIR analysis of the spent catalysts are demonstrated in Figure 15, which showed that different species of carbon are present on TNPs, Ni/TNPs, and Ni-Pd/TNPs nanocatalysts. The most representative FTIR bands at 517 and 972 cm–1 were ascribed to the A1g mode of anatase phase and out-of-plane bending of C–H functional groups within the deposited coke. The CO2 was recognized from the ester group of C=O stretching vibration at the 2368 cm–1 band mainly derived from the combustion reaction between carbon and oxygen components in the oxidation phase. The FTIR transmittance wavenumbers at 1474, 1551, and 1667 cm–1, which are in the highest intensities for the TNPs, might be assigned to the stretching mode of the sp2 bond in ordered graphite (G-band).85 FTIR transmittance peaks at 478, 871, 717, and 8647 cm–1 are associated with metal oxides resulting from interatomic vibrations.86 Compared to other catalysts, the number of bands and their intensities are the largest for the TNPs catalyst, suggesting the most significant carbon deposition on its surface, most probably due to the large size of TNPs particles as illustrated by FESEM analysis (Figure 7). The accelerating coke formation with increasing average metal particle size is in agreement with the previous works.87,88 This result is in excellent agreement with the TGA and CHNS findings.
Figure 15.
FTIR analysis of spent TNPs, Ni/TNPs, and Ni-Pd/TNPs nanocatalysts.
Conclusions
This work studied the MPW-phenol catalytic cracking and steam reforming reactions over Ni-Pd/TNPs nanocatalysts to generate valuable liquid products and hydrogen fuel. Catalysts were synthesized under the hydrothermal treatment method and evaluated in a fixed-bed quartz microreactor. Deep characterizations such as XRD, FTIR, BET, FESEM, TEM, H2-TPR, CO2-TPD, NH3-TPD, GC/MS, CHNS, ICP, and TGA were utilized in the physicochemical properties of the synthesized samples. Catalysts were evaluated under 500–700 °C, and the optimum one under 3 days on stream. The various catalyst characterization techniques showed that the biphasic anatase-rutile TiO2 had a spherical-shaped structure. In addition, Pd increased the catalyst’s redox properties and basic sites, which played an essential role in catalytic activity. It was discovered that the phenol conversion and hydrogen yield reached the maximum of 93 and 77% at 700 °C over Ni-Pd/TNPs nanocatalysts. The stability results and the characterization of the used catalyst indicated the feasibility of the prepared catalyst for hydrogen and liquid fuel productions from MPW-phenol catalytic cracking and steam reforming. The acquired experimental results from liquid product analysis allowed us to obtain accurate data that can be utilized to solve the concerns on microplastic waste recycling. It was revealed that the cracking reaction of the MPW took place effectively by producing valuable components such as dimethylbenzoquinoline, diisooctyl phthalate, decamethyltetrasiloxane, anisole, biphenyl, benzoic acid, azulene, etc.
Acknowledgments
The primary author, Walid Nabgan, is thankful for support from Universiti Teknologi Malaysia in the form of the Post-Doctoral Fellowship Scheme “Simultaneous heavy metals ions and organic pollutants photoredox reactions over SiO2/ZrO2 based catalysts under solar-light irradiation” (PDRU Grant number: 05E49). This research was also funded by MINISTRY OF HIGHER EDUCATION OF MALAYSIA (MOHE) through the research excellence consortium grant number 4L947 University Teknologi Malaysia.
Glossary
Abbreviation
- BET
Brunauer–Emmett–Teller
- CHNS
carbon, hydrogen, nitrogen, and sulfur
- CO2-TPD
temperature-programmed desorption of carbon dioxide
- FESEM
field emission scanning electron microscopy
- FTIR
Fourier transform Infrared Spectroscopy
- GC-FID
gas chromatography with flame-ionization detection
- GCMS
gas chromatography-mass spectrometry
- GC-TCD
gas chromatography with thermal conductivity detector
- H2-TPR
temperature-programmed reduction of hydrogen
- ICP
inductively coupled plasma
- JCPDS
joint committee on powder diffraction standards
- KBr
potassium bromide
- MPW
microplastic waste
- NaOH
sodium hydroxide
- NH3-TPD
temperature-programmed desorption of ammonia
- NiO
nickel(II) oxide
- NiTiO3
nickel(II) titanate
- PTF
plastic to fuel
- Pd
palladium
- SBET
BET surface area
- SiC
silicon carbide
- TOS
time on stream
- TEM
transmission electron microscopy
- TNPs
titanium nanoparticles
- TiO2
titanium dioxide
- TGA
thermogravimetric analysis
- UNEP
United Nations Environment Programme
- WL
weight loss
- WOS
Web of Science
- XRD
X-ray powder diffraction
The authors declare no competing financial interest.
References
- Fischer M.; Scholz-Böttcher B. M. Simultaneous Trace Identification and Quantification of Common Types of Microplastics in Environmental Samples by Pyrolysis-Gas Chromatography–Mass Spectrometry. Environ. Sci. Technol. 2017, 51, 5052–5060. 10.1021/acs.est.6b06362. [DOI] [PubMed] [Google Scholar]
- Zhang Y. S.; Zhu H. L.; Yao D.; Williams P. T.; Wu C.; Xu D.; Hu Q.; Manos G.; Yu L.; Zhao M.; Shearing P. R.; Brett D. J. L. Thermo-chemical conversion of carbonaceous wastes for CNT and hydrogen production: a review. Sustainable Energy Fuels 2021, 5, 4173–4208. 10.1039/D1SE00619C. [DOI] [Google Scholar]
- Lebreton L.; Andrady A. Future scenarios of global plastic waste generation and disposal. Palgrave Commun. 2019, 5, 6 10.1057/s41599-018-0212-7. [DOI] [Google Scholar]
- Zhao X.; Korey M.; Li K.; Copenhaver K.; Tekinalp H.; Celik S.; Kalaitzidou K.; Ruan R.; Ragauskas A. J.; Ozcan S. Plastic waste upcycling toward a circular economy. Chem. Eng. J. 2022, 428, 131928 10.1016/j.cej.2021.131928. [DOI] [Google Scholar]
- Karam L.; Miglio A.; Specchia S.; El Hassan N.; Massiani P.; Reboul J. PET waste as organic linker source for the sustainable preparation of MOF-derived methane dry reforming catalysts. Mater. Adv. 2021, 2, 2750–2758. 10.1039/D0MA00984A. [DOI] [Google Scholar]
- Ni B.-J.; Zhu Z.-R.; Li W.-H.; Yan X.; Wei W.; Xu Q.; Xia Z.; Dai X.; Sun J. Microplastics Mitigation in Sewage Sludge through Pyrolysis: The Role of Pyrolysis Temperature. Environ. Sci. Technol. Lett. 2020, 7, 961–967. 10.1021/acs.estlett.0c00740. [DOI] [Google Scholar]
- Golwala H.; Zhang X.; Iskander S. M.; Smith A. L. Solid waste: An overlooked source of microplastics to the environment. Sci. Total Environ. 2021, 769, 144581 10.1016/j.scitotenv.2020.144581. [DOI] [PubMed] [Google Scholar]
- Bai B.; Jin H.; Zhu S.; Wu P.; Fan C.; Sun J. Experimental investigation on in-situ hydrogenation induced gasification characteristics of acrylonitrile butadiene styrene (ABS) microplastics in supercritical water. Fuel Process. Technol. 2019, 192, 170–178. 10.1016/j.fuproc.2019.04.020. [DOI] [Google Scholar]
- Awasthi A. K.; Tan Q.; Li J. Biotechnological Potential for Microplastic Waste. Trends Biotechnol. 2020, 38, 1196–1199. 10.1016/j.tibtech.2020.03.002. [DOI] [PubMed] [Google Scholar]
- Mahon A. M.; O’Connell B.; Healy M. G.; O’Connor I.; Officer R.; Nash R.; Morrison L. Microplastics in Sewage Sludge: Effects of Treatment. Environ. Sci. Technol. 2017, 51, 810–818. 10.1021/acs.est.6b04048. [DOI] [PubMed] [Google Scholar]
- Li X.; Mei Q.; Chen L.; Zhang H.; Dong B.; Dai X.; He C.; Zhou J. Enhancement in adsorption potential of microplastics in sewage sludge for metal pollutants after the wastewater treatment process. Water Res. 2019, 157, 228–237. 10.1016/j.watres.2019.03.069. [DOI] [PubMed] [Google Scholar]
- Bosker T.; Bouwman L. J.; Brun N. R.; Behrens P.; Vijver M. G. Microplastics accumulate on pores in seed capsule and delay germination and root growth of the terrestrial vascular plant Lepidium sativum. Chemosphere 2019, 226, 774–781. 10.1016/j.chemosphere.2019.03.163. [DOI] [PubMed] [Google Scholar]
- Kwon D.; Yi S.; Jung S.; Kwon E. E. Valorization of synthetic textile waste using CO2 as a raw material in the catalytic pyrolysis process. Environmental Pollution 2021, 268, 115916 10.1016/j.envpol.2020.115916. [DOI] [PubMed] [Google Scholar]
- Boyle K.; Örmeci B. Microplastics and Nanoplastics in the Freshwater and Terrestrial Environment: A Review. Water 2020, 12, 2633 10.3390/w12092633. [DOI] [Google Scholar]
- Annike F. F.; Hafid Z.; Riyanto S. Pd. In Study on Solubility of Plastic Bottle Waste in Phenol Solution. The 2nd International Seminar on Chemical Education, 2017. [Google Scholar]
- Nabgan B.; Abdullah T. A. T.; Tahir M.; Nabgan W.; Saeh I.; Gambo Y. Steam Reforming of Phenol-PET solution over Ni/Al2O3 Catalyst for Hydrogen Production. Malays. J. Catal. 2017, 2, 18–22. [Google Scholar]
- Raza W.; Lee J.; Raza N.; Luo Y.; Kim K.-H.; Yang J. Removal of phenolic compounds from industrial waste water based on membrane-based technologies. J. Ind. Eng. Chem. 2019, 71, 1–18. 10.1016/j.jiec.2018.11.024. [DOI] [Google Scholar]
- Nabgan W.; Nabgan B.; Tuan Abdullah T. A.; Ngadi N.; Jalil A. A.; Fatah N. A. A.; Alqaraghuli H.; Tahir M. Exploration of reaction mechanisms on the plastic waste polyethylene terephthalate (PET) dissolved in phenol steam reforming reaction to produce hydrogen and valuable liquid fuels. J. Anal. Appl. Pyrolysis 2020, 150, 104860 10.1016/j.jaap.2020.104860. [DOI] [Google Scholar]
- Nabgan W.; Nabgan B.; Tuan Abdullah T. A.; Alqaraghuli H.; Ngadi N.; Jalil A. A.; Othman B. M.; Ibrahim A. M.; Siang T. J. Ni–Pt/Al nano-sized catalyst supported on TNPs for hydrogen and valuable fuel production from the steam reforming of plastic waste dissolved in phenol. Int. J. Hydrogen Energy 2020, 45, 22817–22832. 10.1016/j.ijhydene.2020.06.128. [DOI] [Google Scholar]
- Nabgan W.; Nabgan B.; Abdullah T. A. T.; Ngadi N.; Jalil A. A.; Nordin A. H.; Abd Latif N. A. F.; Othman N. F. H. Hydrogen production from catalytic polyethylene terephthalate waste reforming reaction, an overview. Catal. Sustainable Energy 2020, 7, 45–64. 10.1515/cse-2020-0005. [DOI] [Google Scholar]
- Alipour Moghadam Esfahani R.; Osmieri L.; Specchia S.; Yusup S.; Tavasoli A.; Zamaniyan A. H2-rich syngas production through mixed residual biomass and HDPE waste via integrated catalytic gasification and tar cracking plus bio-char upgrading. Chem. Eng. J. 2017, 308, 578–587. 10.1016/j.cej.2016.09.049. [DOI] [Google Scholar]
- Sangpatch T.; Supakata N.; Kanokkantapong V.; Jongsomjit B. Fuel oil generated from the cogon grass-derived Al–Si (Imperata cylindrica (L.) Beauv) catalysed pyrolysis of waste plastics. Heliyon 2019, 5, e02324 10.1016/j.heliyon.2019.e02324. [DOI] [PMC free article] [PubMed] [Google Scholar]
- Choi D.; Jung S.; Lee S. S.; Lin K.-Y. A.; Park Y.-K.; Kim H.; Tsang Y. F.; Kwon E. E. Leveraging carbon dioxide to control the H2/CO ratio in catalytic pyrolysis of fishing net waste. Renewable Sustainable Energy Rev. 2021, 138, 110559 10.1016/j.rser.2020.110559. [DOI] [Google Scholar]
- Nabgan W.; Nabgan B.; Tuan Abdullah T. A.; Jalil A. A.; Ul-Hamid A.; Ikram M.; Nordin A. H.; Coelho A. Production of hydrogen and valuable fuels from polyethylene terephthalate waste dissolved in phenol reforming and cracking reactions via Ni-Co/CeO2 nano-catalyst. J. Anal. Appl. Pyrolysis 2021, 154, 105018 10.1016/j.jaap.2021.105018. [DOI] [Google Scholar]
- Nabgan W.; Nabgan B.; Tuan Abdullah T. A.; Ngadi N.; Jalil A. A.; Hassan N. S.; Izan S. M.; Luing W. S.; Abdullah S. N.; Majeed F. S. A. Conversion of polyethylene terephthalate plastic waste and phenol steam reforming to hydrogen and valuable liquid fuel: Synthesis effect of Ni–Co/ZrO2 nanostructured catalysts. Int. J. Hydrogen Energy 2020, 45, 6302–6317. 10.1016/j.ijhydene.2019.12.103. [DOI] [Google Scholar]
- Nabgan B.; Nabgan W.; Tuan Abdullah T. A.; Tahir M.; Gambo Y.; Ibrahim M.; Syie Luing W. Parametric study on the steam reforming of phenol-PET solution to hydrogen production over Ni promoted on Al2O3-La2O3 catalyst. Energy Convers. Manage. 2017, 142, 127–142. 10.1016/j.enconman.2017.03.046. [DOI] [Google Scholar]
- Nabgan B.; Abdullah T. A. T.; Tahir M.; Nabgan W.; Triwahyono S.; Jalil A. A.; Gambo Y.; Ibrahim M.; Moghadamian K. Pellet size dependent steam reforming of polyethylene terephthalate waste for hydrogen production over Ni/La promoted Al2O3 catalyst. Int. J. Hydrogen Energy 2017, 42, 21571–21585. 10.1016/j.ijhydene.2017.07.103. [DOI] [Google Scholar]
- Nabgan W.; Mat R.; Abdullah T. A. T.; Nabgan B.; Gambo Y.; Zakaria Z. Y. Development of a kinetic model for hydrogen production from phenol over Ni-Co/ZrO2 catalyst. J. Environ. Chem. Eng. 2016, 4, 4444–4452. 10.1016/j.jece.2016.10.013. [DOI] [Google Scholar]
- Nabgan W.; Tuan Abdullah T. A.; Mat R.; Nabgan B.; Gambo Y.; Triwahyono S. Influence of Ni to Co ratio supported on ZrO2 catalysts in phenol steam reforming for hydrogen production. Int. J. Hydrogen Energy 2016, 41, 22922–22931. 10.1016/j.ijhydene.2016.10.055. [DOI] [Google Scholar]
- Nabgan W.; Tuan Abdullah T.; Mat R.; Nabgan B.; Gambo Y.; Johari A. Evaluation of reaction parameters of the phenol steam reforming over Ni/Co on ZrO2 using the full factorial experimental design. Appl. Sci. 2016, 6, 223 10.3390/app6080223. [DOI] [Google Scholar]
- Nabgan W.; Tuan Abdullah T. A.; Mat R.; Nabgan B.; Asli U. A.; Johari A. Hydrogen production from phenol steam reforming over Ni-Co/ZrO2 catalyst: effect of catalyst dilution. J. Teknol. 2016, 78, 77–82. 10.11113/jt.v78.9569. [DOI] [Google Scholar]
- Nabgan W.; Tuan Abdullah T. A.; Mat R.; Nabgan B.; Gambo Y.; Moghadamian K. Acetic acid-phenol steam reforming for hydrogen production: Effect of different composition of La2O3-Al2O3 support for bimetallic Ni-Co catalyst. J. Environ. Chem. Eng. 2016, 4, 2765–2773. 10.1016/j.jece.2016.05.030. [DOI] [Google Scholar]
- Nabgan W.; Tuan Abdullah T. A.; Mat R.; Nabgan B.; Triwahyono S.; Ripin A. Hydrogen production from catalytic steam reforming of phenol with bimetallic nickel-cobalt catalyst on various supports. Appl. Catal., A 2016, 527, 161–170. 10.1016/j.apcata.2016.08.033. [DOI] [Google Scholar]
- Li K.; Lei J.; Yuan G.; Weerachanchai P.; Wang J.-Y.; Zhao J.; Yang Y. Fe-, Ti-, Zr- and Al-pillared clays for efficient catalytic pyrolysis of mixed plastics. Chem. Eng. J. 2017, 317, 800–809. 10.1016/j.cej.2017.02.113. [DOI] [Google Scholar]
- McNamara N. D.; Kim J.; Hicks J. C. Controlling the Pyrolysis Conditions of Microporous/Mesoporous MIL-125 To Synthesize Porous, Carbon-Supported Ti Catalysts with Targeted Ti Phases for the Oxidation of Dibenzothiophene. Energy Fuels 2016, 30, 594–602. 10.1021/acs.energyfuels.5b01946. [DOI] [Google Scholar]
- Sánchez-Rodríguez D.; Méndez Medrano M. G.; Remita H.; Escobar-Barrios V. Photocatalytic properties of BiOCl-TiO2 composites for phenol photodegradation. J. Environ. Chem. Eng. 2018, 6, 1601–1612. 10.1016/j.jece.2018.01.061. [DOI] [Google Scholar]
- Bagheri S.; Muhd Julkapli N.; Bee Abd Hamid S. Titanium Dioxide as a Catalyst Support in Heterogeneous Catalysis. Sci. World J. 2014, 2014, 727496 10.1155/2014/727496. [DOI] [PMC free article] [PubMed] [Google Scholar]
- Darif B.; Ojala S.; Pirault-Roy L.; Bensitel M.; Brahmi R.; Keiski R. L. Study on the catalytic oxidation of DMDS over Pt-Cu catalysts supported on Al2O3, AlSi20 and SiO2. Appl. Catal., B 2016, 181, 24–33. 10.1016/j.apcatb.2015.07.050. [DOI] [Google Scholar]
- Park C.; Kim S.; Kwon Y.; Jeong C.; Cho Y.; Lee C.-G.; Jung S.; Choi K.-Y.; Lee J. Pyrolysis of Polyethylene Terephthalate over Carbon-Supported Pd Catalyst. Catalysts 2020, 10, 496 10.3390/catal10050496. [DOI] [Google Scholar]
- Hijazi A.; Al-Muhtaseb A. H.; Aouad S.; Ahmad M. N.; Zeaiter J. Pyrolysis of waste rubber tires with palladium doped zeolite. J. Environ. Chem. Eng. 2019, 7, 103451 10.1016/j.jece.2019.103451. [DOI] [Google Scholar]
- Nabgan W.; Abdullah T. A. T.; Mat R.; Nabgan B.; Jalil A. A.; Firmansyah L.; Triwahyono S. Production of hydrogen via steam reforming of acetic acid over Ni and Co supported on La2O3 catalyst. Int. J. Hydrogen Energy 2017, 42, 8975–8985. 10.1016/j.ijhydene.2016.04.176. [DOI] [Google Scholar]
- Tuan Abdullah T. A.; Nabgan W.; Kamaruddin M. J.; Mat R.; Johari A.; Ahmad A. Hydrogen production from acetic acid steam reforming over bimetallic Ni-Co on La2O3 catalyst- Effect of the catalyst dilution. Appl. Mech. Mater. 2014, 493, 39–44. 10.4028/www.scientific.net/AMM.493.39. [DOI] [Google Scholar]
- Zou W. H.; Han X. D.; Wang R.; Zhang Z.; Zhang W. Z.; Lai J. K. L. TEM and HREM study of the interphase interface structure of Ti3Ni4 precipitates and parent phase in an aged TiNi shape memory alloy. Mater. Sci. Eng., A 1996, 219, 142–147. 10.1016/S0921-5093(96)10418-4. [DOI] [Google Scholar]
- Li D. Y.; Chen L. Q. Selective variant growth of coherent precipitate under external constraints. J. Phase Equilib. 1998, 19, 523. 10.1361/105497198770341707. [DOI] [Google Scholar]
- Radi A.; Khalil-Allafi J.; Etminanfar M. R.; Pourbabak S.; Schryvers D.; Amin-Ahmadi B. Influence of stress aging process on variants of nano-Ni4Ti3 precipitates and martensitic transformation temperatures in NiTi shape memory alloy. Mater. Des. 2018, 142, 93–100. 10.1016/j.matdes.2018.01.024. [DOI] [Google Scholar]
- Khalil-Allafi J.; Dlouhy A.; Eggeler G. Ni4Ti3-precipitation during aging of NiTi shape memory alloys and its influence on martensitic phase transformations. Acta Mater. 2002, 50, 4255–4274. 10.1016/S1359-6454(02)00257-4. [DOI] [Google Scholar]
- Panton B.Laser Processing, Thermomechanical Processing, and Thermomechanical Fatigue of NiTi Shape Memory Alloys.; UWSpace, 2016.
- Wang Z.; Wang Z.; Yang W.; Peng R.; Lu Y. Carbon-tolerant solid oxide fuel cells using NiTiO3 as an anode internal reforming layer. J. Power Sources 2014, 255, 404–409. 10.1016/j.jpowsour.2014.01.014. [DOI] [Google Scholar]
- Kolobova E.; Kotolevich Y.; Pakrieva E.; Mamontov G.; Farías M. H.; Bogdanchikova N.; Cortés Corberán V.; Pestryakov A. Causes of Activation and Deactivation of Modified Nanogold Catalysts during Prolonged Storage and Redox Treatments. Molecules 2016, 21, 486 10.3390/molecules21040486. [DOI] [PMC free article] [PubMed] [Google Scholar]
- Inturi S. N. R.; Boningari T.; Suidan M.; Smirniotis P. G. Visible-light-induced photodegradation of gas phase acetonitrile using aerosol-made transition metal (V, Cr, Fe, Co, Mn, Mo, Ni, Cu, Y, Ce, and Zr) doped TiO2. Appl. Catal., B 2014, 144, 333–342. 10.1016/j.apcatb.2013.07.032. [DOI] [Google Scholar]
- Hammedi T.; Triki M.; Ksibi Z.; Ghorbel A.; Medina F. Catalytic wet hydrogen peroxide oxidation of p-hydroxybenzoic acid over Fe/TiO2 and 0.5Ru–3Fe/TiO2. J. Sol-Gel Sci. Technol. 2015, 76, 679–685. 10.1007/s10971-015-3820-3. [DOI] [Google Scholar]
- Zhao Q.; Ge Y.; Fu K.; Ji N.; Song C.; Liu Q. Oxidation of acetone over Co-based catalysts derived from hierarchical layer hydrotalcite: Influence of Co/Al molar ratios and calcination temperatures. Chemosphere 2018, 204, 257–266. 10.1016/j.chemosphere.2018.03.198. [DOI] [PubMed] [Google Scholar]
- Tseng-Chang T.; Hsiang-Yun K.; Shih-Tsung Y.; Chao-Tai C. Effects of acid strength of fluid cracking catalysts on resid cracking operation. Appl. Catal. 1989, 50, 1–13. 10.1016/S0166-9834(00)80820-9. [DOI] [Google Scholar]
- Cao S.; Shi M.; Wang H.; Yu F.; Weng X.; Liu Y.; Wu Z. A two-stage Ce/TiO2–Cu/CeO2 catalyst with separated catalytic functions for deep catalytic combustion of CH2Cl2. Chem. Eng. J. 2016, 290, 147–153. 10.1016/j.cej.2015.12.107. [DOI] [Google Scholar]
- Echeandia S.; Pawelec B.; Barrio V. L.; Arias P. L.; Cambra J. F.; Loricera C. V.; Fierro J. L. G. Enhancement of phenol hydrodeoxygenation over Pd catalysts supported on mixed HY zeolite and Al2O3. An approach to O-removal from bio-oils. Fuel 2014, 117, 1061–1073. 10.1016/j.fuel.2013.10.011. [DOI] [Google Scholar]
- Marin-Flores O. G.; Karim A. M.; Wang Y. Role of tungsten in the aqueous phase hydrodeoxygenation of ethylene glycol on tungstated zirconia supported palladium. Catal. Today 2014, 237, 118–124. 10.1016/j.cattod.2014.03.068. [DOI] [Google Scholar]
- Zhao W.; Zhang K.; Wu L.; Wang Q.; Shang D.; Zhong Q. Ti3+ doped V2O5/TiO2 catalyst for efficient selective catalytic reduction of NOx with NH3. J. Colloid Interface Sci. 2021, 581, 76–83. 10.1016/j.jcis.2020.07.131. [DOI] [PubMed] [Google Scholar]
- Kawi S.; Kathiraser Y.; Ni J.; Oemar U.; Li Z.; Saw E. T. Progress in Synthesis of Highly Active and Stable Nickel-Based Catalysts for Carbon Dioxide Reforming of Methane. ChemSusChem 2015, 8, 3556–3575. 10.1002/cssc.201500390. [DOI] [PubMed] [Google Scholar]
- Kumar P.; Srivastava V. C.; Mishra I. M. Synthesis and characterization of Ce–La oxides for the formation of dimethyl carbonate by transesterification of propylene carbonate. Catal. Commun. 2015, 60, 27–31. 10.1016/j.catcom.2014.11.006. [DOI] [Google Scholar]
- Westermann A.; Azambre B.; Bacariza M. C.; Graça I.; Ribeiro M. F.; Lopes J. M.; Henriques C. The promoting effect of Ce in the CO2 methanation performances on NiUSY zeolite: A FTIR In Situ/Operando study. Catal. Today 2017, 283, 74–81. 10.1016/j.cattod.2016.02.031. [DOI] [Google Scholar]
- Li S.; Liu G.; Zhang S.; An K.; Ma Z.; Wang L.; Liu Y. Cerium-modified Ni-La2O3/ZrO2 for CO2 methanation. J. Energy Chem. 2020, 43, 155–164. 10.1016/j.jechem.2019.08.024. [DOI] [Google Scholar]
- Naresh D.; Kumar V. P.; Harisekhar M.; Nagaraju N.; Putrakumar B.; Chary K. V. R. Characterization and functionalities of Pd/hydrotalcite catalysts. Appl. Surf. Sci. 2014, 314, 199–207. 10.1016/j.apsusc.2014.06.156. [DOI] [Google Scholar]
- Rossi P. F.; Busca G.; Lorenzelli V.; Waqif M.; Saur O.; Lavalley J. C. Surface basicity of mixed oxides: magnesium and zinc aluminates. Langmuir 1991, 7, 2677–2681. 10.1021/la00059a046. [DOI] [Google Scholar]
- Seema K. M.; Mamba B. B.; Njuguna J.; Bakhtizin R. Z.; Mishra A. K. Removal of lead (II) from aqeouos waste using (CD-PCL-TiO2) bio-nanocomposites. Int. J. Biol. Macromol. 2018, 109, 136–142. 10.1016/j.ijbiomac.2017.12.046. [DOI] [PubMed] [Google Scholar]
- Cai G.; Tu J.; Zhou D.; Zhang J.; Xiong Q.; Zhao X.; Wang X.; Gu C. Multicolor Electrochromic Film Based on TiO2@Polyaniline Core/Shell Nanorod Array. J. Phys. Chem. C 2013, 117, 15967–15975. 10.1021/jp4056939. [DOI] [Google Scholar]
- Rahbar M.; Mehrzad M.; Behpour M.; Mohammadi-Aghdam S.; Ashrafi M. S, N co-doped carbon quantum dots/TiO2 nanocomposite as highly efficient visible light photocatalyst. Nanotechnology 2019, 30, 505702 10.1088/1361-6528/ab40dc. [DOI] [PubMed] [Google Scholar]
- He Y.; Sutton N. B.; Rijnaarts H. H. H.; Langenhoff A. A. M. Degradation of pharmaceuticals in wastewater using immobilized TiO2 photocatalysis under simulated solar irradiation. Appl. Catal., B 2016, 182, 132–141. 10.1016/j.apcatb.2015.09.015. [DOI] [Google Scholar]
- Wang X.; Li X.; Zhao Q.; Sun W.; Tade M.; Liu S. Improved activity of W-modified MnOx–TiO2 catalysts for the selective catalytic reduction of NO with NH3. Chem. Eng. J. 2016, 288, 216–222. 10.1016/j.cej.2015.12.002. [DOI] [Google Scholar]
- Wang T.; Li C.; Zhao L.; Zhang J.; Li S.; Zeng G. The catalytic performance and characterization of ZrO2 support modification on CuO-CeO2/TiO2 catalyst for the simultaneous removal of Hg0 and NO. Appl. Surf. Sci. 2017, 400, 227–237. 10.1016/j.apsusc.2016.12.192. [DOI] [Google Scholar]
- Hu Z.; Yong X.; Li D.; Yang R. T. Synergism between palladium and nickel on Pd-Ni/TiO2 for H2-SCR: A transient DRIFTS study. J. Catal. 2020, 381, 204–214. 10.1016/j.jcat.2019.11.006. [DOI] [Google Scholar]
- Wang L.; Liu X.; Dang Y.; Xie H.; Zhao Q.; Ye L. Enhanced solar induced photo-thermal synergistic catalytic CO2 conversion by photothermal material decorated TiO2. Solid State Sci. 2019, 89, 67–73. 10.1016/j.solidstatesciences.2018.12.018. [DOI] [Google Scholar]
- Kiwi J.; Nadtochenko V. New Evidence for TiO2 Photocatalysis during Bilayer Lipid Peroxidation. J. Phys. Chem. B 2004, 108, 17675–17684. 10.1021/jp048281a. [DOI] [Google Scholar]
- Osman Z.; Arof A. K. FTIR studies of chitosan acetate based polymer electrolytes. Electrochim. Acta 2003, 48, 993–999. 10.1016/S0013-4686(02)00812-5. [DOI] [Google Scholar]
- Lin S.-Y.; Hsu C.-H.; Sheu M.-T. Curve-fitting FTIR studies of loratadine/hydroxypropyl-β-cyclodextrin inclusion complex induced by co-grinding process. J. Pharm. Biomed. Anal. 2010, 53, 799–803. 10.1016/j.jpba.2010.06.010. [DOI] [PubMed] [Google Scholar]
- Sen A.; Lai T. W. Catalytic polymerization of acetylenes and olefins by tetrakis(acetonitrile)palladium(II) ditetrafluoroborate. Organometallics 1982, 1, 415–417. 10.1021/om00062a038. [DOI] [Google Scholar]
- Zhang Y.; Peng Y.; Li K.; Liu S.; Chen J.; Li J.; Gao F.; Peden C. H. F. Using Transient FTIR Spectroscopy to Probe Active Sites and Reaction Intermediates for Selective Catalytic Reduction of NO on Cu/SSZ-13 Catalysts. ACS Catal. 2019, 9, 6137–6145. 10.1021/acscatal.9b00759. [DOI] [Google Scholar]
- Kunwong D.; Sumanochitraporn N.; Kaewpirom S. Curing behavior of a UV-curable coating based on urethane acrylate oligomer: the influence of reactive monomers. Sonklanakarin J. Sci. Technol. 2011, 33, 201. [Google Scholar]
- Chutirat J.; Eaimsumang S.; Luengnaruemitchai A. Influence of nitric acid-assisted hydrothermal conditions on the characteristics of TiO2 catalysts and their activity in the oxidative steam reforming of methanol. Adv. Powder Technol. 2020, 31, 4731–4742. 10.1016/j.apt.2020.11.004. [DOI] [Google Scholar]
- Li S.; Zhu C.; Guo S.; Guo L. A dispersed rutile-TiO2-supported Ni nanoparticle for enhanced gas production from catalytic hydrothermal gasification of glucose. RSC Adv. 2015, 5, 81905–81914. 10.1039/C5RA12025J. [DOI] [Google Scholar]
- Artetxe M.; Nahil M. A.; Olazar M.; Williams P. T. Steam reforming of phenol as biomass tar model compound over Ni/Al2O3 catalyst. Fuel 2016, 184, 629–636. 10.1016/j.fuel.2016.07.036. [DOI] [Google Scholar]
- Lam S. S.; Russell A. D.; Lee C. L.; Chase H. A. Microwave-heated pyrolysis of waste automotive engine oil: Influence of operation parameters on the yield, composition, and fuel properties of pyrolysis oil. Fuel 2012, 92, 327–339. 10.1016/j.fuel.2011.07.027. [DOI] [Google Scholar]
- Singh S.; Chakraborty J. P.; Mondal M. K. Pyrolysis of torrefied biomass: Optimization of process parameters using response surface methodology, characterization, and comparison of properties of pyrolysis oil from raw biomass. J. Cleaner Prod. 2020, 272, 122517 10.1016/j.jclepro.2020.122517. [DOI] [Google Scholar]
- Fu P.; Hu S.; Xiang J.; Li P.; Huang D.; Jiang L.; Zhang A.; Zhang J. FTIR study of pyrolysis products evolving from typical agricultural residues. J. Anal. Appl. Pyrolysis 2010, 88, 117–123. 10.1016/j.jaap.2010.03.004. [DOI] [Google Scholar]
- Silva J. M.; Soria M. A.; Madeira L. M. Challenges and strategies for optimization of glycerol steam reforming process. Renewable Sustainable Energy Rev. 2015, 42, 1187–1213. 10.1016/j.rser.2014.10.084. [DOI] [Google Scholar]
- Zhao B.; Yan B.; Yao S.; Xie Z.; Wu Q.; Ran R.; Weng D.; Zhang C.; Chen J. G. LaFe0.9Ni0.1O3 perovskite catalyst with enhanced activity and coke-resistance for dry reforming of ethane. J. Catal. 2018, 358, 168–178. 10.1016/j.jcat.2017.12.012. [DOI] [Google Scholar]
- Rahemi N.; Haghighi M.; Babaluo A. A.; Jafari M. F.; Khorram S. Non-thermal plasma assisted synthesis and physicochemical characterizations of Co and Cu doped Ni/Al2O3 nanocatalysts used for dry reforming of methane. Int. J. Hydrogen Energy 2013, 38, 16048–16061. 10.1016/j.ijhydene.2013.08.084. [DOI] [Google Scholar]
- Kim J.-H.; Suh D. J.; Park T.-J.; Kim K.-L. Effect of metal particle size on coking during CO2 reforming of CH4 over Ni–alumina aerogel catalysts. Appl. Catal., A 2000, 197, 191–200. 10.1016/S0926-860X(99)00487-1. [DOI] [Google Scholar]
- Harju H.; Pipitone G.; Lefferts L. Influence of the Catalyst Particle Size on the Aqueous Phase Reforming of n-Butanol Over Rh/ZrO2. Front. Chem. 2020, 8, 17 10.3389/fchem.2020.00017. [DOI] [PMC free article] [PubMed] [Google Scholar]


