Abstract
In nature, methane is oxidized to methanol by two enzymes, the iron-dependent soluble methane monooxygenase (sMMO) and the copper-dependent particulate MMO (pMMO). While sMMO’s diiron metal active site is spectroscopically and structurally well-characterized, pMMO’s copper sites are not. Recent EPR and ENDOR studies have established the presence of two monocopper sites, but the coordination environment of only one has been determined, that within the PmoB subunit and denoted CuB. Moreover, this recent work only focused on a type I methanotrophic pMMO, while previous observations of the type II enzyme were interpreted in terms of the presence of a dicopper site. First, this report shows that the type II Methylocystis species strain Rockwell pMMO, like the type I pMMOs, contains two monocopper sites and that its CuB site has a coordination environment identical to that of type I enzymes. As such, for the full range of pMMOs this report completes the refutation of prior and ongoing suggestions of multicopper sites. Second, and of primary importance, EPR/ENDOR measurements (a) for the first time establish the coordination environment of the spectroscopically observed site, provisionally denoted CuC, in both types of pMMO, thereby (b) establishing the assignment of this site observed by EPR to the crystallographically observed metal-binding site in the PmoC subunit. Finally, these results further indicate that CuC is the likely site of biological methane oxidation by pMMO, a conclusion that will serve as a foundation for proposals regarding the mechanism of this reaction.
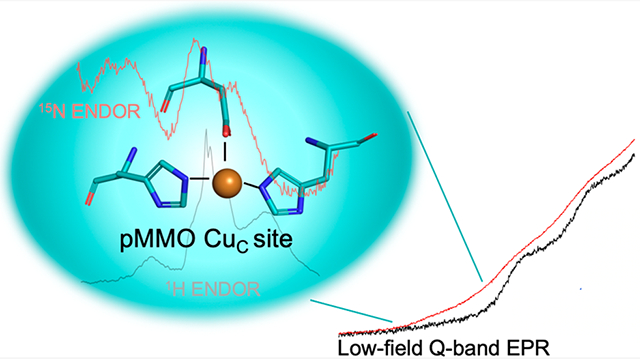
Graphical Abstract
INTRODUCTION
Copper-dependent monooxygenase enzymes exploit the Cu-(I)/Cu(II) redox couple to activate O2 and insert one oxygen atom into organic substrates with strong C─H bonds, including the α carbon of glycine (C─H bond enthalpy, 87 kcal/mol),1 polysaccharides (~100 kcal/mol),2 and methane, with the strongest C─H bond (105 kcal/mol).3 The enzymes that oxidize these three substrates, respectively peptidylgycine α-hydroxylating monooxygenase (PHM),4 lytic polysaccharide monooxygenases (LPMOs), and particulate methane monooxygenase (pMMO), have been studied intensively with the goal of elucidating their chemical mechanisms. Members of the PHM family contain two well-characterized monocopper centers5 (denoted as CuM and CuH),4 while LPMO enzymes feature a single histidine brace-coordinated mononuclear copper active site.6,7 By contrast, mechanistic characterization of pMMO has been hindered by the absence of a molecular understanding of its active site location, nuclearity, and coordination environment.3,8 Such details are not only a prerequisite for mechanistic characterization but are also crucial if pMMO is to be utilized in biotechnological applications.9
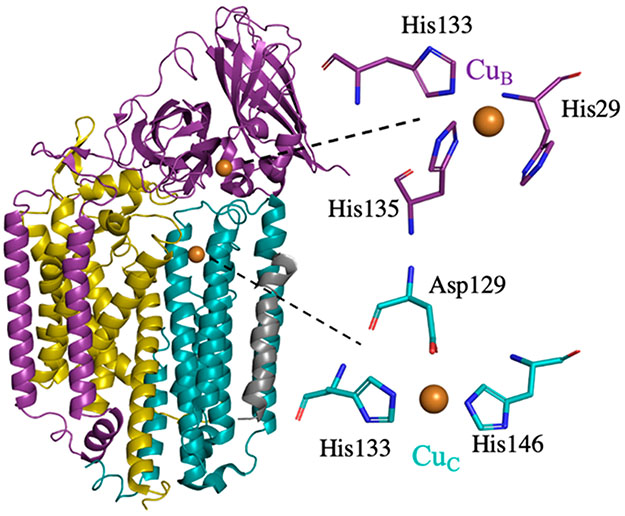
pMMO is an integral-membrane enzyme comprising three subunits, PmoA, PmoB, and PmoC, arranged in a 300 kDa α3β3γ3 complex. On the basis of multiple pMMO crystal structures, two copper centers have emerged as potential active sites, one located in PmoB (CuB) and one located in PmoC (CuC) (Figure 1). The CuB site includes three histidine ligands, His29, His133, and His135, using type II Methylocystis (Mc.) species (sp.) strain (str.) Rockwell pMMO numbering, and in crystal structures has been modeled as being both mononuclear and dinuclear.10-13 However, several recent studies have firmly established its identity as mononuclear, including quantum refinement of the original Methylococcus capsulatus (Bath) pMMO crystal structure14 and native top-down mass spectrometry (nTDMS), which revealed the presence of a single copper ion localized to the amino terminus of PmoB.15 Most importantly, comprehensive electron paramagnetic resonance (EPR) and electron nuclear double resonance (ENDOR) spectroscopic analysis of M. capsulatus (Bath) whole cells cultivated on 15N isotopically enriched media indicated that the CuB site of this type I pMMO is mononuclear, revealed its coordination environment (three histidine ligands and an axially bound water), and showed that it is primarily present in the cell as CuB(II).16 The assignment of CuB as mononuclear is also supported by a recent reinvestigation of pMMO by X-ray absorption spectroscopy.17 Given the saturated equatorial coordination found for CuB and its presence as Cu(II) even in vivo, it is not likely to be the site of dioxygen and methane binding. In support of this conclusion, the three CuB histidine ligands are not conserved in a subset of pMMOs from type III methanotrophic verrucomicrobia.18
Figure 1.
A single protomer from the crystal structure of Mc. sp. str. Rockwell pMMO (PDB accession code 4PHZ). PmoA is light gold, PmoB is purple, PmoC is teal, and an unidentified helix is gray. The two copper ions are shown as spheres and to the right are expanded to show the modeled coordinating residues.
There is also a crystallographically identified metal-binding site in the PmoC subunit whose ligand set, which includes Asp129, His133, and His146 (Figure 1), is strictly conserved in pMMOs from all types of methanotrophs.18 In some pMMO structures, these three ligands coordinate a zinc ion from the crystallization buffer.10,11 In the absence of zinc, the site is occupied by copper.12,19 Furthermore, this site is adjacent to a highly conserved region of PmoC that is disordered in all the crystal structures,3 and nTDMS fragmentation of PmoC was not successful, underscoring the dearth of information about the properties of this site.15 EPR spectra of whole cells,16 anaerobically isolated membranes,20 and isolated and purified type I M. capsulatus (Bath) pMMO in the presence of ascorbate reductant16 show only a signal from a single Cu(II) that is identified as the CuB site through ENDOR measurements. This indicates that if the metal-binding site in PmoC is indeed occupied by copper, it is present as Cu(I) in vivo and upon ascorbate reduction. Upon isolation and aerobic purification of M. capsulatus (Bath) pMMO, an EPR signal, provisionally denoted CuC, was detected and shown to be perturbed upon addition of nitrite, a pMMO inhibitor.16 However, although double electron electron resonance (DEER) measurements were consistent with the location of CuC in the PmoC subunit,16 the coordination environment of this copper ion was not determined and thus it was not definitively localized to the crystallographically observed copper site in PmoC.
Comprehensive EPR and ENDOR analysis of the CuB site was possible because it is conveniently monitored without overlap from the signal from CuC, which is readily reduced to Cu(I). However, the CuC EPR signal overlaps with that of CuB and cannot be observed unhindered by selective reduction of CuB. Moreover, our previous detailed EPR and ENDOR studies16,21 focused on pMMO from M. capsulatus (Bath), a type I methanotroph, while the crystal structures guiding the interpretations include pMMOs from type II methanotrophs as well. These two methanotroph subclasses differ in cell morphologies, metabolic aspects, and lipid content,22 and their pMMOs exhibit structural differences, including an unidentified helix in the type II methanotroph pMMO structures.18 In addition, some type I methanotroph pMMOs contain a third “bis-His” copper site in the PmoB subunit10 that has not been observed in the type II methanotroph pMMOs.11,12,19
In this report we show that the Mc. sp. str. Rockwell type II pMMO likewise contains two monocopper sites and that the electronic and coordination environment of the CuB site is conserved across pMMOs from both type I and type II methanotrophs. In doing so, we have collected EPR spectra of Mc. sp. str. Rockwell whole cells and of its purified/reduced type II pMMO and have used 1H and 15N ENDOR to probe its CuB site, while carrying out additional measurements on the type I M. capsulatus (Bath) pMMO that reveal further details of the CuB site.
Of primary importance, 15N ENDOR studies of CuC were carried out on purified 15N, 63Cu isotopically enriched pMMOs from both type I and type II methanotrophs by performing the measurements at fields where the CuC EPR signal does not overlap that of CuB. The results are the same for the two pMMO types and for the first time identify the presence of two histidyl ligands that coordinate the spectroscopically observed CuC, thereby showing that the spectroscopic CuC is appropriately assigned to the conserved and crystallographically observed metal-binding site in the PmoC subunit. 1H ENDOR spectra in combination with the crystallographic data further suggest that CuC exhibits only three equatorial ligands and reveal that it is without axial ligation. The redox activity of the strictly conserved CuC site under conditions in which the CuB site remains oxidized, in conjunction with the nitrite interaction at the open coordination site of CuC,16 and the nTDMS data correlating the extent of copper binding to PmoC with activity15 together strongly suggest that CuC is the active site of biological methane oxidation by pMMO, a conclusion that lays the foundation for future mechanistic proposals and studies.
MATERIALS AND METHODS
Growth of Mc. sp str. Rockwell.
To produce 63CuSO4 for enrichment growths, 50 mg aliquots of 63CuO (Cambridge Isotope Laboratories) were dissolved in 1.5 mL of 3 M trace metal grade H2SO4 while heating at 60–80 °C and shaking at 300 rpm. The reaction was judged to be complete when no black 63CuO particles were visible in the blue 63CuSO4 solution after several days. Mc. sp. str. Rockwell was grown in a 12 L fermentor as previously described23 with minor adjustments. The medium consisted of 3.9 mM phosphate buffer, pH 6.8, 40 μM NaFe(III)EDTA, 1× trace element solution, 50 μM CuSO4 (63CuSO4 prepared as described above was used for enrichment growths), and 1× nitrate mineral salts (NMS) (potassium 15N-nitrate, 99.98% enrichment, Cambridge Isotopes Laboratories, was used for isotope enriched samples) with a constant gas flow of ~1 L/min with a 1:4 methane:air gas mixture. The pH was maintained between 6.7 and 7.2 by addition of NaOH and H2SO4 as the growth proceeded. Cells were harvested by centrifugation (8000g for 35 min at 4 °C) at an OD600 of 10.6 and were either used immediately or frozen in liquid nitrogen and stored at −80 °C. M. capsulatus (Bath) was grown and purified as described previously.13
Preparation of Whole Cell EPR and ENDOR Samples.
Freshly harvested cell paste (0.75 g) was resuspended in 50 mL of 12.2 mM dibasic sodium phosphate, 7.8 mM monobasic sodium phosphate, 5 mM magnesium chloride, pH 7.2. The resuspended cells were then centrifuged for 15 min at 10 000g. The supernatant was removed, and this wash procedure was repeated twice more. After the third spin, the cells were resuspended in 150 μL of the phosphate buffer and aliquoted into a Wilmad quartz X-band EPR tube (Sigma-Aldrich) and a custom quartz Q-band EPR tube. EPR samples were frozen in liquid nitrogen and stored in a liquid nitrogen Dewar until analysis.
Mc. sp. str. Rockwell pMMO Purification.
Frozen cells were resuspended in room-temperature 25 mM PIPES, 250 mM NaCl, pH 7.2 and lysed by sonication (1 s on, 1 s off, 10 min, 90% power setting). The cell debris was removed, and the membranes were isolated and washed as described previously.12 The washed membranes were then resuspended in the PIPES buffer to 300 μM total protein, as determined by the Bio-Rad DC Lowry assay (with BSA as a standard), aliquoted in X-band and Q-band EPR tubes, and frozen in liquid nitrogen until analysis. Membranes were aliquoted, flash frozen in liquid nitrogen, and stored at −80 °C until further purification. Mc. sp. str. Rockwell pMMO was further purified and solubilized as described previously, but with PIPES instead of Tris buffer to avoid copper chelation by the buffer.12 In brief, membranes were solubilized with n-dodecyl β-d-maltopyranoside (DDM), diluted with 25 mM PIPES, 0 M NaCl buffer, pH 7.2, and centrifuged at 100 000g for 1 h, and the soluble fraction was loaded onto a Source 15Q column (GE Healthcare). Fractions were assessed for purity by SDS PAGE, and those deemed pure were collected, concentrated, and flash frozen for later use. The protein concentration was determined by measuring the absorbance at 280 nm and using the extinction coefficient 7.66 × 10³ M−1 cm−1.12
pMMO Nanodisc Reconstitution.
DDM-solubilized M. capsulatus (Bath) pMMO was incorporated into lipid nanodiscs with membrane scaffold protein (MSP1E3D1) and 1-palmitoyl-2-oleoylglycero-3-phosphocholine (POPC) using established methods.24 pMSP1E3D1 (Addgene) was transformed into Escherichia coli BL21(DE3) cells and grown in TB media for 4 h at 37 °C until an OD600 of 2.1 was reached. Expression was induced by adding 1 mM IPTG, and cells were grown for another 4 h at 37 °C before pelleting and flash-freezing. Cells were resuspended in lysis buffer containing 40 mM Tris, pH 7.3, 250 mM NaCl, and 10 mM imidazole along with DNase, EDTA-free protease inhibitor cocktail (Roche), and 1% Triton X-100. Cells were lysed by sonication (10 min, 1 s on, 2 s off), and debris was removed by centrifugation at 10 000g for 30 min. The soluble fraction was applied to a Ni-NTA column and washed with 5 column volumes of lysis buffer containing 50 mM sodium cholate followed by 10 column volumes of lysis buffer. MSP1E3D1 was eluted with lysis buffer containing 250 mM imidazole. TEV protease was added at a ratio of 1:20, and the sample was dialyzed overnight at 4 °C against lysis buffer containing 1 mM EDTA. Cleaved MSP1E3D1 was collected from the Ni-NTA column flow-through and dialyzed overnight against the PIPES buffer before concentrating and flash freezing. POPC solubilized in chloroform (Avanti) was dried to a thin layer in a glass vial against a stream of argon and then overnight in a vacuum desiccator. POPC was suspended at 50 mM in buffer containing 25 mM PIPES, pH 7.3, 250 mM NaCl, and 100 mM cholate by alternating heating at 60 °C, sonicating in an ultrasonic bath, and vortexing. Nanodisc components were mixed for 30 min at 4 °C at a ratio of 1:4:240 pMMO:MSP1E3D1:POPC. Biobeads SM-2 (Bio-Rad) washed with the PIPES buffer were added at 0.8 mg/mL and mixed end-over-end for 2 h before removal. Nanodiscs containing pMMO were purified using a Superose 6 10/300 column (Cytiva). EPR and ENDOR sample preparation is described below.
Preparation of Purified Mc. sp. str. Rockwell pMMO EPR and ENDOR Samples.
Samples of purified pMMO were loaded into X- and Q-band tubes and flash frozen. For partially reduced pMMO samples, an aliquot of pMMO was brought into a Coy anaerobic chamber and left for 24 h at 4 °C shaking at 400 rpm to remove dioxygen from the sample. Twelve equivalents of sodium ascorbic acid per 100 kDa protomer of pMMO was then added to the sample and allowed to incubate for 2 h at room temperature prior to freezing in an EPR tube anaerobically with liquid nitrogen and storing under liquid nitrogen. D2O samples were produced by adding purified pMMO to D2O buffer in a 1:10 000 dilution. This sample was kept for ~24 h at room temperature to exchange the protons within the enzyme and then concentrated with a 100 kDa MWCO Amicon concentrator. The concentration of purified Mc. sp. str. Rockwell pMMO was determined by using the absorbance at 280 nm and the calculated extinction coefficient of 7.66 × 10³ M−1 cm−1. The concentrated sample was then either frozen in an EPR tube or brought into the anaerobic chamber and reduced as described above.
EPR and ENDOR Measurements.
All CW (continuous wave) X-band EPR measurements were performed on a Bruker ESP-300 spectrometer with a liquid helium flow Oxford Instruments ESR-900 cryostat. EPR simulations were carried out in EasySpin.25 Pulsed ENDOR measurements were collected at ~2 K on a spectrometer described previously, with SpinCore PulseBlaster ESR_PRO 400 MHz digital word generator and Agilent Technologies Acquiris DP235 500 MS/s digitizer using SpecMan4EPR software.26,27 For weakly coupled remote 15N ENDOR measurements, a Refocused Mims ENDOR (ReMims) pulse sequence [] was utilized in which TRF denotes the interval during which the RF was applied.28 Strongly coupled 15N ENDOR measurements employed a Davies pulse sequence [].29 The 35 GHz CW ENDOR spectra were recorded on a modified Varian E-110 spectrometer equipped with a helium immersion dewar.30 CuB site 1H CW ENDOR spectra were collected using the field modulation detected stochastic ENDOR sequence31 in order to resolve the strongly coupled protons. The CuB 15N signals show peaks from two ligand types; to obtain the relative intensities of the two contributions, the signals were fit to a sum of Gaussians to determine their area ratio using the following equation:
| (1) |
Here σ is a line width parameter and μ is the frequency of a peak, the primes distinguishing the two contributions; r is a fraction that defines the relative contributions of the two peaks; and j is a scaling factor to fit the experimental magnitudes.
Hyperfine Sign Determination.
To obtain the signs of the measured hyperfine couplings (more precisely to determine the sign of A/gn), the pulsed-ENDOR-saturation and recovery (PESTRE) method was used at 35 GHz as described in detail previously.32
RESULTS AND DISCUSSION
EPR Analysis of Mc. sp. Str. Rockwell Whole Cells and Purified pMMO.
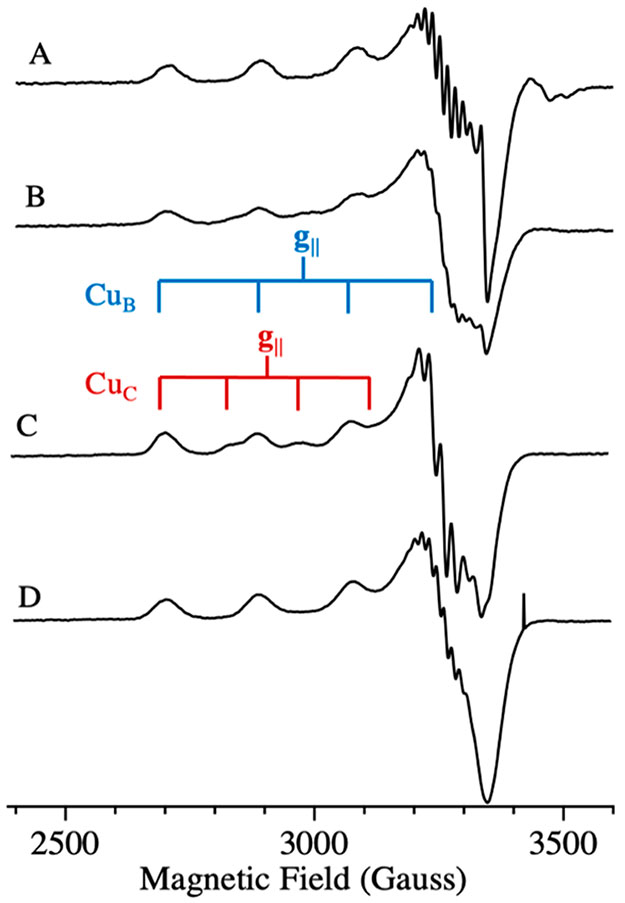
CW X-band EPR spectra of 15N, 63Cu enriched Mc. sp. str. Rockwell cells (Figure 2A) exhibit a strong signal from a single type 2 Cu(II) site (g = [2.24, 2.07, 2.035], 63Cu hyperfine splitting, A∥ = 580 MHz) and a hyperfine pattern associated with the g⊥ region of the spectrum that arises from coordinated 15N. In addition, an isotropic g ~ 2 radical signal overlaps with the g⊥ region. This spectrum is consistent with previous EPR investigations of whole cell methanotrophs grown under copper-replete conditions33,34 and is identical to that assigned to the M. capsulatus (Bath) CuB site.16 When the membranes are isolated, the radical signal mostly disappears, the CuB signal persists, and a minority Cu(II) signal appears (g = [2.31, 2.07, 2.05], 63Cu A∥ = 440 MHz coupling) (Figure 2B). The latter is shown by simulation to represent ~15% of the total Cu(II) signal and is assigned as the previously observed CuC signal.16 This spectrum is the first reported observation of the CuC signal in a membrane-bound type II pMMO. Once the enzyme is solubilized and purified, the CuC center becomes further oxidized, and simulations of the composite CuB and CuC spectrum show that within error this EPR signal comprises equal contributions from CuB and CuC (Figure 2C), the observed proportions varying somewhat with sample preparation.
Figure 2.
CW X-band EPR spectra of Mc. sp. str. Rockwell pMMO. (A) In vivo pMMO. (B) Membrane-bound pMMO. (C) Purified pMMO. The brackets indicate the 63Cu A∥ hyperfine splitting of the two signals present in the spectra. (D) Purified/reduced pMMO. Conditions: 9.36 GHz microwave frequency, 200 μW MW power, temperature 20 K, 320 ms time constant, 12.5 G modulation, 5 scans each, and 10 G/s scan rate.
An overlay of the spectra of solubilized/purified M. capsulatus (Bath) (type I) and Mc. sp. str. Rockwell (type II) pMMO [Figure S1, Supporting Information (SI)] shows that each site is identical between the two enzymes. This is the first report of preparations of a type II pMMO that, like the type I pMMO, exhibit both CuB and CuC signals in near equal occupancy and without additional adventitious Cu(II) signals (Figures S2 and S3, SI). Importantly, the presence of the CuC signal in the type II Mc. sp. str. Rockwell pMMO completely eliminates the possibility that this signal in the type I M. capsulatus (Bath) pMMO16 derives from the bis-His site in its PmoB subunit. The type II pMMOs, including Mc. sp. str. Rockwell pMMO, lack one of the two histidine residues that comprise this site.
Notably, there is an outlier crystal structure of Mc. sp. str. Rockwell pMMO in which the Cuc site is occupied by Zn(II), which binds a fourth ligand, modeled as PmoC residue Glu201.10 In a recent computational study, this residue was assumed to be a ligand when Cu(II) is bound in the CuC site.35 However, this cannot be so. If such a four-coordinate “square planar” Cu(II) site with two nitrogen and two oxygen ligands were present, the 63Cu A∥ value would differ significantly (closer to ~500 MHz)36 from that observed for CuC (440 MHz). Correspondingly, the CuC site has a ratio g∥/A∥ = 156 cm [A∥ = 1.46 × 10⁻² when expressed in wavenumbers (cm−1)], whereas such square-planar complexes have ratios g∥/A∥ ~ 105–135 cm.37 Thus, it is clear that Glu201 is only a ligand when Zn(II) occupies the site, and computational models based on its Cu coordination cannot35 reflect the biological mechanism.
Addition of 8 equiv of ascorbate to purified Mc. sp. str. Rockwell pMMO eliminates the CuC signal, leaving the CuB signal with unchanged amplitude (Figure 2D) and indicating that the reduction potential of CuB is substantially more negative than that of CuC. An ability of the CuC site to cycle between the Cu(I) and Cu(II) states is consistent with proposals that it is the site of oxygen activation and methane conversion. Interestingly, we followed the previously published methods for isolation of Mc. sp. str. Rockwell pMMO and included as a necessary step the addition of CuSO4 during cell lysis in order to achieve enzyme activity upon addition of detergent. An examination of purified samples by EPR (Figure S4, SI) that did not include this step shows only the CuB spectrum, similar to purified reduced enzyme (Figure 2D), without the CuC(II) signal seen when this step is included (Figure 2C). This observation provides further evidence that the presence of a copper ion in the CuC site is required for methane oxidation.
Investigation of the Mc. sp. str. Rockwell CuB Site by ENDOR Spectroscopy.
15N Pulsed ENDOR to Study CuB Nitrogen Coordination.
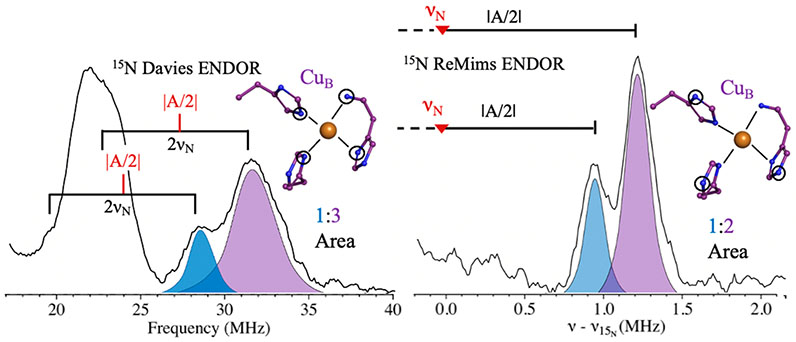
To further probe the molecular and electronic structure of the Mc. sp. str. Rockwell pMMO CuB site, we examined whole cell and purified/partially reduced samples by ENDOR. Our previous EPR and ENDOR studies of pMMO from the type I methanotroph M. capsulatus (Bath) clearly showed that the crystallographic CuB site is mononuclear.16 The use of quantitative 15N ENDOR to count nitrogen ligands to CuB established that it is coordinated by four nitrogenous ligands, three from histidyl imidazoles and one from the terminal NH2 of His33 [M. capsulatus (Bath) pMMO numbering]. Using 15N, 63Cu-enriched type II Mc. sp. str. Rockwell whole cells, Davies ENDOR at g = 2.25 reveals two 15N signals of A ~ −48 and −55 MHz (Figure 3, left). The PESTRE method shows that the 15N couplings (which correspond to the sign of A/gN) are negative, indicating a positive spin density on the coordinated 15N (Figure S5, SI). This is expected for in-plane Cu(II)-coordinated nitrogen. As reported previously for the type I M. capsulatus (Bath) pMMO, Gaussian fitting of the peaks using eq 1 yields areas with a 1:3 ratio, demonstrating that four nitrogens are coordinated to CuB, and that the signs of the couplings are equivalent as well.16
Figure 3.
The 2 K Q-band 15N pulsed ENDOR on the Mc. sp. str. Rockwell in vivo pMMO CuB site. (Left) Pulsed Davies ENDOR spectra at g = 2.25 of directly coordinated 15N. The brackets represent twice the 15N Larmor frequency and are centered at the value of ∣A/2∣ (red). (Right) Doan/ReMims spectra at g = 2.24 for distally coupled 15N (“backside nitrogen”), 15N Larmor subtracted for centering. The solid right bracket represents ∣A/2∣, where the red ▼ represents the 15N Larmor frequency. To show the analysis better, the ν-peaks are omitted, but see below. Davies ENDOR conditions: 34.684 GHz, 100 ms repetition time, π = 80 ns, τ = 600 ns, TRF = 35 μs, RF tail = 5 μs, ~100 scans. ReMims conditions: 34.712 GHz, 20 ms repetition time, π = 60 ns, τ1 = 200 ns, τ2 = 400 ns, TRF = 60 μs, and RF tail = 10 μs.
To identify the four CuB nitrogenous ligands, we probed for weakly coupled 15N signals from the remote (“backside”) nitrogens of histidyl imidazole ligands using the ReMims protocol.28 Spectra collected at g = 2.24 show 15N signals exhibiting hyperfine couplings of ~1.7 and ~2.4 MHz (Figure 3, right) characteristic of such remote nitrogens. These signals have relative areas of 1:2, indicating that three of the four nitrogenous ligands to CuB in type II as in type I pMMOs are histidyl imidazoles, with the fourth then assignable to the terminal amine. Finally, the values of the hyperfine couplings to both the coordinated and the remote 15N of the histidines bound to the CuB sites are essentially the same for M. capsulatus (Bath) pMMO and Mc. sp. str. Rockwell pMMO, as is the coupling to the amine, demonstrating a complete equivalence of the CuB coordination in the two pMMO types. This identification of the coordination sphere of CuB in both types of pMMO, combined with other work identifying CuB as a monocopper site,14,15,17 is incompatible with a recent cryoelectron microscopy structure of M. capsulatus (Bath) pMMO.38
Stochastic CW 1H ENDOR of the CuB Site.
To refine our picture of the electronic and molecular structure of the CuB site, we employed 35 GHz field-modulated stochastic CW 1H ENDOR on whole cell Mc. sp. str. Rockwell. The stochastic technique resolves line shapes better by eliminating the relaxation distortion of the CW ENDOR response, although with some sacrifice in signal intensity and with “inversion” of the distant-ENDOR responses with small couplings as a consequence of relaxation effects.
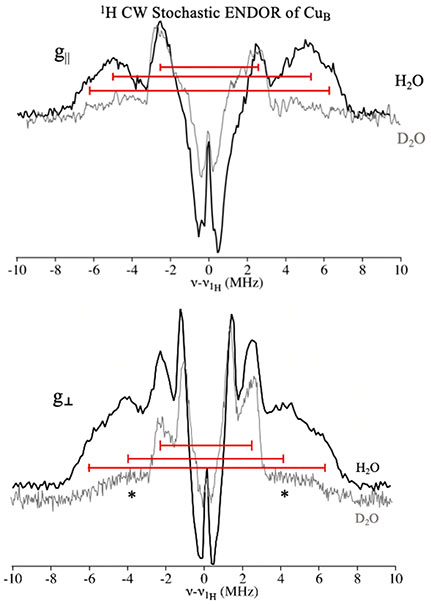
The single-crystal-like 1H spectrum collected at the g∥ edge of the EPR spectrum for the CuB site (at a field corresponding to g = 2.31) shows a pair of broad responses that appear to be the superposition of two doublets with 1H couplings of A ~ 13 and ~10 MHz (Figure 4, top). PESTRE measurements of the hyperfine coupling signs indicate that the intensity associated with the larger coupling exhibits a negative coupling, A ~ −13 MHz, while that for the smaller exhibits a positive one, A ~ +10 MHz (Figure S6, SI). These signals are lost upon exchange into a D2O buffer (Figure 4, top, gray spectrum), indicating that they arise from two distinct classes of exchangeable protons. Similar observations were made for the type I M. capsulatus (Bath) enzyme,16 except that the previous study used only Davies pulsed ENDOR and did not resolve the presence of two distinct classes of exchangeable protons. In addition, there is a well-resolved doublet from nonexchangeable proton(s), with a coupling of A ~ +5 MHz (sign determined by PESTRE protocol), as well as (inverted) distant-ENDOR signals near νH.
Figure 4.
Mc. sp. str. Rockwell in vivo pMMO CuB site Q-band 2 K stochastic 1H ENDOR at fields corresponding to g = 2.31 (top) and g = 2.02 (bottom). The gray trace is D2O exchanged samples at the same fields. Asterisks denote 63Cu ENDOR response that underlies the 1H pattern. The stochastic sequence enhances resolution, and resolved couplings are shown by the brackets, the length of which represents the value of A (see the text). Conditions: 34.78 GHz, 4 G modulation, 1 μW MW power, 2 s rf on, 2 s rf off, 0.5 s wait time, ~2000 scans each.
The field-modulated detected stochastic 1H ENDOR spectrum at g⊥ (Figure 4, bottom) again reveals two resolved large couplings from exchangeable protons, but in this case with the same (negative) sign, A ~ −12 and ~ −8 MHz (Figure S6, SI), as well as a nonexchangeable doublet with A ~ +5 MHz (Figure 4, bottom, gray spectrum). Again, the two large couplings resolved here in the stochastic experiment (most evident for the ν+ peak) were observed in the previous study as a single broad peak with A ~ 11 MHz.14 The ~+5 MHz coupling was assigned as a His Cε-H, consistent with the signs determined in this study.
The enhanced resolution of the exchangeable 1H signals in the stochastic CW 1H spectra allows for a reconsideration and further assignment of the large proton couplings. Previous 17O ENDOR measurements showed the presence of an axial water on CuB,14 and the present 1H ENDOR measurements confirm this assignment. The appearance of a hyperfine-split doublet with A ~ +10 MHz at g∥ is characteristic of the protons of a water molecule bound axially to a square-planar Cu(II) site.37,39,40 At g⊥, the exchangeable protons of this water molecule would give a coupling of A ~ −5 MHz; they are likely obscured by the signals from the nonexchangeable imidazole ring protons of the three histidine residues.
The exchangeable 1H signals with A ~ −13 MHz at g∥ and A~ −12 MHz at g⊥ are somewhat surprisingly assignable to the protons of the in-plane terminal amino group. Previous studies of protons of an amino group bound in-plane to Cu(II) reported couplings of these magnitudes, but without determination of signs.37,41,42 To better understand the hyperfine couplings to in-plane amine protons, we carried out a preliminary study of [Cu(II)(NH3)4]2+ using 1H ENDOR. The preliminary results of field-modulated stochastic ENDOR and PESTRE show couplings of A ~ −12 MHz at g∥ and −12 MHz at g⊥ (Figure S7, SI), and DFT calculations of the 1H hyperfine tensors gave corresponding results (see the SI). In retrospect, the previous lower-resolution 1H ENDOR study of M. capsulatus (Bath) pMMO16 is consistent with the present, more complete study, leading to the conclusion that the CuB site is completely conserved across the type I and type II pMMOs.
Investigation of the Mc. sp. Str. Rockwell CuC Site by ENDOR Spectroscopy.
15N Pulsed ENDOR of CuC Nitrogen Coordination.
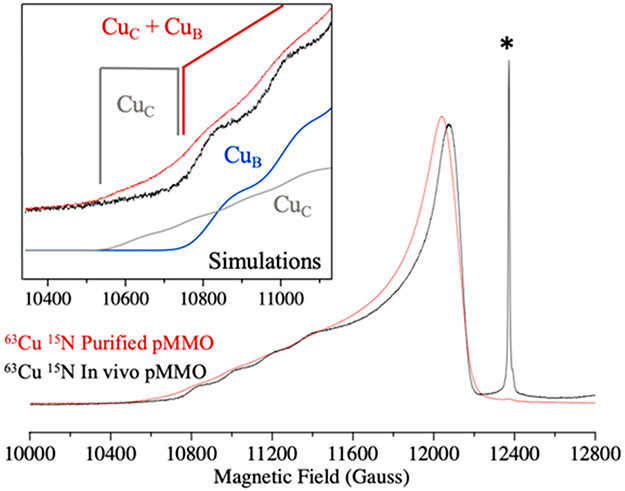
Although purified pMMO exhibits strongly overlapping EPR signals from CuB and CuC, the enhanced “g-spread” at Q-band versus X-band causes the difference in g1 between the CuB and CuC sites to shift the four-line 63Cu g1 hyperfine pattern of CuC by ~250 G to lower field than that of CuB, as observed when overlaying the spectra of purified pMMO and in vivo pMMO (Figure 5). Within this low-field range, for the first time it is possible to exclusively probe the 15N ENDOR of the CuC site without interference from signals that arise from CuB. The penalty paid for attempting such studies is the low CuC EPR signal intensity at these fields, which makes it necessary to use highly concentrated samples (>2 mM 100 kDa protomer) to obtain signals of reasonable signal/noise. Using such samples enabled us to obtain 15N ENDOR spectra for the CuC site within the field range indicated in Figure 5 (inset, gray bracket region). A bonus of measurements taken within this field range is that these spectra are “single-crystal-like”,43 meaning that they are selectively associated with the small subset of CuC sites oriented in the frozen sample so that the external field lies along the normal to the CuC ligand plane, a situation that yields the highest resolution and most easily analyzed signals.
Figure 5.
The 2 K Q-band absorption EPR with the spectra of in vivo (black) and purified (red) Mc. sp. str. Rockwell pMMO overlaid. At this frequency, the +3/2 63Cu hyperfine of the CuC site is separated from the CuB site, as also shown by individual simulations of the two sites (inset). The asterisk marks a radical that is present in whole-cell samples. Conditions: ~34.8 MHz, 1 G modulation, 1 μW MW power, 128 ms time constant, 20 G/s sweep rate.
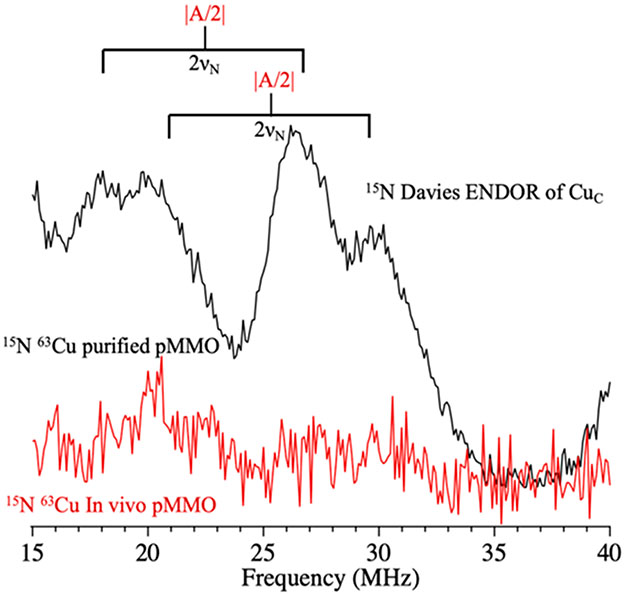
Using an isotopically enriched, purified Mc. sp. str. Rockwell type II pMMO sample, 15N Davies pulsed ENDOR was used to analyze the coordination environment and electronic structure of the CuC site. When the magnetic field is set within the “clean” low-field window (Figure 5), at a value corresponding to g = 2.32, the 15N ENDOR spectrum of CuC exhibits resolved features that correspond to 15N hyperfine couplings from two coordinating nitrogenous ligands, with couplings of A ~ −46 and −50 MHz (Figure 6, black); the negative signs were determined by the PESTRE technique as discussed for CuB above (Figure S8, SI). Spectra from an 15N enriched, concentrated, purified type I pMMO sample from M. capsulatus (Bath) at this field reveal identical 15N couplings (Figure S9, SI), signifying that the CuC nitrogen coordination is conserved between pMMOs from type I and II methanotrophs, as shown above for the CuB nitrogen coordination. The presence of two CuC 15N ligands is also detected as hyperfine couplings in the X-band EPR spectrum (Figure S10, SI), analogous to the confirmation of four such ligands in the CuB site.14
Figure 6.
Q-band Davies pulsed 15N ENDOR at a field corresponding to g = 2.32 for purified (black) and in vivo (red) Mc. sp. str. Rockwell pMMO. The brackets represent twice the 15N Larmor frequency and are centered at the value of ∣A/2∣. Conditions: 2 K, 34.684/34.774 GHz, 100 ms repetition time, π = 80 ns, τ = 600 ns, TRF = 35 μs, RF tail = 5 μs, ~100 scans.
As a control to ensure we were not observing signals from the CuB site, ENDOR spectra were collected at the same g-value from an 15N, 63Cu Mc. sp. str. Rockwell whole-cell sample, which exhibits only a CuB EPR signal. There is no 15N ENDOR signal at this field (Figure 6, red spectrum), whereas the CuB signals are strong at higher fields, within the CuB envelope, thus confirming that the observed signals (Figure 6, red spectrum) derive exclusively from the CuC site.
Interestingly, the resolution of the ENDOR signal of both of the two CuC 15N ligands changes at still lower field (corresponding to g = 2.34; Figure S11, SI). This variation is attributable to differences in the orientations of their hyperfine tensors relative to the g-tensor, an indication of the low symmetry of the CuC coordination sphere (Figure S12, SI). The X-band EPR spectrum of the CuC site gives a ratio g∥/A∥ = 156 cm (see above), which would suggest a distorted tetrahedral geometry.37
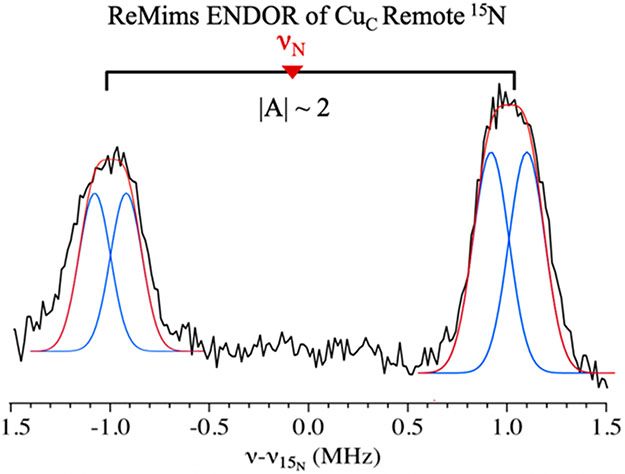
To identify the two nitrogenous ligands to CuC revealed by the Q-band Davies pulsed 15N-ENDOR, we performed a ReMims ENDOR experiment to determine the presence and number of signals from the remote 15N of histidyl ligands, as done for the CuB site (Figure 3, right). The CuC ReMims 15N ENDOR spectra reveal one doublet associated with weakly coupled 15N, ∣A∣ ~ 2 MHz (Figure 7), typical for a remote nitrogen of a histidine residue. However, these peaks are broad compared to the remote 15N peaks for CuB, which is evident upon overlay with the peaks in Figure 3 (see Figure S13, SI). As shown in Figure 7, the spectrum is best interpreted as arising from unresolved doublets from two slightly inequivalent remote histidyl 15N (∣A∣ = 1.8, 2.1 MHz), as expected for CuC bound to the two conserved histidine residues in the PmoC crystallographic site (Figure 1).
Figure 7.
Q-Band Doan/ReMims 15N pulsed ENDOR at 10 700 G (g = 2.32) for purified 63Cu 15N Mc. sp. str. Rockwell pMMO (black). The bracket represents ∣A∣ for the remote 15N couplings and the spectrum is centered on the 15N Larmor frequency. The breadth of the individual peaks is much larger than the widths of the individual responses for CuB, which suggests that multiple 15N couplings are overlapped. The spectrum was fit to the overlap of two 15N doublets for which individual peaks were taken to have the same widths of the individual remote 15N of CuB (Figure 3, right).
1H ENDOR Analysis of the CuC Site.
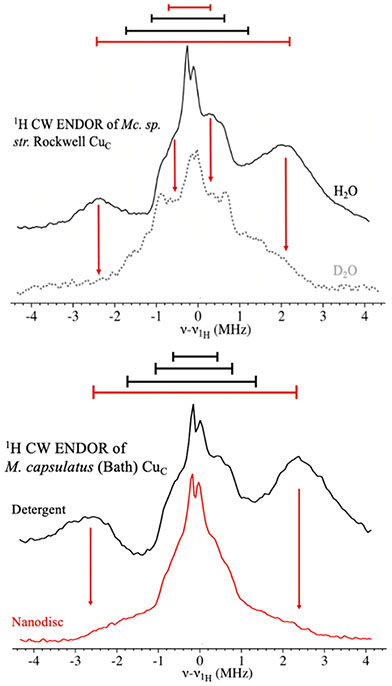
We further investigated the CuC site by 1H CW ENDOR. Spectra of concentrated, purified Mc. sp. str. Rockwell pMMO in H2O and D2O were again collected in the low-field window, at 10 600 G (g = 2.34) (Figure 8, upper). The results for this type II pMMO CuC site are indistinguishable from those obtained for the type I pMMO from M. capsulatus (Bath).16 The H2O spectrum shows broad peaks from several doublets: a clearly resolved doublet with A ~ +5 MHz, where the sign has been determined by the PESTRE protocol (Figure S14, SI), and a pair of doublets with A ~ 2 and ∣A∣ ~ 1 MHz (Figure 8, upper, solid black). The sign of the first of these two was again determined by PESTRE; sign determination was not possible for the second.
Figure 8.
(Upper) Q-band CW 1H ENDOR spectra of the Mc. sp. str. Rockwell pMMO CuC site (10 650 G). Black trace, purified pMMO in H2O; dotted gray trace, purified pMMO in D2O. Red arrows indicate the loss of the ~5 and ~1 MHz couplings upon D2O exchange. Conditions: 34.8 GHz microwave frequency, 4 G modulation, 32 ms TCs, 1 μW MW power, forward sweep, ~75 scans, 0.25 MHz/s. (Lower) Q-Band CW 1H ENDOR of the CuC site of purified M. capsulatus (Bath) pMMO in detergent (black) and in a nanodisc (red). Red arrows indicate the absence in the nanodisc of the A ~ +5 MHz coupling assigned as a distal water, seen also in measurements on detergent-purified Mc. sp. str. Rockwell pMMO. The conditions are identical to those in Figure 7, except the nanodisc sample, with a lower enzyme concentration, required ~400 scans.
Examination of a sample exchanged into D2O buffer and incubated for 24 h at room temperature reveals loss of the doublet with A ~ +5 MHz, leaving a broad, ill-resolved feature extending to nearly ∣A∣ ~ 5 MHz. Although some of this signal may arise from residual H2O after exchange, PESTRE shows a negative sign for A ~ −2 to −5 MHz (Figure 8, upper, dashed gray and Figure S14, SI), definitively showing that the signal arises from nonexchangeable protons. The exchangeable ~1 MHz doublet may well be associated with the remote N–H of the histidine residues44 (Figure 7). The nonexchangeable doublets most likely arise from Cε or Cδ protons of the histidine residues.45
In the 2.6 Å resolution crystal structure of Mc. sp. str. Rockwell pMMO (PDB 4PHZ),12 the electron density 3.3 Å from CuC is modeled as a solvent molecule axial to the Cu 2N1O plane, but it is not coordinated to the copper ion. The exchangeable proton signal with A ~ +5 MHz likely is associated with this solvent molecule, aligning the X-ray and ENDOR measurements of CuC. This assignment revises the suggestion based on the interpretation of an 17O ENDOR measurement on purified M. capsulatus (Bath) pMMO in buffer prepared with H217O.16 The assignment is supported by additional examination of the 17O ENDOR response (Figure S15, SI) and by the absence of signals attributable to coordinated 17O at fields where the CuC EPR signal is not overlapped with that from CuB (Figure S16, SI).
The absence of any 1H signals with ∣A∣ > 5 MHz at g∥ (Figure S17, SI) is additional evidence against a coordinated water for CuC; if such a ligand were present, it would exhibit a 1H doublet with ∣A∣ ~ 10 MHz,39,40 contrary to experiment. We therefore conclude that CuC does not have a coordinated water. The CuC signal might be imagined to derive from protons on a nearby arginine residue (Arg138, ~5 Å from CuC), but these are too remote to give rise to the observed coupling. We therefore attribute the exchangeable signal to the crystallographically observed ordered water within the secondary coordination sphere of CuC. The equivalence of the 1H ENDOR measurements for the type I and type II pMMOs indicates that the solvent molecule near CuC is present in both, expanding the extent to which the site is highly conserved.
EPR and ENDOR Analysis of pMMO in Nanodiscs.
Because the CuC site adopts the Cu(I) state in vivo and cannot be examined by EPR, we sought to recreate a membrane environment in lipid nanodiscs, as recently used for nTDMS characterization of pMMO.15 The reconstitution of pMMO in nanodiscs in the presence of additional copper has led to higher enzymatic activity and higher copper loading of the PmoC subunit compared to detergent-solubilized pMMO.
The X-band EPR spectrum of purified M. capsulatus (Bath) pMMO reconstituted into nanodiscs is nearly identical to those of the purified enzyme16 in detergent [Figure S18 (SI) and Figure 2C]. However, as a result of the higher CuC copper loading in the nanodisc, the CuC EPR signal has a greater intensity than that of the detergent-purified sample. Thus, the CuC(II) coordination does not change despite the fact that it is within the transmembrane region adjacent to a part of PmoC that is disordered in the crystal structures and might be expected to have a different conformation in the nanodisc.
However, the overall environment of the CuC site is altered by nanodisc incorporation. The CuC 1H ENDOR spectrum collected at the low magnetic field edge of the EPR spectrum of the nanodisc sample is dramatically different from that of pMMO in detergent (Figure 8, lower). The broad A ~ +5 MHz doublet seen for detergent-solubilized pMMO and assigned to protons from the noncoordinated distal water molecule is lost upon incorporation into the nanodisc. The remaining intensity in this frequency range corresponds to the signals in the D2O sample of purified enzyme, which are nonexchangeable assigned to the histidine ligands (Figure 8, upper, gray). Thus, although the ligation to CuC is unchanged in the nanodisc, the solvent molecule near this site is lost.
We correspondingly tested for possible effects of nanodisc incorporation on the CuB site in the solvent-exposed PmoB subunit, using enzyme in which CuC has been reduced to the Cu(I) state through the addition of 10 equiv of ascorbic acid per pMMO protomer. Both the X-band EPR spectrum (Figure S19, SI) and the 1H ENDOR spectra (Figure S20, SI) are unchanged, indicating that the CuB ligation, including the presence of an axial water, is unchanged. Thus, the CuB site is essentially identical in vivo, in detergent-solubilized pMMO, and in pMMO reconstituted into nanodiscs, whereas the CuC surroundings are altered in the membrane-like environment of a nanodisc. Therefore, changes in pMMO activity in the different environments may be associated with changes in the CuC site.
CONCLUSION
Our EPR and ENDOR analysis of the type II Mc. sp. str. Rockwell pMMO provides several key insights into the pMMO copper centers. First, the CuB sites in pMMOs from type I and type II methanotrophs have identical molecular and electronic structures: each is a mononuclear site with four nitrogen ligands, comprising three histidyl imidazoles and one terminal amine. Given that CuB in vivo is coordinated to all the crystallographically identified ligands that are available in that site, this result definitively confirms the conclusion that this site contains a single Cu(II) ion.
In addition, an axial water associated with CuB is identified for the first time by its proton signals in stochastic CW 1H ENDOR in parallel with PESTRE measurements. These results, combined with previous 17O ENDOR on M. capsulatus (Bath) pMMO,16 are consistent with a square pyramidal geometry (Figure 9). The role of the CuB site and the potential functional significance of this axial water molecule, which is consistent with crystallographic12,14 and XAS17 data, remain unclear. The role of the histidine brace, a feature shared with LPMO, is also unclear. As a coordinatively saturated site that exists as Cu(II) in vivo, CuB is unlikely to be the site of methane oxidation. However, it is important for activity,46 and possible roles in electron transfer or structural stabilization merit investigation.
Figure 9.
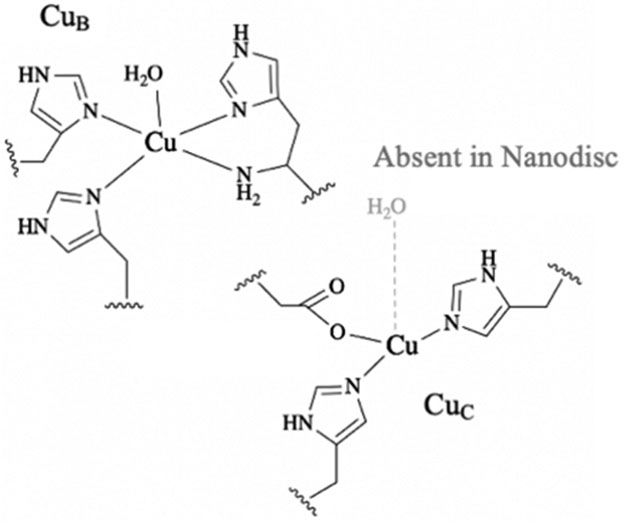
Current models for the two copper sites of pMMO.
Second and most important, we have obtained the first time definitive molecular and electronic structural information on the CuC site, previously uncharacterized by EPR because its signal overlaps with that of the CuB site. The 15N ENDOR data reveal the presence of two histidine ligands. Supported by a prior DEER experiment on M. capsulatus (Bath) pMMO, this finding indicates that the copper ion corresponding to the spectroscopic EPR signal denoted CuC exhibits properties that are completely consistent with coordination by the three protein-derived ligands of the crystallographically observed CuC site: the two histidyl imidazoles of His133 and His146, along with the carboxylate of Asp129 (Figures 1, 9).
The 1H ENDOR data expand this assignment by showing that the enzyme in detergent exhibits signals from a crystallographically observed nearby axial water molecule at a distance of ~3 Å and that this water is lost when the enzyme is incorporated in the membrane-like environment of a nanodisc. The resulting presence of open CuC coordination sites provides space for dioxygen and methane to bind. Notably, LPMOs also have open coordination sites (occupied in crystal structures by chloride ions or water molecules) in the equatorial and axial positions,7 and substrate binding displaces an axial water molecule.47 With this coordination environment, the pMMO CuC(I) complex would be expected to react rapidly with dioxygen,48 in keeping with the suggested role of CuC as the site of methane oxidation.
The loss of the noncoordinated, yet ordered, axial water molecule upon nanodisc incorporation is intriguing and perhaps not surprising given the location of CuC within the lipid bilayer. This water molecule may occupy a channel or pocket for methane and/or dioxygen diffusion and binding. Finally, it is worth noting that there are two conserved histidine residues in a crystallographically disordered region of PmoC not visible in any crystal structure. This unobserved sequence neighbors the crystallographic CuC site3 and could play a yet to be identified role in metal binding and enzyme function. Regardless, the detailed insight into the primary and secondary coordination sphere of the CuC site, which the present results suggest is the likely site of catalysis, provides a new foundation for probing the pMMO mechanism via computational and spectroscopic studies.
Supplementary Material
ACKNOWLEDGMENTS
We thank Prof. George Schatz (Northwestern) for use of his computational cluster for DFT calculations.
Funding
This work was supported by NIH grants GM118035 (A.C.R.) and GM111097 (B.M.H.) and by the NSF (MCB1908587 to B.M.H). R.J.J., M.O.R., and C.W.K were partially supported by NIH grant T32GM008382.
Footnotes
Supporting Information
The Supporting Information is available free of charge at https://pubs.acs.org/doi/10.1021/jacs.1c07018.
Supporting methods {[Cu(NH3)4]2+ preparation and DFT} and figures (EPR and ENDOR spectra and PESTRE measurements) (PDF)
The authors declare no competing financial interest.
Contributor Information
Richard J. Jodts, Departments of Chemistry and Molecular Biosciences, Northwestern University, Evanston, Illinois 60208, United States.
Matthew O. Ross, Departments of Chemistry and Molecular Biosciences, Northwestern University, Evanston, Illinois 60208, United States; Present Address: M.O.R.: Department of Chemistry, University of Chicago, Chicago, Illinois 60637.
Christopher W. Koo, Departments of Chemistry and Molecular Biosciences, Northwestern University, Evanston, Illinois 60208, United States
Peter E. Doan, Departments of Chemistry and Molecular Biosciences, Northwestern University, Evanston, Illinois 60208, United States
Amy C. Rosenzweig, Departments of Chemistry and Molecular Biosciences, Northwestern University, Evanston, Illinois 60208, United States.
Brian M. Hoffman, Departments of Chemistry and Molecular Biosciences, Northwestern University, Evanston, Illinois 60208, United States.
REFERENCES
- (1).Hioe J; Mosch M; Smith DM; Zipse H Dissociation energies of Cα-H bonds in amino acids - a re-examination. RSC Adv. 2013, 3, 12403–12408. [Google Scholar]
- (2).Ipsen JO; Hallas-Møller M; Brander S; Lo Leggio L; Johansen KS Lytic polysaccharide monooxygenases and other histidine-brace copper proteins: structure, oxygen activation and biotechnological applications. Biochem. Soc. Trans 2021, 49, 531–540. [DOI] [PMC free article] [PubMed] [Google Scholar]
- (3).Koo CW; Rosenzweig AC Biochemistry of aerobic biological methane oxidation. Chem. Soc. Rev 2021, 50, 3424–3436. [DOI] [PMC free article] [PubMed] [Google Scholar]
- (4).Klinman JP The copper-enzyme family of dopamine β-monooxygenase and peptidylglycine α-hydroxylating monooxygenase: resolving the chemical pathway for substrate hydroxylation. J. Biol. Chem 2006, 281, 3013–3016. [DOI] [PubMed] [Google Scholar]
- (5).Eipper BA; Quon AS; Mains RE; Boswell JS; Blackburn NJ The catalytic core of peptidylglycine alpha-hydroxylating monooxygenase: investigation by site-directed mutagenesis, Cu X-ray absorption spectroscopy, and electron paramagnetic resonance. Biochemistry 1995, 34, 2857–2865. [DOI] [PubMed] [Google Scholar]
- (6).Quist DA; Diaz DE; Liu JJ; Karlin KD Activation of dioxygen by copper metalloproteins and insights from model complexes. J. Biol. Inorg. Chem 2017, 22, 253–288. [DOI] [PMC free article] [PubMed] [Google Scholar]
- (7).Vu VV; Ngo ST Copper active site in polysaccharide monooxygenases. Coord. Chem. Rev 2018, 368, 134–157. [Google Scholar]
- (8).Ross MO; Rosenzweig AC A tale of two methane monooxygenases. J. Biol. Inorg. Chem 2017, 22, 307–319. [DOI] [PMC free article] [PubMed] [Google Scholar]
- (9).Lawton TJ; Rosenzweig AC Methane-oxidizing enzymes: An upstream problem in biological gas-to-liquids conversion. J. Am. Chem. Soc 2016, 138, 9327–9340. [DOI] [PMC free article] [PubMed] [Google Scholar]
- (10).Lieberman RL; Rosenzweig AC Crystal structure of a membrane-bound metalloenzyme that catalyses the biological oxidation of methane. Nature 2005, 434, 177–182. [DOI] [PubMed] [Google Scholar]
- (11).Smith SM; Rawat S; Telser J; Hoffman BM; Stemmler TL; Rosenzweig AC Crystal structure and characterization of particulate methane monooxygenase from Methylocystis species strain M. Biochemistry 2011, 50, 10231–10240. [DOI] [PMC free article] [PubMed] [Google Scholar]
- (12).Sirajuddin S; Barupala D; Helling S; Marcus K; Stemmier TL; Rosenzweig AC Effects of zinc on particulate methane monooxygenase activity and structure. J. Biol. Chem 2014, 289, 21782–21794. [DOI] [PMC free article] [PubMed] [Google Scholar]
- (13).Ro SY; Ross MO; Deng YW; Batelu S; Lawton TJ; Hurley JD; Stemmler TL; Hoffman BM; Rosenzweig AC From micelles to bicelles: Effect of the membrane on particulate methane monooxygenase activity. J. Biol. Chem 2018, 293, 10457–10465. [DOI] [PMC free article] [PubMed] [Google Scholar]
- (14).Cao LL; Caldararu O; Rosenzweig AC; Ryde U Quantum refinement does not support dinuclear copper sites in crystal structures of particulate methane monooxygenase. Angew. Chem., Int. Ed 2018, 57, 162–166. [DOI] [PMC free article] [PubMed] [Google Scholar]
- (15).Ro SY; Schachner LF; Koo CW; Purohit R; Remis JP; Kenney GE; Liauw BW; Thomas PM; Patrie SM; Kelleher NL; Rosenzweig AC Native top-down mass spectrometry provides insights into the copper centers of membrane-bound methane monooxygenase. Nat. Commun 2019, 10, 2675. [DOI] [PMC free article] [PubMed] [Google Scholar]
- (16).Ross MO; MacMillan F; Wang J; Nisthal A; Lawton TJ; Olafson BD; Mayo SL; Rosenzweig AC; Hoffman BM Particulate methane monooxygenase contains only mononuclear copper centers. Science 2019, 364, 566–570. [DOI] [PMC free article] [PubMed] [Google Scholar]
- (17).Cutsail GE III; Ross MO; Rosenzweig AC; DeBeer S Towards a unified understanding of the copper sites in particulate methane monooxygenase: an X-ray absorption spectroscopic investigation. Chem. Sci 2021, 12, 6194–6209. [DOI] [PMC free article] [PubMed] [Google Scholar]
- (18).Koo CW; Rosenzweig AC Particulate methane monooxygenase and the PmoD protein. In Encylopedia of Inorganic and Bioinorganic Chemistry; John Wiley & Sons, Ltd., 2020; DOI: 10.1002/9781119951438.eibc2740. [DOI] [Google Scholar]
- (19).Hakemian AS; Kondapalli KC; Telser J; Hoffman BM; Stemmler TL; Rosenzweig AC The metal centers of particulate methane monooxygenase from Methylosinus trichosporium OB3b. Biochemistry 2008, 47, 6793–6801. [DOI] [PMC free article] [PubMed] [Google Scholar]
- (20).Choi DW; Antholine WE; Do YS; Semrau JD; Kisting CJ; Kunz RC; Campbell D; Rao V; Hartsel SC; DiSpirito AA Effect of methanobactin on the activity and electron paramagnetic resonance spectra of the membrane-associated methane monooxygenase in Methylococcus capsulatus Bath. Microbiology 2005, 151, 3417–3426. [DOI] [PubMed] [Google Scholar]
- (21).Culpepper MA; Cutsail GE 3rd; Gunderson WA; Hoffman BM; Rosenzweig AC Identification of the valence and coordination environment of the particulate methane monooxygenase copper centers by advanced EPR characterization. J. Am. Chem. Soc 2014, 136, 11767–11775. [DOI] [PMC free article] [PubMed] [Google Scholar]
- (22).Semrau JD; Dispirito AA; Yoon S Methanotrophs and copper. FEMS Microbiol. Lett 2010, 34, 496–531. [DOI] [PubMed] [Google Scholar]
- (23).Sirajuddin S; Rosenzweig AC Protocols for structural and functional analysis of particulate methane monooxygenase from Methylocystis species strain Rockwell (ATCC 49242). In Hydrocarbon and Lipid Microbiology Protocols; McGenity TJ, et al. , Eds.; Springer-Verlag: Berlin, Heidelberg, 2016; pp 149–160. [Google Scholar]
- (24).Denisov IG; Grinkova YV; Lazarides AA; Sligar SG Directed self-assembly of monodisperse phospholipid bilayer nanodiscs with controlled size. J. Am. Chem. Soc 2004, 126, 3477–3487. [DOI] [PubMed] [Google Scholar]
- (25).Stoll S; Schweiger A EasySpin, a comprehensive software package for spectral simulation and analysis in EPR. J. Magn. Reson 2006, 178, 42–55. [DOI] [PubMed] [Google Scholar]
- (26).Davoust CE; Doan PE; Hoffman BM Q-band pulsed electron spin-echo spectrometer and its application to ENDOR and ESEEM. J. Magn. Reson. Ser. A 1996, 119, 38–44. [Google Scholar]
- (27).Epel B; Gromov I; Stoll S; Schweiger A; Goldfarb D Spectrometer manager: A versatile control software for pulse EPR spectrometers. Concepts Magn. Reson., Part B 2005, 26B, 36–45. [Google Scholar]
- (28).Doan PE; Hoffman BM Making hyperfine selection in Mims ENDOR independent of deadtime. Chem. Phys. Lett 1997, 269, 208–214. [Google Scholar]
- (29).Schweiger A; Jeschke G Principles of Pulse Electron Paramagnetic Resonance; Oxford University Press: Oxford, UK, 2001. [Google Scholar]
- (30).Werst MM; Davoust CE; Hoffman BM Ligand spin densities in blue copper proteins by Q-band 1H and 14N ENDOR spectroscopy. J. Am. Chem. Soc 1991, 113, 1533–1538. [Google Scholar]
- (31).Bruggemann W; Niklas JR Stochastic ENDOR. J. Magn. Reson., Ser. A 1994, 108, 25–29. [Google Scholar]
- (32).Doan PE Combining steady-state and dynamic methods for determining absolute signs of hyperfine interactions: Pulsed ENDOR Saturation and Recovery (PESTRE). J. Magn. Reson 2011, 208, 76–86. [DOI] [PMC free article] [PubMed] [Google Scholar]
- (33).Yuan H; Collins MLP; Antholine WE Low-frequency EPR of the copper in particulate methane monooxygenase from Methylomicrobium albus BG8. J. Am. Chem. Soc 1997, 119, 5073–5074. [Google Scholar]
- (34).Lemos SS; Collins MLP; Eaton SS; Eaton GR; Antholine WE Comparison of EPR-visible Cu2+ sites in pMMO from Methylococcus capsulatus (Bath) and Methlyomicrobium album BG8. Biophys. J 2000, 79, 1085–1094. [DOI] [PMC free article] [PubMed] [Google Scholar]
- (35).Peng W; Qu X; Shaik S; Wang B Deciphering the oxygen activation mechanism at the CuC site of particulate methane monooxygenase. Nat. Catal 2021, 4, 266–273. [Google Scholar]
- (36).Peisach J; Blumberg WE Structural implications derived from the analysis of electron paramagnetic resonance spectra of natural and artificial copper proteins. Arch. Biochem. Biophys 1974, 165, 691–708. [DOI] [PubMed] [Google Scholar]
- (37).Pogni R; Baratto MC; Diaz A; Basosi R EPR characterization of mono(thiosemicarbazones) copper(II) complexes. Note II. J. Inorg. Biochem 2000, 79, 333–337. [DOI] [PubMed] [Google Scholar]
- (38).Chang W-H; Lin H-H; Tsai I-K; Huang S-H; Chung S-C; Tu I-P; Yu SS-F; Chan SI Copper centers in the cryo-EM Structure of particulate methane monooxygenase reveal the catalytic machinery of methane oxidation. J. Am. Chem. Soc 2021, 143, 9922–9932. [DOI] [PubMed] [Google Scholar]
- (39).Atherton NM; Horsewill AJ Proton ENDOR of Cu(H2O)62+ in Mg(NH4)2(SO2)4.6H2O. Mol. Phys 1979, 37, 1349–1361. [Google Scholar]
- (40).Burns CS; Aronoff-Spencer E; Dunham CM; Lario P; Avdievich NI; Antholine WE; Olmstead MM; Vrielink A; Gerfen GJ; Peisach J; Scott WG; Millhauser GL Molecular features of the copper binding sites in the octarepeat domain of the prion protein. Biochemistry 2002, 41, 3991–4001. [DOI] [PMC free article] [PubMed] [Google Scholar]
- (41).Kim D; Kim NH; Kim SH 34 GHz pulsed ENDOR characterization of the copper coordination of an amyloid β peptide relevant to Alzheimer’s disease. Angew. Chem., Int. Ed 2013, 52, 1139–1142. [DOI] [PubMed] [Google Scholar]
- (42).Fujimoto M; McDowell CA; Takui T Ligand ENDOR spectra of Cu(II) impurity complexes in α-glycine crystals. J. Chem. Phys 1979, 70, 3694–3701. [Google Scholar]
- (43).Rist GH; Hyde JS Ligand ENDOR of metal complexes in powders. J. Chem. Phys 1970, 52, 4633–4643. [Google Scholar]
- (44).Manikandan P; Epel B; Goldfarb D Structure of copper(II)-histidine based complexes in frozen aqueous solutions as determined from high-field pulsed electron nuclear double resonance. Inorg. Chem 2001, 40, 781–787. [DOI] [PubMed] [Google Scholar]
- (45).Vancamp HL; Sands RH; Fee JA Electron-nuclear double-resonance on copper(II) tetraimidazole. J. Chem. Phys 1981, 75, 2098–2107. [Google Scholar]
- (46).Liew EF; Tong DC; Coleman NV; Holmes AJ Mutagenesis of the hydrocarbon monooxygenase indicates a metal centre in subunit-C, and not subunit-B, is essential for copper-containing membrane monooxygenase activity. Microbiology 2014, 160, 1267–1277. [DOI] [PubMed] [Google Scholar]
- (47).Frandsen KE; Simmons TJ; Dupree P; Poulsen JC; Hemsworth GR; Ciano L; Johnston EM; Tovborg M; Johansen KS; von Freiesleben P; Marmuse L; Fort S; Cottaz S; Driguez H; Henrissat B; Lenfant N; Tuna F; Baldansuren A; Davies GJ; Lo Leggio L; Walton PH The molecular basis of polysaccharide cleavage by lytic polysaccharide monooxygenases. Nat. Chem. Biol 2016, 12, 298–303. [DOI] [PMC free article] [PubMed] [Google Scholar]
- (48).Elwell CE; Gagnon NL; Neisen BD; Dhar D; Spaeth AD; Yee GM; Tolman WB Copper-oxygen complexes revisited: structures, spectroscopy, and reactivity. Chem. Rev 2017, 117, 2059–2107. [DOI] [PMC free article] [PubMed] [Google Scholar]
Associated Data
This section collects any data citations, data availability statements, or supplementary materials included in this article.


