Abstract
DNA interstrand cross-links (ICLs) are induced by many carcinogens and anitcancer drugs. ICL is a covalent linkage of both strands of DNA, preventing DNA strand separation during transcription and replication; thus, it is extremely cytotoxic in vivo. Psoralen and its derivatives are widely applied for the clinical treatment of several skin diseases and cutaneous T cell lymphoma, and they are also commonly used as model compounds for the study of ICL. Upon UVA photoactivation, 8-methoxypsoralen alkylates both strands of DNA at the 5,6-double bond of thymidines at the 5′-TpA-3′ site, generating monoadducts and ICLs. Here we developed a method utilizing HPLC–tandem mass spectrometry, combined with nuclease P1 digestion, to assess the formation of ICL in DNA of human skin melanoma cells exposed to 500 ng/mL 8-methoxypsoralen and UVA irradiation. We were able to quantify ICL, in the form of tetranucleotide, at the level of 1 lesion/106 unmodified nucleobases using a low-microgram quantity of DNA. In addition, our results revealed that the formation of ICL increased linearly with the UVA dose. The yield of ICL increased by 15-fold from 4.5 to 76 lesions/106 nucleotides when the UV dose was increased from 0.5 to 5 J/cm2. This is the first report of an LC–MS assay for the quantification of DNA interstrand cross-links. The specificity and accuracy of this high-throughput approach are advantageous over other methods for the detection of ICLs formed in vitro and in vivo.
Many chemotherapeutic agents, including cisplatin, mitomycin C, and melphalan, exert their cytotoxic effects by reacting with DNA to give interstrand cross-links (ICLs), which block DNA replication and transcription by preventing strand separation, and subsequently induce cell necrosis and apoptosis.1,2
Furocoumarins (psoralens) are naturally occurring ICL-inducing agents synthesized in plants, among which 8-methoxypsoralen (8-MOP), combined with irradiation with long-wavelength UV light (PUVA), has been widely employed in dermatology for many years to treat patients with vitiligo and psorasis.3 It was also approved for the treatment of cutaneous T cell lymphoma by FDA for more than 10 years. Recently, amotosalen, a synthetic psoralen derivative, was employed for the inactivation of contaminating pathogens in plasma, platelets, and red blood cells to eliminate the risk of transfusion-transmitted infection.4,5 The planar tricyclic structure of psoralen facilitates its intercalation into DNA, preferentially at 5′-TA-3′ sites. Upon UVA irradiation, psoralen can form two types of monoadducts (MAs) via [2+2] cycloaddition, where the C=C bond of pyrone or furan side of psoralen is conjugated with the 5,6-double bond of a thymine. In this regard, two diastereomers of furan-side monoadducts can be induced (Scheme 1).6 The absorption of a second photon by one of the furan-side monoadducts leads to the formation of a pyrone-side 5,6-double bond adducts with a flanking thymine in the complementary strand, thereby generating an ICL (Scheme 1).6 The yields of psoralen MAs and ICL are dependent upon the structure of psoralen, the irradiation time, and the wavelength of the irradiation source.7 Nonetheless, the latter has much more severe biological implications, and it is considered as the major contributing factor for curing skin diseases1 and for disabling the growth of virus and bacteria in blood.8
Scheme 1.
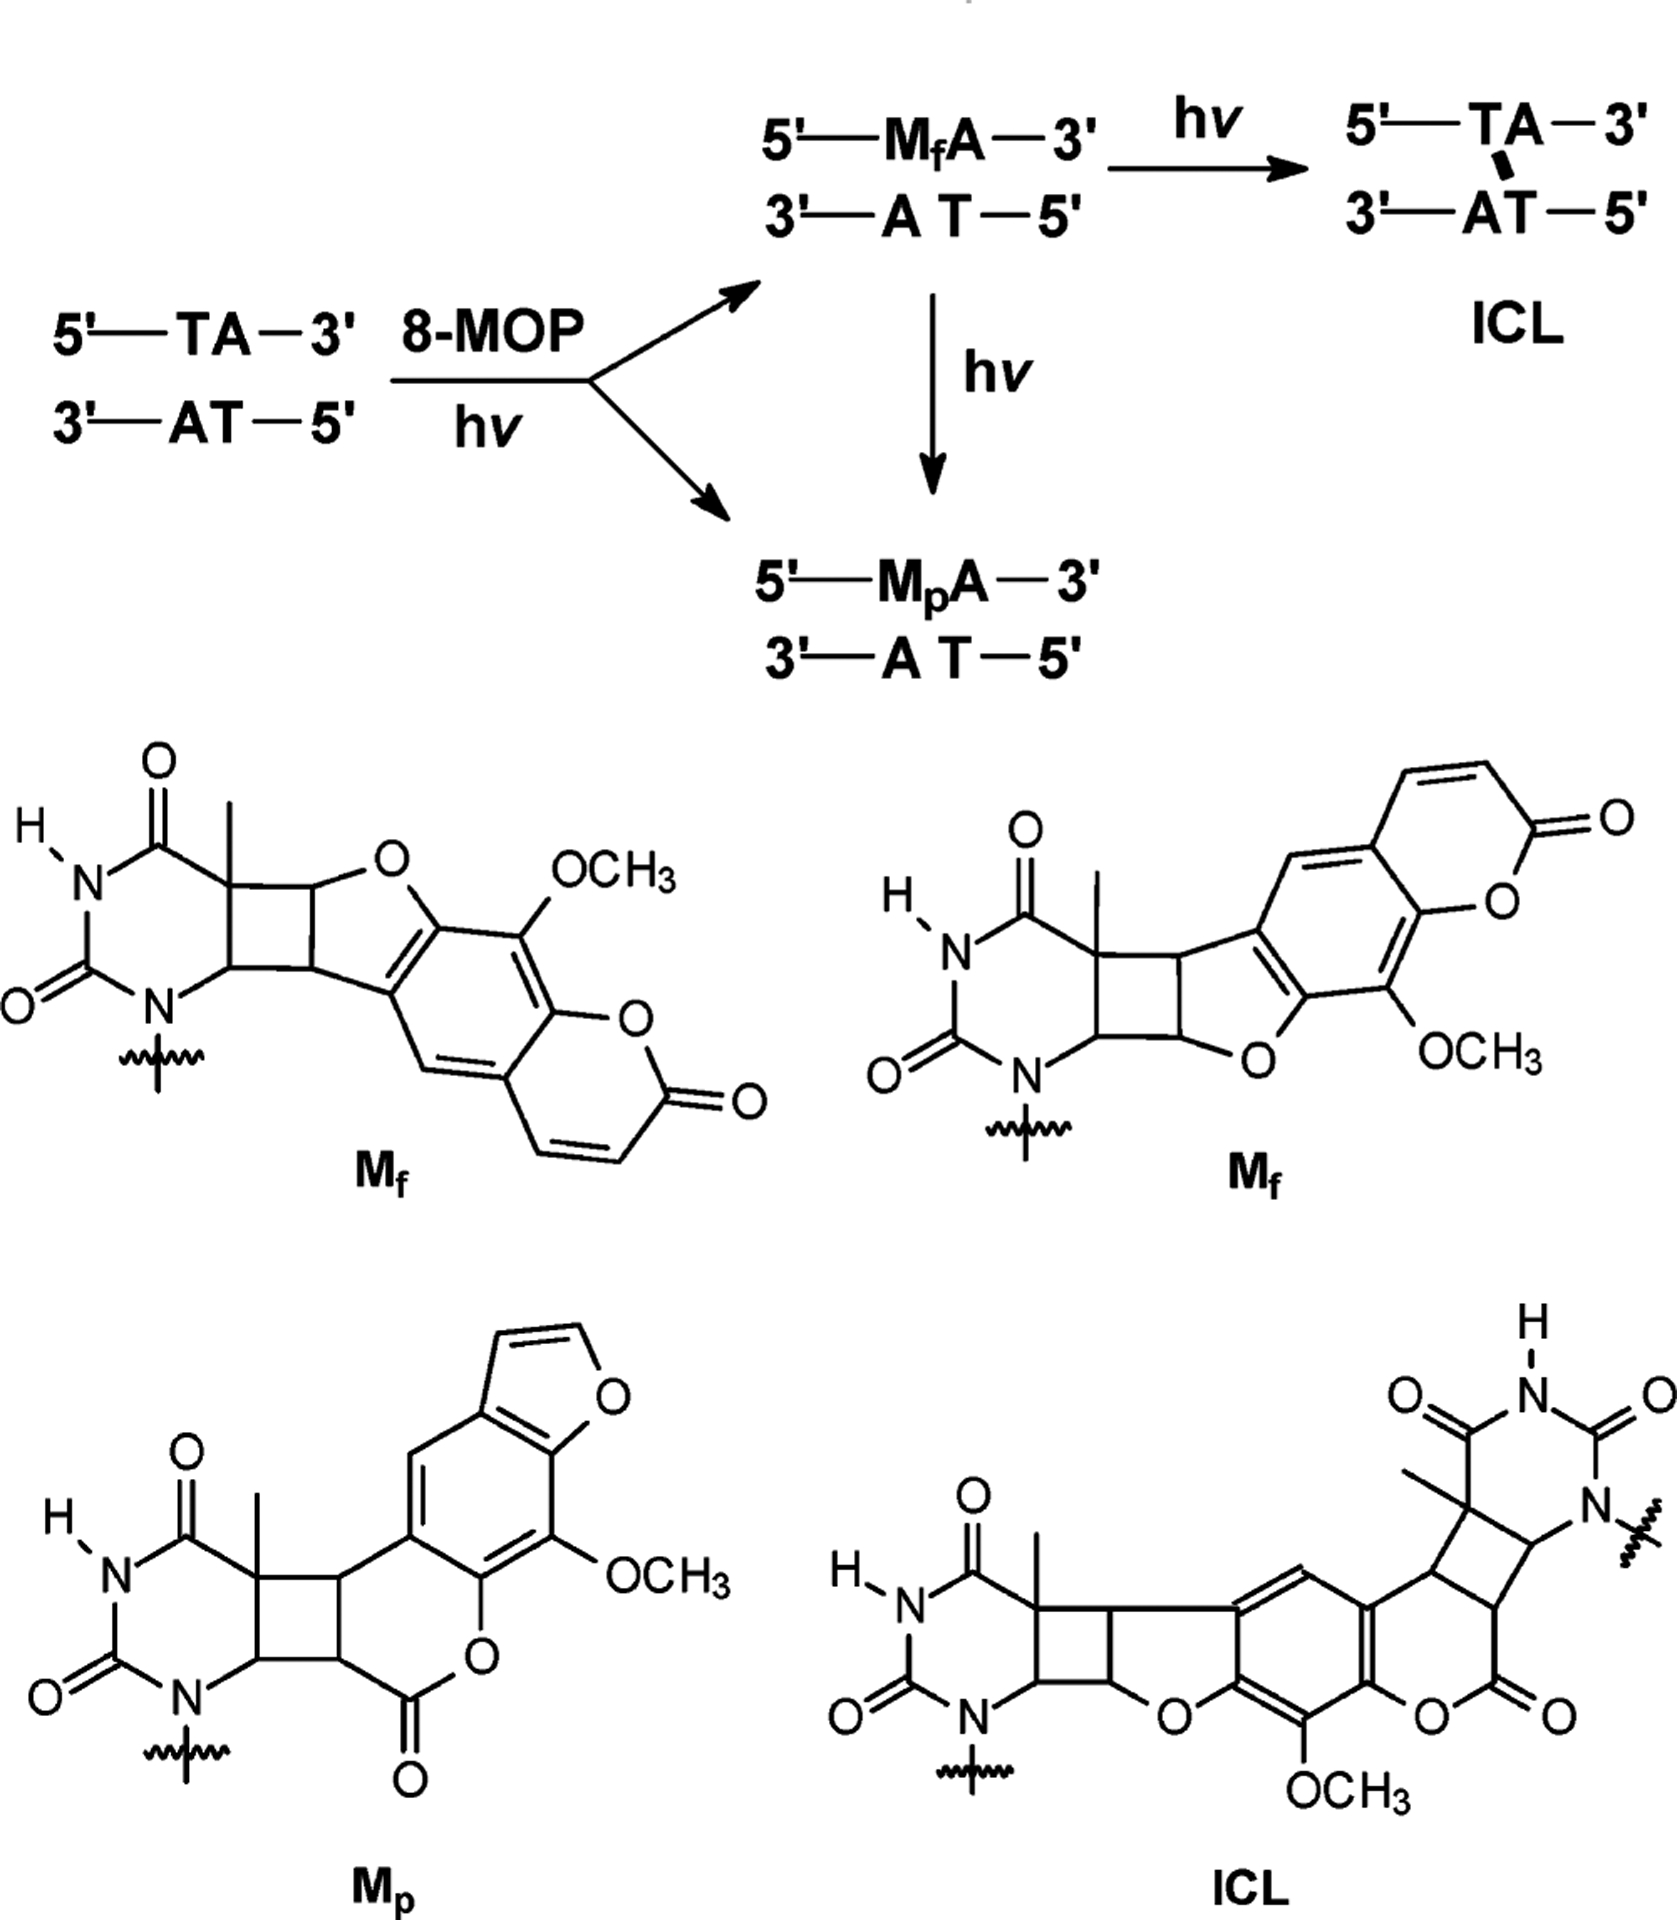
Formation of Monoadducts and ICL by 8-MOP
The assessment of toxicity, mutagenicity, and pharmacological response of these ICL-inducing drugs and the development of new interstrand cross-linking agents require a sensitive method to identify and quantify ICLs of DNA. Furthermore, clinical studies are often hampered by the absence of a sensitive method to detect this important class of DNA lesions. A number of direct and indirect biophysical and biochemical techniques have been developed for the measurement of DNA ICLs, including alkaline agarose gels,9 alkaline elution,10 alkaline comet assay,11,12 and chromatographic techniques.13,14 Most methods require radiolabeling with 32P, 14C, or 3H to achieve high sensitivity, and in many cases, structure-specific detection of various isomers of ICLs cannot be attained. The alkaline comet gel electrophoresis has been applied in clinical study to detect DNA cross-links in cells.11,15 The extent of DNA interstrand cross-link was determined indirectly by measuring the drop in DNA migration induced by a strand cleavage agent.11,12 However, the method does not allow for the absolute quantification of ICL and is susceptible to interferences from other DNA-damaging agents.16,17
Due to its increasingly improved sensitivity, mass spectrometry has been frequently employed for the analysis of DNA adducts in biological samples obtained after exposure to exogenous and endogenous genotoxic compounds.18 Although LC–MS was used to monitor monoalkylated products from the reactions of cisplatin and melphalan with nucleosides, nucleotides and oligodeoxyri-bonucleotides (ODNs),19,20 there is no general LC–MS method for the detection and quantification of DNA ICLs.
In an earlier study, we demonstrated that the mass spectrometric analysis of the tetranucleotide emanating from the nuclease P1 digestion of duplex DNA harboring a mitomycin C or 4,5′,8-trimethylpsoralen ICL could offer important structure information of the ICL.21 Building upon this previous study, herein we reported a facile and sensitive LC–MS/MS method to assess quantitatively the formation of ICL induced by 8-methoxypsoralen in human melanoma cells.
EXPERIMENTAL SECTION
Reagents and Methods.
All chemicals and enzymes, unless otherwise specified, were from Sigma-Aldrich (St. Louis, MO) or EMD Chemicals (San Diego, CA). Perdeuterated methyl iodide (CD3I, 99.5%) was obtained from Cambridge Isotope Laboratories (Andover, MA). All ODNs used in this study were purchased from Integrated DNA Technologies (Coralville, IA). WM-266-4 cells and culture media were obtained from the National Cell Culture Center (Minneapolis, MN).
High-resolution mass spectra (HRMS) were acquired on an Agilent 6210 TOF LC/MS instrument (Agilent Technologies, Palo Alto, CA) equipped with an electrospray ionization (ESI) source. 1H NMR spectra were recorded on a Varian Inova 300 NMR spectrometer.
Synthetic Procedures.
Isotope-labeled 8-MOP was prepared following the procedures described for the synthesis of [14C]-8-MOP (Scheme 2).22
Scheme 2.

Synthesis of Isotope-Labeled D3-8-MOP
8-Hydroxypsoralen (8-OHP).
Ice-cold BBr3 was added slowly to a flask, which was suspended in an ice bath and contained dry CH2Cl2 (3 mL) and 8-MOP (300 mg, 1.39 mmol) under argon atmosphere. The resulting solution was raised to room temperature and stirred overnight. Water (2 mL) was added to quench the reaction, and the mixture was extracted with ether three times (5 mL each). The ether layers were combined, dried with sodium sulfate, and concentrated in vacuo. The residue was purified on a silica gel column with 0–4% methanol in CH2Cl2 to afford the 8-OHP in white solid (yield, 75%). 1H NMR (300 MHz, DMSO-d6, Figure S1, Supporting Information (SI)): δ 10.63 (s, 1H, OH), 8.10 (d, 1H, H4, J = 9.6 Hz), 8.06 (d, 1H, H5′, J = 2.2 Hz), 7.44 (s, 1H, H5), 7.02 (d, 1H, H4′, J = 2.2 Hz), 6.38 (d, 1H, H3, J = 9.6 Hz). ESI-MS: m/z 203.2 [M + H]+.
[8-D3]-8-Methoxypsoralen (D3-8-MOP).
CD3I (100 μL, 1.61 mmol) was added to a sealed flask, which contained a mixture of 8-OHP (100 mg, 0.495 mmol), KI (2 mg), K2CO3 (300 mg), and ice-cold acetone (3 mL). The temperature of the flask was raised slowly to 45°C, and the mixture was stirred overnight. The solid in the mixture was removed by filtration, and the solvent in the resulting filtrate was removed by evaporation under reduced pressure. The residue was purified by silica gel chromatography with a gradient of 0–1% methanol in CH2Cl2. The pale yellow solid was obtained in 88% yield. 1H NMR (300 MHz, CDCl3, Figure S2, SI): δ 7.76 (d, 1H, H4, J = 9.6 Hz), 7.69 (d, 1H, H5′, J = 2.2 Hz), 7.35 (s, 1H, H5), 6.82 (d, 1H, H4′, J = 2.2 Hz), 6.37 (d, 1H, H3, J = 9.6 Hz). HRMS (ESI): [M + H]+ calcd m/z 220.0689, found 220.0680.
Preparation of Standard ICL-Containing ODN.
The synthesis of ODNs containing an 8-MOP interstrand DNA cross-link was carried out following the previously reported procedures.21 Briefly,50nmolofaself-complementaryODNd(CGCGCTAGCGCG) (12TA) was annealed in a 200-μL reaction buffer, which contained 5 mM Tris (pH 7.6), 50 mM NaCl, and 0.2 mM EDTA. The ODN solution was dispersed in a 10.4-cm-i.d. Petri dish with 5 mL of reaction buffer. A 200-μL saturated solution of 8-MOP or D3-8-MOP in ethanol was added to the reaction mixture. The resulting solution was incubated in the dark for 1 h and irradiated on ice for 45 min using two 15-W Spectroline light tubes with emitting wavelength centered at 365 nm (Spectronics Corp., Westbury, NY). After irradiation, the solution was extracted twice with chloroform, and the ODN was recovered by ethanol precipitation. The ODN pellet was resuspended in deionized water and separated by HPLC (vide infra).
HPLC Conditions.
The HPLC purification was performed on a Beckman HPLC System (pump module 125, Karat 32 software version 3.0, Fullerton, CA) with a UV detector (module 126) monitoring at 260 nm. A 4.6 × 250 mm Varian Polaris 5 C18 column (5 μm in particle size and 180 Å in pore size, Varian Inc.) was used, and 50 mM triethylammonium acetate buffer (TEAA, pH 6.8, solution A) and a mixture of 50 mM TEAA and acetonitrile (70/30, v/v, solution B) were employed as mobile phases. A gradient of 5 min 0–15% B followed by 65 min 15–50% B was employed, and the flow rate was 0.8 mL/min. For the separation of ICL reaction mixture, the column was heated to 55 °C by using a Spectra-Physics SP8790 column heater (Spectra Physics, San Jose, CA). The purities of the ICL-bearing oligomers were verified by LC–MS/MS.
Cell Culture and Drug Treatment.
The WM-266-4 human melanoma skin cancer cells (ATCC, Manassas, VA) were cultured at 37 °C in 5% CO2 atmosphere and in Eagle’s minimum essential medium supplemented with 10% fetal bovine serum (Invitrogen, Carlsbad, CA), 100 IU/mL penicillin, and 100 μg/mL streptomycin (ATCC). After growing to 80% confluence, cells were detached by trypsin–EDTA treatment and harvested by centrifugation to remove the medium. The cell pellets were subsequently washed twice with phosphate-buffered saline (PBS) and resuspended in 20 mL of PBS (106 cells/mL). The cell suspensions were dispersed into 10.4-cm-i.d. Petri dishes, and 8-MOP solution (100 μg/mL in ethanol) was added to make its final concentration 500 ng/mL. The cells were incubated with 8-MOP in the dark at room temperature for 45 min prior to UVA irradiation.
UV Irradiation.
Photoirradiation was carried out on ice using two 15-W Spectroline light tubes with emitting band centering at 365 nm. The irradiation doses were 0, 0.5, 2.0, and 5.0 J/cm2, which were measured using a Mannix UV-340 light meter (Mannix Instrument Inc., New York, NY). After irradiation, the cells were harvested by centrifugation and washed sequentially with PBS and TE buffer (10 mM Tris-Cl, 1.0 mM EDTA) to remove residual psoralen. The cell viability was assessed to be over 95% by trypan blue staining. The nuclear DNA was isolated from cell lysates by phenol extraction and desalted by ethanol precipitation.
Enzymatic Digestion.
Two units of nuclease P1 was added to a mixture containing 50 μg of genomic DNA sample and 0.5 pmol of authentic double-stranded 12-mer containing a cross-link site induced by D3-8-MOP. In this respect, nuclease P1 has combined endo- and exonuclease activities and hydrolyzes single-stranded nucleic acids to 5′-mononucleotides.23 Genomic DNA obtained by the above phenol extraction and ethanol precipitation procedures might be partially denatured, which rendered it to be cleaved by nuclease P1. No buffer was added except that present in the commercial preparation of the enzyme. The digestion mixture was incubated at 37 °C for 1 h and passed through a Centricon microcentrifuge filter (Millipore, Billerica, MA) to remove the enzyme. The aqueous layer was dried in a Speed-vac concentrator and reconstituted in 20 μL of water, and 4 μL of the digestion mixture was injected for each LC–MS measurement.
LC–MS/MS Analysis.
Quantitative analysis of ICL in the above DNA hydrolysates was performed by online capillary HPLC-ESI-MS/MS using an Agilent 1100 capillary HPLC pump (Agilent Technologies) interfaced with an LTQ linear ion trap mass spectrometer (Thermo Fisher Scientific, San Jose, CA), which was set up for monitoring the fragmentation of the [M – 2H]2− ions of the labeled and unlabeled tetranucleotides containing the 8-MOP ICL. A 0.5 × 150 mm Zorbax SB-C18 column (5 μm in particle size, Agilent Technologies) was used for the separation of the DNA hydrolysis mixture, and the flow rate was 6.0 μL/min. A 5-min gradient of 0–20% methanol in 400 mM 1,1,1,3,3,3-hexafluoro-2-propanol (HFIP, pH was adjusted to 7.0 by the addition of triethylamine), followed by a 35-min gradient of 20–50% methanol in 400 mM HFIP, was employed for the separation. The capillary temperature was maintained at 300 °C to minimize the formation of the HFIP adducts of ODNs. MS/MS data were acquired over an m/z range of 300–1500.
RESULTS AND DISCUSSION
Preparation of Standard DNA ICL.
We first obtained the ODN bearing an 8-MOP interstrand cross-link by treating self-complementary 12TA, which contained a single 5′-TA-3′ site, with labeled or unlabeled 8-MOP and UVA light. During the HPLC separation, the column was heated at 55 °C to maintain the ODNs in denatured form so that the unreacted ODN can be well-resolved from the cross-linked ODNs (Figure 1a). ESI-MS of the HPLC fraction eluting at 49 min verified the identity and homogeneity of the ICL-bearing ODN (Figure S3a, SI). In addition, LC–MS measurement showed the absence of unreacted ODN in this fraction (data not shown).
Figure 1.
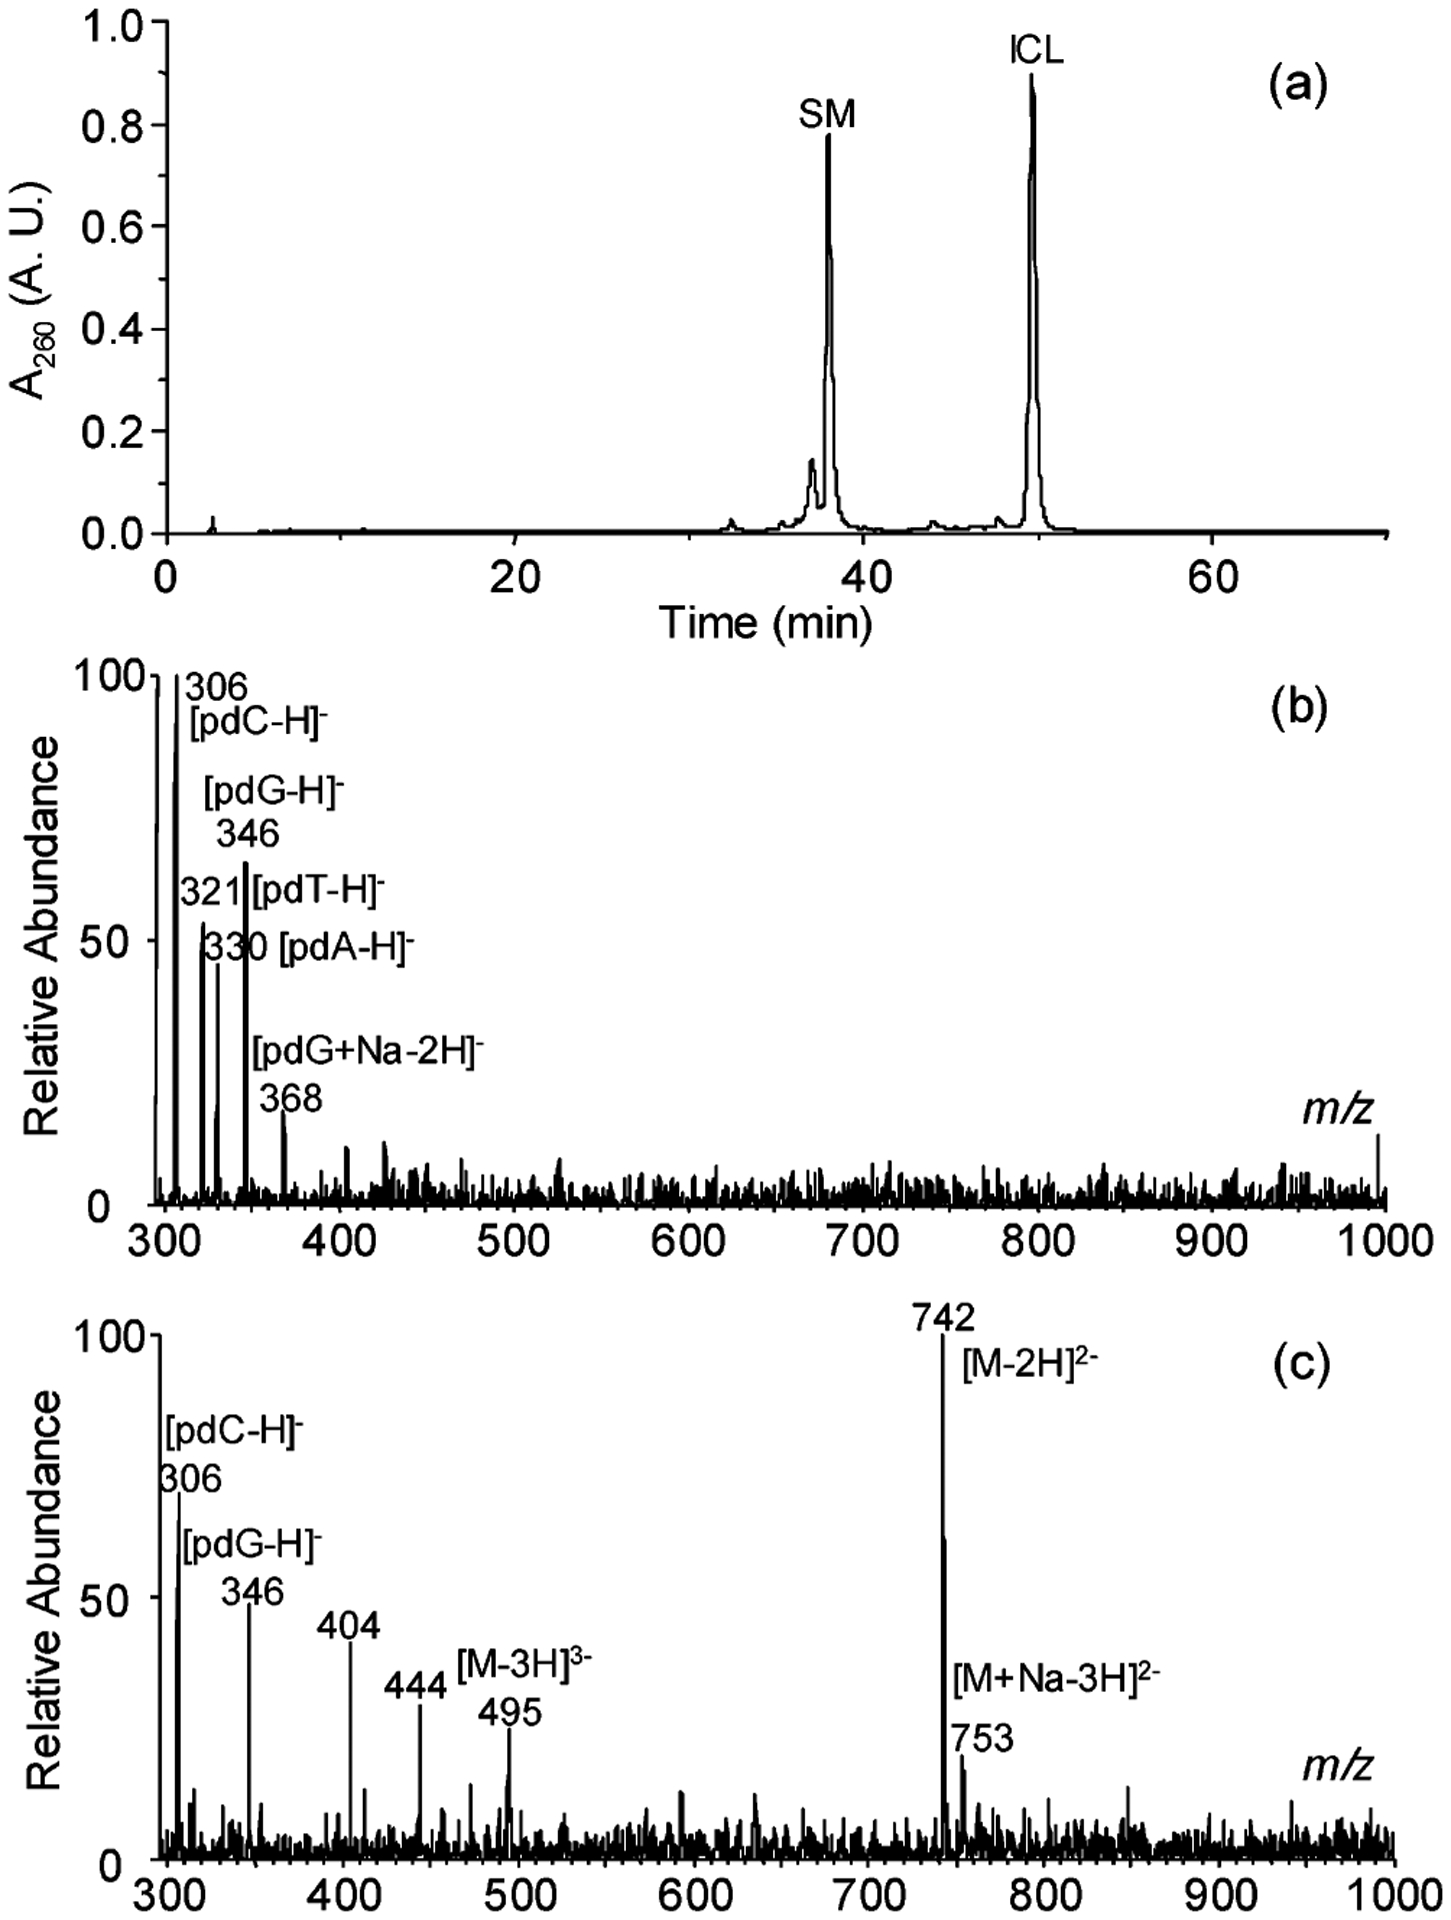
(a) HPLC trace for the separation of the interstrand cross-link reaction mixture. The peaks at 38 (SM) and 49 min (ICL) correspond to the unreacted ODN d(CGCGCTAGCGCG) and the duplex ODN bearing an 8-MOP ICL, respectively. (b) Negative-ion ESI-MSofthenucleaseP1digestionproductsofd(CGCGCTAGCGCG). The ions of m/z 306, 321, 330, and 346 correspond to the [M – H]− ions of 2′-deoxycytidine 5′-phosphate (pdC), thymidine 5′-phosphate (pdT), 2′-deoxyadenosine 5′-phosphate (pdA), and 2′-deoxyguanosine 5′-phosphate (pdG), respectively. (c) Negative-ion ESI-MS of the nuclease P1 digestion products of self-complementary d(CGCGCTAGCGCG) cross-linked with 8-MOP. The ions of m/z 306 and 346 are the deprotonated ions of pdC and pdG, respectively. The origin for the ions of m/z 404 and 444 is not clear.
Isotope-labeled D3-8-MOP was synthesized from 8-MOP by first removing the methyl group followed by remethylation using the perdeuteriated methyl iodide. The identity of the synthesized D3-8-MOP was confirmed by high-resolution mass spectrometry measurement (See Experimental Section.). In addition, we failed to observe the methyl protons in the 1H NMR spectrum of D3-8-MOP (Figure S2, SI), which is consistent with the replacement of these protons with deuterons. The 12TA ODN housing a D3-8-MOP ICL was prepared by following the same procedures as described above except that D3-8-MOP was employed as the cross-linking agent. The identity and purity of the isotope-labeled ICL were again confirmed by ESI-MS (Figure S3b, SI) and LC–MS analyses. The ODN was used directly as internal standard for the quantification study.
Analytical Strategy for the Quantification of DNA ICL by LC–MS/MS.
Negative-ion ESI-MS of the nuclease P1 digestion mixture of the 8-MOP-cross-linked d(CGCGCTAGCGCG) showed the ions of m/z 742 and 495 (Figure 1c), which correspond to the [M – 2H]2− and [M – 3H]3− ions of a tetranucleotide consisting of two dinucleotides d(pTpA) with the two thymines being bridged with the 8-MOP moiety (Scheme 3). The identity of the tetranucleotide was further confirmed by MS/MS (Figure 2a). The most abundant ion in the product ion spectrum of the [M – 2H]2− ion of the tetranucleotide is attributed to the loss of a pdA (m/z 1154), whose complementary ion of m/z 330 is also abundant. The ion of m/z 1154 can eliminate an adenine to yield an ion of m/z 1019, which can further lose [HPO3 + H2O] to give a product ion of m/z 921. The cleavage of the N-glycosidic bond of the modified thymidine yielded an ion of m/z 976, which can subsequently lose a thymine to afford the fragment ion of m/z 850 (Figure 2a, Scheme 3).
Scheme 3.
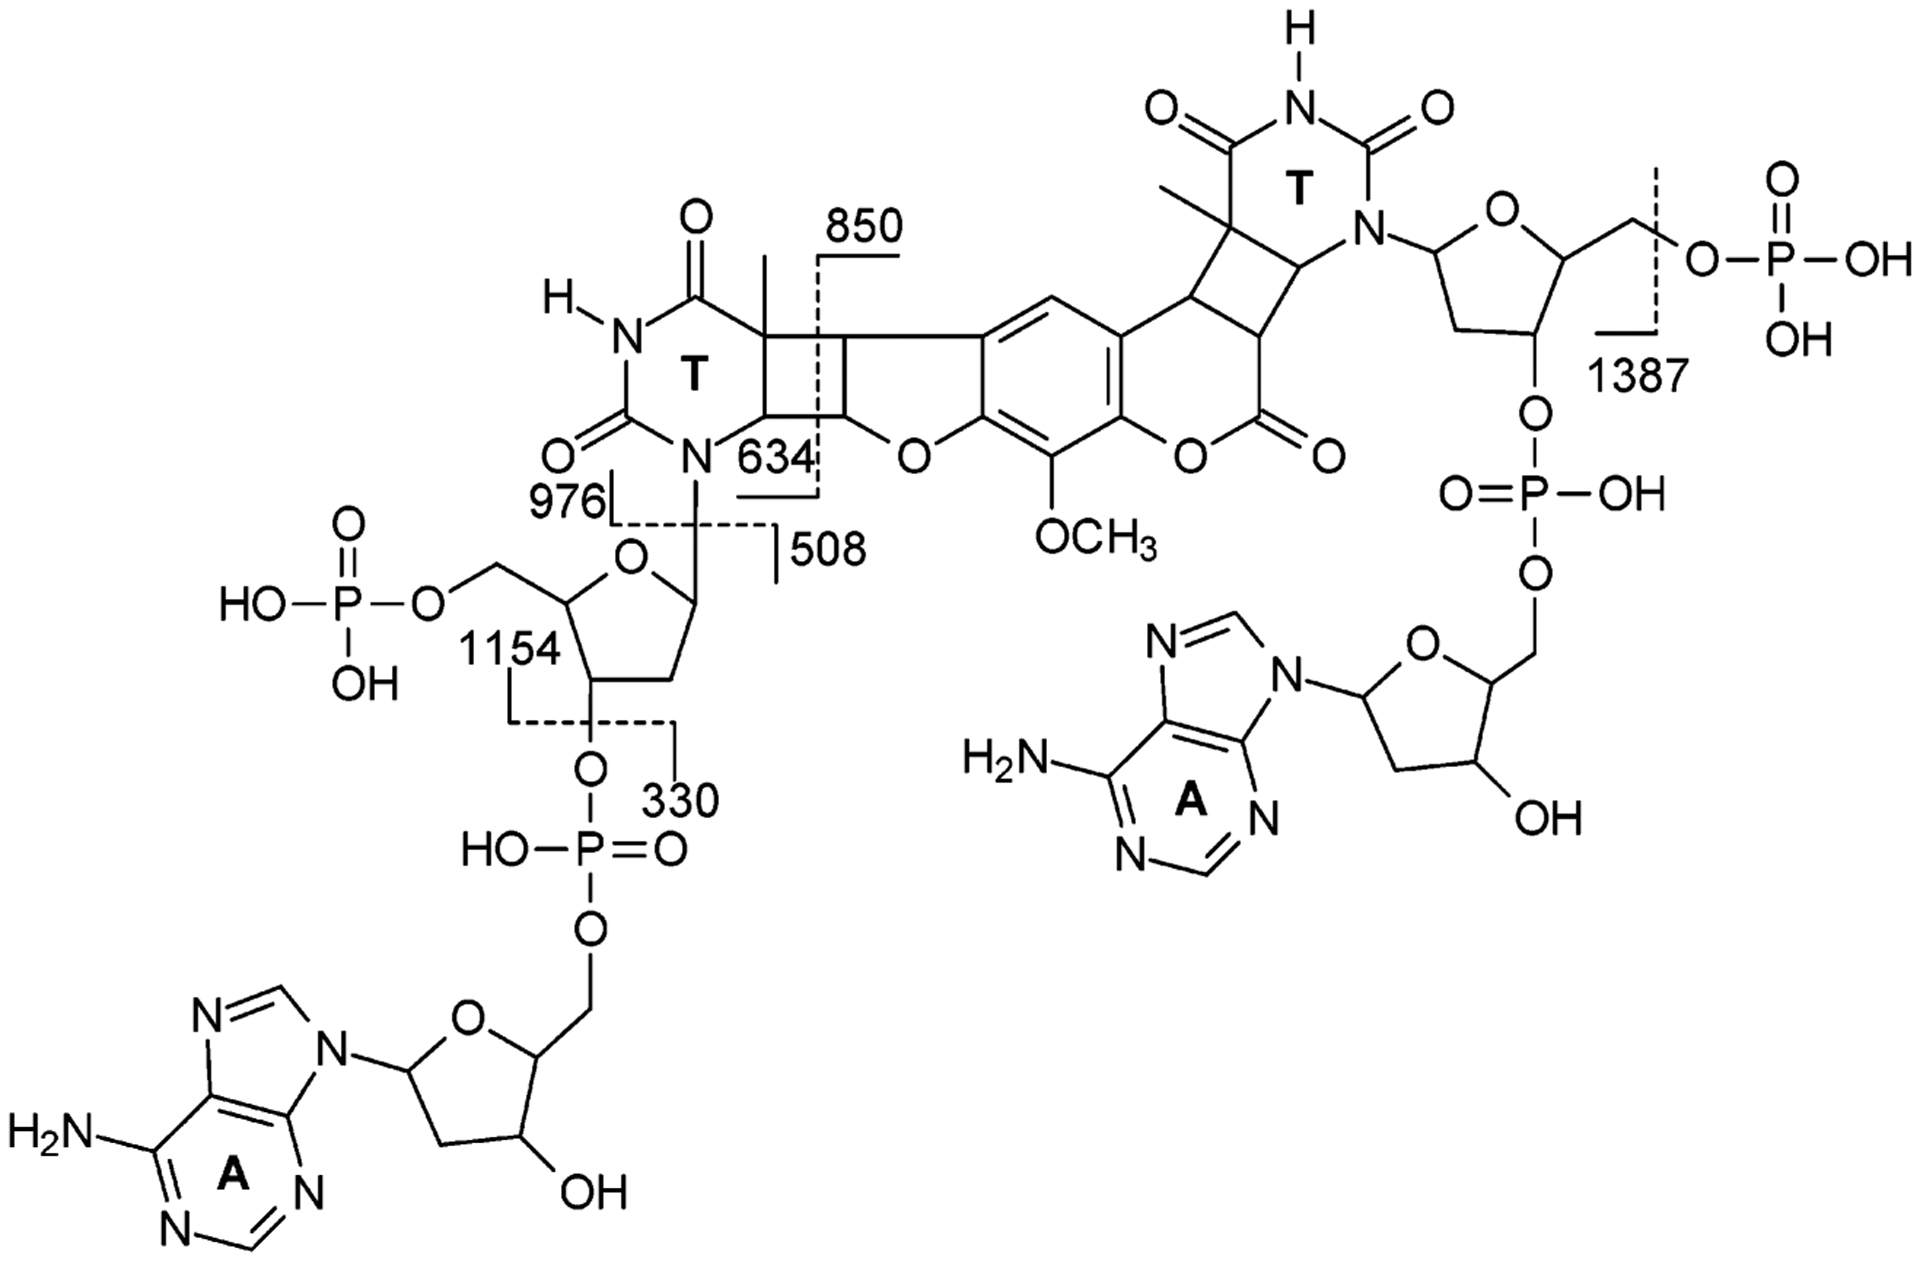
Structure of the Tetranucleotide Generated from Nuclease P1 Digestion and the Cleavages for the Formation of Major Fragment Ions Observed in MS/MS
Figure 2.
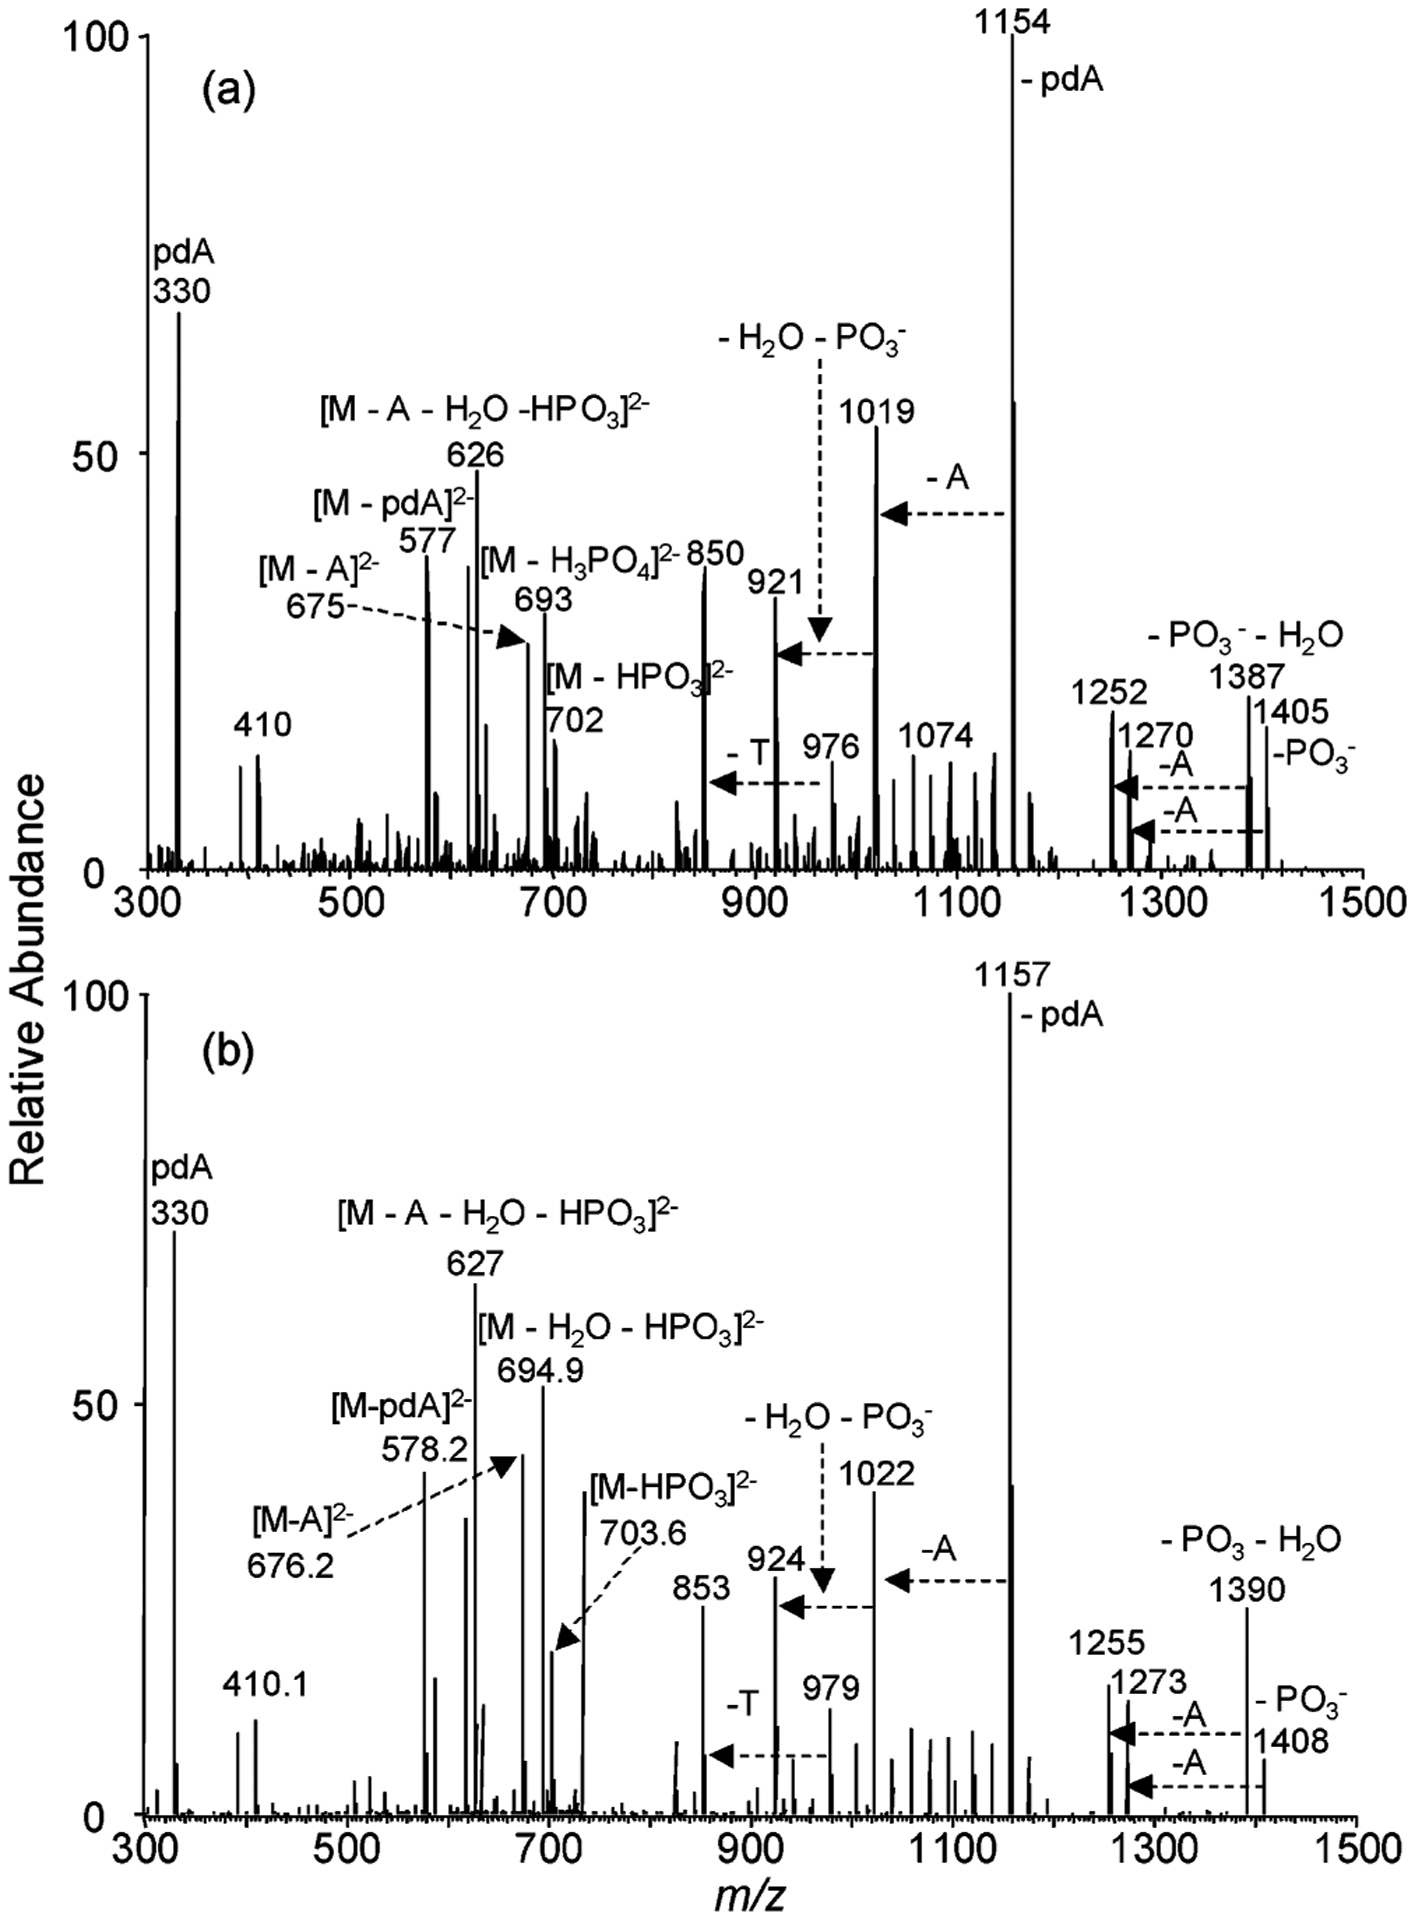
Product-ion spectra of the [M – 2H]2− ions of the (a) 8-MOP-ICL-containing and (b) D3-8-MOP-ICL-containing tetranucleotide resulting from nuclease P1 digestion.
The ions of m/z 306 and 346 are assigned as the [M – H]− ions of pdC and pdG, respectively (Figure 1c). We did not observe any obvious ions corresponding to other forms of polynucleotides housing the ICL, indicating the quantitative release of the cross-link as a tetranucleotide. In addition, there is no apparent formation of the [M – H]− ion of pdA in Figure 1c, whereas the negative-ion ESI-MS of the nuclease P1 digestion mixture of the unmodified d(CGCGCTAGCGCG) showed clearly the presence of all four mononucleotides, pdC, pdG, pdT, and pdA (Figure 1b), demonstrating that nuclease P1 fails to cleave the phosphodiester bond between dA and the cross-linked dT possibly owing to the bulky nature of the ICL adduct formed on thymine and the limited size of the active-site pocket of the enzyme.24
DNA adducts are frequently quantified by LC–MS in the positive-ion mode. In this context, DNA is first digested with nuclease P1 to yield nucleoside 5′-monophosphates, which are subsequently dephosphorylated with phosphatase to render nucleosides. The nucleoside mixture is then separated by HPLC and detected by ESI-MS or MS/MS operated in the positive-ion mode. In the viewpoint that the presence of four phosphate groups in the cross-link-containing tetranucleotide should render the facile formation of deprotonated ions during electrospray in the negative-ion mode, we decided to assess the formation of ICL by subjecting directly the nuclease P1 digestion mixture of genomic DNA to LC-negative-ion ESI-MS analysis. It is worth noting that the identities of the nucleotide neighboring to the cross-linked nucleotide can also reveal some information about the site of cross-link.21
Mobile-Phase Selection.
The analysis of tetranucleotides by ESI-MS suffers from the polyanionic nature of the oligonucleotides and stable adduct ions formed with cations, resulting in mass spectra of poor quality and large variation in ion intensity. To achieve adequate chromatographic separation of oligonucleotides by reversed-phase HPLC, an ion-pairing reagent is often used. However, the ion-suppression effect of these ion-pairing reagents frequently results in poor sensitivity in ESI-MS, particularly when multiply charged ions are generated. Thus, a compromise had to be found between optimum chromatographic separation and efficient electrospray ionization. A previous study by Apffel et al.25 showed that the application of HFIP buffer as an ion-pairing reagent and methanol as organic mobile phase can allow for the efficient separation and ionization of ODNs. We also demonstrated recently that the application of the HFIP buffer could facilitate the efficient separation and sensitive detection of an ODN mixture arising from in vitro or in vivo DNA replication.26,27 Therefore, we decided to use the same buffer for the LC–MS assessment of the formation of ICL in vivo.
The result showed that, at a signal-to-noise ratio (S/N) of 10, the above LC–MS/MS method afforded a calculated limit of detection of 8 fmol for monitoring the most abundant daughter ion of m/z 1154.1 or 3 fmol for monitoring the four most abundant fragment ions of m/z 921.2, 1019.2, 1154.1, and 1387.1 (Figure S4, SI). With this level of sensitivity, one can quantify readily the formation of ICL from 1 μg of DNA if the adduct is induced at a frequency of 1 lesion/106 normal nucleosides. In this context, it is of note that the quantification limit for the real samples might be somewhat poorer than that of the pure standard owing to the ion suppression introduced by the presence of coeluted unmodified nucleotides or other species present in the sample matrixes. Additionally, the sensitivity could be further improved if the samples are analyzed by LC–MS/MS on a triple-quadrupole instrument operated in MRM mode. Moreover, offline HPLC enrichment can also improve the sensitivity of the LC–MS assay by removing unmodified nucleotide and buffer salt, which was demonstrated to improve the sensitivity of the measurement of intrastrand cross-link lesions of DNA.28,29
Quantification of DNA ICL Induced by 8-MOP in Cultured Human Melanoma Cells.
The isotope dilution method offers reliable quantification of analytes by LC–MS. In our application, we added ICL-bearing duplex ODN induced by the isotope-labeled D3-8-MOP to the samples just prior to the enzymatic hydrolysis of genomic DNA, which corrects for potential analyte loss during various stages of sample preparation process.
Our LC–MS results revealed that 8-MOP-ICL could be induced in human skin cancer cells upon exposure to the concentration of 8-MOP and the dose of UVA irradiation that are pharmacologically relevant. In this context, a peak in select-ion chromatogram (SIC) for the m/z 742.1 → 1154.1 transition is present for the DNA sample obtained from PUVA-treated cells. The retention time for this peak is identical to the peak found in the corresponding SIC for the internal standard (i.e., m/z 743.6 → 1157.1 transition, Figure 3). Moreover, the product-ion spectrum of the [M – 2H]2− ion of this fraction showed the presence of several diagnostic fragment ions, i.e., the ions of m/z 330, 921, 1019, 1154, 1252, and 1387 (spectrum not shown). The same retention time and the similar tandem mass spectra of the analyte and the isotope-labeled internal standard support that ICL was formed in vivo.
Figure 3.
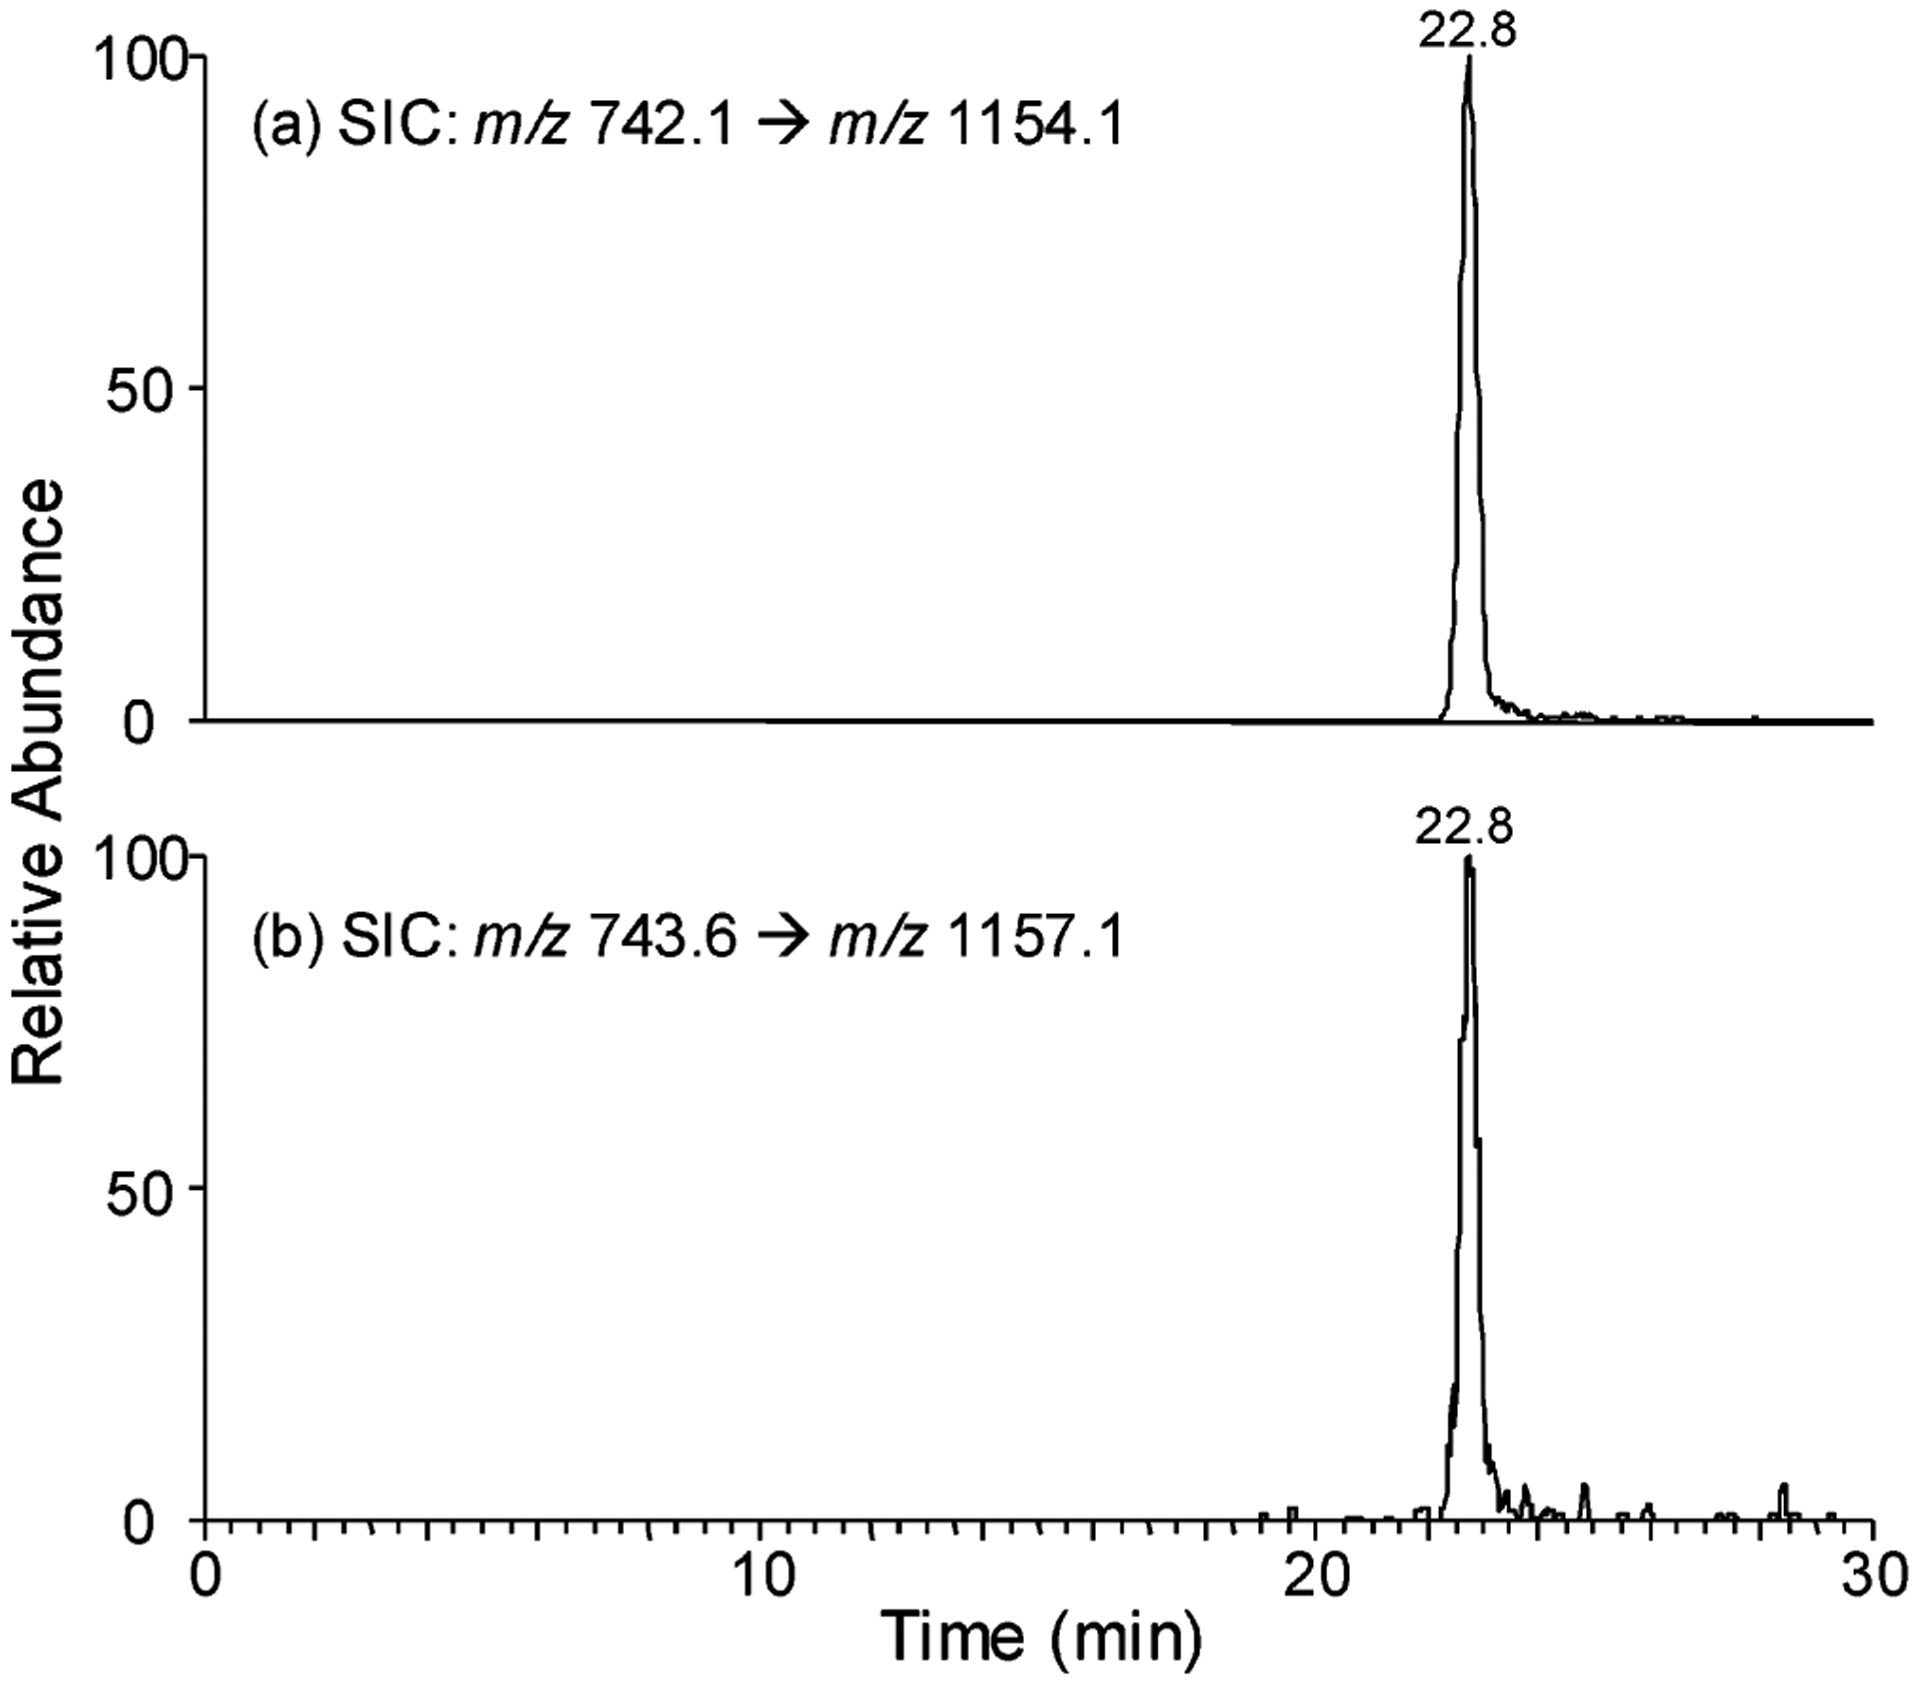
Selected-ion chromatograms for the monitoring of the m/z 742.1 → 1154.1 (a, for unlabeled 8-MOP-ICL-containing tetranucleotide) and 742.1 → 1157.1 (b, for labeled 8-MOP-ICL-containing tetranucleotide) transitions of the digestion mixtures of the cellular DNA samples, which were extracted from WM-266-4 cells treated with 500 ng/mL 8-MOP and 2.0 J/cm2 UVA light.
We further quantified the levels of ICL induced in genomic DNA of WM-266-4 cells that are treated with 500 ng/mL 8-MOP and exposed with UVA light at doses of 0.5, 2.0, and 5.0 J/cm2. The quantification results revealed the dose-dependent formation of ICL (Figure 4, and the calibration curve is shown in Figure S5, SI); the yields of ICL increased from 4.5 to 76 lesions per 106 nucleotides when the doses of UVA light increased from 0.5 to 5.0 J/cm2. It is worth noting that the ICL was not detectable in control samples isolated from the WM-266-4 cells that are incubated with 8-MOP for the same period of time but without UVA exposure.
Figure 4.
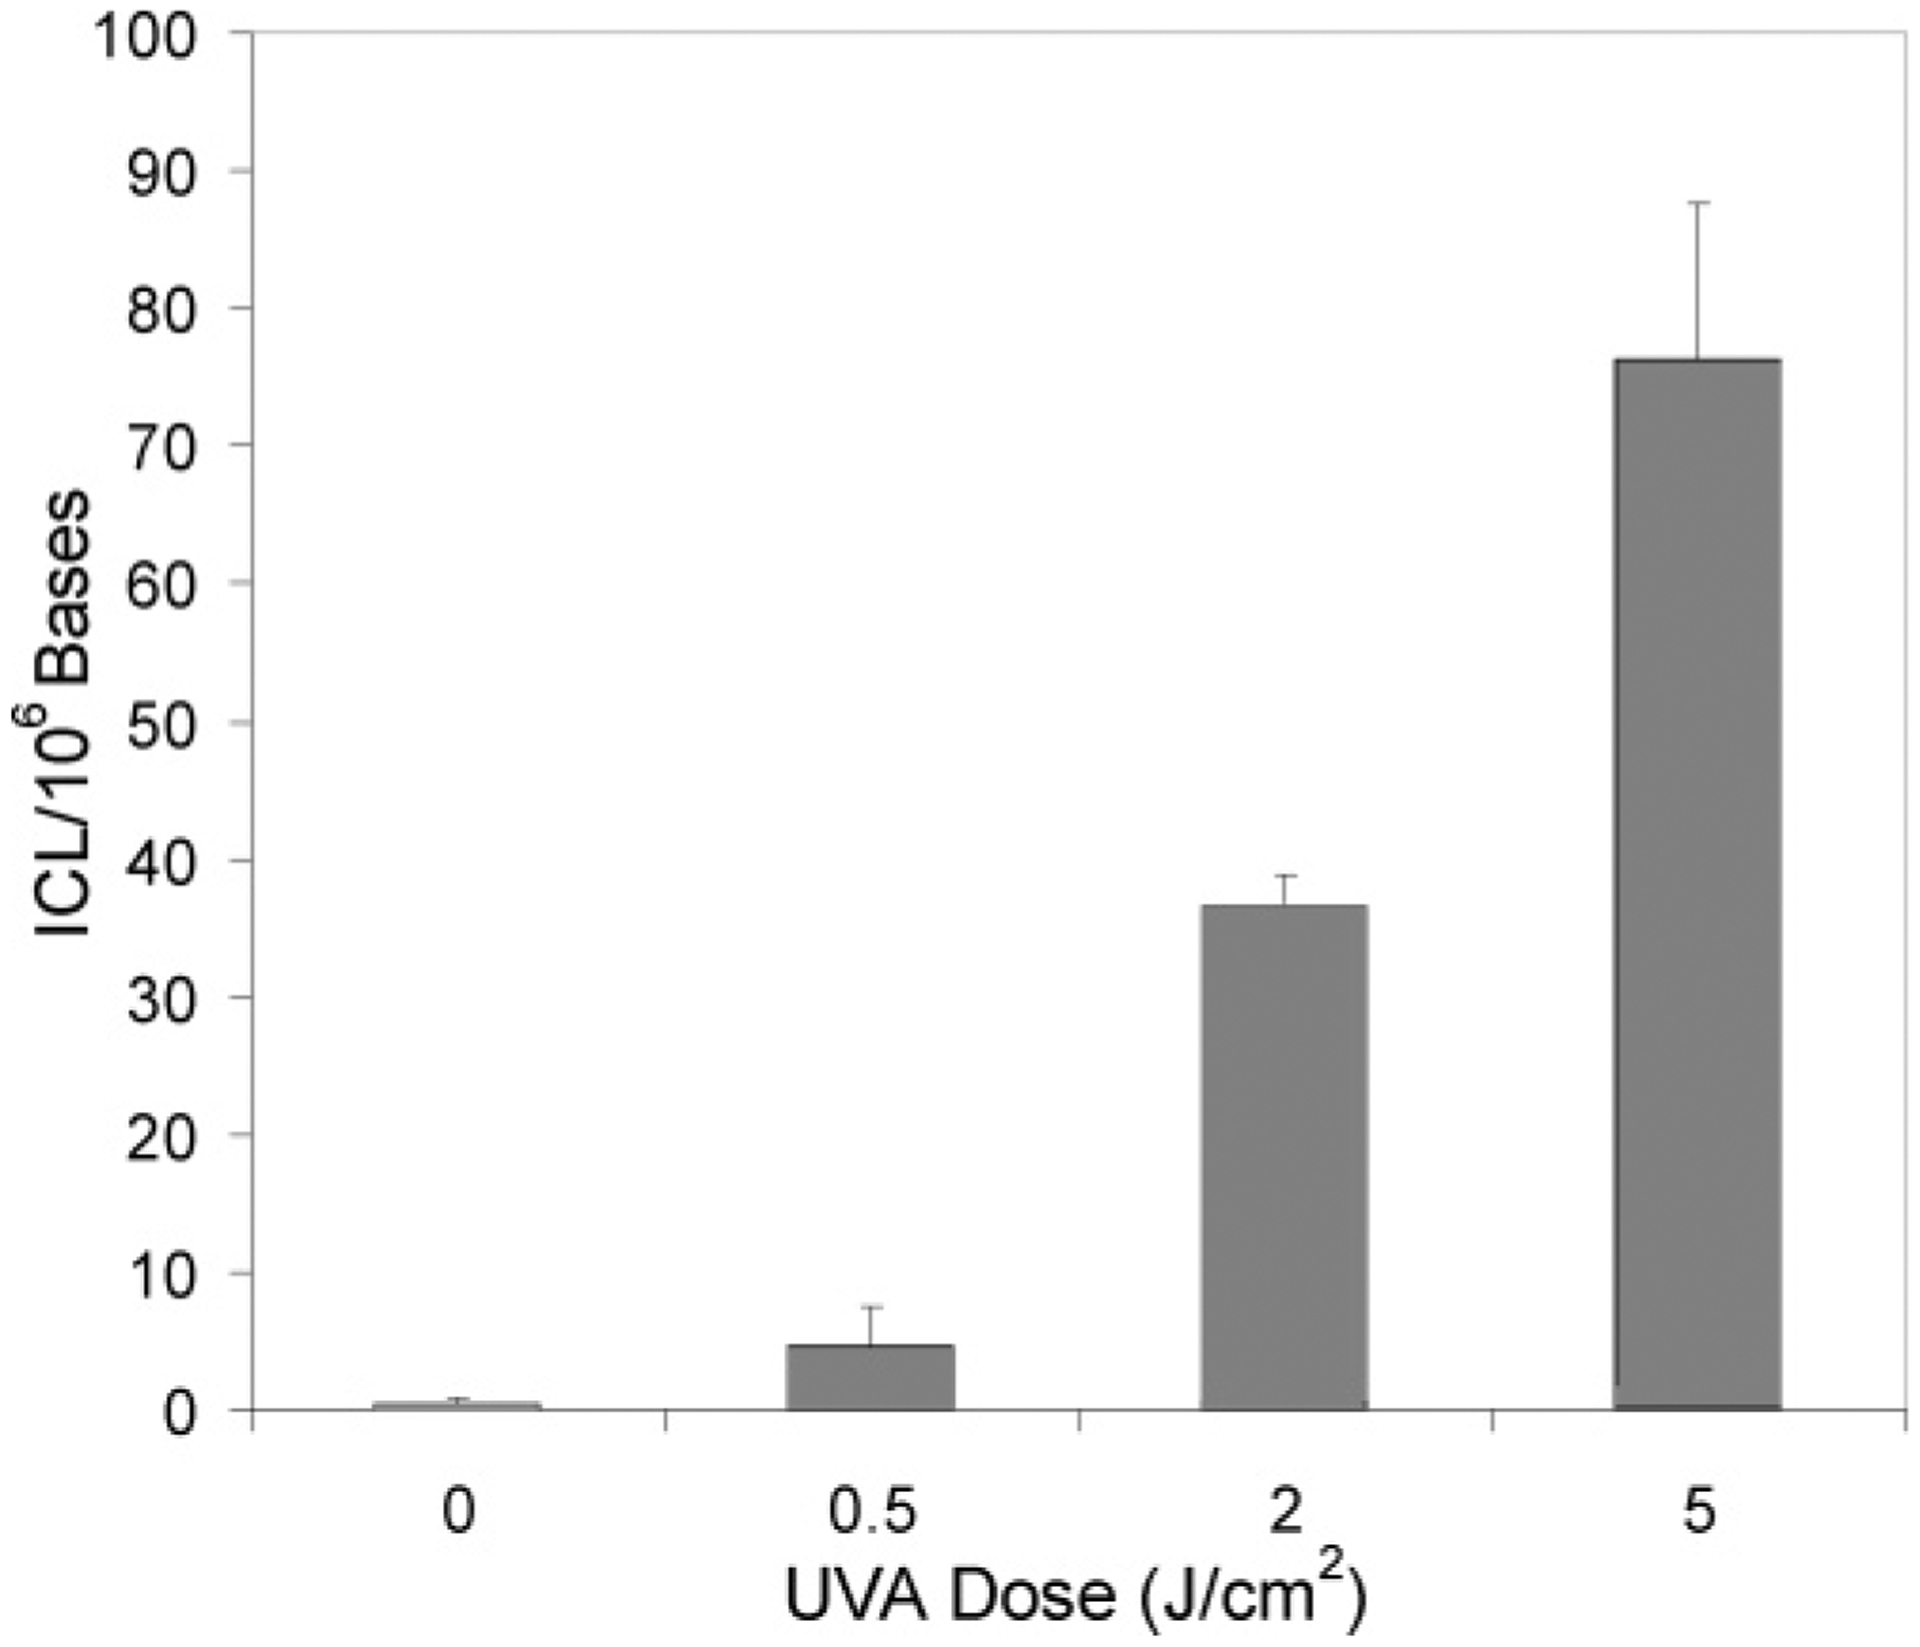
Dose-dependent formation of 8-MOP-ICL in WM-266-4 cells. The data represent the means and standard deviations of the results from three independent cell culture and drug treatments.
The cytotoxicity of cross-linking agents emanates from the formation of drug–DNA adducts, which include an array of monoadducts and intrastrand and interstrand cross-links. ICL is generally considered to be the major lesion leading to apoptosis, though the percentage of ICLs is less than 5% of total adducts in some cases.30 The potent cytotoxicity of ICL is due to the blocking of the DNA-dependent polymerases and other proteins involved in replication and transcription processes, and ICL must be repaired for cell survival. Furthermore, it has been documented that DNA interstrand cross-links are more difficult to be repaired than monoadducts.1 In this respect, in eukaryotes the ICLs are repaired primarily by nucleotide excision repair, homologous recombination, and postreplication/translesoin synthesis.1 The above quantification results showed that, at a UV dose of 2.0 J/cm2, hundreds of ICL lesions of 8-MOP can be induced in a cell. The facile formation of ICL is expected to pose a formidable threat for cell survival. The formation of ICL not only accounts for the clinical effect of the drug but also may lead to mutations in critical genes, such as those involved in the regulation of cell growth and tumor suppression, and subsequent development of cancer. Along this line, it was reported that PUVA treatment increases the risk for developing skin cancer.31–33
The peak concentration of 8-MOP in plasma and skin is in the range of 100–900 ng/mL in psorasis patients,34–36 and the typical UVA dose range employed for PUVA treatment is 1–10 J/cm2.36 Furthermore, the photochemical treatment of blood samples with amotosalen applied higher concentration of drug, i.e., ~50 μg/mL (150 μM), and similar UVA dose ranges.4 Thus, our method can facilitate the detection of ICL induced by 8-MOP from 5 μg of DNA under pharmacologically relevant conditions. Overall, the sensitivity in our method is comparable to that obtained for some common oxidatively induced DNA lesions analyzed by LC–MS/MS in the positive-ion mode.28
Many common cross-linking reagents, especially those used as anticancer agents, exhibit known sequence specificity for cross-link formation. For instance, cisplatin preferentially forms ICL between two guanines at 5′-GC-3′ site while mitomycin C conjugates specifically between the N2 of the two guanine residues at 5′-CG-3′ sequences.1 We also demonstrated previously that the nuclease P1 digestion of ODNs harboring an ICL of mitomycin C can yield similar cross-link-bearing tetranucleotides.21 Thus, it can be envisaged that the combination of nuclease P1 digestion with LC–MS/MS can be employed as a general approach for assessing the formation of ICL induced by mitomycin C and other cross-linking agents. In addition, this method obviates the use of 32P-labeling that is generally required for electrophoretic assays, and the method should also facilitate the simultaneous monitoring of multiple cross-links in a single measurement if a cross-linking agent can induce the formation of more than one type of ICL.21 This is crucial for the structure elucidation and mechanistic study, especially if different types of ICLs induced by the same agent exert different biological effects.37 Thus, the application of LC–MS can reveal significantly more structure information than previously possible by other methods.
Taken together, we reported, for the first time, the quantification of ICL induced by psoralen in cultured WM-266-4 human melanoma cells using LC–MS/MS with the standard isotope dilution method. The combination of a single step of enzymatic digestion using nuclease P1 with capillary LC–MS/MS affords a general approach for the sensitive and high-throughput identification and quantification of DNA interstrand cross-link under biologically and pharmacologically relevant conditions.
Supplementary Material
ACKNOWLEDGMENT
This work was supported in part by the National Institutes of Health (R01 CA101864 and R01 CA96906) and the Cerus Corp.
Footnotes
SUPPORTING INFORMATION AVAILABLE
NMR spectra of synthetic compounds, MS and LC–MS results. This material is available free of charge via the Internet at http://pubs.acs.org.
References
- (1).Dronkert MLG; Kanaar R Mutat. Res 2001, 486, 217–247. [DOI] [PubMed] [Google Scholar]
- (2).Lehoczky P; McHugh PJ; Chovanec M FEMS Microbiol. Rev 2007, 31, 109–133. [DOI] [PubMed] [Google Scholar]
- (3).Parrish JA; Fitzpatr Tb.; Tanenbau L; Pathak MA N. Engl. J. Med 1974, 291, 1207–1211. [DOI] [PubMed] [Google Scholar]
- (4).Lin LL; Hanson CV; Alter HJ; Jauvin V; Bernard KA; Murthy KK; Metzel P; Corash L Transfusion 2005, 45, 580–590. [DOI] [PMC free article] [PubMed] [Google Scholar]
- (5).McCullough J; Vesole DH; Benjamin RJ; Slichter SJ; Pineda A; Snyder E; Stadtmauer EA; Lopez-Plaza I; Coutre S; Strauss RG; Goodnough LT; Fridey JL; Raife T; Cable R; Murphy S; Howard F; Davis K; Lin JS; Metzel P; Corash L; Koutsoukos A; Lin L; Buchholz DH; Conlan MG Blood 2004, 104, 1534–1541. [DOI] [PubMed] [Google Scholar]
- (6).Tessman JW; Isaacs ST; Hearst JE Biochemistry 1985, 24, 1669–1676. [DOI] [PubMed] [Google Scholar]
- (7).Cimino GD; Gamper HB; Isaacs ST; Hearst JE Annu. Rev. Biochem 1985, 54, 1151–1193. [DOI] [PubMed] [Google Scholar]
- (8).Lin L; Cook DN; Wiesehahn GP; Alfonso R; Behrman B; Cimino GD; Corten L; Damonte PB; Dikeman R; Dupuis K; Fang YM; Hanson CV; Hearst JE; Lin CY; Londe HF; Metchette K; Nerio AT; Pu JT; Reames AA; Rheinschmidt M; Tessman J; Isaacs ST; Wollowitz S; Corash L Transfusion 1997, 37, 423–435. [DOI] [PubMed] [Google Scholar]
- (9).Fujiwara Y Measurement of interstrand cross-links produced by mitomycin C; Marcel Dekker: New York. 1983. [Google Scholar]
- (10).Kohn KW; Ewig RGA; Ere LC; Zwelling LA Meaurement of strand breaks and crosslink by alkaline elution; Marcel Dekker: New York, 1981. [Google Scholar]
- (11).Hartley JM; Spanswick VJ; Gander M; Giacomini G; Whelan J; Souhami RL; Hartley JA Clin. Cancer Res 1999, 5, 507–512. [PubMed] [Google Scholar]
- (12).McKenna DJ; Gallus M; McKeown SR; Downes CS; McKelvey-Martin VJ DNA Repair 2003, 2, 879–890. [DOI] [PubMed] [Google Scholar]
- (13).Hartley JA; Souhami RL; Berardini MDJ Chromatogr., B 1993, 618, 277–288. [DOI] [PubMed] [Google Scholar]
- (14).Olack G; Gattolin P; Gasparro FP Photochem. Photobiol 1993, 57, 941–949. [DOI] [PubMed] [Google Scholar]
- (15).Danson S; Ranson M; Denneny O; Cummings J; Ward TH Cancer Chemother. Pharmacol 2007, 60, 851–861. [DOI] [PubMed] [Google Scholar]
- (16).Merk O; Speit G Environ. Mol. Mutagen 1999, 33, 167–172. [DOI] [PubMed] [Google Scholar]
- (17).Brendler-Schwaab S; Hartmann A; Pfuhler S; Speit G Mutagenesis 2005, 20, 245–254. [DOI] [PubMed] [Google Scholar]
- (18).Singh R; Farmer PB Carcinogenesis 2006, 27, 178–196. [DOI] [PubMed] [Google Scholar]
- (19).Zollner P; Zenker A; Galanski M; Keppler BK; Lindner WJ Mass Spectrom. 2001, 36, 742–753. [DOI] [PubMed] [Google Scholar]
- (20).Van den Driessche B; Lemiere F; Van Dongen W; Van der Linden A; Esmans EL J. Mass Spectrom 2004, 39, 29–37. [DOI] [PubMed] [Google Scholar]
- (21).Wang Y; Wang Y Anal. Chem 2003, 75, 6306–6313. [DOI] [PubMed] [Google Scholar]
- (22).Koenigs LL; Trager WF Biochemistry 1998, 37, 10047–10061. [DOI] [PubMed] [Google Scholar]
- (23).Shishido K; Ando T In Nucleases; Linn S, Roberts RJ, Eds.; Cold Spring Harbor Laboratory Press: Cold Spring Harbor, NY, 1982; pp 155–209. [Google Scholar]
- (24).Romier C; Dominguez R; Lahm A; Dahl O; Suck D Proteins 1998, 32, 414–424. [PubMed] [Google Scholar]
- (25).Apffel A; Chakel JA; Fischer S; Lichtenwalter K; Hancock WS Anal. Chem 1997, 69, 1320–1325. [DOI] [PubMed] [Google Scholar]
- (26).Gu C; Wang Y Nucleic Acids Res. 2007, 35, 3693–3704. [DOI] [PMC free article] [PubMed] [Google Scholar]
- (27).Hong H; Cao H; Wang Y Nucleic Acids Res. 2007, 35, 7118–7127. [DOI] [PMC free article] [PubMed] [Google Scholar]
- (28).Hong H; Cao H; Wang Y; Wang Y Chem. Res. Toxicol 2006, 19, 614–621. [DOI] [PMC free article] [PubMed] [Google Scholar]
- (29).Cao H; Wang Y Nucleic Acids Res. 2007, 35, 4833–4844. [DOI] [PMC free article] [PubMed] [Google Scholar]
- (30).Palom Y; Kumar GS; Tang LQ; Paz MM; Musser SM; Rockwell S; Tomasz M Chem. Res. Toxicol 2002, 15, 1398–1406. [DOI] [PubMed] [Google Scholar]
- (31).Gelfand JM; Shin DB; Neimann AL; Wang XM; Margolis DJ; Troxel AB J. Invest. Dermatol 2006, 126, 2194–2201. [DOI] [PubMed] [Google Scholar]
- (32).Stern RS; Nichols KT; Vakeva LH N. Engl. J. Med 1997, 336, 1041–1045. [DOI] [PubMed] [Google Scholar]
- (33).Nijsten TEC; Stern RS J. Invest. Dermatol 2003, 121, 252–258. [DOI] [PubMed] [Google Scholar]
- (34).Goldstein DP; Carter DM; Ljunggren B; Burkholder JJ Invest. Dermatol 1982, 78, 429–433. [DOI] [PubMed] [Google Scholar]
- (35).Tegeder I; Brautigam L; Podda M; Meier S; Kaufmann R; Geisslinger G; Grundmann-Kollmann M Clin. Pharmacol. Ther 2002, 71, 153–161. [DOI] [PubMed] [Google Scholar]
- (36).Yeo UC; Shin JH; Yang JM; Park KB; Kim MM; Bok HS; Lee ES British J. Dermatol 2000, 142, 733–739. [DOI] [PubMed] [Google Scholar]
- (37).Kumar S; Johnson WS; Tomasz M Biochemistry 1993, 32, 1364–1372. [DOI] [PubMed] [Google Scholar]
Associated Data
This section collects any data citations, data availability statements, or supplementary materials included in this article.


