

Abstract
Background
Vitamin D deficiency is common worldwide, contributing to nutritional rickets and osteomalacia which have a major impact on health, growth, and development of infants, children and adolescents. Vitamin D levels are low in breast milk and exclusively breastfed infants are at risk of vitamin D insufficiency or deficiency.
Objectives
To determine the effect of vitamin D supplementation given to infants, or lactating mothers, on vitamin D deficiency, bone density and growth in healthy term breastfed infants.
Search methods
We used the standard search strategy of Cochrane Neonatal to 29 May 2020 supplemented by searches of clinical trials databases, conference proceedings, and citations.
Selection criteria
Randomised controlled trials (RCTs) and quasi‐RCTs in breastfeeding mother‐infant pairs comparing vitamin D supplementation given to infants or lactating mothers compared to placebo or no intervention, or sunlight, or that compare vitamin D supplementation of infants to supplementation of mothers.
Data collection and analysis
Two review authors assessed trial eligibility and risk of bias and independently extracted data. We used the GRADE approach to assess the certainty of evidence.
Main results
We included 19 studies with 2837 mother‐infant pairs assessing vitamin D given to infants (nine studies), to lactating mothers (eight studies), and to infants versus lactating mothers (six studies). No studies compared vitamin D given to infants versus periods of infant sun exposure.
Vitamin D supplementation given to infants: vitamin D at 400 IU/day may increase 25‐OH vitamin D levels (MD 22.63 nmol/L, 95% CI 17.05 to 28.21; participants = 334; studies = 6; low‐certainty) and may reduce the incidence of vitamin D insufficiency (25‐OH vitamin D < 50 nmol/L) (RR 0.57, 95% CI 0.41 to 0.80; participants = 274; studies = 4; low‐certainty). However, there was insufficient evidence to determine if vitamin D given to the infant reduces the risk of vitamin D deficiency (25‐OH vitamin D < 30 nmol/L) up till six months of age (RR 0.41, 95% CI 0.16 to 1.05; participants = 122; studies = 2), affects bone mineral content (BMC), or the incidence of biochemical or radiological rickets (all very‐low certainty). We are uncertain about adverse effects including hypercalcaemia. There were no studies of higher doses of infant vitamin D (> 400 IU/day) compared to placebo.
Vitamin D supplementation given to lactating mothers: vitamin D supplementation given to lactating mothers may increase infant 25‐OH vitamin D levels (MD 24.60 nmol/L, 95% CI 21.59 to 27.60; participants = 597; studies = 7; low‐certainty), may reduce the incidences of vitamin D insufficiency (RR 0.47, 95% CI 0.39 to 0.57; participants = 512; studies = 5; low‐certainty), vitamin D deficiency (RR 0.15, 95% CI 0.09 to 0.24; participants = 512; studies = 5; low‐certainty) and biochemical rickets (RR 0.06, 95% CI 0.01 to 0.44; participants = 229; studies = 2; low‐certainty). The two studies that reported biochemical rickets used maternal dosages of oral D3 60,000 IU/day for 10 days and oral D3 60,000 IU postpartum and at 6, 10, and 14 weeks. However, infant BMC was not reported and there was insufficient evidence to determine if maternal supplementation has an effect on radiological rickets (RR 0.76, 95% CI 0.18 to 3.31; participants = 536; studies = 3; very low‐certainty). All studies of maternal supplementation enrolled populations at high risk of vitamin D deficiency. We are uncertain of the effects of maternal supplementation on infant growth and adverse effects including hypercalcaemia.
Vitamin D supplementation given to infants compared with supplementation given to lactating mothers: infant vitamin D supplementation compared to lactating mother supplementation may increase infant 25‐OH vitamin D levels (MD 14.35 nmol/L, 95% CI 9.64 to 19.06; participants = 269; studies = 4; low‐certainty). Infant vitamin D supplementation may reduce the incidence of vitamin D insufficiency (RR 0.61, 95% CI 0.40 to 0.94; participants = 334; studies = 4) and may reduce vitamin D deficiency (RR 0.35, 95% CI 0.17 to 0.72; participants = 334; studies = 4) but the evidence is very uncertain. Infant BMC and radiological rickets were not reported and there was insufficient evidence to determine if maternal supplementation has an effect on infant biochemical rickets. All studies enrolled patient populations at high risk of vitamin D deficiency. Studies compared an infant dose of vitamin D 400 IU/day with varying maternal vitamin D doses from 400 IU/day to > 4000 IU/day. We are uncertain about adverse effects including hypercalcaemia.
Authors' conclusions
For breastfed infants, vitamin D supplementation 400 IU/day for up to six months increases 25‐OH vitamin D levels and reduces vitamin D insufficiency, but there was insufficient evidence to assess its effect on vitamin D deficiency and bone health. For higher‐risk infants who are breastfeeding, maternal vitamin D supplementation reduces vitamin D insufficiency and vitamin D deficiency, but there was insufficient evidence to determine an effect on bone health. In populations at higher risk of vitamin D deficiency, vitamin D supplementation of infants led to greater increases in infant 25‐OH vitamin D levels, reductions in vitamin D insufficiency and vitamin D deficiency compared to supplementation of lactating mothers. However, the evidence is very uncertain for markers of bone health. Maternal higher dose supplementation (≥ 4000 IU/day) produced similar infant 25‐OH vitamin D levels as infant supplementation of 400 IU/day. The certainty of evidence was graded as low to very low for all outcomes.
Plain language summary
Vitamin D supplementation for term breastfed infants to prevent vitamin D deficiency and improve bone health
Review question: do vitamin D supplements for breastfed infants or their mothers prevent vitamin D deficiency and improve bone health?
Background: vitamin D deficiency is common worldwide with infants at higher risk due to pigmentation, covering, avoidance of sun exposure or the latitude of where they live. Vitamin D is important for bone health, helping prevent nutritional rickets and fractures. Vitamin D levels are low in breast milk and exclusively breastfed infants are at risk of low vitamin D levels.
Study characteristics: evidence is up‐to‐date as of May 2020. We identified 19 studies with 2837 mother‐infant pairs assessing vitamin D given to infants (nine studies), to breastfeeding mothers (eight studies), and to infants versus breastfeeding mothers (six studies). No studies compared vitamin D given to infants versus periods of infant sun exposure.
Key results: for breastfed infants, vitamin D supplements may increase vitamin D levels and reduce the incidence of mildly low vitamin D levels, but there was insufficient information to determine if there was a reduction in vitamin D deficiency or in signs of poor bone health (low bone mineral content, nutritional rickets or fractures). For breastfed infants at higher risk of vitamin D deficiency, vitamin D supplementation for the mother may increase infant vitamin D levels and may prevent vitamin D deficiency. There was not enough information to determine if there are benefits for bone health. In populations at higher risk of vitamin D deficiency, vitamin D supplementation of infants may be better than vitamin D supplementation of the mother whilst breastfeeding for preventing vitamin D deficiency. However, the evidence is very uncertain for markers of bone health. High‐dose maternal supplementation (≥ 4000 IU per day) achieved similar infant vitamin D levels as infant supplementation with 400 IU per day.
Certainty of evidence: the evidence is currently very uncertain for supplementation of vitamin D for breastfeeding mothers or supplementation of their infants in populations at low risk of vitamin D deficiency. In populations at high risk of vitamin D deficiency, there is low‐certainty evidence that vitamin D 400 IU per day given to the infant or higher doses given to the breastfeeding mother may prevent vitamin D deficiency, although effects on bone health are unclear.
Summary of findings
Background
Description of the condition
Breastfeeding is the optimal source of nutrition for infants under six months of age. The World Health Organization (WHO) recommends exclusive breastfeeding for the first six months of life, followed by continued breastfeeding with complementary food until two years of age and beyond (WHO 2003). Exclusive breastfeeding means that no other fluid or food is given to the infant. It is recommended that, for the duration of exclusive breastfeeding, a mother's breast milk alone is sufficient to meet the energy and nutrition requirements of her infant (Butte 2001). However, there are concerns that breastfed infants may not maintain adequate vitamin D status from sunshine or their mother’s milk (Dawodu 2003; Lovell 2016). This is in part contributed to by low maternal vitamin D levels (Andiran 2002), and limited exposure of infants to sunlight (NHS 2017).
It is widely accepted that vitamin D levels are low in breast milk (Hollis 1981; Við Streym 2016). The reported prevalence of vitamin D insufficiency or deficiency in term breastfed infants without vitamin D supplementation ranges from 0.6% at seven months of age in Nepalese infants (Haugen 2016), to 40% at four months of age in infants in the USA (Merewood 2012), and even as high as 83% at one month of age in Qatari infants (Salameh 2016). The vast differences seen are likely to be caused by multiple factors, including geographical factors (latitude and season during measurement), skin pigmentation of the population studied, use of covered clothing and methodological differences (Kasalová 2015; Matsuoka 1992; Munns 2016).
Total serum 25‐OH vitamin D (calcidiol) is the generally accepted marker of vitamin D sufficiency (IOM 2011). Though there is no universal consensus, most guidelines report that 25‐OH vitamin D of at least 50 nmol/L is adequate (EFSA 2016; IOM 2011; Munns 2016). A 25‐OH vitamin D level of 30 to 50 nmol/L is considered insufficient, while a level lower than 30 nmol/L is considered deficient (Munns 2016) (Note: 1 nmol/L = 0.4 ng/mL; IOM 2011).
Vitamin D deficiency in an infant can result in a number of bone‐related as well as 'non‐bone'‐related conditions (Wharton 2003). The bony condition resulting from vitamin D deficiency in children is nutritional rickets. Nutritional rickets is characterised by deficient mineralisation of cartilage and bone, growth failure and skeletal deformity (Shore 2013a). The 'non‐bone' conditions resulting from vitamin D deficiency include seizure, myopathy (muscle weakness) and myelofibrosis (type of bone marrow cancer) (Wharton 2003). Nutritional rickets results from vitamin D deficiency, primary calcium deficiency, or both (Pettifor 2004). Two reviews on the epidemiology of nutritional rickets worldwide found that calcium deficiency may also be a major aetiology of nutritional rickets in some African, Middle Eastern and Asian countries (Creo 2017; Prentice 2013). For this Cochrane Review, the term 'nutritional rickets' refers to vitamin D‐deficient nutritional rickets.
Infants with nutritional rickets often present at between three to 18 months of age, when exclusive or partial breastfeeding is predominant (Creo 2017). Prior to three months, the infant is relatively protected by placental transfer of vitamin D (Shore 2013b).
The progression of nutritional rickets can be described in three stages. Initially, low circulating calcium (hypocalcaemia) occurs as a result of reduced absorption from the gastrointestinal tract and reabsorption from bones. The hypocalcaemia is often transient, but in infants can be prolonged enough for the infant to become symptomatic, presenting with tetany (involuntary contraction of muscles) or seizures. Subsequently, direct feedback to the parathyroid gland producing secondary hyperparathyroidism results in normalisation of serum calcium, but this is also accompanied by hypophosphataemia and hyperphosphaturia. If vitamin D deficiency continues, the raised parathyroid hormone (PTH) can no longer maintain calcium levels and rickets becomes more severe (Fraser 1967).
Diagnosis of rickets is made from a combination of clinical features, radiological findings and biochemical abnormalities. The radiological (x‐ray) findings that are most diagnostic of rickets are those that demonstrate disordered mineralisation and ossification (natural process of bone formation) of the physes, described as metaphyseal splaying. These are best seen in the metaphysis of fast‐growing bones, such as the distal ulnar and radius, distal femur, proximal and distal tibia, proximal humerus and anterior ends of middle ribs. Other findings include osteopenia (mineral content of bone tissue is reduced) and deformities (Shore 2013b). Due to increased bone activity, raised alkaline phosphatase (ALP) and PTH are commonly found. Hypocalcaemia may not be present as this is dependant on the stage of rickets development (Fraser 1967). Specifically for vitamin D‐deficient rickets, the 25‐OH vitamin D levels are less than 30 nmol/L (Munns 2016).
Nutritional rickets can be treated by replacement of vitamin D and calcium (Misra 2008). However, in the case of nutritional rickets, much of the damage caused by the deficiency, such as the skeletal deformity, is not correctable. Therefore, it is important to prevent nutritional rickets in vulnerable groups, such as breastfed infants.
Other than bone health, vitamin D has also been implicated in other conditions, such as improving immunity, prevention of cardiovascular disease, prevention of certain types of malignancies and mental health protection (Pludowski 2013). However, it is beyond the scope of this Cochrane Review to consider these outcomes.
Description of the intervention
Vitamin D, also known as ‘the sunshine vitamin’, is a pro‐hormone rather than a ‘vitamin’. It has two physiologically active forms, vitamin D2 (ergocalciferol) and vitamin D3 (cholecalciferol). Vitamin D2 (VD2) is formed from ultraviolet (UV) radiation in plants and yeast (thus the source is from food), while vitamin D3 (VD3) is synthesised in the skin from 7‐dehydrocholesterol. The synthesis of VD3 is a two‐step process, with the formation of pre‐VD3 using UVB (spectral range 290 to 320 nm) and subsequent thermal isomerisation (change in structure or configuration) into VD3. Once formed, it is bound to vitamin D‐binding protein for transport into the circulation (Holick 1980). Both VD2 and VD3 subsequently undergo similar metabolic pathways and are physiologically equivalent in function (Shore 2013a).
Vitamin D is considered a pro‐hormone because it requires further metabolism in order to function. VD2 and VD3 undergo hydroxylation in the liver to form 25‐OH vitamin D (calcidiol) and is further hydroxylated in the renal tubules to form of 1,25‐OH2 vitamin D (calcitriol), which is the active form of vitamin D (Shore 2013a). However, 25‐OH vitamin D (calcidiol) is the most plentiful and stable vitamin D metabolite in the human body and thus used for measurement of vitamin D level in the body (Adams 2010).
Vitamin D supplements come in two forms, either plant‐based VD2 or animal‐based VD3 (Wagner 2008). VD3 is frequently preferred over VD2 as it has greater efficacy in raising circulating levels of 25‐OH vitamin D and is more sustained (Armas 2004; Oliveri 2015). VD3 is extensively used as part of milk formula or food fortification (Holick 1992).
For infants, supplements are available either in combination with other vitamins or alone (Wagner 2008). Sole vitamin D supplements are preferable over combination vitamin preparations to allow adequate vitamin D dosing without overdose of other vitamins (Wagner 2008). The recommended dose for vitamin D supplementation of infants is between 340 IU and 400 IU per day, starting from birth up until one year of age (Health Canada 2012; NICE 2014; Wagner 2008). At these amounts, the risk of vitamin D toxicity is low (IOM 2011). As vitamin D is found in breast milk, it is possible to supplement the breastfeeding mother with vitamin D, thus indirectly supplementing the infant (Haggerty 2010). However, doses of about 6400 IU/day are needed in the lactating mother to have adequate excretion into human milk (Haggerty 2010).
Vitamin D toxicity has been defined as hypercalcaemia, a 25‐OH vitamin D level exceeding 250 nmol/L associated with hypercalcuria (excess calcium in the urine) and suppressed PTH (Munns 2016). Clinically, it may result in growth retardation and symptoms of hypercalcaemia (IOM 2011). Toxicity only occurs with dietary intake, not sun exposure (Holick 1981).
How the intervention might work
Human bone is first formed as cartilage and, later, bone tissue is laid down to replace the cartilage. This process is called bone mineralisation or ossification. As the infant grows, bones undergo longitudinal and radial growth and a process of modelling‐remodelling takes place (Clarke 2008). Vitamin D plays an important role in these processes. The primary action of vitamin D is to increase the absorption of calcium from the gastrointestinal tract (Elder 2014). It also mobilises calcium from bone with the help of PTH by way of increasing osteoclastic bone resorption (bone cells that break down bone tissue) (Shore 2013a). In addition, vitamin D also increases the kidney's distal tubules reabsorption of calcium together with the action of PTH (IOM 2011). The net action of vitamin D is to increase serum calcium levels.
Good bone mineralisation during early childhood and adolescence is the foundation of stronger bones later in life preventing fractures and osteoporosis (Winzenberg 2013a). Aquisition of bone mineral content is greatest in the first year of life (Koo 2013). Therefore, it is hypothesised that prevention of vitamin D deficiency by supplementation of breastfed infants should lead to better bone health in future.
Why it is important to do this review
Vitamin D deficiency and nutritional rickets among breastfed infants are not uncommon. A review of the global incidence of nutritional rickets in the last 10 years found it is an important global health problem (Creo 2017). With increasing efforts to promote exclusive breastfeeding of infants from birth to six months old (WHO 2003), it is important the risk of vitamin D deficiency in these infants is addressed.
Vitamin D supplementation of term breastfed infants has been recommended by the American Academy of Pediatrics (AAP), Institute of Medicine, Canada Health and UK National Institute for Health and Care Excellence (NICE) Guidelines (Health Canada 2012; IOM 2011; NICE 2014; Wagner 2008). These guidelines state that breastfed infants should start supplements by one month of life. Adherence to these guidelines is influenced by the recommendations of individual physicians or other healthcare professionals (Crocker 2011; Taylor 2010; Umaretiya 2017). However, when surveyed, the most common reasons given for low adherence to guidelines by physicians or mothers included "breast milk has all the nutrients a baby needs" and "nutritional rickets is not an important disease" (Perrine 2010; Taylor 2010; Umaretiya 2017). Breastfeeding advocates have also expressed concerns that the suggestion that breast milk may be vitamin D‐deficient and thus require additional supplementation may imply that artificial feeding is superior to breastfeeding (Heinig 2003).
There are three Cochrane Reviews and a Cochrane protocol on vitamin D supplementation for children and pregnant women (Palacios 2019a; Palacios 2019b; Winzenberg 2010; Winzenberg 2013b). A review on interventions to prevent nutritional rickets in term‐born children reported few data specific to term breastfed infants (Lerch 2007). This review aims to focus on evidence from randomised controlled trials (RCTs), specifically for term breastfed infants for the role of vitamin D supplementation to prevent vitamin D deficiency and improve bone health.
Objectives
To determine the effect of vitamin D supplementation given to:
infants compared to placebo or no intervention on vitamin D deficiency, bone density and growth in healthy term breastfed infants;
lactating mothers compared to placebo or no intervention on vitamin D deficiency, bone density and growth in healthy term breastfed infants;
infants compared to vitamin D supplementation given to lactating mothers on vitamin D deficiency, bone density and growth in healthy term breastfed infants;
infants compared to periods of infant sun exposure on vitamin D deficiency, bone density and growth in healthy term breastfed infants.
For each of the above comparisons:
to determine adverse effects from vitamin D supplementation compared to placebo, no intervention or other interventions in healthy term breastfed infants.
Methods
Criteria for considering studies for this review
Types of studies
We included randomised controlled trials (RCTs) or quasi‐RCTs. We excluded cross‐over studies. We considered unpublished studies or studies reported only as abstracts as eligible for inclusion, if the methods and data could be confirmed by the review author team.
Types of participants
We included term healthy infants who were breastfeeding (exclusive or partial), from birth to six months of age.
Types of interventions
Vitamin D supplement, either as a single preparation or combined with other vitamins, given directly to the infant or lactating mother. We did not apply a minimum duration of supplementation. We planned to perform the following separate comparisons:
vitamin D given to infants versus placebo or no treatment;
vitamin D given to lactating mothers versus placebo or no treatment;
vitamin D given to infants versus vitamin D given to lactating mothers;
vitamin D given to infants versus periods of infant sun exposure.
Types of outcome measures
Primary outcomes
Bone mineral density measured by dual x‐ray absorptiometry (DXA) or other validated technique (Pezzuti 2017). Where bone mineral density was not reported, we included bone mineral content as an alternative measure of bone mineralisation. Both bone mineral density and bone mineral content are accepted as measures of paediatric bone health (Crabtree 2014).
Vitamin D deficiency based on serum 25‐OH vitamin D levels (sufficiency > 50 nmol/L; insufficiency 30 to 50 nmol/L; deficiency < 30 nmol/L) (Munns 2016); (1 nmol/L = 0.4 ng/mL = 40 ng/dL = 400 ng/L = 0.4 μg/L)
Nutritional rickets defined as clinical symptoms or signs; and/or radiological signs (including reduced mineralisation and ossification of the physes and metaphyseal splaying); and/or biochemical changes (raised PTH and alkaline phosphatase, hypophosphataemia and hyperphosphaturia with or without hypocalcaemia) (Munns 2016)
Adverse effects including vitamin D toxicity (defined as hypercalcaemia and serum 25‐OH vitamin D > 250 nmol/L, with hypercalciuria and suppressed PTH) (Munns 2016)
Secondary outcomes
Lowest serum 25‐OH vitamin D level (nmol/L) up to six months of age
Serum 25‐OH vitamin D level (nmol/L) at latest time reported during treatment to six months of age
Fracture (radiologically confirmed)
Osteomalacia ‐ low bone mineral density reported on x‐ray
-
Infant growth at latest time measured:
weight gain (g/kg per day);
linear/height growth (cm/week);
head circumference (cm/week).
-
Change of standardised growth at latest time measured:
change in weight z‐score;
change in length z‐score;
change in head circumference z‐score.
-
Size at latest time measured:
weight;
length/height;
head circumference.
Search methods for identification of studies
We used the criteria and standard methods of Cochrane and Cochrane Neonatal (see the Cochrane Neonatal search strategy for specialised register). We searched for errata or retractions from included studies published in full text on PubMed (www.ncbi.nlm.nih.gov/pubmed), on 30 May 2020. We did not limit the search to any particular geographical region, language or timing of publication.
Electronic searches
We conducted a comprehensive search including: Cochrane Central Register of Controlled Trials (CENTRAL Issue 5) in the Cochrane Library; MEDLINE via PubMed (1946 to 30 May 2020); Embase (1974 to 29 May 2020); and MIDIRS (1971 to April 2020) using the following search terms: ("Breast Feeding"[Mesh] OR breastfeed* OR breast feed* OR breastfed OR lactation) AND ("vitamin D"[Mesh] OR "vitamin D" OR ergocalciferol* OR cholecalciferol*), plus database‐specific limiters for RCTs and neonates (see Appendix 1; Appendix 2; Appendix 3; Appendix 4 and Appendix 5 for the full search strategies for each database). We did not apply language restrictions.
We searched clinical trials registries for ongoing or recently completed trials (clinicaltrials.gov; The World Health Organization’s International Clinical Trials Registry Platform (ICTRP)); the ISRCTN Registry; and the Australian and New Zealand Trial Registry ANZCTR).
Searching other resources
We also searched the reference lists of any articles selected for inclusion in this review in order to identify additional relevant articles.
We searched abstracts and conference proceedings of the American Society for Bone and Mineral Research (2010 to 2018), the Perinatal Society of Australia and New Zealand (PSANZ) (2011 to 2018), the European Society for Pediatric Endocrinology (2014 to 2017), the Asia Pacific Pediatric Endocrine Society (APPES) (2010 to 2016), , the Sociedad Latino‐Americana de Endo‐crinologÃÂa Pediátrica (SLEP) (2014), the Australasian Pediatric Endocrine Group (APEG) (2015), World Congress of Pediatric Gastroenterology Hepatology and Nutrition (2016), and the European Society for Pediatric Gastroenterology Hepatology and Nutrition (ESPGHAN) (2016 to 2018).
We contacted experts in the field for any unpublished studies.
Data collection and analysis
Selection of studies
Two review authors (ML and DO) assessed titles and abstracts of all citations retrieved from the literature search to determine eligibility. Any difference in opinion was resolved through consensus or by consulting a third review author as arbiter (SA). We retrieved the full‐text article versions of potentially eligible articles or when inadequate information was provided in the abstract. We listed excluded reports in the 'Characteristics of excluded studies' tables. Included studies are listed in the ‘Characteristics of included studies'. We recorded the study selection process in a PRISMA flow diagram (Figure 1).
1.
Study flow diagram.
Data extraction and management
We independently extracted data from the included trials using specially designed data extraction forms. We requested additional unpublished information from the authors of original reports. We entered and cross‐checked data using Review Manager 5 software (RevMan 2020), and compared extracted data for any differences. If noted, we resolved differences through discussion and consensus.
Assessment of risk of bias in included studies
Two review authors (ML and SA) independently assessed the risk of bias (low, high, or unclear) of all included trials using the Cochrane ‘Risk of bias’ tool (Higgins 2017), for the following domains:
sequence generation (selection bias);
allocation concealment (selection bias);
blinding of participants and personnel (performance bias);
blinding of outcome assessment (detection bias);
incomplete outcome data (attrition bias);
selective reporting (reporting bias);
any other bias.
We resolved any disagreements by discussion or by a third assessor. See Appendix 6 for a more detailed description of risk of bias for each domain.
Measures of treatment effect
We analysed study results using RevMan 5 (RevMan 2020). We reported continuous outcomes using mean difference (MD) and dichotomous outcomes as risk ratios (RRs) and risk difference (RD) with 95% confidence intervals (CI). For results that were statistically significant, we used the value of 1/RD to calculate the number needed to treat for an additional beneficial outcome (NNTB) or the number needed to treat for an additional harmful outcome (NNTH).
Unit of analysis issues
The unit of analysis was the participating infant in individual RCTs. Other unit of analyses issues were considered:
Cluster‐randomised trials
We planned to make adjustments to the standard errors using the methods described in the Cochrane Handbook for Systematic Reviews of Interventions (Higgins 2011, Section 16.3.6), using an estimate of the intracluster correlation coefficient (ICC) derived from the trial (if possible), from a similar trial or from a study with a similar population. If we used ICC values from other sources, we reported this and conducted sensitivity analyses to investigate the effect of variation in the ICC. We considered it reasonable to combine the results from both cluster‐RCTs and individual RCTs if there was little heterogeneity between the study designs and the interaction between the effect of the intervention and the choice of randomisation unit was considered to be unlikely. One cluster‐randomised trial (Madar 2009), was found for which we estimated the ICC.
Trials with more than two treatment groups
For trials with more than two intervention groups, we only included the eligible groups. We combined intervention groups if we considered doses comparable, where appropriate. If the control group was shared by two or more study arms, we planned to divide the control group over the number of relevant subgroup categories to avoid double counting participants.
Dealing with missing data
We planned to obtain missing data from the trial authors when possible. Where we were unable to obtain missing data, we planned to examine the effect of excluding trials with substantial missing data (e.g. greater than 10% losses) in sensitivity analyses.
We planned to attempt to overcome potential bias from missing data (greater than 10% losses) using one or more of the following approaches:
whenever possible, we planned to contact the original trial investigators to request missing data;
we performed sensitivity analyses to assess how sensitive the results were to reasonable changes in the assumptions that were made (e.g. the effect of excluding trials with substantial missing data (greater than 10% losses);
we addressed the potential impact of missing data (greater than 10% losses) upon the findings of the review in the Discussion section.
Assessment of heterogeneity
We used RevMan 5 to assess the heterogeneity of treatment effects between trials (RevMan 2020). We undertook this assessment using the following two formal statistical models:
Chi2 test, to assess whether observed variability in effect sizes between studies was greater than would be expected by chance. As this test has low power when few studies are included in the meta‐analysis, we set the probability at the 10% level of significance;
I2 statistic, to ensure that pooling of data was valid. We graded the degree of heterogeneity as follows: none (< 25%); low (25% to 49%); moderate (50% to 74%); or high (≥ 75%). When we found evidence of heterogeneity, we assessed the source of heterogeneity by performing sensitivity and subgroup analyses, while looking for evidence of bias or methodological differences between trials.
Assessment of reporting biases
Where we identified 10 or more studies that included a specific intervention (comparison) and reported on the same outcome, we assessed reporting and publication biases by examining the degree of asymmetry of a funnel plot in RevMan 5 (RevMan 2020).
Data synthesis
Where we identified two or more studies that were homogenous, we performed a meta‐analysis using RevMan 5 (RevMan 2020). We used a fixed‐effect model for analysis as recommended by the Cochrane Neonatal Group (neonatal.cochrane.org/resources-review-authors). For studies that were clinically distinct, we did not combine the studies for meta‐analysis and instead presented a narrative description of the study results. The narrative description included the general direction, size, consistency and strength of the evidence of effect of each individual study. We did not attempt to compare the effects of each study or draw an overall conclusion.
Certainty of evidence
We used the GRADE approach, as outlined in the GRADE Handbook (Schünemann 2013), to assess the certainty of evidence for the following (clinically relevant) outcomes:
vitamin D insufficiency/deficiency;
serum 25‐OH vitamin D level;
number of infants diagnosed with nutritional rickets;
bone mineral density;
adverse effects.
Two review authors (MLT, DO) independently assessed the certainty of evidence for each of the outcomes above. We considered evidence from randomised controlled trials initially as high certainty but downgraded the evidence one level for serious (or two levels for very serious) limitations based upon the following: design (risk of bias), consistency across studies, directness of the evidence, precision of estimates and presence of publication bias. We used the GRADEpro GDT Guideline Development Tool to create three ‘Summary of findings’ tables to report the certainty of evidence.
The GRADE approach results in an assessment of the certainty of a body of evidence as one of four grades.
High certainty: further research is very unlikely to change our confidence in the estimate of effect.
Moderate certainty: further research is likely to have an important impact on our confidence in the estimate of effect and may change the estimate.
low‐certainty: further research is very likely to have an important impact on our confidence in the estimate of effect and is likely to change the estimate.
Very low‐certainty: we are very uncertain about the estimate.
Subgroup analysis and investigation of heterogeneity
Where sufficient data was available, we explored potential sources of heterogeneity by analysing whether results differed for infants at:
high risk of vitamin D deficiency due to: pigmentation, covering or avoidance of sun exposure, and/or latitude (insufficient UV intensity most of the year), versus lower risk;
seasonality of supplementation (winter versus non‐winter);
supplementation with plant‐based VD2 versus animal‐based VD3;
dose of vitamin D to infant (200 to 400 IU/day; 400 to 800 IU/day; > 800 IU/day) or mother (400 to 2000 IU/day; 2000 to 4000 IU/day; > 4000 IU/day)
duration of vitamin D supplementation (< one month; one to two months; two to four months; four to six months); and
timing of commencement of vitamin D supplementation (from birth; one to two months; three to four months; five to six months).
Sensitivity analysis
We explored heterogeneity where sufficient data were available by performing sensitivity analyses. Where possible, we conducted sensitivity analyses to assess any change in the direction of effect caused by inclusion of studies of lower quality, based on assessment of: allocation concealment, adequate randomisation, blinding of treatment, less than 10% loss to follow‐up, and intention‐to‐treat analyses.
Results
Description of studies
Results of the search
Our search found 524 records (after deduplication) of potentially relevant studies from searching databases and following up on references of studies. Three hundred and sixty records were excluded after reading the titles and abstracts. After examining 158 records, we included 19 studies (with 42 records) and excluded 58 studies (with 116 records) in this review. We identified four ongoing studies and two studies awaiting classification.
For one study awaiting classification, we were are not able to determine if the participants were truly randomised and attempts to contact the authors have failed (Kim 2010). The other is published in abstract form with insufficient information for inclusion (Wagner 2018).
Four ongoing studies are pending conclusion (ACTRN12618001992291; ACTRN12614000334606), or current status could not be determined (ACTRN12615000642583; ChiCTR1800020179).
Included studies
We included 19 studies in this review out of which 17 were randomised controlled trials (RCT), with one quasi‐RCT (Ala‐Houhala 1986), and one cluster‐RCT (Madar 2009). Eleven were two‐arm studies (Alonso 2011; Greer 1981; Hollis 2015; Madar 2009; Moodley 2015; Naik 2017; Niramitmahapanya 2017; Rueter 2019; Thiele 2017; Trivedi 2020; Wagner 2006), seven were three‐arm studies (Ala‐Houhala 1985; Ala‐Houhala 1986; Chandy 2016; Greer 1989; Ponnapakkam 2010; Rothberg 1982; Wheeler 2016), and one was a five‐arm study (Roth 2016).
Participants (including total number)
A total of 2837 mother‐infant pairs participated in the included studies. All the infants in the included studies were term, healthy, singleton infants, enrolled soon or up until six weeks after birth (birth: Ala‐Houhala 1985; Ala‐Houhala 1986; Greer 1989; Moodley 2015; Naik 2017; Niramitmahapanya 2017; Ponnapakkam 2010; Roth 2016; Rothberg 1982; Thiele 2017; Trivedi 2020; two weeks until six weeks: Alonso 2011; Chandy 2016; Greer 1981; Hollis 2015; Madar 2009; Rueter 2019; Wagner 2006; Wheeler 2016). Hollis 2015 included late preterm infants but, in the final analysis, the average gestation of the infants included was 39 weeks.
The infants in the included studies were exclusively breastfed, or had mothers who intended to exclusively breastfeed at the start of the study. Two studies also included non‐breastfeeding infants, but separate data were available for the exclusively breastfed infants (Alonso 2011; Madar 2009), At the end of the study, not all infants were still exclusively breastfed. Four studies had all infants enrolled in the studies exclusively breastfed from the start till end of the study (Greer 1981; Naik 2017; Thiele 2017; Trivedi 2020). Eight studies excluded the non‐exclusively breastfed infants from analysis (Ala‐Houhala 1985; Greer 1989; Hollis 2015; Niramitmahapanya 2017; Ponnapakkam 2010; Rothberg 1982; Wagner 2006; Wheeler 2016). Four studies included all exclusively and non‐exclusively breastfed infants in their analyses (Chandy 2016; Moodley 2015; Rueter 2019; Roth 2016). Where reported, the exclusive breastfeeding rates at six months were 12% to 15% (Roth 2016), 24% (Moodley 2015), 64.7% at four months (Hollis 2015) and 70.5% (Rueter 2019). The proportion of infants with vitamin D insufficiency or deficiency at enrolment ranged from 13% to 96.4% (Madar 2009; Moodley 2015; Naik 2017; Wheeler 2016; Trivedi 2020).
The mothers in the studies were all healthy. While none of the studies specifically included women with known vitamin D insufficiency or deficiency, the proportion of mothers included who had vitamin D deficiency or insufficiency ranged from 10% to 90.4% in six studies (Ala‐Houhala 1985; Moodley 2015; Naik 2017; Roth 2016; Trivedi 2020; Wheeler 2016). Rueter 2019 excluded infants of mothers with 25‐hydroxyvitamin D (25‐OH D) serum concentrations less than 50 nmol/L or greater than 100 nmol/L between 36 and 40 weeks’ gestation, intended to reduce the risk of vitamin D deficiency or toxicity in the infant participants. The remaining studies either reported the mean 25‐OH vitamin D levels at baseline (Chandy 2016; Hollis 2015; Niramitmahapanya 2017; Rothberg 1982; Wagner 2006), or did not report these levels at all (Ala‐Houhala 1986; Alonso 2011; Greer 1981; Greer 1989; Madar 2009; Ponnapakkam 2010; Thiele 2017). In four studies, some or all of the women also took prenatal vitamin D (Ala‐Houhala 1985; Ala‐Houhala 1986; Greer 1989; Wagner 2006), while two studies excluded women who took prenatal vitamin D (Chandy 2016; Naik 2017).
Settings (latitude, season)
All studies were conducted in the community setting. All except two of the studies were from temperate countries (latitude between 23.5ðN/S and 66.5ðN/S): six from the USA (Greer 1981; Greer 1989; Hollis 2015; Ponnapakkam 2010; Thiele 2017; Wagner 2006), two from Finland (Ala‐Houhala 1985; Ala‐Houhala 1986), three from India (Chandy 2016; Naik 2017; Trivedi 2020), and one each from Australia (Rueter 2019), Mexico (Moodley 2015), New Zealand (Wheeler 2016), Norway (Madar 2009), South Africa (Rothberg 1982), and Spain (Alonso 2011). The two studies from the tropics (latitude between 23.5ðN and 23.5ðS), were from Bangladesh (Roth 2016), and Thailand (Niramitmahapanya 2017).
Among the studies conducted in temperate countries, 10 were non‐seasonal (Alonso 2011; Chandy 2016; Greer 1989; Hollis 2015; Madar 2009; Moodley 2015; Naik 2017; Rueter 2019; Trivedi 2020; Wheeler 2016). Five studies were seasonal where two were conducted during winter (Ala‐Houhala 1986; Rothberg 1982), and three were conducted during summer and winter (Ala‐Houhala 1985; Greer 1981; Thiele 2017). The remaining studies did not specify the season (Ponnapakkam 2010; Wagner 2006).
Higher versus lower‐risk populations
Prespecified criteria for studies of populations at high risk of vitamin D deficiency included pigmentation, covering or avoidance of sun exposure, or latitude, or both. In addition, studies with documented vitamin D insufficiency or deficiency at baseline were included as high risk. Ten studies were considered to be in high‐risk populations: Ala‐Houhala 1985 (latitude 61ðN and 25% mothers vitamin D insufficient at baseline); Ala‐Houhala 1986 (latitude 61ðN and 63% mothers vitamin D insufficient at baseline); Chandy 2016 (pigmentation, covering and the average level of 25‐OH vitamin D in mothers was considered vitamin D deficient at baseline); Madar 2009 (latitude 60ðN and immigrants from Pakistan, Turkey and Somalia); Moodley 2015 (pigmentation and the the average level of 25‐OH vitamin D in mothers was considered vitamin D deficient at baseline); Naik 2017 (pigmentation and the average level of 25‐OH vitamin D in mothers was considered vitamin D deficient at baseline); Roth 2016 (pigmentation and the average level of 25‐OH vitamin D in mothers was considered vitamin D deficient at baseline); Rothberg 1982 (winter, the average level of 25‐OH vitamin D in mothers and infants was considered vitamin D deficient at baseline); Trivedi 2020 (pigmentation, the average level of 25‐OH vitamin D in mothers and infants was considered vitamin D deficient at baseline); Wheeler 2016 (55% of mothers vitamin D insufficient at baseline).
Nine studies were considered to be in low‐risk populations (Alonso 2011; Greer 1981; Greer 1989; Hollis 2015; Niramitmahapanya 2017; Ponnapakkam 2010; Rueter 2019; Thiele 2017; Wagner 2006).
Intervention
Vitamin D was given either to the infant (seven studies: Alonso 2011; Greer 1981; Greer 1989; Madar 2009; Moodley 2015; Ponnapakkam 2010; Rueter 2019), or lactating mother (six studies: Naik 2017; Niramitmahapanya 2017; Roth 2016; Thiele 2017; Trivedi 2020; Wheeler 2016), or both (six studies: Ala‐Houhala 1985; Ala‐Houhala 1986; Chandy 2016; Hollis 2015; Rothberg 1982; Wagner 2006).
In studies giving vitamin D to infants, vitamin D2 (ergocalciferol) drops were used in four studies (Ala‐Houhala 1986; Greer 1981; Greer 1989; Madar 2009), at a dose of 400 IU/day. Vitamin D3 (cholecalciferol) drops were used in six studies (Alonso 2011; Greer 1989; Moodley 2015; Ponnapakkam 2010; Rueter 2019; Wagner 2006), at these doses: 200 IU/day, 400 IU/day, 402 IU/day or as 50,000 IU in a single dose. Three studies did not specify the type of vitamin D given (Ala‐Houhala 1985; Chandy 2016; Rothberg 1982), but were given at a dose of 400 IU/day.
In studies giving vitamin D to lactating mothers, only oral vitamin D3 was used. The dose ranged from daily doses of 500 IU/day to 6400 IU/day, or monthly doses of 50 000 IU/dose to 120 000 IU/dose.
Co‐interventions were given in seven studies: Chandy 2016 had the infants exposed to sunlight for one hour per day while Greer 1989, Thiele 2017 and Wagner 2006 gave all mothers 400 IU of vitamin D daily in the form of a prenatal vitamin. Naik 2017 gave all mothers a postnatal vitamin containing 125 IU vitamin D daily. All mothers in Roth 2016 took high‐dose prenatal vitamin D from the second trimester and pre and postnatal calcium 500 mg. All mothers in Trivedi 2020 took prenatal calcium 500 mg and a vitamin D3 250 IU supplement.
Comparators
Seven studies compared vitamin D given to infants versus placebo or no treatment (Alonso 2011; Greer 1981; Greer 1989; Madar 2009; Moodley 2015; Ponnapakkam 2010; Rueter 2019). Seven studies compared vitamin D given to lactating mothers versus placebo or no treatment (Naik 2017; Niramitmahapanya 2017; Roth 2016; Rothberg 1982; Thiele 2017; Trivedi 2020; Wheeler 2016). Another six studies compared vitamin D given to infants with vitamin D given to lactating mothers (Ala‐Houhala 1985; Ala‐Houhala 1986; Chandy 2016; Hollis 2015; Rothberg 1982; Wagner 2006). There were no studies comparing vitamin D given to infants with periods of infant sun exposure.
Duration of intervention
Duration of the intervention was very heterogenous. The shortest duration was a single dose at birth (Moodley 2015), and longest duration was 12 months (Alonso 2011). The majority of studies gave the intervention for less than eight weeks duration (Madar 2009; Naik 2017; Niramitmahapanya 2017; Rothberg 1982; Thiele 2017), or between 12 to 26 weeks duration (Ala‐Houhala 1986; Ala‐Houhala 1985; Greer 1981; Greer 1989; Hollis 2015; ;Ponnapakkam 2010; Rueter 2019; Roth 2016; Trivedi 2020; Wagner 2006; Wheeler 2016). One study gave the intervention for nine months (Chandy 2016), and another started the intervention prenatally from 24 to 28 weeks' gestation until 4 to 6 weeks' postnatally (Thiele 2017).
Duration of follow‐up corresponded with the duration of the intervention in all but the following studies: Moodley 2015 and Naik 2017 had a follow‐up duration of six months; Wheeler 2016 had a duration of follow‐up of five months, Greer 1981 had a follow‐up of one year; Rueter 2019 had a follow‐up of two and a half years and Roth 2016 had a duration of follow‐up of two years.
Funding sources
All but one study were funded by academic or research institutes or foundations without any industrial ties. One study was funded by a private research foundation which is food industry‐based (Ponnapakkam 2010).
Seven studies had additional partial funding by industry ‐ mainly providing the vitamin D and placebo (Ala‐Houhala 1985; Ala‐Houhala 1986; Greer 1981; Naik 2017; Rueter 2019; Trivedi 2020; Wheeler 2016).
Outcomes
Bone mineral content
Two studies reported this outcome (Greer 1981; Greer 1989), as bone mineral content (mg/cm). Bone mineral content was measured on the distal third of the left ulnar and radius using direct photon absorptiometry.
Vitamin D deficiency
Eleven studies reported the number of infants who had vitamin D insufficiency or deficiency at the end of intervention or follow‐up (Ala‐Houhala 1985; Chandy 2016; Greer 1989; Hollis 2015; Madar 2009; Moodley 2015; Naik 2017; Rueter 2019; Roth 2016; Trivedi 2020; Wheeler 2016). We categorised the studies to those reporting vitamin D insufficiency (defined as 25‐OH vitamin D < 50 nmol/L), or vitamin D deficiency (defined as 25‐OH vitamin D < 30 nmol/L), or both. All except two studies reported both deficiency and insufficiency. Madar 2009 and Rueter 2019 only reported the number of infants with 25‐OH vitamin D levels of < 50 nmol/L.
Nutritional rickets
Five studies reported this outcome (Greer 1981; Naik 2017; Ponnapakkam 2010; Roth 2016; Trivedi 2020). Nutritional rickets were reported as biochemical rickets, radiological rickets or clinical rickets. Greer 1981 reported clinical rickets at one year follow‐up (craniotabes, rachitic rosary or widened wrist) as well as biochemical rickets (serum alkaline phosphatase (ALP), serum calcium and serum phosphate); Naik 2017 reported radiological rickets (X‐ray of both wrists) and biochemical rickets (serum ALP). Ponnapakkam 2010 reported rickets defined as a combination of raised ALP and hand radiographic changes and subclinical rickets as raised ALP alone. Roth 2016 reported both biochemical rickets (raised ALP > 450 mmol/L, with or without serum phosphate and calcium) and radiological rickets (based on X‐rays of wrists and knees). Trivedi 2020 also reported both biochemical rickets (raised ALP) and radiological rickets (X‐rays of both wrists).
Adverse effect in infants and mothers
The main adverse effects in infants reported was hypercalcaemia (serum calcium > 2.62 mmol/L in Chandy 2016; serum calcium > 2.8 mmol/L in Roth 2016 and Wheeler 2016; clinical features in Trivedi 2020). Urinary tract infection was reported by Ponnapakkam 2010. Two studies did not describe the adverse effects measured and only reported "no adverse effects" (Madar 2009; Moodley 2015).
The main adverse effects in mothers reported were hypercalcaemia (serum calcium > 2.6 in Chandy 2016 and Roth 2016; hypercalciuria (urine calcium:creatinine ratio > 0.2 mg/mg in Chandy 2016 and Naik 2017; urine calcium:creatinine ratio mmol/mmol in Roth 2016; urine calcium:creatinine ratio > 0.6 mol/100 mol in Wheeler 2016); and vitamin D toxicity (serum 25‐OH) D > 125 nmol/L in Roth 2016). Maternal serum calcium levels were reported as continuous outcomes in Niramitmahapanya 2017, Rothberg 1982 and Thiele 2017. Maternal urine calcium:creatinine ratios were reported as continuous outcomes in Naik 2017 and Niramitmahapanya 2017.
Fractures and osteomalacia
No studies reported this outcome.
Serum 25‐OH vitamin D levels
All 19 included studies reported serum vitamin D levels at the end of intervention. The vitamin D levels were reported as either ng/mL or nmol/L. In this review, all units were standardised to nmol/L (1 ng/mL = 2.5 nmol/L). All of the vitamin D levels were total vitamin D except one study which reported only vitamin D3 (25‐OH D3) levels (Rothberg 1982). Three studies reported both the total vitamin D and vitamin D3 levels (Greer 1989; Madar 2009; Roth 2016).
Infant growth
Nine studies reported this outcome (Ala‐Houhala 1985; Alonso 2011; Chandy 2016; Greer 1981; Greer 1989; Hollis 2015; Moodley 2015; Roth 2016; Wagner 2006). The measures of growth were reported as weight, length and head circumference at the end of the intervention. In addition, Roth 2016 also reported the z‐score for weight, length and head circumference at the end of the intervention.
Other outcomes not specified in the protocol
Several studies reported serum parathyroid hormone (PTH) levels (Ala‐Houhala 1986; Alonso 2011; Greer 1981; Hollis 2015; Ponnapakkam 2010; Thiele 2017; Wheeler 2016), and breast milk vitamin D or antirachitic level (Niramitmahapanya 2017; Wagner 2006). These outcomes were not analysed in this review.
Excluded studies
We excluded 58 studies after examining the full text or abstract. Ten studies were excluded because they were not RCTs or had inadequate descriptions to determine whether they were RCTs (Bagnoli 2013; Challa 2005; Chan 1982; Kuryaninova 2017; Morris 2017; Onal 2010; Roberts 1981; Savino 2011; Terashita 2017; Zamora 1999). Ten studies were excluded as low birthweight or preterm infants were included (Abdel‐Hady 2019; ACTRN12618001174279; Al‐Beltagi 2020; Backstrom 1999; Delvin 2005; Francis 2018; Hibbs 2018; Kishore 2019; Kolodziejczyk 2017; Salas 2018). Four studies were excluded as the term infants were not breastfed (Grant 2014; Roberfroid 2012), or had a specific disorder (Lara‐Corrales 2013; Norizoe 2014). Three studies compared interventions given to the mother but all the infants also received vitamin D (Bugrul 2013; Czech‐Kowalska 2013; Saadi 2009). Twelve studies had the intervention only given to mothers antenatally and discontinued after delivery (Chawes 2016; Cooper 2016; Diogenes 2013; Baird 2016; Litonjua 2014; Mirghafourvand 2015; Nausheen 2018; NCT02713009; Perumal 2017; Rasmussen 2015; Rostami 2018; Wagner 2013). Sixteen studies were excluded because there was no control group ‐ the intervention was compared to a different dose, regimen or preparation of vitamin D (Basile 2006; Dawudo 2019; Galdo 2018; Gallo 2013b; Gupta 2018; Hollis 2004; Huynh 2015; Ketha 2018; March 2015; O'Callaghan 2018; Oberhelman 2013; Rosendahl 2017; Shakiba 2010; Siafarikas 2011; Tomimoto 2018; Ziegler 2014). One study stopped early due to lack of recruits (ACTRN12613000732785). One study was excluded because the intervention was not vitamin D (Ho 1985). Details of all excluded studies are presented in Characteristics of excluded studies.
Risk of bias in included studies
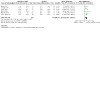
Overall, risk of bias in the included studies was generally low except for blinding, incomplete outcome and selective reporting where there were some studies with high risk of biases. See Figure 2 and Figure 3 for the overall summary.
2.
Risk of bias graph: review authors' judgements about each risk of bias item presented as percentages across all included studies.
3.
Risk of bias summary: review authors' judgements about each risk of bias item for each included study.
Allocation
Random sequence generation and allocation concealment was described in sufficient detail to be judged as having low risk of bias in eight studies (Alonso 2011; Hollis 2015; Naik 2017; Rueter 2019; Roth 2016; Thiele 2017; Trivedi 2020; Wagner 2006). Three studies had clear descriptions of random sequence generation to be judged as having low risk of bias but had no description of the allocation concealment (Chandy 2016; Moodley 2015; Niramitmahapanya 2017). One study did not describe method of randomisation but only the allocation concealment, which was judged to be low risk (Wheeler 2016). Six neither described random sequence generation nor allocation concealment, and thus were judged to be at unclear risk of both biases (Ala‐Houhala 1985; Ala‐Houhala 1986; Greer 1981; Greer 1989; Ponnapakkam 2010; Rothberg 1982). Madar 2009 was a cluster‐RCT with clusters having random sequence generation but patient allocation was not concealed as cluster allocation was known.
Blinding
Twelve studies were judged to have low risk of bias for blinding as participants and outcome assessors were blinded (Chandy 2016; Greer 1981; Greer 1989; Hollis 2015; Madar 2009; Moodley 2015; Rueter 2019; Roth 2016; Thiele 2017; Trivedi 2020; Wagner 2006; Wheeler 2016). Participants were not blinded in five studies (Ala‐Houhala 1985; Ala‐Houhala 1986; Alonso 2011; Ponnapakkam 2010; Rothberg 1982). However, the detection bias in these studies were judged to be low risk as outcomes were unlikely to be affected by lack of blinding except one study (Ponnapakkam 2010), which was judged as unclear because it was not stated if the radiologist reading the X‐rays was blinded. Two studies (Naik 2017; Niramitmahapanya 2017), did not describe the placebo used, however one of the studies (Niramitmahapanya 2017), had outcomes that were unlikely to be affected by lack of blinding and the other (Naik 2017), was judged as having unclear risk of detection bias because it was not stated if the radiologist reading the X‐rays was blinded.
Incomplete outcome data
Eight studies were judged to have low risk of bias for incomplete outcome data (Greer 1981; Greer 1989; Naik 2017; Niramitmahapanya 2017; Roth 2016; Trivedi 2020; Wagner 2006; Wheeler 2016. Seven studies had high attrition rates (Alonso 2011; Chandy 2016; Madar 2009; Moodley 2015; Ponnapakkam 2010; Rueter 2019; Rothberg 1982), and one study stopped the intervention early in one arm (Hollis 2015). These studies were judged as having high risk of bias Three studies were judged as having unclear risk of bias because only the total number of participants with incomplete data was reported (Ala‐Houhala 1985), it was unclear if all participants completed the study (Ala‐Houhala 1986), and participants who did not receive the intervention were excluded even though an intention‐to‐treat analysis was reported (Thiele 2017).
Selective reporting
Four studies were judged to have low risk of bias for selective reporting as the study protocols were available and all prespecified outcomes were reported (Hollis 2015; Naik 2017; Roth 2016; Wheeler 2016). One study was judged as having high risk of selective reporting bias because the outcome of vitamin D deficiency was reported for only one group (Ala‐Houhala 1985). The remaining 14 studies were judged as having unclear risk of bias as the study protocols were unavailable (Ala‐Houhala 1986; Alonso 2011; Chandy 2016; Greer 1981; Greer 1989; Madar 2009; Moodley 2015; Niramitmahapanya 2017; Ponnapakkam 2010; Rueter 2019; Thiele 2017; Trivedi 2020; Wagner 2006), or details incompletely matched the published study (Rueter 2019).
Other potential sources of bias
Eleven studies were judged to have low risk of other potential bias as the baseline characteristics were reported and balanced (Alonso 2011; Chandy 2016; Greer 1989; Hollis 2015; Moodley 2015; Naik 2017; Niramitmahapanya 2017; Rueter 2019; Roth 2016; Wagner 2006; Wheeler 2016). One study was judged to have unclear risk of bias because the subgroup of breastfed infants in the study was not a predetermined subgroup (Madar 2009). Two studies were judged as having unclear risk of bias as there were some baseline differences between the groups but we were unsure about the reasons for this (Thiele 2017; Trivedi 2020). The remaining five studies did not report the baseline characteristics and thus were judged as having unclear risk of bias (Ala‐Houhala 1985; Ala‐Houhala 1986; Greer 1981; Ponnapakkam 2010; Rothberg 1982).
Effects of interventions
See: Table 1; Table 2; Table 3
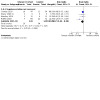
Summary of findings 1. Vitamin D given to infants compared to placebo or no treatment for term breastfed infants to prevent vitamin D deficiency and improve bone health.
| Vitamin D given to infants compared to placebo or no treatment for term breastfed infants to prevent vitamin D deficiency and improve bone health | ||||||
| Patient or population: term breastfed infants to prevent vitamin D deficiency and improve bone health Settings: community Intervention: vitamin D given to infants compared to placebo or no treatment | ||||||
| Outcomes | Anticipated absolute effects* (95% CI) | Relative effect (95% CI) | No of Participants (studies) | Certainty of the evidence (GRADE) | Comments | |
| Risk with placebo or no treatment | Risk with vitaminD given to infants | |||||
| Bone mineral content at the end of intervention mg/cm Photon absorptiometry Follow‐up: 6 months | The mean bone mineral content ranged across control groups from 64 to 101 mg/cm |
The mean bone mineral content at the end of intervention in the intervention groups was 3.93 higher (2.42 lower to 10.27 higher) | 56 (2 studies) | ⊕⊝⊝⊝ very low1,2,3 | ||
| Vitamin D insufficiency: 25‐OH vitamin D < 50 nmol/L Follow‐up: 6 months | 451 per 1000 | 257 per 1000 (185 to 361) | RR 0.57 (0.41 to 0.8) | 274 (4 studies) | ⊕⊕⊝⊝ low1,4 | |
| Vitamin D deficiency: 25‐OH vitamin D < 30 nmol/L Follow‐up: 6 months | 219 per 1000 | 90 per 1000 (35 to 230) | RR 0.41 (0.16 to 1.05) | 122 (2 studies) | ⊕⊝⊝⊝ very low1,3,5 | A single study reported deficiency in high‐risk infants. |
| Nutritional rickets: biochemical Alkaline phosphatase, calcium and phosphate levels. Follow‐up: 3 to 6 months | See comment | See comment | Not estimable | 34 (2 studies) | ⊕⊝⊝⊝ very low1,6 | |
| Adverse effects (hypercalcaemia) Follow‐up: 6 months | 118 per 1000 | 171 per 1000 (64 to 454) | RR 1.45 (0.54 to 3.86) | 98 (1 study) | ⊕⊕⊝⊝ low1,3 | |
| Serum 25‐OH vitamin D level at latest time reported nmol/L Follow‐up: 6 months | The mean serum 25‐OH vitamin D level ranged across control groups from 45.3 to 72.1 nmol/L |
The mean serum 25‐OH vitamin D level at latest time reported to six months of age in the intervention groups was 22.63 higher (17.05 to 28.21 higher) | 356 (7 studies) | ⊕⊕⊝⊝ low1,7 | ||
| *The risk in the intervention group (and its 95% confidence interval) is based on the assumed risk in the comparison group and the relative effect of the intervention (and its 95% CI). CI: Confidence interval; RR: Risk ratio; | ||||||
|
GRADE Working Group grades of evidence
High certainty: we are very confident that the true effect lies close to that of the estimate of the effect. Moderate certainty: we are moderately confident in the effect estimate; the true effect is likely to be close to the estimate of the effect, but there is a possibility that it is substantially different. low‐certainty: our confidence in the effect estimate is limited; the true effect may be substantially different from the estimate of the effect. Very low‐certainty: we have very little confidence in the effect estimate; the true effect is likely to be substantially different from the estimate of effect. | ||||||
1 Downgraded one level for serious risk of bias as no study of good methodology 2 Downgraded one level for serious inconsistency as high level of heterogeneity between studies 3 Downgraded one level for serious uncertainty as wide confidence intervals included the null 4 Downgraded one level for serious indirectness as vitamin D insufficiency may not be predictive of bone health 5 Downgraded one level for serious inconsistency as low level of heterogeneity between studies (risk difference used) 6 Downgraded two levels for very serious uncertainty as no events (analysis underpowered).
7 Downgraded one level for serious indirectness as average vitamin D levels may not be predictive of bone health
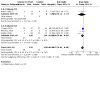
Summary of findings 2. Vitamin D given to lactating mothers compared to placebo or no treatment for term breastfed infants to prevent vitamin D deficiency and improve bone health.
| Vitamin D given to lactating mothers compared to placebo or no treatment for term breastfed infants to prevent vitamin D deficiency and improve bone health | ||||||
| Patient or population: term breastfed infants to prevent vitamin D deficiency and improve bone health Settings: community Intervention: vitamin D given to lactating mothers compared to placebo or no treatment | ||||||
| Outcomes | Anticipated absolute effects* (95% CI) | Relative effect (95% CI) | No of Participants (studies) | Certainty of the evidence (GRADE) | Comments | |
| Risk with placebo or no treatment | Risk with vitaminD given to lactating mothers | |||||
| Vitamin D insufficiency: 25‐OH vitamin D < 50 nmol/L Follow‐up: 6 months | 679 per 1000 | 319 per 1000 (265 to 387) | RR 0.47 (0.39 to 0.57) | 512 (5 studies) | ⊕⊕⊝⊝ low1,2 | Infant risk of vitamin D insufficiency was related to maternal dosage. |
| Vitamin D deficiency: 25‐OH vitamin D < 30 nmol/L Follow‐up: 6 months | 443 per 1000 | 66 per 1000 (40 to 106) | RR 0.15 (0.09 to 0.24) | 512 (5 studies) | ⊕⊕⊝⊝ low1,3 | Infant risk of vitamin D deficiency was related to maternal dosage. |
|
Nutritional rickets ‐ biochemical Alkaline phosphatase, calcium and phosphate levels. Follow‐up: 3 to 6 months |
139 per 1000 | 8 per 1000 (1 to 61) | RR 0.06 (0.01 to 0.44) | 229 (2 studies) | ⊕⊕⊝⊝ low3, 4 | |
| Nutritional rickets ‐ radiological Follow‐up: 6 months | 15 per 1000 | 11 per 1000 (3 to 49) | RR 0.76 (0.18 to 3.31) | 536 (3 studies) | ⊕⊝⊝⊝ very low3,5 | All studies were in higher‐risk populations. |
|
Adverse effects (hypercalcaemia) |
27 per 1000 | 35 per 1000 (14 to 88) | RR 1.31 (0.51 to 3.32) | 557 (3 studies) | ⊕⊕⊝⊝ low5 | |
| Serum 25‐OH vitamin D level at latest time reported nmol/L Follow‐up: 6 months | The mean serum 25‐OH vitamin D level ranged across control groups from 16.075 to 42.475 nmol/L |
The mean serum 25‐OH vitamin D level at latest time reported to six months of age in the intervention groups was 24.60 higher (21.59 to 27.60 higher) | 597 (7 studies) | ⊕⊕⊝⊝ low1, 6, 7 | ||
| *The risk in the intervention group (and its 95% confidence interval) is based on the assumed risk in the comparison group and the relative effect of the intervention (and its 95% CI). CI: Confidence interval; RR: Risk ratio; | ||||||
|
GRADE Working Group grades of evidence
High certainty: we are very confident that the true effect lies close to that of the estimate of the effect. Moderate certainty: we are moderately confident in the effect estimate; the true effect is likely to be close to the estimate of the effect, but there is a possibility that it is substantially different. low‐certainty: our confidence in the effect estimate is limited; the true effect may be substantially different from the estimate of the effect. Very low‐certainty: we have very little confidence in the effect estimate; the true effect is likely to be substantially different from the estimate of effect. | ||||||
1 Downgraded one level for moderate heterogeneity. 2 Downgraded one level for serious indirectness as vitamin D insufficiency may not be predictive of bone health 3 Downgraded one level for serious indirectness as all studies in higher‐risk populations. No studies in lower‐risk populations 4 Downgraded one level for serious risk of bias. One study of good methodology reported no difference
5 Downgraded two levels for very serious uncertainty. Few events and very wide confidence intervals which included the null 6 Downgraded one level for serious indirectness as average vitamin D levels may not be predictive of bone health
7 Heterogeneity may be explained by subgroup (dosage) and sensitivity analysis
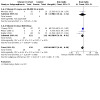
Summary of findings 3. Vitamin D given to infants compared to vitamin D given to lactating mothers for term breastfed infants to prevent vitamin D deficiency and improve bone health.
| Vitamin D given to infants compared to vitamin D given to lactating mothers for term breastfed infants to prevent vitamin D deficiency and improve bone health | ||||||
| Patient or population: term breastfed infants to prevent vitamin D deficiency and improve bone health Settings: community Intervention: vitamin D given to infants compared to vitamin D given to lactating mothers | ||||||
| Outcomes | Anticipated absolute effects* (95% CI) | Relative effect (95% CI) | No of Participants (studies) | Certainty of the evidence (GRADE) | Comments | |
| Risk with vitaminD given to infants | Risk with vitaminD given lactating mothers | |||||
| Vitamin D insufficiency: 25‐OH vitamin D < 50 nmol/L Follow‐up: 6 months | 213 per 1000 | 130 per 1000 (85 to 201) | RR 0.61 (0.40 to 0.94) | 334 (4 studies) | ⊕⊝⊝⊝ very low1,2,3 | |
| Vitamin D deficiency: 25‐OH vitamin D < 30 nmol/L Follow‐up: 6 months | 128 per 1000 | 45 per 1000 (22 to 92) | RR 0.35 (0.17 to 0.72) | 334 (4 studies) | ⊕⊝⊝⊝ very low1,4,5 | |
| Nutritional rickets‐ biochemical Follow‐up: 6 months | See comment | See comment | Not estimable | 92 (1 study) | ⊕⊝⊝⊝ very low1,6 | No events |
|
Adverse effect (hypercalcaemia) Follow‐up: 6 months |
140 per 1000 | 171 per 1000 (67 to 433) | RR 1.22 (0.48 to 3.09) | 97 (1 study) | ⊕⊕⊝⊝ low1,7 | |
|
Serum 25‐OH vitamin D level at latest time reported nmol/L Follow‐up: 6 months |
The mean serum 25‐OH vitamin D level ranged across control groups from 14.0 to 108.5 nmol/L |
The mean serum 25‐OH vitamin D level at latest time reported to six months of age in the intervention groups was 14.35 higher (9.64 to 19.06 higher) | 269 (4 studies) | ⊕⊕⊝⊝ low1,8,9 | ||
| *The risk in the intervention group (and its 95% confidence interval) is based on the assumed risk in the comparison group and the relative effect of the intervention (and its 95% CI). CI: Confidence interval; RR: Risk ratio; | ||||||
|
GRADE Working Group grades of evidence
High certainty: we are very confident that the true effect lies close to that of the estimate of the effect. Moderate certainty: we are moderately confident in the effect estimate; the true effect is likely to be close to the estimate of the effect, but there is a possibility that it is substantially different. low‐certainty: our confidence in the effect estimate is limited; the true effect may be substantially different from the estimate of the effect. Very low‐certainty: we have very little confidence in the effect estimate; the true effect is likely to be substantially different from the estimate of effect. | ||||||
1 Downgraded one level for serious risk of bias as no study of good methodology. 2 Downgraded one level for serious inconsistency as moderate level of heterogeneity between studies. 3 Downgraded one level for serious indirectness as vitamin D insufficiency may not be predictive of bone health. 4 Downgraded one level for serious inconsistency as high level of heterogeneity between studies. 5 Downgraded one level for serious uncertainty as wide confidence intervals include null effect in random effects model. 6 Downgraded two levels for serious uncertainty. No events. 7 Downgraded one level for serious uncertainty. Very wide confidence intervals include null effect. 8 Downgraded one level for serious indirectness as average vitamin D levels may not be predictive of bone health.
9 Heterogeneity may be explained by subgroup (dosage) analysis.
Comparison 1: vitamin D given to infants versus placebo or no treatment
Nine studies contributed to this comparison (Alonso 2011; Chandy 2016; Greer 1981; Greer 1989; Madar 2009; Moodley 2015; Ponnapakkam 2010; Rueter 2019; Rothberg 1982), with a total of 743 mother‐infant pairs.
Bone mineral density/content at the end of intervention (mg/cm)
No study reported bone mineral density. There was no difference in the bone mineral content (Analysis 1.1), between the group of infants given vitamin D and the placebo group (MD 3.93 mg/cm, 95% CI ‐2.42 to 10.27; participants = 56; studies = 2; I2 = 94%; very low‐certainty evidence). We downgraded the certainty of evidence for risk of bias, inconsistency and imprecision. Studies reported effects in opposite directions.
1.1. Analysis.
Comparison 1: Vitamin D given to infants compared to placebo or no treatment, Outcome 1: Bone mineral content at the end of intervention
Subgroup analyses (Analysis 4.1): both studies (Greer 1981; Greer 1989), compared oral D3 400 IU/day in low‐risk infants from birth for three to six months. Greer 1981reported an increase in bone mineral content (MD 15.00 mg/cm, 95% CI 6.68 to 23.32; participants = 18), whereas Greer 1989 reported a decrease in bone mineral content (MD ‐11.50 mg/cm, 95% CI ‐21.32 to ‐1.68; participants = 38).
4.1. Analysis.
Comparison 4: Vitamin D given to infants compared to placebo or no treatment: subgroup and sensitivity analyses, Outcome 1: Bone mineral content at the end of intervention: subgroup analysis
Sensitivity analysis (Analysis 4.2): neither study had good methodology.
4.2. Analysis.
Comparison 4: Vitamin D given to infants compared to placebo or no treatment: subgroup and sensitivity analyses, Outcome 2: Bone mineral content at the end of intervention: sensitivity analysis
Vitamin D insufficiency (25‐OH vitamin D < 50 nmol/L)
There was a reduction in the risk of vitamin D insufficiency (Analysis 1.2) in infants given vitamin D (RR 0.57, 95% CI 0.41 to 0.80; participants = 274; studies = 4; Iò = 42%; low‐certainty evidence). We downgraded the certainty of evidence for bias and indirectness as vitamin D insufficiency may not be predictive of bone health.
1.2. Analysis.
Comparison 1: Vitamin D given to infants compared to placebo or no treatment, Outcome 2: Vitamin D insufficiency: 25‐OH vitamin D < 50 nmol/L
Subgroup analyses:
Infant risk (Analysis 4.3): there was a reduction in vitamin D insufficiency in high‐risk infants (RR 0.65, 95% CI 0.46 to 0.94; participants = 134; studies = 3; Iò = 0%) and lower‐risk infants (RR 0.19, 95% CI 0.07 to 0.53; participants = 140; studies = 1). The test for subgroup differences was significant (P = 0.03, Iò = 79.9%).
Season of supplementation (Analysis 4.4): all studies had non‐seasonal supplementation.
D2 versus D3 supplementation (Analysis 4.5): a single study reported no difference in vitamin D insufficiency with D2 supplementation (RR 0.50, 95% CI 0.14 to 1.77; participants = 12), whereas there was reduction with D3 supplementation (RR 0.58, 95% CI 0.40 to 0.82; participants = 262; studies = 3; Iò = 61%). The test for subgroup differences was not significant (P = 0.83, Iò = 0%).
Dosage (Analysis 4.6): a single study giving a single oral vitamin D dose of 50,000 IU at birth reported no difference in vitamin D insufficiency (RR 0.61, 95% CI 0.24 to 1.54; participants = 211), whereas there was a reduction in vitamin D insufficiency using 400 IU/day (RR 0.56, 95% CI 0.39 to 0.81; participants = 253; studies = 3; Iò = 61%). The test for subgroup differences was not significant (P = 0.89, Iò = 0%).
Duration of supplementation (Analysis 4.7): test for subgroup differences was not significant (P = 0.97, Iò = 0%). Most data related to supplementation for ≥ six months.
Timing of commencement (Analysis 4.8): all studies commenced vitamin D supplementation at birth.
4.3. Analysis.
Comparison 4: Vitamin D given to infants compared to placebo or no treatment: subgroup and sensitivity analyses, Outcome 3: Vitamin D insufficiency (25‐OH vitamin D < 50 nmol/L): infant risk
4.4. Analysis.
Comparison 4: Vitamin D given to infants compared to placebo or no treatment: subgroup and sensitivity analyses, Outcome 4: Vitamin D insufficiency (25‐OH vitamin D < 50 nmol/L): season of supplementation
4.5. Analysis.
Comparison 4: Vitamin D given to infants compared to placebo or no treatment: subgroup and sensitivity analyses, Outcome 5: Vitamin D insufficiency (25‐OH vitamin D < 50 nmol/L): D2 versus D3
4.6. Analysis.
Comparison 4: Vitamin D given to infants compared to placebo or no treatment: subgroup and sensitivity analyses, Outcome 6: Vitamin D insufficiency: 25‐OH vitamin D < 50 nmol/L: dosage
4.7. Analysis.
Comparison 4: Vitamin D given to infants compared to placebo or no treatment: subgroup and sensitivity analyses, Outcome 7: Vitamin D insufficiency (25‐OH vitamin D < 50 nmol/L): duration of supplementation
4.8. Analysis.
Comparison 4: Vitamin D given to infants compared to placebo or no treatment: subgroup and sensitivity analyses, Outcome 8: Vitamin D insufficiency (25‐OH vitamin D < 50 nmol/L): timing of commencement
Sensitivity analysis (Analysis 4.9): no study had good methodology.
4.9. Analysis.
Comparison 4: Vitamin D given to infants compared to placebo or no treatment: subgroup and sensitivity analyses, Outcome 9: Vitamin D insufficiency (25‐OH vitamin D < 50 nmol/L): sensitivity analysis
Vitamin D deficiency (25‐OH vitamin D < 30 nmol/L)
There was no difference in vitamin D deficiency (Analysis 1.3) in infants given vitamin D (RR 0.41, 95% CI 0.16 to 1.05; participants = 122; studies = 2; Iò = 0%; very low‐certainty evidence). We downgraded the certainty of evidence for risk of bias and high level of imprecision. One study (Chandy 2016), in high‐risk infants of D3 400 IU/day, reported no difference in vitamin D deficiency (RR 0.41, 95% CI 0.16 to 1.05; participants = 101), whereas the other small study (Moodley 2015), of vitamin D given as a single oral 50,000 IU dose at birth in high‐risk infants, reported no events. Neither study had good methodology (Analysis 4.16). Subgroup analyses were not reported as there were insufficient studies.
1.3. Analysis.
Comparison 1: Vitamin D given to infants compared to placebo or no treatment, Outcome 3: Vitamin D deficiency: 25‐OH vitamin D < 30 nmol/L
4.16. Analysis.
Comparison 4: Vitamin D given to infants compared to placebo or no treatment: subgroup and sensitivity analyses, Outcome 16: Vitamin D deficiency: 25‐OH vitamin D < 30 nmol/L: sensitivity analysis
Nutritional rickets
Two small studies (Greer 1981; Ponnapakkam 2010) in low‐risk infants reported no infant with biochemical rickets (Analysis 1.4; Analysis 4.17; participants = 34; studies = 2; very low‐certainty evidence). We downgraded the certainty of evidence as there were no events and the analysis was seriously underpowered. Neither study had good methodology (Analysis 4.18).
1.4. Analysis.
Comparison 1: Vitamin D given to infants compared to placebo or no treatment, Outcome 4: Nutritional rickets: biochemical
4.17. Analysis.
Comparison 4: Vitamin D given to infants compared to placebo or no treatment: subgroup and sensitivity analyses, Outcome 17: Nutritional rickets: biochemical: subgroup analysis
4.18. Analysis.
Comparison 4: Vitamin D given to infants compared to placebo or no treatment: subgroup and sensitivity analyses, Outcome 18: Nutritional rickets: biochemical: sensitivity analysis
Another study (Rothberg 1982), reported "no infant had clinical or biochemical sequelae of low serum 25‐OH D values during the immediate neonatal period". However, the duration of follow‐up was only up to six weeks in this study which was too short for biochemical rickets to develop so the study was not included in this outcome. No study comparison reported radiological rickets.
Adverse effects
A single study (Chandy 2016) in high‐risk infants having vitamin D3 400 IU/day reported hypercalcaemia (RR 1.45, 95% CI 0.54 to 3.86; participants = 98; low‐certainty evidence). We downgraded the certainty of evidence for risk of bias and imprecision. The study did not have good methodology.
Lowest serum 25‐OH vitamin D level up to six months of age
No study reported this outcome.
Serum 25‐OH vitamin D level (nmol/L) at latest time reported during treatment to six months of age
The 25‐OH vitamin D level was higher in infants receiving vitamin D compared to placebo (Analysis 1.7; MD 22.63 nmol/L, 95% CI 17.05 to 28.21; participants = 334; studies = 6; I2 = 0%; low‐certainty evidence). We downgraded the certainty of evidence due to risk of bias and indirectness as average 25‐OH vitamin D levels may not predict deficiency or bone health.
1.7. Analysis.
Comparison 1: Vitamin D given to infants compared to placebo or no treatment, Outcome 7: Serum 25‐OH vitamin D level at latest time reported to six months of age
Subgroup analyses:
Infant risk (Analysis 4.20): 25‐OH vitamin D levels were higher in infants receiving vitamin D compared to placebo in high‐risk infants (MD 18.24 nmol/L, 95% CI 9.39 to 27.09; participants = 134; studies = 3; I2 = 0%) and low‐risk infants (MD 25.53 nmol/L, 95% CI 18.34 to 32.72; participants = 200; studies = 3; I2 = 0%). The test for subgroup differences was not significant (P = 0.21, Iò = 36.2%).
Season of supplementation (Analysis 4.21): all studies had non‐seasonal supplementation.
D2 versus D3 supplementation (Analysis 4.22): both D2 (MD 33.00 nmol/L, 95% CI 17.27 to 48.73; participants = 50; studies = 2; I2 = 0%) and D3 (MD 21.14 nmol/L, 95% CI 15.17 to 27.11; participants = 284; studies = 4; I2 = 0%) supplementation were associated with higher 25‐OH vitamin D levels. The test for subgroup differences was not significant (P = 0.17, Iò = 47.6%).
Dosage (Analysis 4.23): both a single study (Moodley 2015), giving a single oral vitamin D dose of 50,000 IU at birth (MD 22.75 nmol/L, 95% CI 3.43 to 42.07; participants = 21) and five studies giving 400 IU/day (MD 22.62 nmol/L, 95% CI 16.79 to 28.45; participants = 313; studies = 5; I2 = 0%) reported increased 25‐OH vitamin D levels. The test for subgroup differences was not significant (P = 0.99, Iò = 0%).
Duration of supplementation (Analysis 4.24): analysis of increasing duration of supplementation found an increase in 25‐OH levels from a single oral dose of vitamin D of 50,000 IU at birth (MD 22.75 nmol/L, 95% CI 3.43 to 42.07; participants = 21); no difference for 1 to 2 months supplementation (MD 30.30 nmol/L, 95% CI ‐6.51 to 67.11; participants = 12); and an increase for 4 to 6 months supplementation (MD 33.60 nmol/L, 95% CI 16.20 to 51.00; participants = 38); and > 6 months supplementation (MD 20.97 nmol/L, 95% CI 14.69 to 27.24; participants = 263; studies = 3; I2 = 0%). However, the test for subgroup differences was not significant (P = 0.58, Iò = 0%).
Timing of commencement (Analysis 4.25): both supplementation from birth (MD 20.97 nmol/L, 95% CI 12.90 to 29.04; participants = 160; studies = 3; I2 = 32%) and 1 month of age (MD 21.23 nmol/L, 95% CI 15.04 to 27.42; participants = 275; studies = 4; I2 = 0%) increased vitamin 25‐OH to a similar extent. The test for subgroup differences was not significant (P = 0.96, Iò = 0%).
4.20. Analysis.
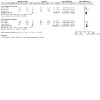
Comparison 4: Vitamin D given to infants compared to placebo or no treatment: subgroup and sensitivity analyses, Outcome 20: Serum 25‐OH vitamin D level at latest time reported to six months of age: infant risk
4.21. Analysis.
Comparison 4: Vitamin D given to infants compared to placebo or no treatment: subgroup and sensitivity analyses, Outcome 21: Serum 25‐OH vitamin D level at latest time reported to six months of age: season of supplementation
4.22. Analysis.
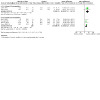
Comparison 4: Vitamin D given to infants compared to placebo or no treatment: subgroup and sensitivity analyses, Outcome 22: Serum 25‐OH vitamin D level at latest time reported to six months of age: D2 versus D3
4.23. Analysis.
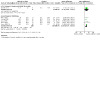
Comparison 4: Vitamin D given to infants compared to placebo or no treatment: subgroup and sensitivity analyses, Outcome 23: Serum 25‐OH vitamin D level at latest time reported to six months of age: dosage
4.24. Analysis.
Comparison 4: Vitamin D given to infants compared to placebo or no treatment: subgroup and sensitivity analyses, Outcome 24: Serum 25‐OH vitamin D level at latest time reported to six months of age: duration of supplementation
4.25. Analysis.
Comparison 4: Vitamin D given to infants compared to placebo or no treatment: subgroup and sensitivity analyses, Outcome 25: Serum 25‐OH vitamin D level at latest time reported to six months of age: timing of commencement
Sensitivity analysis (Analysis 4.26): no study had good methodology.
4.26. Analysis.
Comparison 4: Vitamin D given to infants compared to placebo or no treatment: subgroup and sensitivity analyses, Outcome 26: Serum 25‐OH vitamin D level at latest time reported to six months of age: sensitivity analysis
Fracture (radiologically confirmed)
No study reported this outcome.
Osteomalacia ‐ low bone mineral density reported on x‐ray
No study reported this outcome.
Change of standardised growth at latest time measured (change in weight, length and head circumference z score)
No study reported this outcome.
Size at latest time measured
There was no difference in weight (Analysis 1.8; MD 123.63 g, 95% CI ‐170.02 to 417.28; participants = 143; studies = 2; Iò = 4%), length (Analysis 1.9; MD 0.73 cm, 95% CI ‐0.11 to 1.57; participants = 156; studies = 3; Iò = 55%), or head circumference (Analysis 1.10; MD 0.00 cm, 95% CI ‐0.60 to 0.60; participants = 105; studies = 1) of infants given vitamin D compared to a placebo group.
1.8. Analysis.
Comparison 1: Vitamin D given to infants compared to placebo or no treatment, Outcome 8: Size at latest time measured: weight
1.9. Analysis.
Comparison 1: Vitamin D given to infants compared to placebo or no treatment, Outcome 9: Size at latest time measured: length
1.10. Analysis.
Comparison 1: Vitamin D given to infants compared to placebo or no treatment, Outcome 10: Size at latest time measured: head circumference
Comparison 2: vitamin D given to lactating mothers versus placebo or no treatment
Eight studies contributed to this comparison (Chandy 2016; Naik 2017; Niramitmahapanya 2017; Roth 2016; Rothberg 1982; Thiele 2017; Trivedi 2020; Wheeler 2016), with a total of 1907 mother‐infant pairs.
Bone mineral density/content at the end of intervention
No study reported this outcome.
Vitamin D insufficiency (25‐OH vitamin D < 50nmol/L)
There was a reduction in vitamin D insufficiency (Analysis 2.1), in infants of mothers given vitamin D (RR 0.47, 95% CI 0.39 to 0.57; participants = 512; studies = 5; Iò = 79%; low‐certainty evidence). We downgraded the certainty of evidence for risk of bias and indirectness as vitamin D insufficiency may not be predictive of bone health, and all studies were in higher‐risk populations.
2.1. Analysis.
Comparison 2: Vitamin D given to lactating mothers compared to placebo or no treatment, Outcome 1: Vitamin D insufficiency: 25‐OH vitamin D < 50 nmol/L
Subgroup analysis
Infant risk (Analysis 5.1): all studies were in higher‐risk populations.
Season of supplementation (Analysis 5.2): all studies were non‐seasonal.
D2 versus D3 supplementation (Analysis 5.3): all studies used oral D3.
Dosage (Analysis 5.4): there was a significant effect of maternal dosage with a reduction in infant vitamin D insufficiency for dosages of 400 to 2000 IU/day (RR 0.71, 95% CI 0.49 to 1.03; participants = 186; studies = 2; Iò = 0%); > 2000 to 4000 IU/day (RR 0.43, 95% CI 0.34 to 0.56; participants = 216; studies = 2; Iò = 94%); and > 4000 IU/day (RR 0.33, 95% CI 0.20 to 0.53; participants = 110; studies = 1). The test for subgroup differences was significant (P = 0.02, Iò = 73.4%).
Duration of supplementation (Analysis 5.5): the relationship between duration of maternal supplementation and infant vitamin D insufficiency is unclear. There was a reduction in infant vitamin D insufficiency with supplementation for < 1 month (RR 0.33, 95% CI 0.20 to 0.53; participants = 110; studies = 1); 1 to 3 months (RR 0.61, 95% CI 0.49 to 0.75; participants = 114; studies = 1); 4 to 6 months (RR 0.28, 95% CI 0.15 to 0.53; participants = 183; studies = 2; Iò = 91%); and > 6 months (RR 0.66, 95% CI 0.44 to 0.99; participants = 105; studies = 1). The test for subgroup differences was significant (P = 0.02, Iò = 70.8%), but the trend in effect was not clear from the data.
Timing of commencement (Analysis 5.6): maternal supplementation from birth was associated with a reduction in infant vitamin D insufficiency (RR 0.45, 95% CI 0.37 to 0.55; participants = 431; studies = 4; Iò = 85%), but not with supplementation after 1 month age (RR 0.88, 95% CI 0.40 to 1.94; participants = 81; studies = 1). However, the test for subgroup differences was not significant (P = 0.11, Iò = 61.2%).
5.1. Analysis.
Comparison 5: Vitamin D given to lactating mothers compared to placebo or no treatment: subgroup and sensitivity analyses, Outcome 1: Vitamin D insufficiency (25‐OH vitamin D < 50 nmol/L): infant risk
5.2. Analysis.
Comparison 5: Vitamin D given to lactating mothers compared to placebo or no treatment: subgroup and sensitivity analyses, Outcome 2: Vitamin D insufficiency (25‐OH vitamin D < 50 nmol/L): season of supplementation
5.3. Analysis.

Comparison 5: Vitamin D given to lactating mothers compared to placebo or no treatment: subgroup and sensitivity analyses, Outcome 3: Vitamin D insufficiency (25‐OH vitamin D < 50 nmol/L): D2 versus D3
5.4. Analysis.
Comparison 5: Vitamin D given to lactating mothers compared to placebo or no treatment: subgroup and sensitivity analyses, Outcome 4: Vitamin D insufficiency (25‐OH vitamin D < 50 nmol/L): dosage
5.5. Analysis.
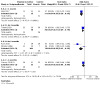
Comparison 5: Vitamin D given to lactating mothers compared to placebo or no treatment: subgroup and sensitivity analyses, Outcome 5: Vitamin D insufficiency (25‐OH vitamin D < 50 nmol/L): duration of supplementation
5.6. Analysis.
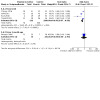
Comparison 5: Vitamin D given to lactating mothers compared to placebo or no treatment: subgroup and sensitivity analyses, Outcome 6: Vitamin D insufficiency (25‐OH vitamin D < 50 nmol/L): timing of commencement
Sensitivity analysis (Analysis 5.7): there was a reduction in vitamin D insufficiency in studies of good methodology (RR 0.43, 95% CI 0.34 to 0.56; participants = 216; studies = 2; Iò = 94%).
5.7. Analysis.
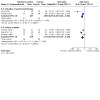
Comparison 5: Vitamin D given to lactating mothers compared to placebo or no treatment: subgroup and sensitivity analyses, Outcome 7: Vitamin D insufficiency (25‐OH vitamin D < 50 nmol/L): sensitivity analysis
Vitamin D deficiency (25‐OH vitamin D < 30 nmol/L)
There was a reduction in vitamin D deficiency (Analysis 2.2), in infants of mothers given vitamin D (RR 0.15, 95% CI 0.09 to 0.24; participants = 512; studies = 5; I2 = 66%; low‐certainty evidence). We downgraded the certainty of evidence for risk of bias and indirectness as all studies were in higher‐risk populations and none in lower‐risk populations.
2.2. Analysis.
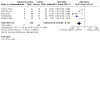
Comparison 2: Vitamin D given to lactating mothers compared to placebo or no treatment, Outcome 2: Vitamin D deficiency: 25‐OH vitamin D < 30 nmol/L
Subgroup analysis
Infant risk (Analysis 5.8): all studies were in higher‐risk populations.
Season of supplementation (Analysis 5.9): all studies were non‐seasonal.
D2 versus D3 supplementation (Analysis 5.10): all studies used oral D3.
Dosage (Analysis 5.11): there was a significant effect of maternal dosage with reductions in infant vitamin D deficiency for dosages of 400 to 2000 IU/day (RR 0.40, 95% CI 0.20 to 0.81; participants = 186; studies = 2; Iò = 0%); > 2000 to 4000 IU/day (RR 0.43, 95% CI 0.34 to 0.56; participants = 216; studies = 2; Iò = 94%); and > 4000 IU/day (RR 0.17, 95% CI 0.06 to 0.46; participants = 110; studies = 1). The test for subgroup differences was significant (P = 0.006, Iò = 80.4%).
Duration of supplementation (Analysis 5.12): the relationship between duration of maternal supplementation and infant vitamin D deficiency is unclear. There was a reduction in infant vitamin D deficiency with supplementation for < 1 month (RR 0.17, 95% CI 0.06 to 0.46; participants = 110; studies = 1); 1 to 3 months (RR 0.06, 95% CI 0.0.2 to 0.17; participants = 114; studies = 1); and 4 to 6 months (RR 0.15, 95% CI 0.05 to 0.45; participants = 183; studies = 2; Iò= 59%); and no difference for > 6 months (RR 0.45, 95% CI 0.19 to 1.09; participants = 105; studies = 1). The test for subgroup differences was significant (P = 0.04, Iò = 65.1%), but the trend in effect was not clear from the data.
Timing of commencement (Analysis 5.13): maternal supplementation from birth was associated with a reduction in infant vitamin D deficiency (RR 0.45, 95% CI 0.37 to 0.55; participants = 431; studies = 4; Iò = 85%), but not supplementation after 1 month age (RR 0.32, 95% CI 0.10 to 1.02; participants = 81; studies = 1). However, the test for subgroup differences was not significant (P = 0.11, Iò = 61.2%).
5.8. Analysis.
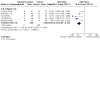
Comparison 5: Vitamin D given to lactating mothers compared to placebo or no treatment: subgroup and sensitivity analyses, Outcome 8: Vitamin D deficiency: 25‐OH vitamin D < 30 nmol/L: infant risk
5.9. Analysis.
Comparison 5: Vitamin D given to lactating mothers compared to placebo or no treatment: subgroup and sensitivity analyses, Outcome 9: Vitamin D deficiency: 25‐OH vitamin D < 30 nmol/L: season of supplementation
5.10. Analysis.
Comparison 5: Vitamin D given to lactating mothers compared to placebo or no treatment: subgroup and sensitivity analyses, Outcome 10: Vitamin D deficiency: 25‐OH vitamin D < 30 nmol/L: D2 versus D3
5.11. Analysis.
Comparison 5: Vitamin D given to lactating mothers compared to placebo or no treatment: subgroup and sensitivity analyses, Outcome 11: Vitamin D deficiency: 25‐OH vitamin D < 30 nmol/L: dosage
5.12. Analysis.
Comparison 5: Vitamin D given to lactating mothers compared to placebo or no treatment: subgroup and sensitivity analyses, Outcome 12: Vitamin D deficiency: 25‐OH vitamin D < 30 nmol/L: duration of supplementation
5.13. Analysis.
Comparison 5: Vitamin D given to lactating mothers compared to placebo or no treatment: subgroup and sensitivity analyses, Outcome 13: Vitamin D deficiency: 25‐OH vitamin D < 30 nmol/L: timing of commencement
Sensitivity analysis (Analysis 5.14): there was a reduction in vitamin D deficiency in studies of good methodology (RR 0.05, 95% CI 0.02 to 0.15; participants = 216; studies = 2; Iò = 0%).
5.14. Analysis.
Comparison 5: Vitamin D given to lactating mothers compared to placebo or no treatment: subgroup and sensitivity analyses, Outcome 14: Vitamin D deficiency: 25‐OH vitamin D < 30 nmol/L: sensitivity analysis
Nutritional rickets
There was a reduction in biochemical rickets (Analysis 2.3), in infants of mothers given vitamin D (RR 0.06, 95% CI 0.01 to 0.44, 2 studies, 229 participants, Iò =0%, low‐certainty evidence). We downgraded the certainty of evidence for risk of bias and indirectness as all studies were in higher‐risk populations.
2.3. Analysis.
Comparison 2: Vitamin D given to lactating mothers compared to placebo or no treatment, Outcome 3: Nutritional rickets: biochemical
Subgroup analysis (Analysis 5.15): one study (Naik 2017), in higher‐risk infants that supplemented mothers with oral D3 60,000 IU/day for 10 days, reported a reduction in biochemical rickets (RR 0.05, 95% CI 0.00 to 0.84; participants = 115). The other study (Trivedi 2020), in higher‐risk infants supplemented mothers with oral D3 60,000 IU postpartum and at 6, 10, and 14 weeks and reported no difference in biochemical rickets (RR 0.16, 95% CI 0.02 to 1.29; participants = 114). However, the test for subgroup differences was not significant (P = 0.51, Iò = 0%).
5.15. Analysis.
Comparison 5: Vitamin D given to lactating mothers compared to placebo or no treatment: subgroup and sensitivity analyses, Outcome 15: Nutritional rickets: biochemical: subgroup analyses
Sensitivity analysis (Analysis 5.16): one study of good methodology (Trivedi 2020), reported no difference in biochemical rickets (RR 0.16, 95% CI 0.02 to 1.29; participants = 114).
5.16. Analysis.
Comparison 5: Vitamin D given to lactating mothers compared to placebo or no treatment: subgroup and sensitivity analyses, Outcome 16: Nutritional rickets: biochemical: sensitivity analysis
There was no difference in radiological rickets (Analysis 2.4), in infants of mothers given vitamin D (RR 0.76, 95% CI 0.18 to 3.31; participants = 536; studies = 3; I2 = 0%, low‐certainty evidence). We downgraded the certainty of evidence for indirectness and very serious imprecision. All studies were in higher‐risk populations.
2.4. Analysis.
Comparison 2: Vitamin D given to lactating mothers compared to placebo or no treatment, Outcome 4: Nutritional rickets: radiological
Subgroup analyses
Infant risk (Analysis 5.17): all studies were in high‐risk populations.
Season of supplementation (Analysis 5.18): all studies were non‐seasonal.
D2 versus D3 supplementation (Analysis 5.19): all studies used oral vitamin D3.
Dosage (Analysis 5.20): there was no difference in radiological rickets in infants of mothers supplemented with > 2000 to 4000 IU/day (RR 0.48, 95% CI 0.05 to 5.18; participants = 421; studies = 2; Iò = 0%); or > 4000 IU/day (RR 1.05, 95% CI 0.15 to 7.23; participants = 115; studies = 1). The test for subgroup differences was not significant (P = 0.62, Iò = 0%).
Duration of supplementation (Analysis 5.21): there was no difference in radiological rickets in infants of mothers supplemented for < 1 month (RR 1.05, 95% CI 0.15 to 7.23; participants = 115; studies = 1); or 4 to 6 months (RR 0.48, 95% CI 0.05 to 5.18; participants = 421; studies = 2; Iò = 0%). The test for subgroup differences was not significant (P = 0.62, Iò = 0%).
Timing of commencement (Analysis 5.22): all studies supplemented mothers from birth.
5.17. Analysis.
Comparison 5: Vitamin D given to lactating mothers compared to placebo or no treatment: subgroup and sensitivity analyses, Outcome 17: Nutritional rickets: radiological: infant risk
5.18. Analysis.
Comparison 5: Vitamin D given to lactating mothers compared to placebo or no treatment: subgroup and sensitivity analyses, Outcome 18: Nutritional rickets: radiological: season of supplementation
5.19. Analysis.

Comparison 5: Vitamin D given to lactating mothers compared to placebo or no treatment: subgroup and sensitivity analyses, Outcome 19: Nutritional rickets: radiological: D2 versus D3
5.20. Analysis.
Comparison 5: Vitamin D given to lactating mothers compared to placebo or no treatment: subgroup and sensitivity analyses, Outcome 20: Nutritional rickets: radiological: dosage
5.21. Analysis.
Comparison 5: Vitamin D given to lactating mothers compared to placebo or no treatment: subgroup and sensitivity analyses, Outcome 21: Nutritional rickets: radiological: duration of supplementation
5.22. Analysis.

Comparison 5: Vitamin D given to lactating mothers compared to placebo or no treatment: subgroup and sensitivity analyses, Outcome 22: Nutritional rickets: radiological: timing of commencement
Sensitivity analysis (Analysis 5.23): there was no difference in radiological rickets in studies of good methodology (RR 0.48, 95% CI 0.05 to 5.18; participants = 421; studies = 2; Iò = 0%).
5.23. Analysis.
Comparison 5: Vitamin D given to lactating mothers compared to placebo or no treatment: subgroup and sensitivity analyses, Outcome 23: Nutritional rickets: radiological: sensitivity analysis
Adverse effects
There was no difference in hypercalcaemia (Analysis 2.5) in infants of mothers given vitamin D (RR 1.31, 95% CI 0.51 to 3.32; participants = 557; studies = 3; Iò = 0%, low‐certainty evidence). We downgraded the certainty of evidence for very serious imprecision.
2.5. Analysis.
Comparison 2: Vitamin D given to lactating mothers compared to placebo or no treatment, Outcome 5: Adverse effects (hypercalcaemia)
Subgroup analysis (Analysis 5.24): no difference in hypercalcaemia was reported in one study (Chandy 2016), of maternal oral D3 120 000 IU within 7 days of delivery, then 1.5, 2.5 and 3.5 months, then monthly until 9 months (equivalent to D3 890 IU/day) (RR 1.19, 95% CI 0.43 to 3.29; participants = 101); or a study (Roth 2016), of oral D3 4000 IU/day till 26 weeks (RR 1.99, 95% CI 0.18 to 21.75; participants = 371). A study (Wheeler 2016), of oral D3 50 000 IU monthly from 4 weeks to 16 weeks (equivalent to D3 1670 IU/day) reported no infant with hypercalcaemia (n = 85).
5.24. Analysis.
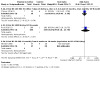
Comparison 5: Vitamin D given to lactating mothers compared to placebo or no treatment: subgroup and sensitivity analyses, Outcome 24: Adverse effects (hypercalcaemia): subgroup analyses
Sensitivity analysis (Analysis 5.25): a single study of good methodology (Roth 2016), reported no difference in hypercalcaemia (RR 1.99, 95% CI 0.18 to 21.75; participants = 371).
5.25. Analysis.
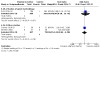
Comparison 5: Vitamin D given to lactating mothers compared to placebo or no treatment: subgroup and sensitivity analyses, Outcome 25: Adverse effects (hypercalcaemia): sensitivity analysis
Lowest serum 25‐OH vitamin D level (nmol/L) up to six months of age
No study reported this outcome.
Serum 25‐OH vitamin D level (nmol/L) at latest time reported during treatment to six months of age
The 25‐OH vitamin D level was higher in infants of mothers receiving vitamin D compared to placebo (Analysis 2.7; (MD 24.60 nmol/L, 95% CI 21.59 to 27.60; participants = 597; studies = 7; I2 = 64%; low‐certainty evidence). We downgraded the certainty of evidence for indirectness as average 25‐OH vitamin D levels may not be predictive of bone health and moderate heterogeneity. Inconsistency (heterogeneity) may be explained by differences in dosage (Analysis 5.29).
2.7. Analysis.
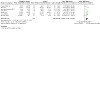
Comparison 2: Vitamin D given to lactating mothers compared to placebo or no treatment, Outcome 7: Serum 25‐OH vitamin D level at latest time reported to six months of age
5.29. Analysis.
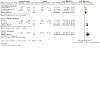
Comparison 5: Vitamin D given to lactating mothers compared to placebo or no treatment: subgroup and sensitivity analyses, Outcome 29: Serum 25‐OH vitamin D level at latest time reported to six months of age: dosage
Subgroup analyses
Infant risk (Analysis 5.26): 25‐OH vitamin D levels were higher in infants receiving vitamin D compared to placebo in high‐risk infants (MD 26.87 nmol/L, 95% CI 23.45 to 30.29; participants = 516; studies = 5; I2 = 55%); and low‐risk infants (MD 17.01 nmol/L, 95% CI 10.76 to 23.26; participants = 81; studies = 2; I2 = 0%). The test for subgroup differences was significant (P = 0.007, Iò = 86.4%).
Season of supplementation (Analysis 5.27): all studies were non‐seasonal.
D2 versus D3 supplementation (Analysis 5.28): all studies supplemented mothers with oral D3.
Dosage (Analysis 5.29): the 25‐OH vitamin D level was higher in infants of mothers receiving higher doses of vitamin D. Analysis of studies supplementing mothers with oral D3 400 to 2000 IU/day reported a MD 15.61 nmol/L, 95% CI 9.83 to 21.39; participants = 258; studies = 3; I2 = 0%; studies with supplements > 2000 to 4000 IU/day reported a MD 27.58 nmol/L, 95% CI 23.97 to 31.19; participants = 229; studies = 3; I2 = 35%; and a study with supplements > 4000 IU/day reported a MD 33.65 nmol/L, 95% CI 18.49 to 48.81; participants = 110; studies = 1. The test for subgroup differences was significant (P = 0.001; Iò = 84.9%).
Duration of supplementation (Analysis 5.30): the relationship between duration of maternal supplementation and infant 25‐OH vitamin D levels is unclear. There was an increase in infant 25‐OH vitamin D levels with supplementation for < 1 month (MD 33.65 nmol/L, 95% CI 18.49 to 48.81; participants = 110; studies = 1); 1 to 3 months (MD 17.01 nmol/L, 95% CI 10.76 to 23.26; participants = 81; studies = 2; I2 = 0%); 4 to 6 months (MD 27.78 nmol/L, 95% CI 24.07 to 31.49; participants = 301; studies = 3; I2 = 46%); and > 6 months (MD 15.50 nmol/L, 95% CI 4.62 to 26.38; participants = 105; studies = 1). The test for subgroup differences was significant (P = 0.006; Iò = 76.1%), but the trend in effect was not clear from the data.
Timing of commencement (Analysis 5.31): analysis found that studies supplementing mothers from birth increased the infant 25‐OH vitamin D level (MD 24.85 nmol/L, 95% CI 21.82 to 27.88; participants = 512; studies = 6; I2 = 67%), whereas a single study supplementing mothers of infants after 1 month of age reported no difference (MD 11.42 nmol/L, 95% CI ‐10.27 to 33.11; participants = 85). However, the test for subgroup differences was not significant (P = 0.23; Iò = 30.8%).
5.26. Analysis.
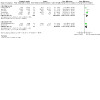
Comparison 5: Vitamin D given to lactating mothers compared to placebo or no treatment: subgroup and sensitivity analyses, Outcome 26: Serum 25‐OH vitamin D level at latest time reported to six months of age: infant risk
5.27. Analysis.
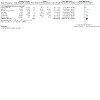
Comparison 5: Vitamin D given to lactating mothers compared to placebo or no treatment: subgroup and sensitivity analyses, Outcome 27: Serum 25‐OH vitamin D level at latest time reported to six months of age: season of supplementation
5.28. Analysis.
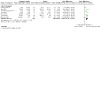
Comparison 5: Vitamin D given to lactating mothers compared to placebo or no treatment: subgroup and sensitivity analyses, Outcome 28: Serum 25‐OH vitamin D level at latest time reported to six months of age: D2 versus D3
5.30. Analysis.
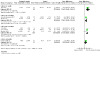
Comparison 5: Vitamin D given to lactating mothers compared to placebo or no treatment: subgroup and sensitivity analyses, Outcome 30: Serum 25‐OH vitamin D level at latest time reported to six months of age: duration of supplementation
5.31. Analysis.
Comparison 5: Vitamin D given to lactating mothers compared to placebo or no treatment: subgroup and sensitivity analyses, Outcome 31: Serum 25‐OH vitamin D level at latest time reported to six months of age: timing of commencement
Sensitivity analysis (Analysis 5.32): analysis of studies of good methodology found an increase in 25‐OH vitamin D level (MD 28.28 nmol/L, 95% CI 24.51 to 32.04; participants = 216; studies = 2; I2 = 32%).
5.32. Analysis.
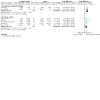
Comparison 5: Vitamin D given to lactating mothers compared to placebo or no treatment: subgroup and sensitivity analyses, Outcome 32: Serum 25‐OH vitamin D level at latest time reported to six months of age: sensitivity analysis
Fracture (radiologically confirmed)
No study reported this outcome.
Osteomalacia ‐ low bone mineral density reported on x‐ray
No study reported this outcome.
Change of standardised growth at latest time measured (change in weight, length and head circumference z score)
A single study (Roth 2016), reported no difference in change of standardised growth at latest time measured for weight (Analysis 2.8; MD 0.07, 95% CI ‐0.12 to 0.26; participants = 461); length (Analysis 2.9; MD 0.12, 95% CI ‐0.07 to 0.31; participants = 461); and head circumference (Analysis 2.10; MD 0.00, 95% CI ‐0.17 to 0.17; participants = 461) in infants of mothers supplemented with vitamin D.
2.8. Analysis.
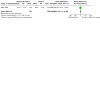
Comparison 2: Vitamin D given to lactating mothers compared to placebo or no treatment, Outcome 8: Change of standardised growth at latest time measured (weight) [z score]
2.9. Analysis.

Comparison 2: Vitamin D given to lactating mothers compared to placebo or no treatment, Outcome 9: Change of standardised growth at latest time measured (length) [z score]
2.10. Analysis.
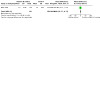
Comparison 2: Vitamin D given to lactating mothers compared to placebo or no treatment, Outcome 10: Change of standardised growth at latest time measured (head circumference) [z score]
Size at latest time measured
There was no difference in the weight (Analysis 2.11, MD 30.16 g, 95% CI ‐134.51 to 194.84; participants = 567; studies = 2; Iò = 0%), length (Analysis 2.12; MD 0.43 cm, 95% CI ‐0.02 to 0.89; participants = 568; studies = 2; Iò = 58%) and head circumference (Analysis 2.13; MD ‐0.10 cm, 95% CI ‐0.33 to 0.14; participants = 567; studies = 2; Iò= 47%) in infants of mothers supplemented with vitamin D.
2.11. Analysis.
Comparison 2: Vitamin D given to lactating mothers compared to placebo or no treatment, Outcome 11: Size at latest time measured: weight
2.12. Analysis.
Comparison 2: Vitamin D given to lactating mothers compared to placebo or no treatment, Outcome 12: Size at latest time measured: length
2.13. Analysis.
Comparison 2: Vitamin D given to lactating mothers compared to placebo or no treatment, Outcome 13: Size at latest time measured: head circumference
Comparison 3: vitamin D given to infants versus vitamin D given to lactating mothers
Six studies contributed to this comparison (Ala‐Houhala 1985; Ala‐Houhala 1986; Chandy 2016; Hollis 2015; Rothberg 1982; Wagner 2006), with a total of 801 mother‐infant pairs.
Bone mineral density/content at the end of intervention
No study reported this outcome.
Vitamin D insufficiency (25‐OH vitamin D < 50nmol/L)
There was a reduction in vitamin D insufficiency in infants receiving vitamin D supplements compared to infants of mothers receiving vitamin D supplements (Analysis 3.1; RR 0.61, 95% CI 0.40 to 0.94; participants = 334; studies = 4; Iò = 69%; very low‐level certainty evidence). We downgraded the certainty of evidence for risk of bias, inconsistency and indirectness as vitamin D insufficiency may not predict infant bone health.
3.1. Analysis.
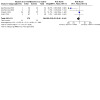
Comparison 3: Vitamin D given to infants compared to vitamin D given to lactating mothers, Outcome 1: Vitamin D insufficiency: 25‐OH vitamin D < 50 nmol/L
Subgroup analysis (Analysis 6.1): there was a significant effect of maternal dosage with a reduction in infant vitamin D insufficiency for infant 400 IU/day versus maternal 400 to 2000 IU/day (RR 0.06, 95% CI 0.01 to 0.37; participants = 141; studies = 2; Iò = 30%); but no difference for infant 400 IU/day versus maternal > 4000 IU/day (RR 1.02, 95% CI 0.15 to 6.95; participants = 95; studies = 1); and for infant 400 IU/day versus maternal D3 120 000 IU at delivery, 1.5, 2.5 and 3.5 months, then monthly till 9 months (RR 1.03, 95% CI 0.63 to 1.68; participants = 98; studies = 1). The test for subgroup differences was significant (P = 0.01, Iò = 77.5%).
6.1. Analysis.
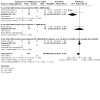
Comparison 6: Vitamin D given to infants compared to vitamin D given to lactating mothers: sensitivity analysis, Outcome 1: Vitamin D insufficiency: 25‐OH vitamin D < 50 nmol/L: subgroup analysis
Sensitivity analysis (Analysis 6.2): no study had good methodology.
6.2. Analysis.
Comparison 6: Vitamin D given to infants compared to vitamin D given to lactating mothers: sensitivity analysis, Outcome 2: Vitamin D insufficiency: 25‐OH vitamin D < 50 nmol/L: sensitivity analysis
Vitamin D deficiency (25‐OH vitamin D < 30 nmol/L)
There was a reduction in vitamin D deficiency in infants receiving vitamin D supplements compared to infants of mothers receiving vitamin D supplements (Analysis 3.1; RR 0.61, 95% CI 0.40 to 0.94; participants = 334; studies = 4; Iò = 69%; very low‐certainty evidence). We downgraded the certainty of evidence for risk of bias, inconsistency and imprecision.
Subgroup analysis (Analysis 6.3): there was a significant effect the comparison of infant dosage versus maternal dosage with a reduction in infant vitamin D insufficiency for infant dosage of 400 IU/day versus maternal dosage of 400 to 2000 IU/day (RR 0.06, 95% CI 0.01 to 0.37; participants = 141; studies = 2; Iò = 30%), but no difference for infant dosage of 400 IU/day versus maternal dosage > 4000 IU/day (RR 1.02, 95% CI 0.15 to 6.95; participants = 95; studies = 1), and for infant dosage of 400 IU/day versus maternal dosage of D3 120 000 IU at delivery, 1.5, 2.5 and 3.5 months, then monthly till 9 months (RR 1.03, 95% CI 0.63 to 1.68; participants = 98; studies = 1). The test for subgroup differences was significant (P = 0.03, Iò = 70.7%).
6.3. Analysis.
Comparison 6: Vitamin D given to infants compared to vitamin D given to lactating mothers: sensitivity analysis, Outcome 3: Vitamin D deficiency: 25‐OH vitamin D < 30 nmol/L: subgroup analysis
Sensitivity analysis (Analysis 6.4): no study had good methodology.
6.4. Analysis.
Comparison 6: Vitamin D given to infants compared to vitamin D given to lactating mothers: sensitivity analysis, Outcome 4: Vitamin D deficiency: 25‐OH vitamin D < 30 nmol/L: sensitivity analysis
Nutritional rickets
A single study (Ala‐Houhala 1985), in higher‐risk infants reported no cases of biochemical rickets in either group (Analysis 3.3; Analysis 6.5; participants = 92; very low‐certainty evidence).
3.3. Analysis.
Comparison 3: Vitamin D given to infants compared to vitamin D given to lactating mothers, Outcome 3: Nutritional rickets
6.5. Analysis.

Comparison 6: Vitamin D given to infants compared to vitamin D given to lactating mothers: sensitivity analysis, Outcome 5: Nutritional rickets: biochemical: sensitivity analysis
Adverse effects
A single study (Chandy 2016), reported no difference in hypercalcaemia (Analysis 3.4; Analysis 6.6; RR 1.22, 95% CI 0.48 to 3.09; participants = 97; very low‐certainty evidence).
3.4. Analysis.
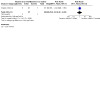
Comparison 3: Vitamin D given to infants compared to vitamin D given to lactating mothers, Outcome 4: Adverse effects (hypercalcaemia)
6.6. Analysis.
Comparison 6: Vitamin D given to infants compared to vitamin D given to lactating mothers: sensitivity analysis, Outcome 6: Adverse effects (hypercalcaemia): subgroup and sensitivity analyses
Lowest serum 25‐OH vitamin D level (nmol/L) up to six months of age
No study reported this outcome.
Serum 25‐OH vitamin D level at latest time reported during treatment to six months of age (nmol/L)
The 25‐OH‐ vitamin D level (Analysis 3.5), was higher in infants receiving vitamin D supplements compared to infants of mothers receiving vitamin D supplements (MD 14.35 nmol/L, 95% CI 9.64 to 19.06; participants = 269; studies = 4; Iò = 90%; very low‐certainty evidence). We downgraded the certainty of evidence for risk of bias, inconsistency and indirectness. However, the inconsistency (heterogeneity) may be explained by differences in maternal vitamin D dosage.
3.5. Analysis.
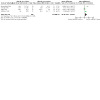
Comparison 3: Vitamin D given to infants compared to vitamin D given to lactating mothers, Outcome 5: Serum 25‐OH vitamin D level at latest time reported to six months of age
Subgroup analysis (Analysis 6.7): there was a significant effect of maternal dosage on infant 25‐OH vitamin D levels. All trials had an infant dose of 400 IU/day but maternal dosage varied. The 25‐OH vitamin D levels were higher for the infant group for comparisons of infant 400 IU/day versus maternal 400 to 2000 IU/day (MD 36.80 nmol/L, 95% CI 26.78 to 46.82; participants = 47; studies = 1); infant 400 IU/day versus maternal > 2000 to 4000 IU/day (MD 13.50 nmol/L, 95% CI 6.45 to 20.55; participants = 30; studies = 1); but not for comparisons of infant 400 IU/day versus maternal > 4000 IU/day (MD 0.60 nmol/L, 95% CI ‐13.48 to 14.68; participants = 95; studies = 1); and infant 400 IU/day versus maternal D3 120 000 IU at delivery, 1.5, 2.5 and 3.5 months, then monthly till 9 months (MD 0.50 nmol/L, 95% CI ‐9.54 to 10.54; participants = 97; studies = 1). The test for subgroup differences was significant (P < 0.00001, Iò = 90.1%).
6.7. Analysis.
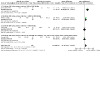
Comparison 6: Vitamin D given to infants compared to vitamin D given to lactating mothers: sensitivity analysis, Outcome 7: Serum 25‐OH vitamin D level at latest time reported to six months of age: subgroup analysis
Sensitivity analysis (Analysis 6.8): no study had good methodology.
6.8. Analysis.
Comparison 6: Vitamin D given to infants compared to vitamin D given to lactating mothers: sensitivity analysis, Outcome 8: Serum 25‐OH vitamin D level at latest time reported to six months of age: sensitivity analysis
Fracture (radiologically confirmed)
No study reported this outcome.
Osteomalacia ‐ low bone mineral density reported on x‐ray
No study reported this outcome.
Change of standardised growth at latest time measured (change in weight, length and head circumference z score)
No study reported this outcome.
Size at latest time measured
There was no difference in weight (Analysis 3.6; MD 127.43 g, 95% CI ‐107.78 to 362.64; participants = 125; studies = 2; Iò = 79%); or length (Analysis 3.7; MD ‐0.67 cm, 95% CI ‐1.60 to 0.25; participants = 125; studies = 2; Iò = 89%). However, there was an increase in head circumference (MD 0.58 cm, 95% CI 0.07 to 1.08; participants = 125; studies = 2; Iò = 0%) in infants receiving vitamin D supplements compared to infants of mothers receiving vitamin D supplements.
3.6. Analysis.
Comparison 3: Vitamin D given to infants compared to vitamin D given to lactating mothers, Outcome 6: Size at latest time measured: weight
3.7. Analysis.
Comparison 3: Vitamin D given to infants compared to vitamin D given to lactating mothers, Outcome 7: Size at latest time measured: length
Comparison 4: vitamin D given to infants versus periods of infant sun exposure
No study reported this comparison.
Discussion
Summary of main results
Vitamin D supplementation given to infants compared with placebo/no intervention (9 studies, 743 mother‐infant pairs)
Vitamin D supplementation of infants with 400 IU/day increased 25‐OH vitamin D levels by an average of 22.63 nmol/L (95% CI 17.05 to 28.21), and reduced the incidence of vitamin D insufficiency (25‐OH vitamin D < 50 nmol/L) by 23% (95% CI 33%, 14%). The effect was found in subgroup analysis of studies of infants at higher and lower risk of vitamin D deficiency. However, there was insufficient evidence to determine if infant vitamin D supplementation reduces the risk of vitamin D deficiency (25‐OH vitamin D < 30 nmol/L) up till six months of age, affects bone mineral content, the incidence of biochemical or radiological rickets, or growth. We are very uncertain about adverse effects, including the risk of hypercalcaemia. The certainly of evidence for all outcomes was graded as low or very low. There were no studies of higher doses (> 400 IU/day) of infant vitamin D compared to placebo.
Vitamin D supplementation given to lactating mothers compared with placebo/no intervention (8 studies, 1907 mother‐infant pairs)
Vitamin D supplementation of lactating mothers increased infant 25‐OH vitamin D levels by an average of 24.60 nmol/L (95% CI 21.59 to 27.60), reduced the incidence of vitamin D insufficiency (25‐OH vitamin D < 50 nmol/L) by 35% (95% CI 42%, 28%), and vitamin D deficiency (25‐OH vitamin D < 30 nmol/L) by 38% (95% CI 44%, 32%). There was low‐certainty evidence that vitamin D supplementation of lactating mothers reduced the incidence of biochemical rickets by 14% (95% CI 0.21%, 7%). The two studies that reported biochemical rickets used maternal dosages of oral D3 60,000 IU/day for 10 days (Naik 2017), and oral D3 60,000 IU postpartum and at 6, 10, and 14 weeks (Trivedi 2020). However, infant bone mineral content was not reported and there was insufficient evidence to determine if maternal vitamin D supplementation has an effect on radiological rickets. All studies enrolled patient populations at high risk of vitamin D deficiency. In subgroup analyses, there were significant associations between maternal dose of vitamin D and infant vitamin D insufficiency, vitamin D deficiency and 25‐OH vitamin D level. We are uncertain of the effects of vitamin D supplementation of lactating mothers on infant growth and adverse effects including hypercalcaemia.
Vitamin D supplementation given to infants compared with vitamin D supplementation given to lactating mothers (6 studies, 801 mother‐infant pairs)
Vitamin D supplementation of infants compared to vitamin D supplementation of lactating mothers increased the infant 25‐OH vitamin D level by an average difference of 14.35 nmol/L (95% CI 9.64 to 19.06), reduced the incidence of vitamin D insufficiency (25‐OH vitamin D < 50 nmol/L) by 9% (95% CI 17%, 1%), and vitamin D deficiency (25‐OH vitamin D < 30 nmol/L) by 10% (95% CI 16%, 3%). However, infant bone mineral content and radiological rickets were not reported. There was insufficient evidence to determine if maternal vitamin D supplementation has an effect on infant biochemical rickets. All studies enrolled patient populations at high risk of vitamin D deficiency. All studies compared an infant dose of vitamin D 400 IU/day with maternal vitamin D doses ranging from 400 IU/day to > 4000 IU/day. In subgroup analysis, there was a significant association between maternal dose of vitamin D and infant 25‐OH vitamin D level with trials supplementing mothers with < 4000 IU/day reporting a lower infant 25‐OH vitamin level. We are also very uncertain about adverse effects, including the risk of hypercalcaemia.
Overall completeness and applicability of evidence
Our search was comprehensive, using Cochrane methods. However, a number of studies that compared different doses of vitamin D given either to infants or lactating mothers were ineligible. Studies limited to vitamin D supplementation of pregnant women were also excluded.
Although most of the studies had only exclusively breastfed infants, we included studies where a majority of infants were breastfed. This is reflective of the real‐world situation as globally the exclusive breastfeeding rate of infants under six months is only 40% (https://www.who.int/features/factfiles/breastfeeding/en/ updated August 2017).
We prespecified criteria for studies of populations at high risk of vitamin D deficiency which included pigmentation, covering or avoidance of sun exposure, and/or latitude (above 52ðN or below 52ðS is associated with insufficient UV intensity most of the year), and included studies with documented vitamin D insufficiency or deficiency at baseline as high risk. Ten studies were considered to be in high‐risk populations. All studies comparing maternal vitamin D supplementation to placebo were in high‐risk populations. Subgroup analysis for population risk was possible for infant vitamin D supplementation of infants compared to placebo, which found a significant a reduction in incidence of vitamin D insufficiency for studies enrolling both higher and lower‐risk infants, and significantly increased 25‐OH vitamin D levels in both subgroups. However, only studies enrolling higher‐risk populations reported vitamin D deficiency.
The majority of studies used an infant dose of 400 IU/day of vitamin D3. A single small study (Ponnapakkam 2010), reported a lower dose of vitamin D of 200 IU/day. A single high vitamin D oral dose of 50,000 IU at birth was assessed by a single small study (Moodley 2015), which reported increased 25‐OH vitamin D levels, but was insufficiently powered to assess vitamin D insufficiency, deficiency or adverse effects. Maternal vitamin D doses ranged from 400 IU/day to 6000 IU/day. Maternal doses < 4000 IU/day were associated with lower infant 25‐OH vitamin D levels than infant doses of 400 IU/day. Maternal dosages of 6000 IU/day (Hollis 2015), and maternal intermittent high doses (120 000 IU at delivery, 1.5, 2.5 and 3.5 months, then monthly till 9 months (Chandy 2016), were associated with similar infant 25‐OH vitamin D levels, and a similar incidence of vitamin D insufficiency and vitamin D deficiency compared to infant doses of 400 IU/day.
A minority of studies have reported bone health outcomes including bone mineral content, and biochemical and/or radiological rickets. The evidence is insufficient to determine if infant vitamin D supplementation improves bone mineral content or reduces the incidence of nutritional rickets. All studies of maternal supplementation compared to placebo were in high‐risk populations. A reduction of biochemical but not radiological rickets was found in analysis of two studies of high‐dose maternal D3 supplementation (Naik 2017; Trivedi 2020). Despite the analysis of infant oral D3 400 IU/day finding higher infant 25‐OH vitamin D levels compared to infants of mothers supplemented with vitamin D, there was insufficient evidence to determine if infant supplementation improves bone health compared to maternal supplementation.
There were few studies reporting vitamin D deficiency (25‐OH vitamin D < 30 nmol/L). Most studies reported vitamin D insufficiency (25‐OH vitamin D < 50 nmol/L) so we were not able to report vitamin D deficiency consistently. This problem has also resulted in inconsistent reporting of effects of interventions in the different comparison groups.
Quality of the evidence
The primary focus of this review is whether vitamin D supplementation for term breastfed infants prevents vitamin D deficiency and improves bone health. Evidence that relates to surrogate measures has accordingly been downgraded as being indirect. The certainty of evidence for use of infant or maternal vitamin D supplementation for prevention of vitamin D deficiency (25‐OH vitamin D < 30 nmol/L) or improving bone health was graded as low to very low. There was a lack of studies reporting vitamin D deficiency (25‐OH vitamin D < 30 nmol/L) and measures of bone health, including bone mineral content, nutritional rickets (biochemical or radiological, or both) or fractures, which means that analyses lacked precision or data were not available. The certainty of evidence for infant vitamin D insufficiency and 25‐OH vitamin D level was downgraded for indirectness as these measures may not be adequately predictive of vitamin D deficiency and bone health (Roth 2018). low‐certainty evidence suggests infant and maternal vitamin D supplementation increase infant 25‐OH vitamin D levels and reduce the incidence of vitamin D insufficiency in high‐risk infants. Very low‐certainty evidence suggests infant supplementation when compared to maternal supplementation may be more effective at preventing vitamin D insufficiency and vitamin D deficiency, although there was a significant effect of maternal dosage in subgroup analysis. There was very low‐certainty of evidence for the incidence of adverse effects, including hypercalcaemia and hypercalciuria from either infant or maternal supplementation.
Potential biases in the review process
The influence of selective reporting and publication bias on this review are difficult to assess due to the limited number of studies in each analysis, and the majority of outcomes were only reported by a limited number of studies. The extensive search including trial registries and expert informants reduced the risk of publication bias. This review followed the methods of the Cochrane Collaboration and its Neonatal Review Group. All three authors contributed and cross‐checked the review independently. There are no conflicts of interest to declare.
Agreements and disagreements with other studies or reviews
Two Cochrane Reviews assessed the effect of vitamin D supplementation for women during pregnancy (Palacios 2019a), and dosage regimens of vitamin D supplementation for women during pregnancy (Palacios 2019b). Maternal vitamin D supplementation with or without calcium supplementation increased maternal vitamin D concentration at term. No trial reported any case of hypercalcaemia. However, given the scarcity of data in general for maternal adverse events, no firm conclusions could be drawn (Palacios 2019a). Comparing maternal doses during pregnancy of vitamin D 601 IU/d or higher versus 600 IU/d or lower, as well as maternal doses of vitamin D 4000 IU/d or more versus 3999 IU/d or less, both maternal and cord blood 25‐OH D concentration at term was higher for each of the higher‐dose comparisons (Palacios 2019b). However, adverse effects on infants including hyper‐ or hypocalcaemia and hypercalciuria were not reported.
A Cochrane protocol assessing the effects of vitamin D supplementation for prevention of vitamin D deficiency in preterm and low birth weight infants has been published (Pharange 2015).
The Global Consensus Recommendations on Prevention and Management of Nutritional Rickets recommend 400 IU/day is adequate to prevent rickets and is recommended for all infants from birth to 12 months of age, independent of their mode of feeding (Munns 2016). The US Dietary Guidelines Advisory Committee 2020 Advisory Report also recommends a similar dose during infancy (US Dietary Guidelines Advisory Committee 2020). This review does not provide strong support to routine supplementation of infants or their mothers in lower‐risk populations.
Authors' conclusions
Implications for practice.
For breastfed infants, low to very low‐certainty evidence found vitamin D supplementation 400 IU/day for up to 6 months increases 25‐OH vitamin D levels and reduces the incidence of vitamin D insufficiency, but there was insufficient evidence to assess its effect on vitamin D deficiency and bone health (biochemical or radiological rickets, or bone mineral density). There were no studies of higher doses of infant vitamin D compared to placebo.
For infants at higher risk of vitamin D deficiency who are breastfeeding, low to very low‐certainty evidence suggests maternal vitamin D supplementation reduced the incidence of vitamin D insufficiency and vitamin D deficiency. There is very low‐certainty evidence that maternal supplementation reduces biochemical rickets. There is insufficient evidence to determine if maternal vitamin D supplementation has an effect on radiological rickets.
Low to very low‐certainty evidence in populations at higher risk of vitamin D deficiency found vitamin D supplementation of infants leads to greater increases in infant 25‐OH vitamin D levels, reductions in the incidence of vitamin D insufficiency and vitamin D deficiency compared to vitamin D supplementation of lactating mothers. However, there is currently no evidence of an effect on markers of bone health. Higher maternal doses (vitamin D3 > 4000 IU/day) resulted in similar infant 25‐OH vitamin D levels as for infants given 400 IU/day.
There is currently insufficient evidence to recommend routine supplementation of vitamin D for breastfeeding mothers or their infants in populations at lower risk of vitamin D deficiency. In populations at high risk of vitamin D deficiency, vitamin D 400 IU per day given to the infant, or higher doses given to the breastfeeding mother, may prevent vitamin D deficiency, although effects on bone health are unclear.
Implications for research.
There is a need for adequately powered clinical trials of vitamin D supplementation in breastfeeding infants or lactating mothers that report the incidence of vitamin D deficiency and longer‐term markers of bone health. The ongoing studies identified in this review do not appear to address these outcomes as they do not propose to evaluate the effects of vitamin D supplementation on bone health. Adverse effects, including vitamin D excess, vitamin D toxicity, hypercalcaemia and hypercalciuria, should be reported.
History
Protocol first published: Issue 6, 2018 Review first published: Issue 12, 2020
Acknowledgements
We acknowledge Lisa Jones for assistance with protocol development (Tan 2018), and Foo Wee Nee for assistance with data extraction.
We would like to thank Cochrane Neonatal: Colleen Ovelman, Managing Editor, Jane Cracknell, Assistant Managing Editor, Roger Soll, Co‐coordinating editor, and Bill McGuire, Co‐coordinating Editor, who provided editorial and administrative support. Carol Friesen, Information Specialist, designed and ran the literature searches.
Jeffrey Horbar and Eugene Dempsey peer reviewed and offered feedback for this review.
Appendices
Appendix 1. Cochrane Neonatal standard search strategy
Searches were performed 29th May 2020 of the following databases using the search terms 'exp vitamin D/ or vitamin D.mp.; cholecalciferol.mp. or exp colecalciferol/; colecalciferol.mp' adapted for the database. Additional searches were performed as documented in Appendix 2; Appendix 3; Appendix 4; and Appendix 5.
CENTRAL via CRS Web:
1. MESH DESCRIPTOR Infant, Newborn EXPLODE ALL AND CENTRAL:TARGET
2. infant or infants or infant’s or “infant s” or infantile or infancy or newborn* or "new born" or "new borns" or "newly born" or neonat* or baby* or babies or premature or prematures or prematurity or preterm or preterms or "pre term" or premies or "low birth weight" or "low birthweight" or VLBW or LBW or ELBW or NICU AND CENTRAL:TARGET
3. #2 OR #1
MEDLINE via Ovid ‐ Ovid MEDLINE(R) and Epub Ahead of Print, In‐Process & Other Non‐Indexed Citations, Daily and Versions(R):
1. exp infant, newborn/
2. (newborn* or new born or new borns or newly born or baby* or babies or premature or prematurity or preterm or pre term or low birth weight or low birthweight or VLBW or LBW or infant or infants or 'infant s' or infant's or infantile or infancy or neonat*).ti,ab.
3. 1 or 2
4. randomized controlled trial.pt.
5. controlled clinical trial.pt.
6. randomized.ab.
7. placebo.ab.
8. drug therapy.fs.
9. randomly.ab.
10. trial.ab.
11. groups.ab.
12. or/4‐11
13. exp animals/ not humans.sh.
14. 12 not 13
15. 3 and 14
16. randomi?ed.ti,ab.
17. randomly.ti,ab.
18. trial.ti,ab.
19. groups.ti,ab.
20. ((single or doubl* or tripl* or treb*) and (blind* or mask*)).ti,ab.
21. placebo*.ti,ab.
22. 16 or 17 or 18 or 19 or 20 or 21
23. 2 and 22
24. limit 23 to yr="2018 ‐Current"
25. 15 or 24
CINAHL via EBSCOhost:
(infant or infants or infant’s or infantile or infancy or newborn* or "new born" or "new borns" or "newly born" or neonat* or baby* or babies or premature or prematures or prematurity or preterm or preterms or "pre term" or premies or "low birth weight" or "low birthweight" or VLBW or LBW) AND (randomized controlled trial OR controlled clinical trial OR randomized OR randomised OR placebo OR clinical trials as topic OR randomly OR trial OR PT clinical trial)
Appendix 2. CENTRAL search strategy
EBM Reviews ‐ Cochrane Central Register of Controlled Trials April 2020
1 newborn.mp. or exp Infant, Newborn/
2 neonat*.mp.
3 infant.mp. or exp Infant/
4 infan*.mp.
5 1 or 2 or 3 or 4
6 exp Vitamin D/ or exp Cholecalciferol/ or vitamin d.mp.
7 colecalciferol.mp.
8 cholecalciferol.mp.
9 6 or 7 or 8
10 5 and 9
11 limit 10 to (clinical trial or controlled clinical trial or randomized controlled trial)
12 random*.mp.
13 10 and 12
14 11 or 13
Appendix 3. Embase search strategy
Embase 1974 to 2020 May 29
1 exp infant/ or infant.mp.
2 exp newborn/ or newborn.mp.
3 neonat*.mp.
5 exp vitamin D/ or vitamin D.mp.
6 cholecalciferol.mp. or exp colecalciferol/
7 colecalciferol.mp.
8 5 or 6 or 7
9 4 and 8 n=422
10 limit 9 to (clinical trial or randomized controlled trial or controlled clinical trial)
Appendix 4. MEDLINE search strategy
MEDLINE(R) All including Epub Ahead of Print, In‐Process & Other Non‐Indexed Citations, Daily and Versions(R) 1946‐current
1 exp infant/ or infant.mp.
2 exp newborn/ or newborn.mp.
3 neonat*.mp.
4 1 or 2 or 3
5 exp vitamin D/ or vitamin D.mp.
6 cholecalciferol.mp. or exp colecalciferol/
7 colecalciferol.mp.
8 5 or 6 or 7
9 4 and 8
10 limit 9 to randomized controlled trial n=290
11 limit 10 to yr="2018 ‐Current"
Appendix 5. MIDIRS search strategy
Maternity & Infant Care Database (MIDIRS) 1971 to April 2020
1 newborn.mp. [mp=abstract, heading word, title]
2 neonat*.mp. [mp=abstract, heading word, title]
3 infan*.mp. [mp=abstract, heading word, title]
4 1 or 2 or 3
5 vitamin D.mp. [mp=abstract, heading word, title]
6 colecalciferol.mp. [mp=abstract, heading word, title]
7 cholecalciferol.mp. [mp=abstract, heading word, title]
8 5 or 6 or 7
9 4 and 8
10 random*.mp. [mp=abstract, heading word, title]
11 9 and 10
12 limit 9 to randomised controlled trial
13 11 or 12
Appendix 6. ‘Risk of bias' tool
We used the standard methods of Cochrane and Cochrane Neonatal to assess the methodological quality of the trials. For each trial, we sought information regarding the method of randomisation, blinding and reporting of all outcomes of all the infants enrolled in the trial. We assessed each criterion as being at a low, high, or unclear risk of bias. Two review authors separately assessed each study. Disagreements were resolved by discussion. We added this information to the table Characteristics of included studies. We evaluated the following issues and entered the findings into the 'Risk of bias' table:
Sequence generation (checking for possible selection bias). Was the allocation sequence adequately generated?
For each included study, we categorised the method used to generate the allocation sequence as:
low risk (any truly random process e.g. random number table; computer random number generator);
high risk (any non‐random process e.g. odd or even date of birth; hospital or clinic record number); or
unclear risk.
Allocation concealment (checking for possible selection bias). Was allocation adequately concealed?
For each included study, we categorised the method used to conceal the allocation sequence as:
low risk (e.g. telephone or central randomisation; consecutively numbered sealed opaque envelopes);
high risk (open random allocation; unsealed or non‐opaque envelopes, alternation; date of birth); or
unclear risk.
Blinding of participants and personnel (checking for possible performance bias). Was knowledge of the allocated intervention adequately prevented during the study?
For each included study, we categorised the methods used to blind study participants and personnel from knowledge of which intervention a participant received. Blinding was assessed separately for different outcomes or class of outcomes. We categorised the methods as:
low risk, high risk or unclear risk for participants; and
low risk, high risk or unclear risk for personnel.
Blinding of outcome assessment (checking for possible detection bias). Was knowledge of the allocated intervention adequately prevented at the time of outcome assessment?
For each included study, we categorised the methods used to blind outcome assessment. Blinding was assessed separately for different outcomes or class of outcomes. We categorised the methods as:
low risk for outcome assessors;
high risk for outcome assessors; or
unclear risk for outcome assessors.
Incomplete outcome data (checking for possible attrition bias through withdrawals, dropouts, protocol deviations). Were incomplete outcome data adequately addressed?
For each included study and for each outcome, we described the completeness of data including attrition and exclusions from the analysis. We noted whether attrition and exclusions were reported, the numbers included in the analysis at each stage (compared with the total randomised participants), reasons for attrition or exclusion where reported, and whether missing data were balanced across groups or were related to outcomes. Where sufficient information was reported or supplied by the trial authors, we re‐included missing data in the analyses. We categorised the methods as:
low risk (< 20% missing data);
high risk (≥ 20% missing data); or
unclear risk.
Selective reporting bias. Are reports of the study free of suggestion of selective outcome reporting?
For each included study, we described how we investigated the possibility of selective outcome reporting bias and what we found. For studies in which study protocols were published in advance, we compared prespecified outcomes versus outcomes eventually reported in the published results. If the study protocol was not published in advance, we contacted study authors to gain access to the study protocol. We assessed the methods as:
low risk (where it is clear that all of the study's prespecified outcomes and all expected outcomes of interest to the review have been reported);
high risk (where not all the study's prespecified outcomes have been reported; one or more reported primary outcomes were not prespecified outcomes of interest and are reported incompletely and so cannot be used; study fails to include results of a key outcome that would have been expected to have been reported); or
unclear risk.
Other sources of bias. Was the study apparently free of other problems that could put it at a high risk of bias?
For each included study, we described any important concerns we had about other possible sources of bias (for example, whether there was a potential source of bias related to the specific study design or whether the trial was stopped early due to some data‐dependent process). We assessed whether each study was free of other problems that could put it at risk of bias as:
low risk;
high risk;
unclear risk.
If needed, we explored the impact of the level of bias through undertaking sensitivity analyses.
Data and analyses
Comparison 1. Vitamin D given to infants compared to placebo or no treatment.
| Outcome or subgroup title | No. of studies | No. of participants | Statistical method | Effect size |
|---|---|---|---|---|
| 1.1 Bone mineral content at the end of intervention | 2 | 56 | Mean Difference (IV, Fixed, 95% CI) | 3.93 [‐2.42, 10.27] |
| 1.2 Vitamin D insufficiency: 25‐OH vitamin D < 50 nmol/L | 4 | 274 | Risk Ratio (IV, Fixed, 95% CI) | 0.57 [0.41, 0.80] |
| 1.3 Vitamin D deficiency: 25‐OH vitamin D < 30 nmol/L | 2 | 122 | Risk Ratio (IV, Fixed, 95% CI) | 0.41 [0.16, 1.05] |
| 1.4 Nutritional rickets: biochemical | 2 | Risk Ratio (M‐H, Fixed, 95% CI) | Subtotals only | |
| 1.5 Adverse effects (hypercalcaemia) | 1 | 98 | Risk Ratio (M‐H, Fixed, 95% CI) | 1.45 [0.54, 3.86] |
| 1.6 Adverse effects (others) | 3 | 49 | Risk Ratio (M‐H, Fixed, 95% CI) | 3.00 [0.14, 64.26] |
| 1.7 Serum 25‐OH vitamin D level at latest time reported to six months of age | 6 | 334 | Mean Difference (IV, Fixed, 95% CI) | 22.63 [17.05, 28.21] |
| 1.8 Size at latest time measured: weight | 2 | 143 | Mean Difference (IV, Fixed, 95% CI) | 123.63 [‐170.02, 417.28] |
| 1.9 Size at latest time measured: length | 3 | 156 | Mean Difference (IV, Fixed, 95% CI) | 0.73 [‐0.11, 1.57] |
| 1.10 Size at latest time measured: head circumference | 1 | 105 | Mean Difference (IV, Fixed, 95% CI) | 0.00 [‐0.60, 0.60] |
1.5. Analysis.
Comparison 1: Vitamin D given to infants compared to placebo or no treatment, Outcome 5: Adverse effects (hypercalcaemia)
1.6. Analysis.
Comparison 1: Vitamin D given to infants compared to placebo or no treatment, Outcome 6: Adverse effects (others)
Comparison 2. Vitamin D given to lactating mothers compared to placebo or no treatment.
| Outcome or subgroup title | No. of studies | No. of participants | Statistical method | Effect size |
|---|---|---|---|---|
| 2.1 Vitamin D insufficiency: 25‐OH vitamin D < 50 nmol/L | 5 | 512 | Risk Ratio (M‐H, Fixed, 95% CI) | 0.47 [0.39, 0.57] |
| 2.2 Vitamin D deficiency: 25‐OH vitamin D < 30 nmol/L | 5 | 512 | Risk Ratio (M‐H, Fixed, 95% CI) | 0.15 [0.09, 0.24] |
| 2.3 Nutritional rickets: biochemical | 2 | 229 | Risk Ratio (M‐H, Fixed, 95% CI) | 0.06 [0.01, 0.44] |
| 2.4 Nutritional rickets: radiological | 3 | 536 | Risk Ratio (M‐H, Fixed, 95% CI) | 0.76 [0.18, 3.31] |
| 2.5 Adverse effects (hypercalcaemia) | 3 | 557 | Risk Ratio (M‐H, Fixed, 95% CI) | 1.31 [0.51, 3.32] |
| 2.6 Adverse effects (all) | 3 | 314 | Risk Ratio (M‐H, Fixed, 95% CI) | Not estimable |
| 2.7 Serum 25‐OH vitamin D level at latest time reported to six months of age | 7 | 597 | Mean Difference (IV, Fixed, 95% CI) | 24.60 [21.59, 27.60] |
| 2.8 Change of standardised growth at latest time measured (weight) [z score] | 1 | 461 | Mean Difference (IV, Fixed, 95% CI) | 0.07 [‐0.12, 0.26] |
| 2.9 Change of standardised growth at latest time measured (length) [z score] | 1 | 461 | Mean Difference (IV, Fixed, 95% CI) | 0.12 [‐0.07, 0.31] |
| 2.10 Change of standardised growth at latest time measured (head circumference) [z score] | 1 | 461 | Mean Difference (IV, Fixed, 95% CI) | 0.00 [‐0.17, 0.17] |
| 2.11 Size at latest time measured: weight | 2 | 567 | Mean Difference (IV, Fixed, 95% CI) | 30.16 [‐134.51, 194.84] |
| 2.12 Size at latest time measured: length | 2 | 568 | Mean Difference (IV, Fixed, 95% CI) | 0.43 [‐0.02, 0.89] |
| 2.13 Size at latest time measured: head circumference | 2 | 567 | Mean Difference (IV, Fixed, 95% CI) | ‐0.10 [‐0.33, 0.14] |
2.6. Analysis.
Comparison 2: Vitamin D given to lactating mothers compared to placebo or no treatment, Outcome 6: Adverse effects (all)
Comparison 3. Vitamin D given to infants compared to vitamin D given to lactating mothers.
| Outcome or subgroup title | No. of studies | No. of participants | Statistical method | Effect size |
|---|---|---|---|---|
| 3.1 Vitamin D insufficiency: 25‐OH vitamin D < 50 nmol/L | 4 | 334 | Risk Ratio (M‐H, Fixed, 95% CI) | 0.61 [0.40, 0.94] |
| 3.2 Vitamin D deficiency: 25‐OH vitamin D < 30 nmol/L | 4 | 334 | Risk Ratio (M‐H, Fixed, 95% CI) | 0.35 [0.17, 0.72] |
| 3.3 Nutritional rickets | 1 | Risk Ratio (M‐H, Fixed, 95% CI) | Subtotals only | |
| 3.3.1 Biochemical | 1 | 92 | Risk Ratio (M‐H, Fixed, 95% CI) | Not estimable |
| 3.4 Adverse effects (hypercalcaemia) | 1 | 97 | Risk Ratio (M‐H, Fixed, 95% CI) | 1.22 [0.48, 3.09] |
| 3.5 Serum 25‐OH vitamin D level at latest time reported to six months of age | 4 | 269 | Mean Difference (IV, Fixed, 95% CI) | 14.35 [9.64, 19.06] |
| 3.6 Size at latest time measured: weight | 2 | 125 | Mean Difference (IV, Fixed, 95% CI) | 127.43 [‐107.78, 362.64] |
| 3.7 Size at latest time measured: length | 2 | 125 | Mean Difference (IV, Fixed, 95% CI) | ‐0.67 [‐1.60, 0.25] |
| 3.8 Size at latest time measured: head circumference | 2 | 125 | Mean Difference (IV, Fixed, 95% CI) | 0.58 [0.07, 1.08] |
3.2. Analysis.
Comparison 3: Vitamin D given to infants compared to vitamin D given to lactating mothers, Outcome 2: Vitamin D deficiency: 25‐OH vitamin D < 30 nmol/L
3.8. Analysis.
Comparison 3: Vitamin D given to infants compared to vitamin D given to lactating mothers, Outcome 8: Size at latest time measured: head circumference
Comparison 4. Vitamin D given to infants compared to placebo or no treatment: subgroup and sensitivity analyses.
| Outcome or subgroup title | No. of studies | No. of participants | Statistical method | Effect size |
|---|---|---|---|---|
| 4.1 Bone mineral content at the end of intervention: subgroup analysis | 2 | Mean Difference (IV, Fixed, 95% CI) | Subtotals only | |
| 4.1.1 Lower‐risk infants; D2 400 IU/day birth to 3 months | 1 | 18 | Mean Difference (IV, Fixed, 95% CI) | 15.00 [6.68, 23.32] |
| 4.1.2 Lower‐risk infants; D2 400 IU/day birth to 6 months | 1 | 38 | Mean Difference (IV, Fixed, 95% CI) | ‐11.50 [‐21.32, ‐1.68] |
| 4.2 Bone mineral content at the end of intervention: sensitivity analysis | 2 | Mean Difference (IV, Fixed, 95% CI) | Subtotals only | |
| 4.2.1 Other studies | 2 | 56 | Mean Difference (IV, Fixed, 95% CI) | 3.93 [‐2.42, 10.27] |
| 4.3 Vitamin D insufficiency (25‐OH vitamin D < 50 nmol/L): infant risk | 4 | 274 | Risk Ratio (IV, Fixed, 95% CI) | 0.57 [0.41, 0.80] |
| 4.3.1 Higher‐risk infants | 3 | 134 | Risk Ratio (IV, Fixed, 95% CI) | 0.65 [0.46, 0.94] |
| 4.3.2 Lower‐risk infants | 1 | 140 | Risk Ratio (IV, Fixed, 95% CI) | 0.19 [0.07, 0.53] |
| 4.4 Vitamin D insufficiency (25‐OH vitamin D < 50 nmol/L): season of supplementation | 4 | Risk Ratio (IV, Fixed, 95% CI) | Subtotals only | |
| 4.4.1 Supplementation not seasonal | 4 | 274 | Risk Ratio (IV, Fixed, 95% CI) | 0.57 [0.41, 0.80] |
| 4.5 Vitamin D insufficiency (25‐OH vitamin D < 50 nmol/L): D2 versus D3 | 4 | 274 | Risk Ratio (IV, Fixed, 95% CI) | 0.57 [0.41, 0.80] |
| 4.5.1 Vitamin D2 | 1 | 12 | Risk Ratio (IV, Fixed, 95% CI) | 0.50 [0.14, 1.77] |
| 4.5.2 Vitamin D3 | 3 | 262 | Risk Ratio (IV, Fixed, 95% CI) | 0.58 [0.40, 0.82] |
| 4.6 Vitamin D insufficiency: 25‐OH vitamin D < 50 nmol/L: dosage | 4 | 274 | Risk Ratio (IV, Fixed, 95% CI) | 0.57 [0.41, 0.80] |
| 4.6.1 Vitamin D single oral 50,000 IU at birth | 1 | 21 | Risk Ratio (IV, Fixed, 95% CI) | 0.61 [0.24, 1.54] |
| 4.6.2 Vitamin D dose 400 IU/day | 3 | 253 | Risk Ratio (IV, Fixed, 95% CI) | 0.56 [0.39, 0.81] |
| 4.7 Vitamin D insufficiency (25‐OH vitamin D < 50 nmol/L): duration of supplementation | 4 | 274 | Risk Ratio (IV, Fixed, 95% CI) | 0.57 [0.41, 0.80] |
| 4.7.1 Vitamin D single oral 50,000 IU at birth | 1 | 21 | Risk Ratio (IV, Fixed, 95% CI) | 0.61 [0.24, 1.54] |
| 4.7.2 1 to 2 months | 1 | 12 | Risk Ratio (IV, Fixed, 95% CI) | 0.50 [0.14, 1.77] |
| 4.7.3 > 6 months | 2 | 241 | Risk Ratio (IV, Fixed, 95% CI) | 0.57 [0.39, 0.83] |
| 4.8 Vitamin D insufficiency (25‐OH vitamin D < 50 nmol/L): timing of commencement | 4 | 274 | Risk Ratio (IV, Fixed, 95% CI) | 0.57 [0.41, 0.80] |
| 4.8.1 From birth | 3 | 134 | Risk Ratio (IV, Fixed, 95% CI) | 0.65 [0.46, 0.94] |
| 4.8.2 From 1 month age | 1 | 140 | Risk Ratio (IV, Fixed, 95% CI) | 0.19 [0.07, 0.53] |
| 4.9 Vitamin D insufficiency (25‐OH vitamin D < 50 nmol/L): sensitivity analysis | 4 | 274 | Risk Ratio (IV, Fixed, 95% CI) | 0.57 [0.41, 0.80] |
| 4.9.1 Other studies | 4 | 274 | Risk Ratio (IV, Fixed, 95% CI) | 0.57 [0.41, 0.80] |
| 4.10 Vitamin D deficiency: 25‐OH vitamin D < 30 nmol/L: infant risk | 2 | Risk Ratio (IV, Fixed, 95% CI) | Subtotals only | |
| 4.10.1 Higher‐risk infants | 2 | 122 | Risk Ratio (IV, Fixed, 95% CI) | 0.41 [0.16, 1.05] |
| 4.11 Vitamin D deficiency: 25‐OH vitamin D < 30 nmol/L: season of supplementation | 2 | Risk Difference (IV, Fixed, 95% CI) | Subtotals only | |
| 4.11.1 Supplementation not seasonal | 2 | 122 | Risk Difference (IV, Fixed, 95% CI) | ‐0.09 [‐0.20, 0.02] |
| 4.12 Vitamin D deficiency: 25‐OH vitamin D < 30 nmol/L: D2 versus D3 | 2 | Risk Difference (IV, Fixed, 95% CI) | Subtotals only | |
| 4.12.1 Vitamin D3 | 2 | 122 | Risk Difference (IV, Fixed, 95% CI) | ‐0.09 [‐0.20, 0.02] |
| 4.13 Vitamin D deficiency: 25‐OH vitamin D < 30 nmol/L: dosage | 2 | Risk Difference (IV, Fixed, 95% CI) | Subtotals only | |
| 4.13.1 Vitamin D single oral 50,000 IU at birth | 1 | 21 | Risk Difference (IV, Fixed, 95% CI) | 0.00 [‐0.17, 0.17] |
| 4.13.2 Vitamin D dose 400 IU/day | 1 | 101 | Risk Difference (IV, Fixed, 95% CI) | ‐0.15 [‐0.30, ‐0.01] |
| 4.14 Vitamin D deficiency: 25‐OH vitamin D < 30 nmol/L: duration of supplementation | 2 | Risk Difference (IV, Fixed, 95% CI) | Subtotals only | |
| 4.14.1 Vitamin D single oral 50,000 IU at birth | 1 | 21 | Risk Difference (IV, Fixed, 95% CI) | 0.00 [‐0.17, 0.17] |
| 4.14.2 > 6 months | 1 | 101 | Risk Difference (IV, Fixed, 95% CI) | ‐0.15 [‐0.30, ‐0.01] |
| 4.15 Vitamin D deficiency: 25‐OH vitamin D < 30 nmol/L: timing of commencement | 2 | Risk Difference (IV, Fixed, 95% CI) | Subtotals only | |
| 4.15.1 From birth | 2 | 122 | Risk Difference (IV, Fixed, 95% CI) | ‐0.09 [‐0.20, 0.02] |
| 4.16 Vitamin D deficiency: 25‐OH vitamin D < 30 nmol/L: sensitivity analysis | 2 | Risk Ratio (IV, Fixed, 95% CI) | Subtotals only | |
| 4.16.1 Other studies | 2 | 122 | Risk Ratio (IV, Fixed, 95% CI) | 0.41 [0.16, 1.05] |
| 4.17 Nutritional rickets: biochemical: subgroup analysis | 2 | Risk Ratio (M‐H, Fixed, 95% CI) | Subtotals only | |
| 4.17.1 Low‐risk infants: D 200 IU/day birth to 6 months | 1 | 16 | Risk Ratio (M‐H, Fixed, 95% CI) | Not estimable |
| 4.17.2 Low‐risk infants: D2 400 IU/day birth to 6 months; all seasons | 1 | 18 | Risk Ratio (M‐H, Fixed, 95% CI) | Not estimable |
| 4.18 Nutritional rickets: biochemical: sensitivity analysis | 2 | Risk Ratio (M‐H, Fixed, 95% CI) | Subtotals only | |
| 4.18.1 Other studies | 2 | 34 | Risk Ratio (M‐H, Fixed, 95% CI) | Not estimable |
| 4.19 Adverse effects (hypercalcaemia): subgroup and sensitivity analyses | 1 | Risk Ratio (M‐H, Fixed, 95% CI) | Subtotals only | |
| 4.19.1 Other studies: Vitamin D dose 400 IU/day birth to 9 months | 1 | 98 | Risk Ratio (M‐H, Fixed, 95% CI) | 1.45 [0.54, 3.86] |
| 4.20 Serum 25‐OH vitamin D level at latest time reported to six months of age: infant risk | 6 | Mean Difference (IV, Fixed, 95% CI) | Subtotals only | |
| 4.20.1 Higher‐risk infants | 3 | 134 | Mean Difference (IV, Fixed, 95% CI) | 18.24 [9.39, 27.09] |
| 4.20.2 Lower‐risk infants | 3 | 200 | Mean Difference (IV, Fixed, 95% CI) | 25.53 [18.34, 32.72] |
| 4.21 Serum 25‐OH vitamin D level at latest time reported to six months of age: season of supplementation | 6 | Mean Difference (IV, Fixed, 95% CI) | Subtotals only | |
| 4.21.1 All year | 6 | 334 | Mean Difference (IV, Fixed, 95% CI) | 22.63 [17.05, 28.21] |
| 4.22 Serum 25‐OH vitamin D level at latest time reported to six months of age: D2 versus D3 | 6 | Mean Difference (IV, Fixed, 95% CI) | Subtotals only | |
| 4.22.1 Vitamin D2 preparation | 2 | 50 | Mean Difference (IV, Fixed, 95% CI) | 33.00 [17.27, 48.73] |
| 4.22.2 Vitamin D3 preparation | 4 | 284 | Mean Difference (IV, Fixed, 95% CI) | 21.14 [15.17, 27.11] |
| 4.23 Serum 25‐OH vitamin D level at latest time reported to six months of age: dosage | 6 | Mean Difference (IV, Fixed, 95% CI) | Subtotals only | |
| 4.23.1 Vitamin D single oral 50,000 IU at birth | 1 | 21 | Mean Difference (IV, Fixed, 95% CI) | 22.75 [3.43, 42.07] |
| 4.23.2 Vitamin D 400 IU/day | 5 | 313 | Mean Difference (IV, Fixed, 95% CI) | 22.62 [16.79, 28.45] |
| 4.24 Serum 25‐OH vitamin D level at latest time reported to six months of age: duration of supplementation | 6 | Mean Difference (IV, Fixed, 95% CI) | Subtotals only | |
| 4.24.1 Vitamin D single oral 50,000 IU at birth | 1 | 21 | Mean Difference (IV, Fixed, 95% CI) | 22.75 [3.43, 42.07] |
| 4.24.2 1 to 2 months | 1 | 12 | Mean Difference (IV, Fixed, 95% CI) | 30.30 [‐6.51, 67.11] |
| 4.24.3 4 to 6 months | 1 | 38 | Mean Difference (IV, Fixed, 95% CI) | 33.60 [16.20, 51.00] |
| 4.24.4 > 6 months | 3 | 263 | Mean Difference (IV, Fixed, 95% CI) | 20.97 [14.69, 27.24] |
| 4.25 Serum 25‐OH vitamin D level at latest time reported to six months of age: timing of commencement | 6 | Mean Difference (IV, Fixed, 95% CI) | Subtotals only | |
| 4.25.1 From birth | 3 | 160 | Mean Difference (IV, Fixed, 95% CI) | 20.97 [12.90, 29.04] |
| 4.25.2 From 1 month age | 4 | 275 | Mean Difference (IV, Fixed, 95% CI) | 21.23 [15.04, 27.42] |
| 4.26 Serum 25‐OH vitamin D level at latest time reported to six months of age: sensitivity analysis | 6 | Mean Difference (IV, Fixed, 95% CI) | Subtotals only | |
| 4.26.1 Other studies | 6 | 334 | Mean Difference (IV, Fixed, 95% CI) | 22.63 [17.05, 28.21] |
4.10. Analysis.
Comparison 4: Vitamin D given to infants compared to placebo or no treatment: subgroup and sensitivity analyses, Outcome 10: Vitamin D deficiency: 25‐OH vitamin D < 30 nmol/L: infant risk
4.11. Analysis.
Comparison 4: Vitamin D given to infants compared to placebo or no treatment: subgroup and sensitivity analyses, Outcome 11: Vitamin D deficiency: 25‐OH vitamin D < 30 nmol/L: season of supplementation
4.12. Analysis.
Comparison 4: Vitamin D given to infants compared to placebo or no treatment: subgroup and sensitivity analyses, Outcome 12: Vitamin D deficiency: 25‐OH vitamin D < 30 nmol/L: D2 versus D3
4.13. Analysis.
Comparison 4: Vitamin D given to infants compared to placebo or no treatment: subgroup and sensitivity analyses, Outcome 13: Vitamin D deficiency: 25‐OH vitamin D < 30 nmol/L: dosage
4.14. Analysis.
Comparison 4: Vitamin D given to infants compared to placebo or no treatment: subgroup and sensitivity analyses, Outcome 14: Vitamin D deficiency: 25‐OH vitamin D < 30 nmol/L: duration of supplementation
4.15. Analysis.

Comparison 4: Vitamin D given to infants compared to placebo or no treatment: subgroup and sensitivity analyses, Outcome 15: Vitamin D deficiency: 25‐OH vitamin D < 30 nmol/L: timing of commencement
4.19. Analysis.
Comparison 4: Vitamin D given to infants compared to placebo or no treatment: subgroup and sensitivity analyses, Outcome 19: Adverse effects (hypercalcaemia): subgroup and sensitivity analyses
Comparison 5. Vitamin D given to lactating mothers compared to placebo or no treatment: subgroup and sensitivity analyses.
| Outcome or subgroup title | No. of studies | No. of participants | Statistical method | Effect size |
|---|---|---|---|---|
| 5.1 Vitamin D insufficiency (25‐OH vitamin D < 50 nmol/L): infant risk | 5 | Risk Ratio (M‐H, Fixed, 95% CI) | Subtotals only | |
| 5.1.1 Higher‐risk | 5 | 512 | Risk Ratio (M‐H, Fixed, 95% CI) | 0.47 [0.39, 0.57] |
| 5.2 Vitamin D insufficiency (25‐OH vitamin D < 50 nmol/L): season of supplementation | 5 | Risk Ratio (M‐H, Fixed, 95% CI) | Subtotals only | |
| 5.2.1 Supplementation not seasonal | 5 | 512 | Risk Ratio (M‐H, Fixed, 95% CI) | 0.47 [0.39, 0.57] |
| 5.3 Vitamin D insufficiency (25‐OH vitamin D < 50 nmol/L): D2 versus D3 | 5 | Risk Ratio (M‐H, Fixed, 95% CI) | Subtotals only | |
| 5.3.1 Vitamin D3 | 5 | 512 | Risk Ratio (M‐H, Fixed, 95% CI) | 0.47 [0.39, 0.57] |
| 5.4 Vitamin D insufficiency (25‐OH vitamin D < 50 nmol/L): dosage | 5 | Risk Ratio (M‐H, Fixed, 95% CI) | Subtotals only | |
| 5.4.1 400 to 2000 IU/day | 2 | 186 | Risk Ratio (M‐H, Fixed, 95% CI) | 0.71 [0.49, 1.03] |
| 5.4.2 > 2000 to 4000 IU/day | 2 | 216 | Risk Ratio (M‐H, Fixed, 95% CI) | 0.43 [0.34, 0.56] |
| 5.4.3 > 4000 IU/day | 1 | 110 | Risk Ratio (M‐H, Fixed, 95% CI) | 0.33 [0.20, 0.53] |
| 5.5 Vitamin D insufficiency (25‐OH vitamin D < 50 nmol/L): duration of supplementation | 5 | Risk Ratio (M‐H, Fixed, 95% CI) | Subtotals only | |
| 5.5.1 < 1 month | 1 | 110 | Risk Ratio (M‐H, Fixed, 95% CI) | 0.33 [0.20, 0.53] |
| 5.5.2 1 to 3 months | 1 | 114 | Risk Ratio (M‐H, Fixed, 95% CI) | 0.61 [0.49, 0.75] |
| 5.5.3 4 to 6 months | 2 | 183 | Risk Ratio (M‐H, Fixed, 95% CI) | 0.28 [0.15, 0.53] |
| 5.5.4 > 6 months | 1 | 105 | Risk Ratio (M‐H, Fixed, 95% CI) | 0.66 [0.44, 0.99] |
| 5.6 Vitamin D insufficiency (25‐OH vitamin D < 50 nmol/L): timing of commencement | 5 | Risk Ratio (M‐H, Fixed, 95% CI) | Subtotals only | |
| 5.6.1 From birth | 4 | 431 | Risk Ratio (M‐H, Fixed, 95% CI) | 0.45 [0.37, 0.55] |
| 5.6.2 From 1 month age | 1 | 81 | Risk Ratio (M‐H, Fixed, 95% CI) | 0.88 [0.40, 1.94] |
| 5.7 Vitamin D insufficiency (25‐OH vitamin D < 50 nmol/L): sensitivity analysis | 5 | Risk Ratio (M‐H, Fixed, 95% CI) | Subtotals only | |
| 5.7.1 Studies of good methodology | 2 | 216 | Risk Ratio (M‐H, Fixed, 95% CI) | 0.43 [0.34, 0.56] |
| 5.7.2 Other studies | 3 | 296 | Risk Ratio (M‐H, Fixed, 95% CI) | 0.52 [0.39, 0.69] |
| 5.8 Vitamin D deficiency: 25‐OH vitamin D < 30 nmol/L: infant risk | 5 | Risk Ratio (M‐H, Fixed, 95% CI) | Subtotals only | |
| 5.8.1 Higher‐risk | 5 | 512 | Risk Ratio (M‐H, Fixed, 95% CI) | 0.15 [0.09, 0.24] |
| 5.9 Vitamin D deficiency: 25‐OH vitamin D < 30 nmol/L: season of supplementation | 5 | Risk Ratio (M‐H, Fixed, 95% CI) | Subtotals only | |
| 5.9.1 Supplementation not seasonal | 5 | 512 | Risk Ratio (M‐H, Fixed, 95% CI) | 0.15 [0.09, 0.24] |
| 5.10 Vitamin D deficiency: 25‐OH vitamin D < 30 nmol/L: D2 versus D3 | 5 | Risk Ratio (M‐H, Fixed, 95% CI) | Subtotals only | |
| 5.10.1 Vitamin D3 | 5 | 512 | Risk Ratio (M‐H, Fixed, 95% CI) | 0.15 [0.09, 0.24] |
| 5.11 Vitamin D deficiency: 25‐OH vitamin D < 30 nmol/L: dosage | 5 | 512 | Risk Ratio (M‐H, Fixed, 95% CI) | 0.15 [0.09, 0.24] |
| 5.11.1 400 to 2000 IU/day | 2 | 186 | Risk Ratio (M‐H, Fixed, 95% CI) | 0.40 [0.20, 0.81] |
| 5.11.2 > 2000 to 4000 IU/day | 2 | 216 | Risk Ratio (M‐H, Fixed, 95% CI) | 0.05 [0.02, 0.15] |
| 5.11.3 > 4000 IU/day | 1 | 110 | Risk Ratio (M‐H, Fixed, 95% CI) | 0.17 [0.06, 0.46] |
| 5.12 Vitamin D deficiency: 25‐OH vitamin D < 30 nmol/L: duration of supplementation | 5 | 512 | Risk Ratio (M‐H, Fixed, 95% CI) | 0.15 [0.09, 0.24] |
| 5.12.1 < 1 month | 1 | 110 | Risk Ratio (M‐H, Fixed, 95% CI) | 0.17 [0.06, 0.46] |
| 5.12.2 1 to 3 months | 1 | 114 | Risk Ratio (M‐H, Fixed, 95% CI) | 0.06 [0.02, 0.17] |
| 5.12.3 4 to 6 months | 2 | 183 | Risk Ratio (M‐H, Fixed, 95% CI) | 0.15 [0.05, 0.45] |
| 5.12.4 > 6 months | 1 | 105 | Risk Ratio (M‐H, Fixed, 95% CI) | 0.45 [0.19, 1.09] |
| 5.13 Vitamin D deficiency: 25‐OH vitamin D < 30 nmol/L: timing of commencement | 5 | Risk Ratio (M‐H, Fixed, 95% CI) | Subtotals only | |
| 5.13.1 From birth | 4 | 431 | Risk Ratio (M‐H, Fixed, 95% CI) | 0.13 [0.08, 0.23] |
| 5.13.2 From 1 month age | 1 | 81 | Risk Ratio (M‐H, Fixed, 95% CI) | 0.32 [0.10, 1.02] |
| 5.14 Vitamin D deficiency: 25‐OH vitamin D < 30 nmol/L: sensitivity analysis | 5 | 512 | Risk Ratio (M‐H, Fixed, 95% CI) | 0.15 [0.09, 0.24] |
| 5.14.1 Studies of good methodology | 2 | 216 | Risk Ratio (M‐H, Fixed, 95% CI) | 0.05 [0.02, 0.15] |
| 5.14.2 Other studies | 3 | 296 | Risk Ratio (M‐H, Fixed, 95% CI) | 0.28 [0.16, 0.50] |
| 5.15 Nutritional rickets: biochemical: subgroup analyses | 2 | Risk Ratio (M‐H, Fixed, 95% CI) | Subtotals only | |
| 5.15.1 Higher‐risk infants: Oral D3 60,000 IU/day for 10 days | 1 | 115 | Risk Ratio (M‐H, Fixed, 95% CI) | 0.05 [0.00, 0.84] |
| 5.15.2 Higher‐risk infants: Oral D3 60,000 IU postpartum and at 6, 10, and 14 weeks | 1 | 114 | Risk Ratio (M‐H, Fixed, 95% CI) | 0.16 [0.02, 1.29] |
| 5.16 Nutritional rickets: biochemical: sensitivity analysis | 2 | Risk Ratio (M‐H, Fixed, 95% CI) | Subtotals only | |
| 5.16.1 Studies of good methodology | 1 | 114 | Risk Ratio (M‐H, Fixed, 95% CI) | 0.16 [0.02, 1.29] |
| 5.16.2 Other studies | 1 | 115 | Risk Ratio (M‐H, Fixed, 95% CI) | 0.05 [0.00, 0.84] |
| 5.17 Nutritional rickets: radiological: infant risk | 3 | Risk Ratio (M‐H, Fixed, 95% CI) | Subtotals only | |
| 5.17.1 Higher‐risk | 3 | 536 | Risk Ratio (M‐H, Fixed, 95% CI) | 0.76 [0.18, 3.31] |
| 5.18 Nutritional rickets: radiological: season of supplementation | 3 | Risk Ratio (M‐H, Fixed, 95% CI) | Subtotals only | |
| 5.18.1 Supplementation not seasonal | 3 | 536 | Risk Ratio (M‐H, Fixed, 95% CI) | 0.76 [0.18, 3.31] |
| 5.19 Nutritional rickets: radiological: D2 versus D3 | 3 | Risk Ratio (M‐H, Fixed, 95% CI) | Subtotals only | |
| 5.19.1 Vitamin D3 | 3 | 536 | Risk Ratio (M‐H, Fixed, 95% CI) | 0.76 [0.18, 3.31] |
| 5.20 Nutritional rickets: radiological: dosage | 3 | 536 | Risk Ratio (M‐H, Fixed, 95% CI) | 0.76 [0.18, 3.31] |
| 5.20.1 > 2000 to 4000 IU/day | 2 | 421 | Risk Ratio (M‐H, Fixed, 95% CI) | 0.48 [0.05, 5.18] |
| 5.20.2 > 4000 IU/day | 1 | 115 | Risk Ratio (M‐H, Fixed, 95% CI) | 1.05 [0.15, 7.23] |
| 5.21 Nutritional rickets: radiological: duration of supplementation | 3 | 536 | Risk Ratio (M‐H, Fixed, 95% CI) | 0.76 [0.18, 3.31] |
| 5.21.1 < 1 month | 1 | 115 | Risk Ratio (M‐H, Fixed, 95% CI) | 1.05 [0.15, 7.23] |
| 5.21.2 4 to 6 months | 2 | 421 | Risk Ratio (M‐H, Fixed, 95% CI) | 0.48 [0.05, 5.18] |
| 5.22 Nutritional rickets: radiological: timing of commencement | 3 | Risk Ratio (M‐H, Fixed, 95% CI) | Subtotals only | |
| 5.22.1 From birth | 3 | 536 | Risk Ratio (M‐H, Fixed, 95% CI) | 0.76 [0.18, 3.31] |
| 5.23 Nutritional rickets: radiological: sensitivity analysis | 3 | Risk Ratio (M‐H, Fixed, 95% CI) | Subtotals only | |
| 5.23.1 Studies of good methodology | 2 | 421 | Risk Ratio (M‐H, Fixed, 95% CI) | 0.48 [0.05, 5.18] |
| 5.23.2 All studies | 1 | 115 | Risk Ratio (M‐H, Fixed, 95% CI) | 1.05 [0.15, 7.23] |
| 5.24 Adverse effects (hypercalcaemia): subgroup analyses | 3 | Risk Ratio (M‐H, Fixed, 95% CI) | Subtotals only | |
| 5.24.1 Oral D3 120 000 IU within 7 days of delivery, then 1.5, 2.5 and 3.5 months, then monthly till 9 months (equivalent to D3 890 IU/day) | 1 | 101 | Risk Ratio (M‐H, Fixed, 95% CI) | 1.19 [0.43, 3.29] |
| 5.24.2 Oral D3 4000 IU/day till 26 weeks | 1 | 371 | Risk Ratio (M‐H, Fixed, 95% CI) | 1.99 [0.18, 21.75] |
| 5.24.3 Oral D3 50 000 IU monthly from 4 weeks to 16 weeks (equivalent to D3 1670 IU/day) | 1 | 85 | Risk Ratio (M‐H, Fixed, 95% CI) | Not estimable |
| 5.25 Adverse effects (hypercalcaemia): sensitivity analysis | 3 | Risk Ratio (M‐H, Fixed, 95% CI) | Subtotals only | |
| 5.25.1 Studies of good methodology | 1 | 371 | Risk Ratio (M‐H, Fixed, 95% CI) | 1.99 [0.18, 21.75] |
| 5.25.2 Other studies | 2 | 186 | Risk Ratio (M‐H, Fixed, 95% CI) | 1.19 [0.43, 3.29] |
| 5.26 Serum 25‐OH vitamin D level at latest time reported to six months of age: infant risk | 7 | Mean Difference (IV, Fixed, 95% CI) | Subtotals only | |
| 5.26.1 Higher‐risk | 5 | 516 | Mean Difference (IV, Fixed, 95% CI) | 26.87 [23.45, 30.29] |
| 5.26.2 Lower‐risk | 2 | 81 | Mean Difference (IV, Fixed, 95% CI) | 17.01 [10.76, 23.26] |
| 5.27 Serum 25‐OH vitamin D level at latest time reported to six months of age: season of supplementation | 7 | Mean Difference (IV, Fixed, 95% CI) | Subtotals only | |
| 5.27.1 Supplementation non‐seasonal | 7 | 597 | Mean Difference (IV, Fixed, 95% CI) | 24.60 [21.59, 27.60] |
| 5.28 Serum 25‐OH vitamin D level at latest time reported to six months of age: D2 versus D3 | 7 | Mean Difference (IV, Fixed, 95% CI) | Subtotals only | |
| 5.28.1 Vitamin D3 | 7 | 597 | Mean Difference (IV, Fixed, 95% CI) | 24.60 [21.59, 27.60] |
| 5.29 Serum 25‐OH vitamin D level at latest time reported to six months of age: dosage | 7 | Mean Difference (IV, Fixed, 95% CI) | Subtotals only | |
| 5.29.1 400 to 2000 IU/day | 3 | 258 | Mean Difference (IV, Fixed, 95% CI) | 15.61 [9.83, 21.39] |
| 5.29.2 > 2000 to 4000 IU/day | 3 | 229 | Mean Difference (IV, Fixed, 95% CI) | 27.58 [23.97, 31.19] |
| 5.29.3 > 4000 IU/day | 1 | 110 | Mean Difference (IV, Fixed, 95% CI) | 33.65 [18.49, 48.81] |
| 5.30 Serum 25‐OH vitamin D level at latest time reported to six months of age: duration of supplementation | 7 | Mean Difference (IV, Fixed, 95% CI) | Subtotals only | |
| 5.30.1 < 1 month | 1 | 110 | Mean Difference (IV, Fixed, 95% CI) | 33.65 [18.49, 48.81] |
| 5.30.2 1 to 3 months | 2 | 81 | Mean Difference (IV, Fixed, 95% CI) | 17.01 [10.76, 23.26] |
| 5.30.3 4 to 6 months | 3 | 301 | Mean Difference (IV, Fixed, 95% CI) | 27.78 [24.07, 31.49] |
| 5.30.4 >6 months | 1 | 105 | Mean Difference (IV, Fixed, 95% CI) | 15.50 [4.62, 26.38] |
| 5.31 Serum 25‐OH vitamin D level at latest time reported to six months of age: timing of commencement | 7 | Mean Difference (IV, Fixed, 95% CI) | Subtotals only | |
| 5.31.1 From birth | 6 | 512 | Mean Difference (IV, Fixed, 95% CI) | 24.85 [21.82, 27.88] |
| 5.31.2 From 1 month age | 1 | 85 | Mean Difference (IV, Fixed, 95% CI) | 11.42 [‐10.27, 33.11] |
| 5.32 Serum 25‐OH vitamin D level at latest time reported to six months of age: sensitivity analysis | 7 | Mean Difference (IV, Fixed, 95% CI) | Subtotals only | |
| 5.32.1 Studies of good methodology | 2 | 216 | Mean Difference (IV, Fixed, 95% CI) | 28.28 [24.51, 32.04] |
| 5.32.2 Other studies | 5 | 381 | Mean Difference (IV, Fixed, 95% CI) | 18.19 [13.22, 23.16] |
Comparison 6. Vitamin D given to infants compared to vitamin D given to lactating mothers: sensitivity analysis.
| Outcome or subgroup title | No. of studies | No. of participants | Statistical method | Effect size |
|---|---|---|---|---|
| 6.1 Vitamin D insufficiency: 25‐OH vitamin D < 50 nmol/L: subgroup analysis | 4 | 334 | Risk Ratio (M‐H, Fixed, 95% CI) | 0.61 [0.40, 0.94] |
| 6.1.1 Infant 400 IU/day versus maternal 400 to 2000 IU/day | 2 | 141 | Risk Ratio (M‐H, Fixed, 95% CI) | 0.06 [0.01, 0.37] |
| 6.1.2 Infant 400 IU/day versus maternal > 4000 IU/day | 1 | 95 | Risk Ratio (M‐H, Fixed, 95% CI) | 1.02 [0.15, 6.95] |
| 6.1.3 Infant 400 IU/day versus maternal D3 120 000 IU at delivery, 1.5, 2.5 and 3.5 months, then monthly till 9 months | 1 | 98 | Risk Ratio (M‐H, Fixed, 95% CI) | 1.03 [0.63, 1.68] |
| 6.2 Vitamin D insufficiency: 25‐OH vitamin D < 50 nmol/L: sensitivity analysis | 4 | Risk Ratio (M‐H, Fixed, 95% CI) | Subtotals only | |
| 6.2.1 Other studies | 4 | 334 | Risk Ratio (M‐H, Fixed, 95% CI) | 0.61 [0.40, 0.94] |
| 6.3 Vitamin D deficiency: 25‐OH vitamin D < 30 nmol/L: subgroup analysis | 4 | 334 | Risk Ratio (M‐H, Fixed, 95% CI) | 0.35 [0.17, 0.72] |
| 6.3.1 Infant 400 IU/day versus maternal 400 to 2000 IU/day | 2 | 141 | Risk Ratio (M‐H, Fixed, 95% CI) | 0.06 [0.01, 0.37] |
| 6.3.2 Infant 400 IU/day versus maternal > 4000 IU/day | 1 | 95 | Risk Ratio (M‐H, Fixed, 95% CI) | 1.02 [0.15, 6.95] |
| 6.3.3 Infant 400 IU/day versus maternal D3 120 000 IU at delivery, 1.5, 2.5 and 3.5 months, then monthly till 9 months | 1 | 98 | Risk Ratio (M‐H, Fixed, 95% CI) | 0.90 [0.30, 2.77] |
| 6.4 Vitamin D deficiency: 25‐OH vitamin D < 30 nmol/L: sensitivity analysis | 4 | Risk Ratio (M‐H, Fixed, 95% CI) | Subtotals only | |
| 6.4.1 Other studies | 4 | 334 | Risk Ratio (M‐H, Fixed, 95% CI) | 0.35 [0.17, 0.72] |
| 6.5 Nutritional rickets: biochemical: sensitivity analysis | 1 | Risk Ratio (M‐H, Fixed, 95% CI) | Subtotals only | |
| 6.5.1 Other studies | 1 | 92 | Risk Ratio (M‐H, Fixed, 95% CI) | Not estimable |
| 6.6 Adverse effects (hypercalcaemia): subgroup and sensitivity analyses | 1 | Risk Ratio (M‐H, Fixed, 95% CI) | Subtotals only | |
| 6.6.1 Other studies: infant D3 400 IU/day versus maternal D3 3000 μg (120 000 IU) at birth, 1.5, 2.5 and 3.5 months, then monthly to 9 months | 1 | 97 | Risk Ratio (M‐H, Fixed, 95% CI) | 1.22 [0.48, 3.09] |
| 6.7 Serum 25‐OH vitamin D level at latest time reported to six months of age: subgroup analysis | 4 | 269 | Mean Difference (IV, Fixed, 95% CI) | 14.35 [9.64, 19.06] |
| 6.7.1 Infant 400 IU/day versus maternal 400 to 2000 IU/day | 1 | 47 | Mean Difference (IV, Fixed, 95% CI) | 36.80 [26.78, 46.82] |
| 6.7.2 Infant 400 IU/day versus maternal > 2000 to 4000 IU/day | 1 | 30 | Mean Difference (IV, Fixed, 95% CI) | 13.50 [6.45, 20.55] |
| 6.7.3 Infant 400 IU/day versus maternal > 4000 IU/day | 1 | 95 | Mean Difference (IV, Fixed, 95% CI) | 0.60 [‐13.48, 14.68] |
| 6.7.4 Infant 400 IU/day versus maternal D3 120 000 IU at delivery, 1.5, 2.5 and 3.5 months, then monthly till 9 months | 1 | 97 | Mean Difference (IV, Fixed, 95% CI) | 0.50 [‐9.54, 10.54] |
| 6.8 Serum 25‐OH vitamin D level at latest time reported to six months of age: sensitivity analysis | 4 | Mean Difference (IV, Fixed, 95% CI) | Subtotals only | |
| 6.8.1 Other studies | 4 | 269 | Mean Difference (IV, Fixed, 95% CI) | 14.35 [9.64, 19.06] |
Characteristics of studies
Characteristics of included studies [ordered by study ID]
Ala‐Houhala 1985.
| Study characteristics | ||
| Methods | 3‐arm, randomised controlled study Setting: Finland (61ðN) during winter and summer months |
|
| Participants | 92 infant‐mother pairs Infant: healthy term breastfed infants Mother: half of the mothers had vitamin D supplementation (500 IU per day) during pregnancy (varying duration from full pregnancy and from mid trimester). Mother‐infant pairs that failed to exclusively breastfeed were excluded. |
|
| Interventions | Group 1: mothers given oral vitamin D 1000 IU per day from birth till 20 weeks, infants not supplemented (n = 32) Group 2: infants given oral vitamin D 400 IU per day from birth till 20 weeks (n = 31) Group 3: infants given oral vitamin D 1000 IU per day from birth till 20 weeks (n = 29) |
|
| Outcomes |
|
|
| Notes | Data from a pilot study reported in the same report not included. Data for winter groups at 8 weeks only extractable from report Correspondence to Dr M Ala‐Houhala, Department of Clinical Sciences, University of Tampere, Teiskontic 35, SF‐33520 Tampere, Finland Dr Ala‐Houhala is no longer at University of Tampere (email correspondence). Trial registration not found. |
|
| Risk of bias | ||
| Bias | Authors' judgement | Support for judgement |
| Random sequence generation (selection bias) | Unclear risk | Not reported |
| Allocation concealment (selection bias) | Unclear risk | Reported as (quote:) "randomly allocated" without further description |
| Blinding of participants and personnel (performance bias) All outcomes | High risk | Not blinded as no placebo was used |
| Blinding of outcome assessment (detection bias) All outcomes | Low risk | Not reported. However, all outcomes were unlikely to affected by lack of blinding. |
| Incomplete outcome data (attrition bias) All outcomes | Unclear risk | 9 mother‐infant pairs were excluded from analysis because of failure to completely breastfeed. It was not known which group they belonged to. |
| Selective reporting (reporting bias) | High risk | No protocol available. Unclear primary outcome. Number of infants with vitamin D deficiency was reported only for Group 1. |
| Other bias | Unclear risk | Baseline characteristics not reported |
Ala‐Houhala 1986.
| Study characteristics | ||
| Methods | 3‐arm quasi‐randomised controlled study Setting: Finland (61ðN) during winter months |
|
| Participants | 49 infant‐mother pairs Infant: term, healthy, breastfeeding Mother: healthy women; some mothers received vitamin D during pregnancy 500 IU either throughout pregnancy (n = 8) or during 2nd trimester (n = 8). |
|
| Interventions | Group 1: mothers given oral vitamin D3 2000 IU per day for 15 weeks; infants not supplemented (n = 17) Group 2: mothers given oral vitamin D3 1000 IU per day for 15 weeks; infants not supplemented (n = 16) Group 3: mothers not supplemented, infants given oral vitamin D2 400 IU per day for 15 weeks (n = 16) |
|
| Outcomes |
|
|
| Notes | Correspondence to Dr M Ala‐Houhala, Department of Clinical Sciences, University of Tampere, Teiskontic 35, SF‐33520 Tampere, Finland Dr Ala‐Houhala is no longer at University of Tampere (email correspondence). Trial registration not found. |
|
| Risk of bias | ||
| Bias | Authors' judgement | Support for judgement |
| Random sequence generation (selection bias) | Unclear risk | Quote: "Subjects divided in succession into three groups". However, the method was not described. |
| Allocation concealment (selection bias) | Unclear risk | Method of allocation not described |
| Blinding of participants and personnel (performance bias) All outcomes | High risk | Not blinded as no placebo was used |
| Blinding of outcome assessment (detection bias) All outcomes | Low risk | Not reported. However all outcomes were unlikely to affected by lack of blinding. |
| Incomplete outcome data (attrition bias) All outcomes | Unclear risk | Unclear whether all participants completed study |
| Selective reporting (reporting bias) | Unclear risk | Protocol not available. Primary outcomes unclear |
| Other bias | Unclear risk | Baseline characteristics not reported |
Alonso 2011.
| Study characteristics | ||
| Methods | Parallel‐group, randomised controlled trial Setting: Spain (43ðN), all year |
|
| Participants | 23 exclusively breastfed infants Inclusion criteria: term healthy infants in the first 15 days of life Exclusion criteria: chronic disease, use of medications known to affect vitamin D metabolism, refusal to participate, prematurity, dark skin pigmentation, sunlight exclusion for cultural or religious reasons, breastfeeding by vegetarian mothers |
|
| Interventions | Intervention: infant oral vitamin D 402 IU per day (67 IU cholecalciferol per drop) from 1 to 12 months of age (n = 10) Control: no intervention (n = 13) |
|
| Outcomes |
|
|
| Notes | The study had a total of 88 mother‐infant pairs. Only the data for the 23 exclusively breastfed infants were used. Trial registration not found. | |
| Risk of bias | ||
| Bias | Authors' judgement | Support for judgement |
| Random sequence generation (selection bias) | Low risk | Used computer‐generated sequence (Epi Dat 3.1) |
| Allocation concealment (selection bias) | Low risk | Phone call assignment |
| Blinding of participants and personnel (performance bias) All outcomes | High risk | Not blinded as no control group |
| Blinding of outcome assessment (detection bias) All outcomes | Low risk | No control group. However all outcomes were unlikely to affected by lack of blinding. |
| Incomplete outcome data (attrition bias) All outcomes | High risk | The intervention group had more dropouts by 12 months than control group (37.5% compared to 20%). Reasons for dropouts included non‐compliance and biochemical alteration. |
| Selective reporting (reporting bias) | Unclear risk | Protocol unavailable |
| Other bias | Low risk | Groups similar at baseline |
Chandy 2016.
| Study characteristics | ||
| Methods | 3‐arm randomised controlled trial Setting: India (26ðN), all year |
|
| Participants | 230 mother‐infant pairs Inclusion criteria: mothers with healthy infants who intend to exclusively breastfeed for the first 6 months Exclusion criteria: infant birth weight less than 2 kg, sick neonate admitted to the intensive care unit, mother or infant on treatment with anticonvulsants or antitubercular drugs and mothers who had received any vitamin D other than the 10 μg present in Ca tablets |
|
| Interventions | Group 1: mothers given single oral vitamin D3 3000 μg (120,000 IU) within 7 days of delivery, and then 3000 μg at 1.5, 2.5 andÃÂ 3.5 months, and then oral vitamin D3 3000 μg monthly up until 9 months ÃÂ Infants were given placebo syrup (n = 74). Group 2: infants given oral vitamin D3 10 μg (400 IU) daily for 9 months. Mothers received placebo sachets (n = 78). Group 3: mothers and infants given placebo (n = 78) Co–intervention for all 3 groups: daily sun exposure with 15‐minute traditional massage daily. All mothers were given 500 mg of elemental Ca daily and instructions about dietary sources of calcium. |
|
| Outcomes |
|
|
| Notes | Clinical trial registration: CTRI/2012/09/002958 Mothers had vitamin D 25‐OH levels that averaged in the deficiency range (30 nmol/L) at baseline. |
|
| Risk of bias | ||
| Bias | Authors' judgement | Support for judgement |
| Random sequence generation (selection bias) | Low risk | Computer‐generated randomisation used |
| Allocation concealment (selection bias) | Unclear risk | Not described. Quote: “Allocation was done by one research staff who supervised medication distribution”. |
| Blinding of participants and personnel (performance bias) All outcomes | Low risk | Placebo used for infants and mothers were in the similar form as the intervention (syrup and sachet respectively). |
| Blinding of outcome assessment (detection bias) All outcomes | Low risk | Placebo used for infants and mothers were in the similar form as the intervention (syrup and sachet respectively). |
| Incomplete outcome data (attrition bias) All outcomes | High risk | High number of attrition in all groups but they were balanced (approximately 30% to 40% dropouts per group). Dropouts were excluded from analysis. |
| Selective reporting (reporting bias) | Unclear risk | No protocol available. Duration of intervention was 9 months, but the primary outcomes were measured at 3.5 months only. |
| Other bias | Low risk | Groups similar at baseline |
Greer 1981.
| Study characteristics | ||
| Methods | Parallel‐group, randomised controlled trial Setting: USA (39ðN) during summer and winter months |
|
| Participants | 18 breast‐fed infants Inclusion criteria: term, healthy exclusively breast‐fed infants between 2 to 3 weeks of life Exclusion criteria: major congenital anomalies, bone disorders, and gastrointestinal disease |
|
| Interventions | Intervention: oral vitamin D2 (ergocalciferol) (suspended in propylene glycol) 400 IU per day until 12 weeks of life (n = 9) Placebo:ÃÂ placebo (propylene glycol) once a day until 12 weeks of life (n = 9) |
|
| Outcomes |
|
|
| Notes | Trial registration not found. | |
| Risk of bias | ||
| Bias | Authors' judgement | Support for judgement |
| Random sequence generation (selection bias) | Unclear risk | Reported (quote:) "divided randomly into two groups"'. However, the method was not described. |
| Allocation concealment (selection bias) | Unclear risk | Not described |
| Blinding of participants and personnel (performance bias) All outcomes | Low risk | (Quote:) “Double blind” fashion. The intervention was prepared in the same solution as the placebo. |
| Blinding of outcome assessment (detection bias) All outcomes | Low risk | (Quote:) “Double blind” fashion. The intervention was prepared in the same solution as the placebo. Blinding revealed at 26 weeks |
| Incomplete outcome data (attrition bias) All outcomes | Low risk | None reported |
| Selective reporting (reporting bias) | Unclear risk | Protocol not available. Length was reported completely but weight and head circumference were not reported other than (quote:) “normal”. |
| Other bias | Unclear risk | Baseline characteristics not reported |
Greer 1989.
| Study characteristics | ||
| Methods | Parallel‐group, randomised controlled trial Setting: USA (43ðN), all year |
|
| Participants | 46 breast‐fed infants Inclusion criteria: term, healthy,ÃÂ breast‐fed Exclusion criteria: major congenital anomalies, neurologic disorders, and gastrointestinal disease |
|
| Interventions | Intervention: oral vitamin D2 (ergocalciferol) (suspended in propylene glycol) 400 IU per day for 6 months (n = 22) Control: placebo (oral propylene glycol) once a day for 6 monthsÃÂ (n = 24)ÃÂ |
|
| Outcomes |
|
|
| Notes | An additional 12 full‐term, healthy, exclusively formula‐fed infants recruited as a comparison group was not included. Trial registration not found. |
|
| Risk of bias | ||
| Bias | Authors' judgement | Support for judgement |
| Random sequence generation (selection bias) | Unclear risk | Method of randomisation not described. The comparison group separate from the randomisation was not included. |
| Allocation concealment (selection bias) | Unclear risk | Method of allocation not described |
| Blinding of participants and personnel (performance bias) All outcomes | Low risk | The intervention was prepared in the same solution as the placebo. |
| Blinding of outcome assessment (detection bias) All outcomes | Low risk | The intervention was prepared in the same solution as the placebo. |
| Incomplete outcome data (attrition bias) All outcomes | Low risk | Both groups had an equal number of dropouts because they did not exclusively breastfeed. These were excluded from analysis. |
| Selective reporting (reporting bias) | Unclear risk | No protocol available |
| Other bias | Low risk | Groups similar at baseline |
Hollis 2015.
| Study characteristics | ||
| Methods | Parallel‐group, randomised controlled trial Setting: 2 cities in USA (33úN and 43úN), all year |
|
| Participants | 334 infant‐mother pairs Inclusion criteria: exclusively breastfeeding mothers and their singleton infants receiving no other form of nutrition than human milk at the time of study entry within 4 to 6 weeks postpartum, if they planned to continue exclusive/full breastfeeding for the next 6 months. Infants must be > 35 weeks' gestation and healthy. Exclusion criteria: mothers with pre‐existing type I or II diabetes, hypertension, parathyroid disease, and uncontrolled thyroid disease; infants below 35 weeks’ gestation, with a history of > 72 hours in the NICU; any inborn error of metabolism; history of congenital anomalies; those who chose to combination feed after enrolment and before the 4‐month study visit were excluded from the study. |
|
| Interventions | Intervention: oral vitamin D3 400 IU per day given to infants for 6 months. Placebo to mothers (n = 169) Control: oral vitamin D3 6000 IU per day given to mothers for 6 months. Placebo to infants (n = 165) Co‐intervention: mothers in both groups received a prenatal vitamin containing 400 IU vitamin D3 per day. |
|
| Outcomes |
Definition of vitamin D deficiency: 25‐OH vitaminD < 50 nmol/L or < 20 ng/mL |
|
| Notes | It was initially a 3‐arm trial (the 3rd arm: Mother: 2400 IU (2000 vitamin D3 per day and 1 prenatal dose containing 400 IU vitamin D3) Infant: placebo for 6 months) but this arm was stopped early by the Data and Safety Monitoring Committee due to safety concerns for the infants. |
|
| Risk of bias | ||
| Bias | Authors' judgement | Support for judgement |
| Random sequence generation (selection bias) | Low risk | Computer‐generated sequence used. Quote: "Mothers were randomized to 1 of the 3 treatment groups using Proc Plan in SAS". |
| Allocation concealment (selection bias) | Low risk | Centralised computer allocation used |
| Blinding of participants and personnel (performance bias) All outcomes | Low risk | Quote: "Investigators, study team,and subject remained blinded to treatment assignment." Placebo used was identical in appearance and taste to the vitamin D3 supplements used. |
| Blinding of outcome assessment (detection bias) All outcomes | Low risk | Quote: "Investigators, study team,and subject remained blinded to treatment assignment." Placebo used was identical in appearance and taste to the vitamin D3 supplements used. |
| Incomplete outcome data (attrition bias) All outcomes | High risk | One arm with 55 participants was stopped early due to safety concerns in infants and was excluded from analysis. |
| Selective reporting (reporting bias) | Low risk | Protocol available. All outcomes specified in the protocol were reported. |
| Other bias | Low risk | Groups similar at baseline |
Madar 2009.
| Study characteristics | ||
| Methods | Cluster‐randomised controlled trial Setting: Norway (60ðN), all year |
|
| Participants | 66 infants (24 exclusively breastfed) Inclusion criteria: 6‐week‐old infants with immigrant background from Pakistan, Turkey and Somalia |
|
| Interventions | Intervention: 5 drops orally 10 microgram (400 IU) vitamin D2 per day + brochure on vitamin D and method of administration for 7 weeks (n = 11) Control: usual care i.e. oral information about vitamin D and recommendation of vitamin D supplementation to the infants for 7 weeks (n = 13) |
|
| Outcomes |
|
|
| Notes | Breastfeeding was not an inclusion criterion. However, a subgroup analysis for exclusively breastfed infants was conducted. Trial registration not found. Intraclass correlation coefficient for vitamin D level reported as 0.72 (Major 2013): Design effect = 1+(3‐1)*0.72 = 2.26 |
|
| Risk of bias | ||
| Bias | Authors' judgement | Support for judgement |
| Random sequence generation (selection bias) | Low risk | Clinics with similar number of children were randomly paired. Within each pair, the names of both child health clinics were placed in a box and one was drawn by an independent person. The clinic drawn was allocated to the intervention group. |
| Allocation concealment (selection bias) | High risk | After clinic assignment, individual consent obtained from potential participants at each clinic (44% declined to participate) |
| Blinding of participants and personnel (performance bias) All outcomes | Low risk | No placebo used. However, all outcomes were not likely influenced by knowledge of the intervention. |
| Blinding of outcome assessment (detection bias) All outcomes | Low risk | Preparation of the blood samples and laboratory analysis were conducted at the clinic, so unlikely they were blinded.ÃÂ However,ÃÂ the statistician conducting the analysis was blinded. |
| Incomplete outcome data (attrition bias) All outcomes | High risk | Excluded 4/26 from the intervention group and 11/40 from the control group who didn't complete the study from analysis (23% excluded) |
| Selective reporting (reporting bias) | Unclear risk | Protocol not available. Outcomes were not completely reported for the subgroup of exclusively breastfed infants. |
| Other bias | High risk | Subgroup analysis was not planned. More infants taking supplements at baseline in the control group and fewer infants exclusively breastfed |
Moodley 2015.
| Study characteristics | ||
| Methods | Parallel‐group randomised controlled trial Setting: Mexico (33ðN ), all year |
|
| Participants | 51 infants Inclusion criteria: healthy infants born to women ≥ 18 years of age at Tijuana General Hospital, Mexico were enrolled within 24 hours after birth and prior to routine BCG vaccine administration. Intention to breast feed was recorded. Exclusion criteria: preterm (< 37 weeks' gestation), had low birth weight (< 2500 g) or had received vitamin D supplementation, mothers had active or recent (within 1 year) tuberculosis disease, HIV infection, maternal fever, or maternal use of vitamin D supplements, steroids or immune‐regulatory medications All infants were breast‐fed at birth. |
|
| Interventions | Intervention: single dose of oral vitamin D3 50,000 IU, given as 0.7 mL of liquid at birth (n = 27) Control: single dose ofÃÂ placebo, given as 0.7 mL of medium chain triglycerides at birth (n = 22) |
|
| Outcomes |
|
|
| Notes | Trial registration not found. | |
| Risk of bias | ||
| Bias | Authors' judgement | Support for judgement |
| Random sequence generation (selection bias) | Low risk | Computer‐generated sequence was used (http://www.randomizer.org). |
| Allocation concealment (selection bias) | Unclear risk | Not described |
| Blinding of participants and personnel (performance bias) All outcomes | Low risk | The intervention and placebo were (quote:) "administered in pre‐filled and pre‐coded syringes that were indistinguishable". |
| Blinding of outcome assessment (detection bias) All outcomes | Low risk | As above |
| Incomplete outcome data (attrition bias) All outcomes | High risk | Very high attrition rate with 76% of participants stopped breastfeeding by 2 months |
| Selective reporting (reporting bias) | Unclear risk | Protocol not available |
| Other bias | Low risk | Groups similar at baseline |
Naik 2017.
| Study characteristics | ||
| Methods | Parallel‐group, randomised controlled trial Setting: India (29ðN), all year |
|
| Participants | 130 infant‐mother pairs Inclusion criteria (infant):ÃÂ healthy, term (37 to 41 completed weeks) infants. Appropriate for gestation age Exclusion criteria (infant): congenital malformations, suspicion of chromosomal anomalies and endocrine disorders, perinatal asphyxia, hypocalcaemia, hypoglycaemia, respiratory distress, or sepsis in the neonatal period Inclusion criteria (mother): had a spontaneous term (37 to 41 completed weeks) healthy pregnancy and single live fetus, admitted in the labour, willing for exclusive breastfeeding and regular follow‐up Exclusion criteria (mother): received vitamin D within last 3 months |
|
| Interventions | Intervention: mothers given oral vitamin D3 (cholecalciferol) 60,000 IU per day within 24 to 48 hours after delivery for 10 days (n = 65) Control: mothers given oral placebo containing inert sugar within 24 to 48 hours after delivery for 10 days (n = 65) Co‐intervention: mothers in both groups received routine supplementation of tablet calcium (elemental calcium 500 mg; vitamin D3 125 IU) as per local postnatal protocol. |
|
| Outcomes |
|
|
| Notes | Indian Council of Medical Research registry trial number: CTRI‐REF/2014/02/006436 | |
| Risk of bias | ||
| Bias | Authors' judgement | Support for judgement |
| Random sequence generation (selection bias) | Low risk | Block randomisation by computer‐generated randomisation table |
| Allocation concealment (selection bias) | Low risk | Allocation by opaque envelope concealment technique |
| Blinding of participants and personnel (performance bias) All outcomes | Unclear risk | Placebo was (quote:) "inert sugar" – it was ÃÂ unclear if it was possible for participants to taste the difference. |
| Blinding of outcome assessment (detection bias) All outcomes | Unclear risk | All outcomes except X‐rays were unlikely to be affected by knowledge of the intervention.ÃÂ Not stated if the radiologist interpreting the X‐ray was blinded |
| Incomplete outcome data (attrition bias) All outcomes | Low risk | Attrition was balanced in both groups. Those who didn't complete the study were excluded from analysis (15/130; 11%). |
| Selective reporting (reporting bias) | Low risk | Protocol available. All prespecified outcomes reported |
| Other bias | Low risk | Groups similar at baseline |
Niramitmahapanya 2017.
| Study characteristics | ||
| Methods | Parallel‐group randomised controlled trial Setting: Thailand (14ðN), all year |
|
| Participants | 72 mother‐infant pairs Inclusion criteria (infant): term (> 37 weeks), healthy, breast‐fed Inclusion criteria (mother): healthy, not vitamin D deficient (defined as 25‐OH vitamin D level < 25 nmol/L) Exclusion criteria (mother): 25‐OH vitamin D level < 25 nmol/L or > 75 nmol/L |
|
| Interventions | Intervention: mothers given oral vitamin D3 1800 IU per day for 6 weeks (n = 37) Control: mothers given oral placebo (not described) for 6 weeks (n = 35) |
|
| Outcomes |
|
|
| Notes | Trial registration not found. | |
| Risk of bias | ||
| Bias | Authors' judgement | Support for judgement |
| Random sequence generation (selection bias) | Low risk | Computer‐generated randomisation |
| Allocation concealment (selection bias) | Unclear risk | Not described |
| Blinding of participants and personnel (performance bias) All outcomes | Unclear risk | Placebo not described. However, attending physician and enrolling personnel were reported to be blinded. |
| Blinding of outcome assessment (detection bias) All outcomes | Low risk | Attending physician and enrolling personnel were reported to be blinded. All outcomes were unlikely to be affected by knowledge of the intervention. |
| Incomplete outcome data (attrition bias) All outcomes | Low risk | Attrition was balanced in both groups. Those who didn't complete study were excluded from analysis (2/68; 3%). |
| Selective reporting (reporting bias) | Unclear risk | Protocol not available |
| Other bias | Low risk | Groups similar at baseline |
Ponnapakkam 2010.
| Study characteristics | ||
| Methods | 3‐arm, randomised controlled trial. Setting: USA (30ðN), unknown season |
|
| Participants | 80 infants; only 25 infants completed the study. Inclusion criteria: term babies with no known bone disorders and those whose parents indicated that they intended to breastfeed (> 50% of total intake) for at least the 1st 3 months of life Exclusion criteria: > 50% supplementation with formula in the first 3 months of life, radiographic evidence of rickets, hypocalcaemic seizure, hypocalcaemia, hypercalcaemia, or hypervitaminosis D (elevated 25‐OH vitamin D levels) |
|
| Interventions | Group 1: infant oral vitamin D drops (0.5 mL) 200 IU per day from birth until 6 months old (n = 8) Group 2: infant oral vitamin D drops (0.5 mL) 200 IU day from 2 months until 6 months old (n = 9) Group 3 (Control): no vitamin D from birth until 6 months old (n = 8) |
|
| Outcomes |
|
|
| Notes | Trial registration not found Only data from group 1 (vitamin D, birth to 6 months) and Group 3 (placebo) used in this review |
|
| Risk of bias | ||
| Bias | Authors' judgement | Support for judgement |
| Random sequence generation (selection bias) | Unclear risk | Not described |
| Allocation concealment (selection bias) | Unclear risk | Not described |
| Blinding of participants and personnel (performance bias) All outcomes | High risk | It was not reported whether the control group (group 3) received any placebo. There was a time difference of 2 months in starting the intervention in groups 1 and 2. |
| Blinding of outcome assessment (detection bias) All outcomes | Unclear risk | All outcomes except X‐rays were unlikely to be affected by knowledge of the intervention. Not stated if the radiologist interpreting the X‐ray was blinded |
| Incomplete outcome data (attrition bias) All outcomes | High risk | High number of loss to attrition (70%) – these participants were excluded because they did not breastfeed. The number excluded in each group was not reported. |
| Selective reporting (reporting bias) | Unclear risk | Protocol not available. Height and weight not reported |
| Other bias | Unclear risk | Baseline characteristics not reported |
Roth 2016.
| Study characteristics | ||
| Methods | 5‐arm, randomised controlled trial Setting: Dhaka, Bangladesh (24úN), all year |
|
| Participants | 1164 mother‐infant pairs Inclusion criteria: mothers at 17 to 24 weeks' gestation based on last menstrual period and or second trimester ultrasound. Infants: as the enrolment was during pregnancy, the gestation of the infant was not included as a criterion. Exclusion criteria: history of medical conditions that may predispose the participant to vitamin D sensitivity, altered vitamin D metabolism or hypercalcaemia, or both, or history of renal calculi; current high‐risk pregnancy based on severe anaemia, proteinuria, or hypertension; multiple gestation, major congenital anomaly, or severe oligohydramnios based on maternal history or ultrasound, or both; unwillingness to stop taking non‐study vitamin D or calcium supplements or a multivitamin with calcium or vitamin D, or both; currently prescribed vitamin D supplements as part of a physician's treatment plan for vitamin D deficiency; previous participation in the same study |
|
| Interventions | Group 1: prenatal oral vitamin D3 600 IU per day until delivery, followed by maternal and infant placebo until 26 weeks' postpartum (n = 260 mothers, 254 infants) Group 2: prenatal oral vitamin D3 2400 IU per day until delivery, followed by maternal and infant placebo until 26 weeks' postpartum (n = 260 mothers, 252 infants) Group 3: prenatal oral vitamin D3 4000 IU per day until delivery, followed by maternal and infant placebo until 26 weeks' postpartum (n = 260 mothers, 252 infants) Group 4: prenatal oral vitamin D3 4000 IU per day until delivery, followed by maternal postnatal oral vitamin D3 4000 IU per day and infant placebo until 26 weeks' postpartum (n = 260 mothers, 249 infants) Group 5 (control) prenatal placebo until delivery, followed by maternal and infant placebo until 26 weeks' postpartum (n = 260 mothers, 247 infants) Co‐intervention: calcium 500 mg/day as calcium carbonate (Calbo; Square Pharmaceuticals, Dhaka, Bangladesh) and iron and folic acid (66 mg elemental iron per day, and 350 μg folic acid per day included in the standard formulation available in Bangladesh) were provided to all mothers throughout the intervention phase (prenatal period and up to 6 months' postpartum. |
|
| Outcomes |
|
|
| Notes | Only data from groups 3 and 4 were used in this review. | |
| Risk of bias | ||
| Bias | Authors' judgement | Support for judgement |
| Random sequence generation (selection bias) | Low risk | Computer‐generated sequence used. Quote: "A computer‐generated, simple randomization scheme was created independently by the trial statistician". |
| Allocation concealment (selection bias) | Low risk | Quote: "Concealment of trial‐group assignments was ensured with the use of pre‐labelled and sequentially numbered but otherwise identical supplement vials." |
| Blinding of participants and personnel (performance bias) All outcomes | Low risk | Tablets containing the different doses of vitamin D3 and placebo were identical in appearance and taste. |
| Blinding of outcome assessment (detection bias) All outcomes | Low risk | Tablets containing the different doses of vitamin D3 and placebo were identical in appearance and taste. |
| Incomplete outcome data (attrition bias) All outcomes | Low risk | All participants were accounted for and attrition balanced between groups (approximately 11% attrition per group). Analysis was a complete‐case, intention‐to‐treat analysis. |
| Selective reporting (reporting bias) | Low risk | Proctocol available. All outcomes specified in the protocol were reported. |
| Other bias | Low risk | Groups were similar at baseline. |
Rothberg 1982.
| Study characteristics | ||
| Methods | 4‐arm, randomised controlled trial Setting: South Africa (26ðS), during mid‐winter to spring |
|
| Participants | 77 mother‐infant pairs Inclusion criteria (mother): white, well‐nourished, nursing mothers who did not take any additional vitamin D from other vitamin preparations or milk. Mothers received only iron and folate supplements during pregnancy. Inclusion criteria (infant): breastfeeding infants, not on vitamin D supplementation |
|
| Interventions | Group 1: Mothers given oral vitamin D 500 IU per day starting from delivery until 6 weeks, infants not supplemented (n = 20) Group 2: Mothers given oral vitamin D 1000 IU per day starting from delivery until 6 weeks, infants not supplemented (n = 20) Group 3: Infants given oral vitamin D 400 IU per day starting from birth until 6 weeks, mothers not supplemented (n = 17) Group 4: Mothers given placebo (not described) starting from delivery until 6 weeks, infants not supplemented (n = 20) |
|
| Outcomes |
|
|
| Notes | Trial registration not found. | |
| Risk of bias | ||
| Bias | Authors' judgement | Support for judgement |
| Random sequence generation (selection bias) | Unclear risk | Reported (quote:) 'randomised' but method not described |
| Allocation concealment (selection bias) | Unclear risk | Not described |
| Blinding of participants and personnel (performance bias) All outcomes | High risk | Reported as (quote:) 'double‐blinded', but no description of the placebo. In some groups, the infants were given the intervention and in others it was the mothers. Likely not able to blind |
| Blinding of outcome assessment (detection bias) All outcomes | Low risk | All outcomes unlikely to be influenced by lack of blinding |
| Incomplete outcome data (attrition bias) All outcomes | High risk | Mothers who stopped breastfeeding were excluded from analysis. The number from each group that were excluded was not balanced. Overall high attrition rate (37/77; 40%) |
| Selective reporting (reporting bias) | Unclear risk | Protocol not available |
| Other bias | Unclear risk | Baseline characteristics not reported |
Rueter 2019.
| Study characteristics | ||
| Methods | Parallel‐group, randomised controlled trial Setting: Perth, Australia,(32ðS) all seasons |
|
| Participants | 195 infants, 89% exclusively or partially breastfed to 6 months Inclusion criteria: healthy term (> 37 weeks’ gestation) singleton infants before 28 days of age. All the infants had a 1st‐degree relative (mother, father, or sibling) with a history of allergic disease (asthma, eczema, and allergic rhinitis). Exclusion criteria: mothers had smoked during pregnancy or had an underlying immunodeficiency/autoimmune disease or those with maternal 25‐hydroxyvitamin D (25‐OH D) serum concentrations less than 50 nmol/L or greater than 100 nmol/L between 36 and 40 weeks’ gestation, intended to reduce the risk of vitamin D deficiency or toxicity in the infant participants |
|
| Interventions | Intervention: 400 IU/day vitamin D3 (Ddrops (Woodbridge, Ontario, Canada) (n = 97)) Control: placebo group received an identical product of coconut and palm kernel oil containing no vitamin D (n = 98). Given to the infants orally as 1 drop of liquid (0.03 mL) per day. Supplementation occurred within 28 days after birth and was stopped at 6 months of age. Caregivers were advised to cease administration of the trial product if the infant was consuming 1000 mL/day or more vitamin D–fortified infant formula. |
|
| Outcomes |
|
|
| Notes | Reported trial registration ACTRN12606000281594 did not document vitamin D groups of published trial. | |
| Risk of bias | ||
| Bias | Authors' judgement | Support for judgement |
| Random sequence generation (selection bias) | Low risk | Quote: "The pharmacy created a randomization plan from an online source (www.randomization.com), for each of the 4 stratification groups." |
| Allocation concealment (selection bias) | Low risk | Quote: "Randomization was conducted by the Princess Margaret Hospital for Children Clinical Trials Pharmacy and stratified according to a history of maternal allergic disease and the participant’s sex." |
| Blinding of participants and personnel (performance bias) All outcomes | Low risk | Quote: "Both the intervention (vitamin D) and control (placebo) oils were packaged to appear identical and to maintain the blind." |
| Blinding of outcome assessment (detection bias) All outcomes | Low risk | Quote: "Pharmacy staff had no contact with participants, and all research staff remained blind to the allocations until analyses were completed." |
| Incomplete outcome data (attrition bias) All outcomes | High risk | Excess losses: blood samples were collected from 140 of 195 infants (72%) (n = 68 from the vitamin D group) at 3 months of age and 141 of 195 infants (72%) (n = 73 from the vitamin D group) at 6 months of age |
| Selective reporting (reporting bias) | Unclear risk | Cited trial registration did not match trial intervention. |
| Other bias | Low risk | Groups similar at baseline. |
Thiele 2017.
| Study characteristics | ||
| Methods | Parallel‐group randomised controlled trial Setting: USA (47ðN) during summer and winter |
|
| Participants | 16 mother‐infant pairs Inclusion criteria (mother): pregnant women between 24 to 28 weeks' gestation, history of breastfeeding with a prior infant and intention to breastfeed for 4 to 6 weeks Exclusion criteria (mother): pre‐existing diabetes, hypertension, parathyroid disease, uncontrolled thyroid disease and use of vitamin D supplements beyond a prenatal supplement for the last 6 months Inclusion criteria (infant): none but all of the mothers delivered term infants during the study |
|
| Interventions | Intervention: mothers given oral vitamin D3 3400 IU daily from 24 to 28 weeks' gestation until 4 to 6 weeks' postpartum (n = 8) Control: mothers given placebo daily from 24 to 28 weeks' gestation until 4 to 6 weeks' postpartum (n = 8) Co‐intervention: both groups received prenatal vitamin containing 400 IU vitamin D3 per day. |
|
| Outcomes |
|
|
| Notes | Trial registration not found. | |
| Risk of bias | ||
| Bias | Authors' judgement | Support for judgement |
| Random sequence generation (selection bias) | Low risk | Used random sequence generator. |
| Allocation concealment (selection bias) | Low risk | Allocation concealment by sealed numbered packets containing intervention or placebo. |
| Blinding of participants and personnel (performance bias) All outcomes | Low risk | Placebo was visually identical to the intervention and packed in identical pill bottles. |
| Blinding of outcome assessment (detection bias) All outcomes | Low risk | As above. |
| Incomplete outcome data (attrition bias) All outcomes | Unclear risk | ITT analysis stated but 3/16 (19%) participants who did not receive the intended intervention were excluded. |
| Selective reporting (reporting bias) | Unclear risk | Protocol not available. |
| Other bias | Unclear risk | Significant baseline difference in maternal calorie intake. |
Trivedi 2020.
| Study characteristics | ||
| Methods | Parallel‐group randomised controlled trial. Setting: India, (29ðN), all year. |
|
| Participants | 132 mother‐infant pairs. Consecutive mothers in labour with term gestation (37 to 41 completed weeks), appropriate for gestational age babies were included. Infants exclusively breastfed Exclusion criteria (mother): those with chronic illnesses like tuberculosis, diabetes mellitus, chronic liver disease, chronic kidney disease, severe anaemia, HIV, hepatitis B, gestational diabetes mellitus, pregnancy‐induced hypertension, hypothyroidism, or who had received vitamin D in the last 3 months (apart from Tab ostocalcium (elemental calcium 500 mg, vitamin D3 250 IU), given during antenatal period under national antenatal programme) Exclusion criteria (infant): infants born with low birth weight, had congenital, chromosomal or endocrinological disorders, suffered perinatal asphyxia, hypocalcaemia, hypoglycaemia, respiratory distress, intracranial infection, or had undergone exchange blood transfusion |
|
| Interventions | Intervention: mothers received oral vitamin D3 60,000 IU (one sachet diluted with water) between 24 and 48 hours' postpartum and at 6, 10, and 14 weeks amounting to total 240,000 IU of vitamin D3 (equivalent to 2450 IU/day) Control: mothers received placebo ('inert' sugar). |
|
| Outcomes |
|
|
| Notes | Trial registration not found At recruitment the serum 25‐OH D was < 20 ng/mL (vitamin D insufficiency) in all the mothers and 99.1% infants. A large number of mothers (90.4%) and their infants (88.6%) had vitamin D deficiency (25‐OH D < 11 ng/mL). |
|
| Risk of bias | ||
| Bias | Authors' judgement | Support for judgement |
| Random sequence generation (selection bias) | Low risk | Computer‐generated randomisation table |
| Allocation concealment (selection bias) | Low risk | Randomisation by a 3rd person who was not directly involved in the study. The allocation of the mother–infant pair to intervention or control group was carried out by a serially numbered opaque sealed envelope concealment technique. |
| Blinding of participants and personnel (performance bias) All outcomes | Low risk | The drug and placebo were similar in texture and appearance. |
| Blinding of outcome assessment (detection bias) All outcomes | Low risk | The randomisation key was decoded in 2 steps. 1st, the serial numbers were converted to either A or B and data were analysed. After the statistical results were available, the 2nd decoding was carried out; ‘‘A’’ stood for vitamin D3 and ‘‘B’’ for placebo. Thus, subjects, investigators and the data analyser were not aware of the characteristics of the 2 groups until the results were revealed. |
| Incomplete outcome data (attrition bias) All outcomes | Low risk | 18 of 132 infants lost (14%); 114 followed up to 6 months. Similar losses in each group. 1 infant excluded who did not exclusively breastfeed. |
| Selective reporting (reporting bias) | Unclear risk | No protocol available. |
| Other bias | Unclear risk | Infants in the control group had higher median vitamin 25‐OH D levels at recruitment. |
Wagner 2006.
| Study characteristics | ||
| Methods | Parallel‐group randomised controlled trial. Setting: USA (34ðN), unknown season. |
|
| Participants | 19 mother‐infant pairs Inclusion criteria (mother): fully lactating mothers who planned to continue full breastfeeding for the next 6 months within 1 month postpartum Exclusion criteria (mother): pre‐existing type I or II diabetes, hypertension, parathyroid disease, and uncontrolled thyroid disease Inclusion criteria (infant): none but all of the infants were term |
|
| Interventions | Group 1: mothers given oral vitamin D3 6400 IU per day; infants given oral placebo 0.5 mL per day for 6 months (n = 9) Group 2: mothers given oral vitamin D3 400 IU per day; infants given oral vitamin D3 300 IU per day for 6 months (n = 10) Co‐intervention to mothers: prenatal vitamin containing vitamin D3 400 IU per day |
|
| Outcomes |
|
|
| Notes | Trial registration not found | |
| Risk of bias | ||
| Bias | Authors' judgement | Support for judgement |
| Random sequence generation (selection bias) | Low risk | Used computer‐generated randomisation. |
| Allocation concealment (selection bias) | Low risk | Central allocation done via the General Clinical Research Center website. |
| Blinding of participants and personnel (performance bias) All outcomes | Low risk | Mother’s placebo was identical in appearance to the vitamin D3 tablets and the infant placebo was identical in appearance, taste and smell to the vitamin D3 drops. |
| Blinding of outcome assessment (detection bias) All outcomes | Low risk | As above. |
| Incomplete outcome data (attrition bias) All outcomes | Low risk | ITT analysis was used. |
| Selective reporting (reporting bias) | Unclear risk | Protocol not available. |
| Other bias | Low risk | Groups similar at baseline. |
Wheeler 2016.
| Study characteristics | ||
| Methods | 3‐arm randomised controlled trial Setting: New Zealand (45úS), all year |
|
| Participants | 90 mother‐infant pairs (women were enrolled at 20 weeks' gestation but intervention started at 4 weeks' postpartum) Inclusion criteria (mother): healthy pregnant women planning to exclusively breastfeed for more than 5 months Exclusion criteria: intent to use vitamin D supplements (either mother or infant) during postpartum period, history of disorders known to affect calcium or vitamin D metabolism, plan to travel outside of NZ and living outside Dunedin Inclusion criteria (infant): term (> 37 weeks) |
|
| Interventions | Group 1: mothers given oral vitamin D3 50 000 IU 1x per month from 4 weeks' postpartum until 16 weeks' postpartum (n = 30) Group 2: mothers given oral vitamin D3 100 000 IU 1x per month from 4 weeks' postpartum until 16 weeks' postpartum (n = 30) Group 3: mothers given placebo 1x per month from 4 weeks' postpartum until 16 weeks' postpartum (n = 30) |
|
| Outcomes |
|
|
| Notes | Australian New Zealand Clinical Trials Registry at www.anzctr.org.au as ACTRN12611000108910 | |
| Risk of bias | ||
| Bias | Authors' judgement | Support for judgement |
| Random sequence generation (selection bias) | Unclear risk | Not described. |
| Allocation concealment (selection bias) | Low risk | Allocation by coded supplement container. Randomisation list kept in a sealed envelope until completion of trial. |
| Blinding of participants and personnel (performance bias) All outcomes | Low risk | Placebo was identical in appearance to the intervention. All study personnel were blinded. |
| Blinding of outcome assessment (detection bias) All outcomes | Low risk | As above. |
| Incomplete outcome data (attrition bias) All outcomes | Low risk | Attrition was balanced in both groups. Those who didn't complete study were excluded from analysis. |
| Selective reporting (reporting bias) | Low risk | Proctocol available. All outcomes specified in the protocol were reported. |
| Other bias | Low risk | Groups similar at baseline. |
ALP: alkaline phosphatase; BCG vaccine: Bacillus Calmette‐Guérin vaccine BMI: Body mass index Ca: calcium ITT: intention‐to‐treat Mg: magnessium NICU: neonatal intensive care unit P: phosphorous PO4: phosphate PTH: parathyroid hormone UV: ultraviolet
Characteristics of excluded studies [ordered by study ID]
| Study | Reason for exclusion |
|---|---|
| Abdel‐Hady 2019 | Enrolled preterm infants gestational age 28 weeks to < 37 weeks. No control group. Study comparing different doses of vitamin D given to infants |
| ACTRN12613000732785 | Randomised trial of vitamin D3 400 iU/day versus placebo in term breastfed infants. Unable to recruit so stopped (author communication) |
| ACTRN12618001174279 | Trial registration. Enrolled preterm infants < 36 weeks' gestation |
| Al‐Beltagi 2020 | Enrolled preterm infants with respiratory distress syndrome comparing 3 different doses of vitamin D (control, 400 iU/day and 800 iU/day) |
| Backstrom 1999 | Not term infants ‐ enrolled 70 preterm infants with birth weight less than 2000 g and gestational age less than 37 weeks |
| Bagnoli 2013 | Not an RCT. 73 infants from a larger cohort of 205 infants were divided according to their feeding type and vitamin D supplementation. |
| Baird 2016 | Ongoing study: intervention given to pregnant women. No postpartum intervention |
| Basile 2006 | No control group. Study comparing different doses of vitamin D given to mothers |
| Bugrul 2013 | Intervention given to mothers. All infants received vitamin D drops of 400 IU/day. |
| Challa 2005 | Not an interventional study |
| Chan 1982 | Observational study |
| Chawes 2016 | Women were randomised to a daily dose of 2400 IU vitamin D3 supplementation or matching placebo tablets from pregnancy week 24 to 1 week postpartum. Primary outcome was age of development of persistent wheeze in the infant in the first 3 years of life. |
| Cooper 2016 | Intervention given to pregnant women. No postpartum intervention |
| Czech‐Kowalska 2013 | Intervention given to mothers. All infants received vitamin D drops of 400 IU/day. |
| Dawudo 2019 | RCT of 6000 IU vitamin D to mother compared with 600 IU vitamin D to mother and 400 IU vitamin D to infants. The 2 groups did not fit the comparisons of this review. |
| Delvin 2005 | Enrolled preterm infants. Multiple vitamin intervention |
| Diogenes 2013 | Intervention given to pregnant women. No postpartum intervention. Trial of calcium plus vitamin D versus placebo |
| Francis 2018 | Enrolled very low birthweight infants < 1500 g |
| Galdo 2018 | Study comparing different doses of vitamin D given to infants |
| Gallo 2013a | No control group. Study comparing different doses of vitamin D given to infants |
| Gallo 2013b | No control group. Study comparing vitamin D2 and vitamin D3 given to infants |
| Grant 2014 | Intervention started antenatally. Intention to breastfeed was not an inclusion criterion. Despite high breastfeeding initiation (95%), exclusive breastfeeding at 6 months was only 12%. |
| Gupta 2018 | No control group. Study comparing different doses of vitamin D given to mothers |
| Hibbs 2018 | Enrolled preterm infants 28 to 36 weeks' gestation |
| Ho 1985 | No vitamin D used. Compared sun exposure to no sun exposure |
| Hollis 2004 | No control group. Study comparing different doses of vitamin D given to mothers |
| Huynh 2015 | No control group. Study comparing different dose regimen of vitamin D given to mothers |
| Ketha 2018 | Compared daily versus bolus dose maternal vitamin D3 supplementation in lactating women |
| Kishore 2019 | Enrolled preterm infants 28 to 36 weeks' gestation |
| Kolodziejczyk 2017 | Ongoing study: Enrolling only preterm infants (24 to 32 weeks' gestation) |
| Kuryaninova 2017 | Not an RCT. Vitamin D doses were selected based on the initial level of calcidiol. Most infants > 6 months age |
| Lara‐Corrales 2013 | Enrolled infants with atopic dermatitis, mean age 15 +/‐ 24 months. Excluded as not "healthy term infants from birth to 6 months age" |
| Litonjua 2014 | Intervention given to pregnant women. No postpartum intervention |
| March 2015 | No control group. Study comparing different doses of vitamin D given to mothers |
| Mirghafourvand 2015 | Intervention given to pregnant women. No postpartum intervention |
| Morris 2017 | Prospective cohort study nested within an RCT (Roth 2016) |
| Nausheen 2018 | Intervention given to pregnant women. No postpartum intervention |
| NCT02713009 | Ongoing study: intervention given to pregnant women. No postpartum intervention |
| Norizoe 2014 | Enrolled breastfed infants with eczema at 1 month of age. Excluded as not "healthy term infants from birth to 6 months age" |
| O'Callaghan 2018 | No control group. Study comparing different doses of vitamin D given to mothers |
| Oberhelman 2013 | No control group. Study comparing different dose regimen of vitamin D given to mothers |
| Onal 2010 | Method of allocation to intervention not reported. Study reported to be a cross‐sectional study |
| Perumal 2017 | Intervention given to pregnant women. No postnatal intervention |
| Rasmussen 2015 | RCT on effect of vitamin D on bone mineral density on pregnant women. No neonatal outcome |
| Roberfroid 2012 | Follow‐up of a cohort of infants born to women randomly assigned to UNICEF/WHO/United Nations University multiple micronutrient supplement for pregnant and lactating women (UNIMMAP) compared with the usual iron and folic acid supplement (IFA) during pregnancy. Intervention given to pregnant women. No postpartum intervention |
| Roberts 1981 | Allocation to intervention was not random. |
| Rosendahl 2017 | No control group. Study comparing different doses of vitamin D given to infants |
| Rostami 2018 | Intervention given to pregnant women. No postpartum intervention |
| Saadi 2009 | Intervention given to mothers. All infants received vitamin D drops of 400 IU/day |
| Salas 2018 | Enrolled extremely preterm infants with gestational ages between 23 and 27 weeks |
| Savino 2011 | Not randomly allocated to intervention |
| Shakiba 2010 | No control group. Study comparing different doses and dose regimens of vitamin D given to infants |
| Siafarikas 2011 | No control group. Study comparing different doses of vitamin D given to infants |
| Terashita 2017 | Not a randomised controlled study |
| Tomimoto 2018 | No control group. Study comparing different doses of vitamin D given to Vitamin D deficient breastfed infants |
| Wagner 2013 | Intervention given to pregnant women. No postnatal intervention |
| Zamora 1999 | Retrospective cohort study |
| Ziegler 2014 | No control group. Study comparing different doses of vitamin D given to infants |
IFA: iron and folic acid PTH: parathyroid hormone RCT: randomised controlled trial UNICEF: United Nations Children's Fund UNIMMAP: UNICEF/WHO/UNU international multiple micronutrient preparation WHO: World Health Organization
Characteristics of studies awaiting classification [ordered by study ID]
Kim 2010.
| Methods | 3‐arm study. Method of randomisation and allocation not reported |
| Participants | Term healthy infants |
| Interventions | Group 1: formula‐fed infants (n = 25) Group 2: breastfed infants without vitamin D supplementation (n = 28) Group 3: breastfed infants + vitamin D 200 IU/day given as 0.5 mL of multivitamin drops, daily from 2 months up till 1 year of age (n = 21) |
| Outcomes |
|
| Notes | Contact email on article invalid |
Wagner 2018.
| Methods | Factorial designed randomised controlled trial |
| Participants | Lactating mothers |
| Interventions | Mothers randomised to receive either 400 vs. 6400 IU vitamin D3/day and infants 400 IU/day or placebo (if mother was in 6400 IU group) |
| Outcomes |
|
| Notes | Published as abstract only. Reported subset of larger study |
HBV: hepatitis B IgG: immunoglobulin G PTH: parathyroid hormone
Characteristics of ongoing studies [ordered by study ID]
ACTRN12614000334606.
| Study name | VITALITY trial: randomised controlled trial to establish the role of postnatal vitamin D supplementation in infant immune health |
| Methods | Blinded randomised controlled trial |
| Participants | Healthy, term, breastfeeding 6 to 8 week‐old infants. Mothers must intend to breastfeed until 6 months old. |
| Interventions | 400 IU vitamin D3‐cholecalciferol (1 drop, 0.03 mL) (Baby D drops) or an identical placebo (1 drop vegetable oil) daily until 12 months of age |
| Outcomes |
|
| Starting date | December 2014. |
| Contact information | michael.field@mcri.edu.au |
| Notes | Estimated date of completion December 2020 |
ACTRN12615000642583.
| Study name | Infants of vitamin D deficient mothers ‐ trial comparing Pentavite and vitamin D3 supplement ‐ effect on vitamin D level at 6 weeks |
| Methods | Randomised controlled trial |
| Participants | Infants of vitamin D deficient mothers aged 3 to 42 days |
| Interventions | Oral pentavite 0.45 mL daily for 6 weeks or single dose of vitamin D3 50,000 units orally on day 3 once low level established |
| Outcomes |
|
| Starting date | 1 October 2012 |
| Contact information | Dr Simon Costello. Email: costellosimon@bigpond.com |
| Notes | Author communication sent |
ACTRN12618001992291.
| Study name | The Vaccination Infant Supplementation (VISS) Study ‐ assessing the effect of vitamin D and probiotic supplementation around vaccination on infant's temperature and sleep pattern |
| Methods | Randomised placebo controlled trial |
| Participants | Infants who have not yet been immunised (age range: 4 to 24 months). Infants currently breastfed (e.g. exclusively or breast and formula‐fed) |
| Interventions | 1000 IU vitamin D3 liquid supplied with a 0.25 mL dropper and 2.3 g probiotic powder mixed in milk (breast milk or formula) daily for 2 months |
| Outcomes |
|
| Starting date | 4 February 2019 |
| Contact information | A/Prof Karin Ried. Email: karinried@niim.com.au |
| Notes | Anticipated completion 12/12/2020 |
ChiCTR1800020179.
| Study name | Study for vitamins and fatty acids status of breast milk and effects of related supplementation during lactation on the health of mothers and infants: a randomized clinical trial |
| Methods | Randomised parallel‐group controlled trial |
| Participants | Full‐term, single birth, healthy and disease‐free infants; breastfeeding |
| Interventions | Vitamin A, vitamin D and DHA; control group: placebo |
| Outcomes |
|
| Starting date | 1 January 2019 |
| Contact information | Ye Ding. Email: dy03120319@163.com; Z Wang: email: zhixu.wang@126.com |
| Notes |
DHA: DocosahexaenoicAcid
Differences between protocol and review
We made the following changes to the published protocol (Tan 2018).
We have reported both bone mineral density and bone mineral content as bone mineral density was not reliably reported, and both measures are accepted by the International Society for Clinical Densitometry as indicators of bone health in paediatric populations (Crabtree 2014).
Vitamin D insufficiency and deficiency were both included in SoF table analysis to address the objectives of the review. Nutritional rickets was defined as either biochemical or radiological rickets as combined outcomes were not reported.
Latitude for high‐risk populations for vitamin D deficiency was defined as above 52ðN or below 52ðS as these populations have insufficient UV intensity most of the year.
Subgroup analysis of doses of vitamin D to mothers was stratified as 400 to 2000 IU/day; 2000 to 4000 IU/day; and > 4000 IU/day. Single and intermittent high‐dose studies were incorporated by calculating the average daily dose equivalent.
Certainty of evidence for surrogate outcomes was downgraded due to indirectness. This included 25‐OH vitamin D levels and vitamin D insufficiency which may not be predictive of vitamin D deficiency or bone health (Munns 2016).
Contributions of authors
MLT, DO and SA contributed to protocol development (Tan 2018), and all stages of the review. MLT was the primary author of the protocol and review. All data and text was cross‐checked by DO.
Sources of support
Internal sources
No sources of support supplied
External sources
-
Australian Satellite of Cochrane Neonatal, Australia
Supported by a bridging funding grant from Cochrane 2017‐8
-
Vermont Oxford Network, USA
Cochrane Neonatal Reviews are produced with support from Vermont Oxford Network, a worldwide collaboration of health professionals dedicated to providing evidence‐based care of the highest quality for newborn infants and their families.
Declarations of interest
MLT has no interest to declare.
SAA was an Advisory Board member for the Milk Processors Educational Program (MilkPep), and received consultancy as a scientific advisor. This relationship ended in December 2018.
DAO has no interest to declare.
New
References
References to studies included in this review
Ala‐Houhala 1985 {published data only}
- Ala-Houhala M. 25-Hydroxyvitamin D levels during breast-feeding with or without maternal or infantile supplementation of vitamin D. Journal of Pediatric Gastroenterology and Nutrition 1985;4(2):220-6. [DOI: 10.1097/00005176-198504000-00011] [PMID: ] [DOI] [PubMed] [Google Scholar]
Ala‐Houhala 1986 {published data only}
- Ala-Houhala M, Koskinen T, Terho A, Koivula T, Visakorpi J. Maternal compared with infant vitamin D supplementation. Archives of Disease in Childhood 1986;61(12):1159-63. [DOI: 10.1136/adc.61.12.1159] [PMID: ] [DOI] [PMC free article] [PubMed] [Google Scholar]
Alonso 2011 {published data only}
- Alonso A, Rodriguez J, Carvajal I, Prieto MA, Rodriguez RM, Perez AM, et al, Collaborative Group on Prophylaxis with Vitamin D in Asturias. Prophylactic vitamin D in healthy infants: assessing the need. Metabolism: Clinical and Experimental 2011;60(12):1719-25. [DOI: 10.1016/j.metabol.2011.04.011] [PMID: ] [DOI] [PubMed] [Google Scholar]
Chandy 2016 {published data only}
- Chandy DD, Kare J, Singh SN, Agarwal A, Das V, Singh U, et al. Effect of vitamin D supplementation, directly or via breast milk for term infants, on serum 25 hydroxyvitamin D and related biochemistry, and propensity to infection: a randomised placebo-controlled trial. British Journal of Nutrition 2016;116(1):52-8. [DOI: 10.1017/S0007114516001756] [PMID: ] [DOI] [PubMed] [Google Scholar]
Greer 1981 {published data only}
- Greer FR, Searcy JE, Levin RS, Steichen JJ, Asch PS, Tsang RC. Bone mineral content and serum 25-hydroxyvitamin D concentration in breast-fed infants with and without supplemental vitamin D. Journal of Pediatrics 1981;98(5):696-701. [DOI: 10.1016/s0022-3476(81)80827-x] [PMID: ] [DOI] [PubMed] [Google Scholar]
- Greer FR, Searcy JE, Levin RS, Steichen JJ, Steichen-Asche PS, Tsang RC. Bone mineral content and serum 25-hydroxyvitamin D concentrations in breast-fed infants with and without supplemental vitamin D: one-year follow-up. Journal of Pediatrics 1982;100(6):919-22. [DOI: 10.1016/s0022-3476(82)80514-3] [PMID: ] [DOI] [PubMed] [Google Scholar]
Greer 1989 {published data only}
- Greer FR, Marshall S. Bone mineral content, serum vitamin D metabolite concentrations, and ultraviolet B light exposure in infants fed human milk with and without vitamin D2 supplements. Journal of Pediatrics 1989;114(2):204-12. [DOI: 10.1016/s0022-3476(89)80784-x] [PMID: ] [DOI] [PubMed] [Google Scholar]
Hollis 2015 {published data only}
- Bell KA, Wagner CL, Perng W, Feldman HA, Shypailo RJ, Belfort MB. Validity of body mass index as a measure of adiposity in infancy. Journal of Pediatrics 2018;196:168-74. [DOI: 10.1016/j.jpeds.2018.01.028] [PMID: ] [DOI] [PMC free article] [PubMed] [Google Scholar]
- Hollis BW, Wagner CL, Howard CR, Ebeling M, Shary JR, Smith PG, et al. Maternal versus infant vitamin D supplementation during lactation: a randomized controlled trial. Pediatrics 2015;136(4):625-34. [DOI: 10.1542/peds.2015-1669] [PMID: ] [DOI] [PMC free article] [PubMed] [Google Scholar]
- Reading R. Maternal versus infant vitamin D supplementation during lactation: a randomized controlled trial. Child: Care, Health & Development 2016;42:148. [DOI: 10.1111/cch.12310] [DOI] [Google Scholar]
- Roth DE. Maternal postpartum high-dose vitamin D3 supplementation (6400 IU/day) or conventional infant vitamin D3 supplementation (400 IU/day) lead to similar vitamin D status of healthy exclusively/fully breastfeeding infants by 7 months of age. Evidence-Based Medicine 2016;21(2):75. [DOI: 10.1136/ebmed-2015-110354.] [DOI] [PubMed] [Google Scholar]
- Sen S, Penfield-Cyr A, Hollis BW, Wagner CL. Maternal obesity, 25-hydroxy vitamin D concentration, and bone density in breastfeeding dyads. Journal of Pediatrics 2017;187:147-52. [DOI: 10.1016/j.jpeds.2017.04.024] [PMID: ] [DOI] [PMC free article] [PubMed] [Google Scholar]
- Wagner CL, Howard C, Hulsey TC, Lawrence RA, Taylor SN, Will H, et al. Circulating 25-hydroxyvitamin d levels in fully breastfed infants on oral vitamin D supplementation. International Journal of Endocrinology 2010;2010:235035. [DOI: 10.1155/2010/235035] [PMID: ] [DOI] [PMC free article] [PubMed] [Google Scholar]
- Wagner CL, Howard CM, Hulsey TC, Ebeling M, Lawrence RA, Hollis BW. Vitamin D (VitD) supplementation of mother and infant vs. mother alone. Federation of American Societies for Experimental Biology Journal 2013;27:108.7. [DOI: 10.1096/fasebj.27.1_supplement.108.7] [DOI] [Google Scholar]
Madar 2009 {published data only}
- Madar AA, Klepp KI, Meyer HE. Effect of free vitamin D(2) drops on serum 25-hydroxyvitamin D in infants with immigrant origin: a cluster randomized controlled trial. European Journal of Clinical Nutrition 2009;63(4):478-84. [DOI: 10.1038/sj.ejcn.1602982] [DOI: ] [DOI] [PubMed] [Google Scholar]
Moodley 2015 {published data only}
- Moodley A, Spector SA. Single high-dose vitamin D at birth corrects vitamin D deficiency in infants in Mexico. International Journal of Food Sciences and Nutrition 2015;66(3):336-41. [DOI: 10.3109/09637486.2014.992006] [PMID: ] [DOI] [PMC free article] [PubMed] [Google Scholar]
Naik 2017 {published data only}
- Naik P, Faridi MM, Batra P, Madhu SV. Oral supplementation of parturient mothers with vitamin D and its effect on 25OHD status of exclusively breastfed infants at 6 months of age: a double-blind randomized placebo controlled trial. Breastfeeding Medicine 2017;12(10):621-8. [DOI: 10.1089/bfm.2016.0164] [PMID: ] [DOI] [PubMed] [Google Scholar]
Niramitmahapanya 2017 {published data only}
- Niramitmahapanya S, Kaoiean S, Sangtawesin V, Bordeerat NK, Deerochanawong C. Correlation of 25-hydroxyvitamin D levels in serum vs breastmilk in vitamin D-supplementation breastfeeding women during lactation: randomized double blinded control trial. In: Endocrine Reviews. Conference: 99th Annual Meeting of the Endocrine Society, ENDO 2017. United States. Vol. 38. 2017. [PubMed]
- Niramitmahapanya S, Kaoiean S, Sangtawesin V, Patpanaprapan A, Bordeerat NK. Maternal vitamin D3 supplementation during lactation ameliorate vitamin D status of breast-fed infants: randomized controlled trial. In: Endocrine Reviews. Conference: 97th Annual Meeting and Expo of the Endocrine Society, ENDO 2015. United States. Vol. 36. 2015.
- NCT02297568. Vitamin D supplementation during lactation [Randomized control trial of vitamin D supplementation during lactation on vitamin D in maternal milk]. clinicaltrials.gov/ct2/show/NCT02297568 (first received 21 November 2014).
- Niramitmahapanya S, Kaoiean S, Sangtawesin V, Patanaprapan A, Bordeerat NK, Deerochanawong C. Correlation of 25-hdroxyvitamin D levels in serum vs. breastmilk in vitamin D-supplementation breastfeeding women during lactation: randomized double blinded control trial. Journal of the Medical Association of Thailand 2017;100(Suppl 1):S165-71. [PMID: ] [PubMed] [Google Scholar]
- Niramitmahapanya S, Kaoiean S, Sangtawesin V, Patpanaprapan A, Bordeerat NK, Deerochanawong C. Effect on vitamin D status of breastfeeding infants after vitamin D3 supplementation during breastfeeding lactation: a double-blind randomized controlled trial. Annals of Clinical Endorinology and Metabolism 2017;1:6-14. [DOI: 10.29328/journal.hcem.1001002] [DOI] [Google Scholar]
Ponnapakkam 2010 {published data only}
- Bradford EM, Gensure R, Ponnapakkam T. Vitamin D supplementation in the breastfed infants: preliminary results of a prospective trial. Journal of Investigative Medicine 2010;58:448. [Google Scholar]
- Ponnapakkam T, Bradford E, Gensure R. A treatment trial of vitamin D supplementation in breast-fed infants: universal supplementation is not necessary for rickets prevention in Southern Louisiana. Clinical Pediatrics 2010;49(11):1053-60. [DOI: 10.1177/0009922810376320] [PMID: ] [DOI] [PubMed] [Google Scholar]
- Ponnapakkam T, Bradford E, Gensure R. Vitamin D supplementation in breastfed infants: results of a prospective trial in the southern United States. Journal of Bone and Mineral Research 2010;25:S232. [Google Scholar]
Roth 2016 {published data only}
- NCT03537443. Bone and muscle health in kids (BONUSKids) [Effect of maternal vitamin D supplementation during pregnancy on offspring bone mass, body composition and muscle strength in early childhood: follow-up of a randomized controlled trial cohort.]. clinicaltrialsgov/show/NCT03537443 (first received 25 May 2018).
- Roth D, Mahmud AA, Morris S, Zlotkin S, Gernand A, Tahmeed A, et al. Maternal vitamin D supplementation during pregnancy and lactation to promote infant growth in Dhaka, Bangladesh (MDIG trial): a randomized controlled trial. Annals of Nutrition and Metabolism 2017;71:571. [DOI] [PMC free article] [PubMed] [Google Scholar]
- Roth DE, Gernand AD, Morris SK, Pezzack B, Islam MM, Dimitris MC, et al. Maternal vitamin D supplementation during pregnancy and lactation to promote infant growth in Dhaka, Bangladesh (MDIG trial): study protocol for a randomized controlled trial. Trials 2015;16:300. [DOI: 10.1186/s13063-015-0825-8] [PMID: ] [DOI] [PMC free article] [PubMed] [Google Scholar]
- Roth DE, Morris SK, Zlotkin S, Gernand AD, Ahmed T, Shanta SS, et al. Vitamin D supplementation in pregnancy and lactation and infant growth. New England Journal of Medicine 2018;379(6):535-46. [DOI: 10.1056/NEJMoa1800927] [DOI: ] [DOI] [PMC free article] [PubMed] [Google Scholar]
Rothberg 1982 {published data only}
- Rothberg AD, Pettifor JM, Cohen DF, Sonnendecker EW, Ross FP. Maternal-infant vitamin D relationships during breast-feeding. Journal of Pediatrics 1982;101(4):500-3. [DOI: 10.1016/s0022-3476(82)80689-6] [PMID: ] [DOI] [PubMed] [Google Scholar]
Rueter 2019 {published data only}
- Kristina K, Jones AP, Siafarikas A, Lim E-M, Prescott SL, Palmer DJ. In "high-risk" infants with sufficient vitamin D status at birth, infant vitamin D supplementation had no effect on allergy outcomes: a randomized controlled trial. Nutrients 2020;12(6):1747. [DOI: 10.3390/nu12061747] [PMID: ] [DOI] [PMC free article] [PubMed] [Google Scholar]
- Leffler J, Gamez C, Jones AP, Rueter K, Read JF, Siafarikas A, et al. In infants with sufficient vitamin D status at birth, vitamin D supplementation does not impact immune development. Pediatric Allergy and Immunology 2020;31(6):686–94. [DOI: 10.1111/pai.13250] [PMID: ] [DOI] [PubMed] [Google Scholar]
- Rueter K, Jones AP, Siafarikas A, Lim EM, Bear N, Noakes PS, et al. Direct infant UV light exposure is associated with eczema and immune development. Journal of Allergy and Clinical Immunology 2019;143(3):1012-20. [DOI: 10.1016/j.jaci.2018.08.037] [PMID: ] [DOI] [PubMed] [Google Scholar]
- Rueter K, Jones AP, Siafarikas A, Lim EM, Clarke MW, Noakes PS, et al. Does early oral vitamin d supplementation and UV-light exposure have an impact on allergic disease outcome in infancy? Internal Medicine Journal 2019;49(Suppl 4):35. [Google Scholar]
Thiele 2017 {published data only}
- Anderson CM, Gillespie SL, Thiele DK, Ralph JL, Ohm JE. Effects of maternal vitamin D supplementation on the maternal and infant epigenome. Breastfeeding Medicine 2018;13(5):371-80. [DOI: 10.1089/bfm.2017.0231] [PMID: ] [DOI] [PMC free article] [PubMed] [Google Scholar]
- Anderson CM, Thiele DK, Ralph JL, Perley D, Ohm JE. Vitamin D supplementation and DNA methylation patterns during pregnancy and lactation in mothers and infants. Federation of American Societies for Experimental Biology Journal 2016;30(S!):1028.3. [DOI: 10.1096/fasebj.30.1_supplement.1028.3] [DOI] [Google Scholar]
- Thiele DK, Ralph J, El-Masri M, Anderson CM. Vitamin D3 supplementation during pregnancy and lactation improves vitamin D status of the mother-infant dyad. Journal of Obstetric, Gynecologic, and Neonatal Nursing 2017;46(1):135-47. [DOI: 10.1016/j.jogn.2016.02.016] [PMID: ] [DOI] [PubMed] [Google Scholar]
Trivedi 2020 {published data only}
- Trivedi M, Faridi MM, Aggarwal A, Madhu SV, Malhotra RK. Oral vitamin D supplementation to mothers during lactation - effect of 25(OH)D concentration on exclusively breastfed infants at 6 months of age: a randomized double-blind placebo-controlled trial. Breastfeeding Medicine 2020;15:237-45. [DOI: 10.1089/bfm.2019.0102] [PMID: ] [DOI] [PubMed] [Google Scholar]
Wagner 2006 {published data only}
- Wagner CL, Hulsey TC, Fanning D, Ebeling M, Hollis BW. High-dose vitamin D3 supplementation in a cohort of breastfeeding mothers and their infants: a 6-month follow-up pilot study. Breastfeeding Medicine 2006;1:59-70. [DOI: 10.1089/bfm.2006.1.59] [PMID: ] [DOI] [PubMed] [Google Scholar]
Wheeler 2016 {published data only}
- Wheeler BJ, Taylor BJ, Herbison P, Haszard JJ, Mikhail A, Jones S, et al. Effect of high dose monthly maternal cholecalciferol supplementation during breastfeeding on infant and maternal vitamin d status at 5 months post-partum: a randomized controlled trial. International Journal of Pediatric Endocrinology 2017;2017 (Suppl 1)(15):35. [Google Scholar]
- Wheeler BJ, Taylor BJ, Herbison P, Haszard JJ, Mikhail A, Jones S, et al. High-dose monthly maternal cholecalciferol supplementation during breastfeeding affects maternal and infant vitamin D status at 5 months postpartum: a randomized controlled trial. Journal of Nutrition 2016;146(10):1999-2006. [DOI: 10.3945/jn.116.236679] [PMID: ] [DOI] [PubMed] [Google Scholar]
References to studies excluded from this review
Abdel‐Hady 2019 {published data only}
- Abdel-Hady H, Yahia S, Megahed A, Mosbah A, Seif B, Nageh E, et al. Mediators in preterm infants with late-onset sepsis: a randomized controlled trial. Journal of Pediatric Gastroenterology and Nutrition 2019;68(4):578-84. [DOI: 10.1097/MPG.0000000000002238] [PMID: ] [DOI] [PubMed] [Google Scholar]
ACTRN12613000732785 {published data only}
- ACTRN12613000732785. The efficacy of vitamin D supplementation in infants on bone mineral content: a double blind randomized controlled trial [Vitamin D infant bone mineral content study]. anzctr.org.au/Trial/Registration/TrialReview.aspx?ACTRN=12613000732785 (first received 20 June 2013).
ACTRN12618001174279 {published data only}
- ACTRN12618001174279. Vitamin D supplementation to prevent acute respiratory infections among Indigenous children in the Northern Territory: a randomised controlled trial. anzctr.org.au/Trial/Registration/TrialReview.aspx?id=375278 (first received 9 July 2018).
Al‐Beltagi 2020 {published data only}
- Al-Beltagi M, Rowiesha M, Elmashad A, Elrifaey SM, Elhorany H, Koura HG. Vitamin D status in preterm neonates and the effects of its supplementation on respiratory distress syndrome. Pediatric Pulmonology 2020;55(1):108-15. [DOI: 10.1002/ppul.24552] [PMID: ] [DOI] [PubMed] [Google Scholar]
Backstrom 1999 {published data only}
- Backstrom MC, Maki R, Kuusela AL, Sievanen H, Koivisto AM, Koskinen M, et al. The long-term effect of early mineral, vitamin D, and breast milk intake on bone mineral status in 9- to 11-year-old children born prematurely. Journal of Pediatric Gastroenterology and Nutrition 1999;29(5):575-82. [DOI: 10.1097/00005176-199911000-00019] [PMID: ] [DOI] [PubMed] [Google Scholar]
Bagnoli 2013 {published data only}
- Bagnoli F, Casucci M, Toti S, Cecchi S, Iurato C, Coriolani G, et al. Is vitamin D supplementation necessary in healthy full-term breastfed infants? A follow-up study of bone mineralization in healthy full-term infants with and without supplemental vitamin D. Minerva Pediatrica 2013;65(3):253-60. [PMID: ] [PubMed] [Google Scholar]
Baird 2016 {published data only}
- Baird J, Barker M, Harvey NC, Lawrence W, Vogel C, Jarman M, et al. Southampton PRegnancy Intervention for the Next Generation (SPRING): protocol for a randomised controlled trial. Trials 2016;17(1):493. [DOI: 10.1186/s13063-016-1603-y] [PMID: ] [DOI] [PMC free article] [PubMed] [Google Scholar]
Basile 2006 {published data only}
- Basile LA, Taylor SN, Wagner CL, Horst RL, Hollis BW. The effect of high-dose vitamin D supplementation on serum vitamin D levels and milk calcium concentration in lactating women and their infants. Breastfeeding Medicine 2006;1(1):27-35. [DOI: 10.1089/bfm.2006.1.27] [PMID: ] [DOI] [PubMed] [Google Scholar]
Bugrul 2013 {published data only}
- Bugrul F, Devecioglu E, Ozden T, Gokcay G, Omer B. Effect of maternal and infant vitamin D supplementation on vitamin D levels of breastfed infants. Turkish Journal of Pediatrics 2013;55(2):158-63. [PMID: ] [PubMed] [Google Scholar]
Challa 2005 {published data only}
- Challa A, Ntourntoufi A, Cholevas V, Bitsori M, Galanakis E, Andronikou S. Breastfeeding and vitamin D status in Greece during the first 6 months of life. European Journal of Pediatrics 2005;164(12):724-9. [DOI: 10.1007/s00431-005-1757-1] [PMID: ] [DOI] [PubMed] [Google Scholar]
Chan 1982 {published data only}
- Chan GM, Roberts CC, Folland D, Jackson R. Growth and bone mineralization of normal breast-fed infants and the effects of lactation on maternal bone mineral status. American Journal of Clinical Nutrition 1982;36(3):438-43. [DOI: 10.1093/ajcn/36.3.438] [PMID: ] [DOI] [PubMed] [Google Scholar]
Chawes 2016 {published data only}
- Brustad N, Eliasen A, Stokholm J, Bonnelykke K, Bisgaard H, Chawes BL. High-dose vitamin D supplementation during pregnancy and asthma at age 6: a randomized controlled trial. Allergy: European Journal of Allergy and Clinical Immunology 2019;74(Suppl 106):60. [DOI: 10.1001/jama.2019.0052] [PMID: ] [DOI] [PMC free article] [PubMed] [Google Scholar]
- Chawes BL, Bonnelykke K, Stokholm J, Vissing NH, Bjarnadottir E, Schoos AM, et al. Effect of vitamin D3 supplementation during pregnancy on risk of persistent wheeze in the offspring: a randomized clinical trial. JAMA 2016;315(4):353-61. [DOI: 10.1001/jama.2015.18318] [PMID: ] [DOI] [PubMed] [Google Scholar]
- Hjelmso MH, Shah SA, Thorsen J, Rasmussen M, Vestergaard G, Mortensen MS, et al. Prenatal dietary supplements influence the infant airway microbiota in a randomized factorial clinical trial. Nature Communications 2020;11(1):426. [DOI: 10.1038/s41467-020-14308-x] [PMID: ] [DOI] [PMC free article] [PubMed] [Google Scholar]
- Kofod Vinding R, Stokholm J, Sevelsted A, Chawes BL, Bonnelykke K, Barman M, et al. Fish oil supplementation in pregnancy increases gestational age, size for gestational age, and birth weight in infants: a randomized controlled trial. Journal of Nutrition 2019;149(4):628-34. [DOI: 10.1093/jn/nxy204] [PMID: ] [DOI] [PubMed] [Google Scholar]
Cooper 2016 {published data only}
- Bishop NJ, Kennedy S, Papageorghiou AT, Fraser R, Gandhi SV, D'Angelo S, et al. Maternal gestational vitamin D supplementation and offspring bone mass: a multicentre randomised, double-blind, placebo-controlled trial (MAVIDOS). In: Journal of Bone and Mineral Research. Conference: 2015 Annual Meeting of the American Society for Bone and Mineral Research, ASBMR 2015. United States. Vol. 30. 2015.
- Cooper C, Harvey NC, Bishop NJ, Kennedy S, Papageorghiou AT, Schoenmakers I, et al, MAVIDOS Study Group. Maternal gestational vitamin D supplementation and offspring bone health (MAVIDOS): a multicentre, double-blind, randomised placebo-controlled trial. Lancet Diabetes and Endocrinology 2016;4:393-402. [DOI: 10.1016/S2213-8587(16)00044-9] [PMID: ] [DOI] [PMC free article] [PubMed] [Google Scholar]
Czech‐Kowalska 2013 {published data only}
- Czech-Kowalska J, Latka-Grot J, Bulsiewicz D, Jaworski M, Pludowski P, Chazan B, et al. Influence of vitamin D supplementation on vitamin D status and bone mass during lactation - double blinded randomized control trial. In: Annals of Nutrition & Metabolism. Vol. 63. 2013:796.
- Czech-Kowalska J, Latka-Grot J, Bulsiewicz D, Jaworski M, Pludowski P, Wygledowska G, et al. Impact of vitamin D supplementation during lactation on vitamin D status and body composition of mother-infant pairs: a MAVID randomized controlled trial. PLOS One 2014;9(9):e107708. [DOI: 10.1371/journal.pone.0107708] [PMID: ] [DOI] [PMC free article] [PubMed] [Google Scholar]
- Czech-Kowalska J, Latka-Grot J, Bulsiewicz D, Jaworski M, Wygledowska G, Chazan B, et al. Influence of vitamin D supplementation in lactating mothers on their and offspring's vitamin D status and bone mass - double blinded randomized control trial - MAVID study. Journal of Perinatal Medicine 2013;41(S1):594. [Google Scholar]
Dawudo 2019 {published data only}
- Dawodu A, Salameh K, Reedy A. Very low human milk vitamin D in breastfeeding mothers in an environment with abundant sunlight. In: FASEB Journal. Conference: Experimental Biology 2016, EB. San Diego, CA United States. Vol. 30. 2016.
- Dawodu A, Salameh KM, Al-Janahi NS, Bener A, Elkum N. The effect of high-dose postpartum maternal vitamin D supplementation alone compared with maternal plus infant vitamin D supplementation in breastfeeding infants in a high-risk population. A randomized controlled trial. Nutrients 2019;11(7):1632. [DOI: 10.3390/nu11071632] [PMID: ] [DOI] [PMC free article] [PubMed] [Google Scholar]
- Salameh K, Dawodu AH. Randomized controlled study of effectiveness and safety of high dose vitamine D supplementation on breast milk v D limited sun. In: Journal of Pediatric Gastroenterology and Nutrition. Conference: 51st Annual Meeting European Society for Paediatric Gastroenterology, Hepatology and Nutrition, ESPGHAN 2018. Switzerland. Vol. 66. 2018:1097.
Delvin 2005 {published data only}
- Delvin EE, Salle BL, Claris O, Putet G, Hascoet JM, Desnoulez L, et al. Oral vitamin A, E and D supplementation of pre-term newborns either breast-fed or formula-fed: a 3-month longitudinal study. Journal of Pediatric Gastroenterology and Nutrition 2005;40(1):43-7. [DOI: 10.1097/00005176-200501000-00008] [PMID: ] [DOI] [PubMed] [Google Scholar]
Diogenes 2013 {published data only}
- Diogenes ME, Bezerra FF, Rezende EP, Donangelo CM. Calcium plus vitamin D supplementation during the third trimester of pregnancy in adolescents accustomed to low calcium diets does not affect infant bone mass at early lactation in a randomized controlled trial. Journal of Nutrition 2015;145(7):1515-23. [DOI: 10.3945/jn.114.208140] [PMID: ] [DOI] [PubMed] [Google Scholar]
- Diogenes ME, Bezerra FF, Rezende EP, Taveira MF, Normando P, Pinhal I, et al. Infant and maternal bone status are associated in lactating adolescents when calcium intake is low but not following calcium plus vitamin D supplementation. Federation of American Societies for Experimental Biology Journal 2013;27:850.5. [DOI: 10.1096/fasebj.27.1_supplement.850.5] [DOI] [Google Scholar]
- Diogenes ME, Bezerra FF, Rezende EP, Taveira MF, Pinhal I, Donangelo CM. Effect of calcium plus vitamin D supplementation during pregnancy in Brazilian adolescent mothers: a randomized, placebo-controlled trial. American Journal of Clinical Nutrition 2013;98(1):82-91. [DOI: 10.3945/ajcn.112.056275] [PMID: ] [DOI] [PubMed] [Google Scholar]
- Diogenes ME, Bezerra FF, Rezende EP, Taveira MF, Pinhal I, Donangelo CM. Maternal vitamin D status of adolescent mothers at mid-pregnancy influence bone mineral content of their newborns. Federation of American Societies for Experimental Biology Journal 2011;25:603.19. [DOI: 10.1096/fasebj.25.1_supplement.603.19] [DOI] [Google Scholar]
Francis 2018 {published data only}
- Francis J, Unger S, Bando N, Vance A, Gibbins S, Kiss A, et al, GTA-DoMINO Feeding Group. Postdischarge feeding of very-low-birth-weight infants: adherence to nutrition guidelines. Journal of Pediatric Gastroenterology and Nutrition 2018;67(3):401-8. [DOI: 10.1097/MPG.0000000000002041] [PMID: ] [DOI] [PubMed] [Google Scholar]
Galdo 2018 {published data only}
- Galdo AM, De Aguileta AL, Mercader PT, Estela AC, Marcos MIM, Murua JK, et al. Effect of supplementation with vitamin D on acute bronchitis prevention during the first year of life. In: European Respiratory Journal. Conference: European Respiratory Society International Congress, ERS 2018. France. Vol. 52. 2018.
Gallo 2013a {published data only}
- Gallo S, Rodd C, Vanstone C, Agellon S, L'Abbe M, Khamessan A, et al. Lumbar spine bone mineral density is enhanced in breast fed infants receiving 800 or 1200 IU of vitamin D daily from 4 to 20 weeks of age. In: Journal of Bone and Mineral Research. Conference: 2011 Annual Meeting of the American Society for Bone and Mineral Research, ASBMR 2011. San Diego, CA United States. Vol. 26. 2011.
- Gallo S, Comeau K, Sharma A, Vanstone CA, Agellon S, Mitchell J, et al. Redefining normal bone and mineral clinical biochemistry reference intervals for healthy infants in Canada. Clinical Biochemistry 2014;47(15):27-32. [DOI: 10.1016/j.clinbiochem.2014.07.012] [PMID: ] [DOI] [PubMed] [Google Scholar]
- Gallo S, Comeau K, Vanstone C, Agellon S, Sharma A, Jones G, et al. Effect of different dosages of oral vitamin D supplementation on vitamin D status in healthy, breastfed infants: a randomized trial. JAMA 2013;309:1785-92. [DOI: 10.1001/jama.2013.3404] [PMID: ] [DOI] [PubMed] [Google Scholar]
- Gallo S, Hazell T, Vanstone CA, Agellon S, Jones G, L'Abbe M, et al. Vitamin D supplementation in breastfed infants from Montreal, Canada: 25-hydroxyvitamin D and bone health effects from a follow-up study at 3 years of age. Osteoporosis International 2016;27(8):2459-66. [DOI: 10.1007/s00198-016-3549-z] [PMID: ] [DOI] [PubMed] [Google Scholar]
- Gallo S, Vanstone CA, Comeau K, Agellon S, Rodd C, Sharma A, et al. Vitamin D dose response study in canadian infants: 25-Hydroxy-vitamin D status during a 20 week intervention. In: Federation of American Socieities for Experimental Biology Journal. Vol. 24. 2010. [DOI: 10.1096/fasebj.24.1_supplement.537.11] [DOI]
- Hazell TJ, Gallo S, Berzina I, Vanstone CA, Rodd C, Weiler HA. Plasma 25-hydroxyvitamin D, more so than its epimer, has a linear relationship to leaner body composition across infancy in healthy term infants. Applied Physiology, Nutrition, and Metabolism 2014;39(10):1137-43. [DOI: 10.1139/apnm-2013-0586] [PMID: ] [DOI] [PubMed] [Google Scholar]
- Hazell TJ, Gallo S, Vanstone CA, Agellon S, Rodd C, Weiler HA. Vitamin D supplementation trial in infancy: body composition effects at 3 years of age in a prospective follow-up study from Montreal. Pediatric Obesity 2017;12(1):38-47. [DOI: 10.1111/ijpo.12105] [PMID: ] [DOI] [PubMed] [Google Scholar]
- Sharma AK, Gallo S, Vanstone CA, Agellon S, L'Abbe M, Khamessan A, et al. Parathyroid hormone-ionized calcium dynamics over the first year of life. Journal of Pediatric Endocrinology and Metabolism 2016;29(6):709-14. [DOI: 10.1515/jpem-2015-0240] [PMID: ] [DOI] [PubMed] [Google Scholar]
- Wicklow B, Gallo S, Majnemer A, Vanstone C, Comeau K, Jones G, et al. Impact of vitamin D supplementation on gross motor development of healthy term infants: a randomized dose-response trial. Physical & Occupational Therapy in Pediatrics 2016;36(3):330-42. [DOI: 10.3109/01942638.2015.1050150] [PMID: ] [DOI] [PubMed] [Google Scholar]
Gallo 2013b {published data only}
- Gallo S, Phan A, Vanstone CA, Rodd C, Weiler HA. The change in plasma 25-hydroxyvitamin D did not differ between breast-fed infants that received a daily supplement of ergocalciferol or cholecalciferol for 3 months. Journal of Nutrition 2013;143(2):148-53. [DOI: 10.3945/jn.112.167858] [PMID: ] [DOI] [PMC free article] [PubMed] [Google Scholar]
Grant 2014 {published data only}
- Grant CC, Stewart AW, Scragg R, Milne T, Rowden J, Ekeroma A, et al. Vitamin D during pregnancy and infancy and infant serum 25-hydroxyvitamin D concentration. Pediatrics 2014;133(1):e143-e53. [DOI: 10.1542/peds.2013-2602] [PMID: ] [DOI] [PubMed] [Google Scholar]
- Wall CR, Stewart AW, Camargo CA Jr, Scragg R, Mitchell EA, Ekeroma A. Vitamin D activity of breast milk in women randomly assigned to vitamin D3 supplementation during pregnancy. American Journal of Clinical Nutrition 2016;103(2):382-8. [DOI: 10.3945/ajcn.115.114603] [PMID: ] [DOI] [PubMed] [Google Scholar]
Gupta 2018 {published data only}
- Gupta T, Sharma H, Bajpai J, Kachhawa G, Kulshreshtha V, Khadgawat R, et al. A randomized double blind controlled trial to investigate the effects of vitamin D supplementation on maternal and new-born baby's vitamin D status in Asian-Indian subjects. Indian Journal of Endocrinology and Metabolism 2018;22(7 Suppl 1):S89. [Google Scholar]
Hibbs 2018 {published data only}
- Goldsobel A. Effect of vitamin D supplementation on recurrent wheezing in black infants who were born preterm: the D-wheeze randomized clinical trial. Pediatrics 2018;142:S250-S1. [DOI] [PMC free article] [PubMed] [Google Scholar]
- Hibbs AM, Ross K, Kerns LA, Wagner C, Fuloria M, Groh-Wargo S, et al. Effect of vitamin D supplementation on recurrent wheezing in black infants who were born preterm: the D-Wheeze randomized clinical trial. JAMA 2018;319(20):2086-94. [DOI: 10.1001/jama.2018.5729] [PMID: ] [DOI] [PMC free article] [PubMed] [Google Scholar]
Ho 1985 {published data only}
- Ho ML, Yen HC, Tsang RC, Specker BL, Chen XC, Nichols BL. Randomized study of sunshine exposure and serum 25-OHD in breast-fed infants in Beijing, China. Journal of Pediatrics 1985;107(6):928-31. [DOI: 10.1016/s0022-3476(85)80192-x] [PMID: ] [DOI] [PubMed] [Google Scholar]
Hollis 2004 {published data only}
- Hollis BW, Wagner CL. Vitamin D requirements during lactation: high-dose maternal supplementation as therapy to prevent hypovitaminosis D for both the mother and the nursing infant. American Journal of Clinical Nutrition 2004;80(6 Suppl):1752s-8s. [DOI: 10.1093/ajcn/80.6.1752S] [PMID: ] [DOI] [PubMed] [Google Scholar]
Huynh 2015 {published data only}
- Huynh J, Lu T, Liew D, Doery J, Tudball R, Jona M, et al. The Vine study: vitamin D in newborns: an RCT comparing daily and bolus supplementation. In: Journal of Paediatrics and Child Health. Conference: 19th Annual Meeting of the Perinatal Society of Australia and New Zealand, PSANZ 2015. Melbourne, VIC Australia. Vol. 51; S1. 2015:30-1.
- ACTRN12613001234707. A randomised controlled trial evaluating the efficacy and safety of single bolus (50,000 international units) versus daily (400 international units) dosing of vitamin D in healthy breastfed infants of vitamin D deficient mothers [A randomised controlled trial comparing daily (400 international units) and single bolus dosing (50,000 international units) of vitamin D in healthy breastfed infants of vitamin D deficient mother]. www.anzctr.org.au/Trial/Registration/TrialReview.aspx?ACTRN=12613001234707 (first received 9 October 2013).
- Huynh J, Liew D, Rodda C. Neonatal vitamin D supplementation. Journal of Paediatrics and Child Health 2017;53(7):725-6. [DOI: 10.1111/jpc.13582] [PMID: ] [DOI] [PubMed] [Google Scholar]
- Huynh J, Lu T, Liew D, Doery JC, Tudball R, Jona M, et al. Vitamin D in newborn. A randomised controlled trial comparing daily and single oral bolus vitamin D in infants. Journal of Paediatrics and Child Health 2017;53(2):163-9. [DOI: 10.1111/jpc.13338] [PMID: 27670154] [DOI] [PubMed] [Google Scholar]
Ketha 2018 {published data only}
- Ketha H, Thacher TD, Oberhelman SS, Fischer PR, Singh RJ, Kumar R. Comparison of the effect of daily versus bolus dose maternal vitamin D3 supplementation on the 24,25-dihydroxyvitamin D3 to 25-hydroxyvitamin D3 ratio. Bone 2018;110:321-5. [DOI: 10.1016/j.bone.2018.02.024] [PMID: ] [DOI] [PMC free article] [PubMed] [Google Scholar]
Kishore 2019 {published data only}
- Kishore SS, Gadiraju M. Study of daily vitamin D supplementation in preterm infants: a randomized trial. Journal of Pediatric Gastroenterology and Nutrition 2019;68:1167. [Google Scholar]
Kolodziejczyk 2017 {published data only}
- Kolodziejczyk A, Borszewska-Kornacka MK, Seliga-Siwecka J. MOnitored Supplementation of VItamin D in preterm infants (MOSVID trial): study protocol for a randomised controlled trial. Trials 2017;18(1):424. [DOI: 10.1186/s13063-017-2141-y] [PMID: ] [DOI] [PMC free article] [PubMed] [Google Scholar]
Kuryaninova 2017 {published data only}
- Kuryaninova V, Dolbnya S, Kasyanova A, Yagupova A, Zakharova I, Klimov L, et al. B-defensin level changes over time in children under three years of age receiving cholecalciferol. Journal of Pediatric Gastroenterology and Nutrition 2017;64:988. [Google Scholar]
Lara‐Corrales 2013 {published data only}
- Lara-Corrales I, Gomez GR, De Los Rios CP, Pope E. Vitamin D in patients with atopic dermatitis: a randomized, double-blinded, placebo-controlled study preliminary analysis. Pediatric Dermatology 2013;30:638. [Google Scholar]
Litonjua 2014 {published data only}
- Lu M, Carey VJ, O'Connor GT, Bacharier LB, Zeiger RS, Hollis B, et al. Prenatal and neonatal vitamin D sufficiency are associated with reduced risk of childhood asthma/recurrent wheeze. In: American Journal of Respiratory and Critical Care Medicine. Conference: American Thoracic Society International Conference, ATS 2018. United States. Vol. 197. 2018.
- Mirzakhani H, O'Connor GT, Bacharier L, Zeiger RS, Schatz MX, Weiss S, et al. Asthma control status during pregnancy and its relationship with vitamin D level: an observation from the vitamin D antenatal asthma reduction trial (VDAART). In: American Journal of Respiratory and Critical Care Medicine. Conference: American Thoracic Society International Conference, ATS 2017. United States. Vol. 195. 2017.
- Hornsby E, Pfeffer PE, Laranjo N, Cruikshank W, Tuzova M, Litonjua AA, et al. Vitamin D supplementation during pregnancy: effect on the neonatal immune system in a randomized controlled trial. Journal of Allergy and Clinical Immunology 2018;141(1):269-78. [DOI: 10.1016/j.jaci.2017.02.039] [PMID: ] [DOI] [PubMed] [Google Scholar]
- Litonjua AA, Carey VJ, Laranjo N, Harshfield BJ, McElrath TF, O'Connor GT, et al. Effect of prenatal supplementation with Vitamin D on asthma or recurrent wheezing in offspring by age 3 years: the VDAART randomized clinical trial. JAMA 2016;315(4):362-70. [DOI: 10.1001/jama.2015.18589] [PMID: ] [DOI] [PMC free article] [PubMed] [Google Scholar]
- Litonjua AA, Lange NE, Carey VJ, Brown S, Laranjo N, Harshfield BJ, et al. The Vitamin D Antenatal Asthma Reduction Trial (VDAART): rationale, design, and methods of a randomized, controlled trial of vitamin D supplementation in pregnancy for the primary prevention of asthma and allergies in children. Contemporary Clinical Trials 2014;38(1):37-50. [DOI: 10.1016/j.cct.2014.02.006] [PMID: ] [DOI] [PMC free article] [PubMed] [Google Scholar]
- Lu M, Hollis BW, Carey VJ, Laranjo N, Singh RJ, Weiss ST, et al. Determinants and measurement of neonatal vitamin D: overestimation of 25(OH)D in cord blood using CLIA assay technology. The Journal of Clinical Endocrinology and Metabolism 2020;105:e1085-92. [DOI: 10.1210/clinem/dgz299] [PMID: ] [DOI] [PMC free article] [PubMed] [Google Scholar]
- Mirzakhani H, Carey VJ, McElrath TF, Laranjo N, O'Connor G, Iverson RE, et al. The association of maternal asthma and early pregnancy vitamin D with risk of preeclampsia: an observation from Vitamin D Antenatal Asthma Reduction Trial (VDAART). Journal of Allergy and Clinical Immunology: In Practice 2018;6(2):600-8. [DOI: 10.1016/j.jaip.2017.07.018] [PMID: ] [DOI] [PMC free article] [PubMed] [Google Scholar]
- Mirzakhani H, Carey VJ, Zeiger R, Bacharier LB, O'Connor GT, Schatz MX, et al. Impact of parental asthma, prenatal maternal asthma control, and vitamin D status on risk of asthma and recurrent wheeze in 3-year-old children. Clinical and Experimental Allergy 2019;49(4):419-29. [DOI: 10.1111/cea.13320] [PMID: ] [DOI] [PMC free article] [PubMed] [Google Scholar]
- Savage JH, Lee-Sarwar KA, Sordillo JE, Lange NE, Zhou Y, O'Connor GT, et al. Diet during pregnancy and infancy and the infant intestinal microbiome. Journal of Pediatrics 2018;203:47-54. [DOI: 10.1016/j.jpeds.2018.07.066] [PMID: ] [DOI] [PMC free article] [PubMed] [Google Scholar]
- Sordillo JE, Zhou Y, McGeachie MJ, Ziniti J, Lange N, Laranjo N, et al. Factors influencing the infant gut microbiome at age 3-6 months: findings from the ethnically diverse Vitamin D Antenatal Asthma Reduction Trial (VDAART). Journal of Allergy and Clinical Immunology 2017;139(2):482-91. [DOI: 10.1016/j.jaci.2016.08.045] [PMID: ] [DOI] [PMC free article] [PubMed] [Google Scholar]
- Wolsk HM, Harshfield BJ, Laranjo N, Carey VJ, O'Connor G, Sandel M, et al. Vitamin D supplementation in pregnancy, prenatal 25(OH)D levels, race, and subsequent asthma or recurrent wheeze in offspring: secondary analyses from the vitamin D antenatal asthma reduction trial. Journal of Allergy and Clinical Immunology 2017;140(5):1423-9. [DOI: 10.1016/j.jaci.2017.01.013] [PMID: ] [DOI] [PubMed] [Google Scholar]
March 2015 {published data only}
- Barr SI, Lyon MR, Whiting SJ, Weiler HA, Green TJ. Maternal vitamin D₃ supplementation at 50 μg/d protects against low serum 25-hydroxyvitamin D in infants at 8 wk of age: a randomized controlled trial of 3 doses of vitamin D beginning in gestation and continued in lactation. American Journal of Clinical Nutrition 2015;102(2):402-10. [DOI: 10.3945/ajcn.114.106385] [PMID: 27802998 ] [DOI] [PubMed] [Google Scholar]
- Chen NN, March K, Innis SM, Shand A, Von Dadelszen P, Lyon M, et al. The effect of vitamin D supplementation during pregnancy and lactation on maternal & infant 25-hydroxyvitamin D (25OHD) concentration. Federation of American Societies for Experimental Biology Journal 2013;27:lb259. [DOI: 10.1096/fasebj.27.1_supplement.lb259] [DOI] [Google Scholar]
- March KM, Chen NN, Karakochuk CD, Shand AW, Innis SM, Von Dadelszen P, Barr SI, Lyon MR, Whiting SJ, Weiler HA, Green TJ. Maternal vitamin D3 supplementation at 50 mg/d protects against low serum 25-hydroxyvitamin D in infants at 8 wk of age: A randomized controlled trial of 3 doses of vitamin D beginning in gestation and continued in lactation. American Journal of Clinical Nutrition 2015;102:402-10; erratum (American Journal of Clinical Nutrition (2015) 102 (402-410).. [DOI] [PubMed] [Google Scholar]
Mirghafourvand 2015 {published data only}
- Mansouri A, Mirghafourvand M, Charandabi SM, Najafi M. The effect of vitamin D and calcium plus vitamin D on leg cramps in pregnant women: a randomized controlled trial. Journal of Research in Medical Sciences 2017;22:24. [DOI: 10.4103/1735-1995.200271] [PMID: ] [DOI] [PMC free article] [PubMed] [Google Scholar]
- Mirghafourvand M, Mohammad-Alizadeh-Charandabi S, Mansouri A, Najafi M, Khodabande F. The effect of vitamin D and calcium plus vitamin D on sleep quality in pregnant women with leg cramps: a controlled randomized clinical trial. Journal of Isfahan Medical School 2015;32(320):2444-53. [CENTRAL: CN-01070330] [Google Scholar]
- Mohammad-Alizadeh-Charandabi S, Mirghafourvand M, Mansouri A, Najafi M, Khodabande F. The effect of vitamin D and calcium plus vitamin D during pregnancy on pregnancy and birth outcomes: a randomized controlled trial. Journal of Caring Sciences 2015;4(1):35-44. [DOI: 10.5681/jcs.2015.004] [PMID: ] [DOI] [PMC free article] [PubMed] [Google Scholar]
Morris 2017 {published data only}
- Morris SK, Pell LG, Rahman MZ, Dimitris MC, Mahmud A, Islam MM, et al. Maternal vitamin D supplementation during pregnancy and lactation to prevent acute respiratory infections in infancy in Dhaka, Bangladesh (MDARI trial): protocol for a prospective cohort study nested within a randomized controlled trial. BMC Pregnancy and Childbirth 2016;16(1):309. [DOI: 10.1186/s12884-016-1103-9] [PMID: ] [DOI] [PMC free article] [PubMed] [Google Scholar]
- Morris SK, Pell LG, Rahman MZ, Gubbay J, Pullenayegum E, Ahmed T, et al. Maternal vitamin d supplementation during pregnancy and lactation to prevent acute respiratory infections in infancy in Dhaka, Bangladesh (MDARI trial): a prospective cohort study nested within a randomized controlled trial during pregnancy and lactation to prevent respiratory infections in infancy in Bangladesh (MDARI trial). In: American Journal of Tropical Medicine and Hygiene. Vol. 97. 2017:387.
Nausheen 2018 {published data only}
- Nausheen S, Soofi S. Assessment of dose effectiveness of vitamin D supplementation during pregnancy. A dose comparison clinical trial. BJOG: An International Journal of Obstetrics and Gynaecology 2018;125:15. [Google Scholar]
NCT02713009 {published data only}
- NCT02713009. Impact of maternal body weight on vitamin D status during pregnancy (MO-VITD) [Investigation of the impact of maternal body weight on vitamin D status during pregnancy: a randomised supplementation study]. clinicaltrials.gov/ct2/show/NCT02713009 (first received 18 March 2016).
Norizoe 2014 {published data only}
- Norizoe C, Akiyama N, Segawa T, Tachimoto H, Mezawa H, Ida H, et al. Increased food allergy and vitamin D: randomized, double-blind, placebo-controlled trial. Pediatrics International 2014;56(1):6-12. [DOI: 10.1111/ped.12207] [PMID: ] [DOI] [PubMed] [Google Scholar]
O'Callaghan 2018 {published data only}
- O'Callaghan KM, Hennessy A, Hull GL, Healy K, Ritz C, Kenny LC, et al. Estimation of the maternal vitamin D intake that maintains circulating 25-hydroxy vitamin D in late gestation at a concentration sufficient to keep umbilical cord sera >= 25-30 nmol/L: a dose-response, double-blind, randomized placebo-controlled trial in pregnant women at northern latitude. American Journal of Clinical Nutrition 2018;108(1):77-91. [DOI: 10.1093/ajcn/nqy064] [PMID: ] [DOI] [PMC free article] [PubMed] [Google Scholar]
Oberhelman 2013 {published data only}
- Ketha H, Thacher TD, Oberhelman SS, Fischer PR, Singh RJ, Kumar R. Comparison of the effect of daily versus bolus dose maternal vitamin D3 supplementation on the 24,25-dihydroxyvitamin D3 to 25-hydroxyvitamin D3 ratio. Bone 2018;110:321-5. [DOI: 10.1016/j.bone.2018.02.024] [PMID: ] [DOI] [PMC free article] [PubMed] [Google Scholar]
- Oberhelman SS, Meekins M, Fischer P, Lee B, Gardner B, Singh R, et al. Maternal vitamin D supplementation to optimize the vitamin D status of breastfed infants. Federation of American Societies for Experimental Biology Journal 2012;26(S1):44.5. [DOI: 10.1096/fasebj.26.1_supplement.44.5] [DOI] [Google Scholar]
- Oberhelman SS, Meekins ME, Fischer PR, Lee BR, Singh RJ, Cha SS, et al. Maternal vitamin D supplementation to improve the vitamin D status of breast-fed infants: a randomized controlled trial. Mayo Clinic Proceedings 2013;88(12):1378-87. [DOI: 10.1016/j.mayocp.2013.09.012] [PMID: ] [DOI] [PMC free article] [PubMed] [Google Scholar]
Onal 2010 {published data only}
- Onal H, Adal E, Alpaslan S, Ersen A, Aydin A. Is daily 400 IU of vitamin D supplementation appropriate for every country: a cross-sectional study. European Journal of Nutrition 2010;49(7):395-400. [DOI: 10.1007/s00394-010-0097-8] [PMID: ] [DOI] [PubMed] [Google Scholar]
Perumal 2017 {published data only}
- Perumal N, Mahmud A, Baqui A, Roth D. Prenatal vitamin D supplementation and infant vitamin D status in Bangladesh. In: FASEB Journal. Conference: Experimental Biology 2014, EB. San Diego, CA United States. Vol. 28. 2014.
- Roth DE, Al Mahmud A, Raqib R, Akhtar E, Perumal N, Pezzack B, et al. Randomized placebo-controlled trial of high-dose prenatal third-trimester vitamin D3 supplementation in Bangladesh: the AViDD trial. Nutrition Journal 2013;12:1-16. [DOI] [PMC free article] [PubMed] [Google Scholar]
- Dimitris MC, Perumal N, Craig-Barnes HA, Leadley M, Mahmud AA, Baqui AH, et al. Effect of weekly high-dose vitamin D3 supplementation on serum cholecalciferol concentrations in pregnant women. Journal of Steroid Biochemistry and Molecular Biology 2016;158:76-81. [DOI: 10.1016/j.jsbmb.2016.01.007] [PMID: ] [DOI] [PubMed] [Google Scholar]
- Harrington J, Perumal N, Al Mahmud A, Baqui A, Roth DE. Vitamin D and fetal-neonatal calcium homeostasis: findings from a randomized controlled trial of high-dose antenatal vitamin D supplementation. Pediatric Research 2014;76(3):302-9. [DOI: 10.1038/pr.2014.83Abstract] [PMID: ] [DOI] [PubMed] [Google Scholar]
- Perumal N, Al Mahmud A, Baqui A, Raqib R, Roth D. Effect of high-dose vitamin D supplementation on blood pressure during the third trimester of pregnancy: a randomized controlled trial in Bangladesh. American Journal of Epidemiology 2012;176(1):80. [Google Scholar]
- Perumal N, Al Mahmud A, Baqui AH, Roth DE. Prenatal vitamin D supplementation and infant vitamin D status in Bangladesh. Public Health Nutrition 2017;20(10):1865-73. [DOI: 10.1017/S1368980015003092] [PMID: ] [DOI] [PMC free article] [PubMed] [Google Scholar]
- Qamar H, Perumal N, Papp E, Gernand AD, Mahmud AA, Roth D. Parathyroid hormone and fetal length in a pregnancy cohort in Dhaka, Bangladesh. Annals of Nutrition and Metabolism 2017;71(Suppl 2):462-3. [Google Scholar]
- Roth DE, Perumal N, Al Mahmud A, Baqui AH. Maternal vitamin D3 supplementation during the third trimester of pregnancy: effects on infant growth in a longitudinal follow-up study in Bangladesh. Journal of Pediatrics 2013;163(6):1605-11. [DOI: 10.1016/j.jpeds.2013.07.030] [PMID: ] [DOI] [PubMed] [Google Scholar]
Rasmussen 2015 {published data only}
- Rasmussen GB, Mosekilde L, Sikjaer T, Vestergaard P, Heickendorff L, Uldbjerg N, et al. Effects of high dose vitamin D supplementation on bone metabolism in pregnant women with hypovitaminosis D - a randomized controlled trial. In: Journal of Bone and Mineral Research. Conference: 2015 Annual Meeting of the American Society for Bone and Mineral Research, ASBMR 2015. United States. Vol. 30. 2015.
Roberfroid 2012 {published data only}
- Roberfroid D, Huybregts L, Lanou H, Ouedraogo L, Henry MC, Meda N, et al, MISAME study group. Impact of prenatal multiple micronutrients on survival and growth during infancy: a randomized controlled trial. American Journal of Clinical Nutrition 2012;95(4):916-24. [DOI: 10.3945/ajcn.111.029033] [PMID: ] [DOI] [PubMed] [Google Scholar]
Roberts 1981 {published data only}
- Roberts CC, Chan GM, Folland D, Rayburn C, Jackson R. Adequate bone mineralization in breast-fed infants. Journal of Pediatrics 1981;99(2):192-6. [DOI: 10.1016/s0022-3476(81)80448-9] [PMID: ] [DOI] [PubMed] [Google Scholar]
Rosendahl 2017 {published data only}
- Enlund-Cerullo M, Koljonen L, Holmlund-Suila E, Hauta-Alus H, Rosendahl J, Valkama S, et al. Genetic variation of the vitamin D binding protein affects vitamin D status and response to supplementation in infants. Journal of Clinical Endocrinology and Metabolism 2019;104(11):5483-98. [DOI: 10.1210/jc.2019-00630] [PMID: ] [DOI] [PubMed] [Google Scholar]
- Hauta-Alus HH, Kajantie E, Holmlund-Suila EM, Rosendahl J, Valkama SM, Enlund-Cerullo M, et al. High pregnancy, cord blood, and infant vitamin D concentrations may predict slower infant growth. Journal of Clinical Endocrinology & Metabolism 2019;104(2):397-407. [DOI: 10.1210/jc.2018-00602] [PMID: ] [DOI] [PubMed] [Google Scholar]
- Helve O, Viljakainen H, Holmlund-Suila E, Rosendahl J, Hauta-alus H, Enlund-Cerullo M, et al. Towards evidence-based vitamin D supplementation in infants: Vitamin D Intervention in Infants (VIDI) - study design and methods of a randomised controlled double-blinded intervention study. BMC Pediatrics 2017;17(1):91. [DOI: 10.1186/s12887-017-0845-5] [PMID: ] [DOI] [PMC free article] [PubMed] [Google Scholar]
- Kampe A, Enlund-Cerullo M, Valkama S, Holmlund-Suila E, Rosendahl J, Hauta-Alus H, et al. Genetic variation in GC and CYP2R1 affects 25-hydroxyvitamin D concentration and skeletal parameters: a genome-wide association study in 24-month-old Finnish children. PLOS Genetics 2019;15(12):e1008530. [DOI: 10.1371/journal.pgen.1008530] [PMID: ] [DOI] [PMC free article] [PubMed] [Google Scholar]
- NCT04302987. Vitamin D intervention in infants - 6 years follow-up (VIDI2). clinicaltrialsgov/show/NCT04302987 (first received 10 March 2020).
- Rosendahl J, Holmlund-Suila E, Helve O, Viljakainen H, Hauta-Alus H, Valkama S, et al. 25-hydroxyvitamin D correlates with inflammatory markers in cord blood of healthy newborns. Pediatric Research 2017;81(5):731-5. [DOI: 10.1038/pr.2017.9] [PMID: ] [DOI] [PubMed] [Google Scholar]
- Rosendahl J, Valkama S, Holmlund-Suila E, Enlund-Cerullo M, Hauta-Alus H, Helve O, et al. Effect of higher vs standard dosage of vitamin D3 supplementation on bone strength and infection in healthy infants: a randomized clinical trial. JAMA Pediatrics 2018;172(7):646-54. [DOI: 10.1001/jamapediatrics.2018.0602] [PMID: ] [DOI] [PMC free article] [PubMed] [Google Scholar]
- Valkama S, Holmlund-Suila E, Enlund-Cerullo M, Rosendahl J, Hauta-Alus H, Helve O, et al. No severe hypercalcemia with daily vitamin D3 supplementation of up to 30 μg during the first year of life. Hormone Research in Paediatrics 2017;88(2):147-54. [DOI: 10.1159/000477298] [PMID: ] [DOI] [PubMed] [Google Scholar]
Rostami 2018 {published data only}
- Rostami M, Tehrani FR, Simbar M, Bidhendi Yarandi R, Minooee S, Hollis BW, et al. Effectiveness of prenatal vitamin D deficiency screening and treatment program: a stratified randomized field trial. Journal of Clinical Endocrinology & Metabolism 2018;103(8):2936-48. [DOI: 10.1210/jc.2018-00109] [PMID: ] [DOI] [PubMed] [Google Scholar]
Saadi 2009 {published data only}
- Saadi HF, Dawodu A, Afandi B, Zayed R, Benedict S, Nagelkerke N, et al. Effect of combined maternal and infant vitamin D supplementation on vitamin D status of exclusively breastfed infants. Maternal & Child Nutrition 2009;5(1):25-32. [DOI: 10.1111/j.1740-8709.2008.00145.x] [PMID: ] [DOI] [PMC free article] [PubMed] [Google Scholar]
Salas 2018 {published data only}
- Salas AA, Woodfin T, Phillips V, Peralta-Carcelen M, Carlo WA, Ambalavanan N. Dose-desponse effects of early vitamin D supplementation on neurodevelopmental and respiratory outcomes of extremely preterm infants at 2 years of age: a randomized trial. Neonatology 2018;113(3):256-62. [DOI: 10.1159/000484399] [PMID: ] [DOI] [PMC free article] [PubMed] [Google Scholar]
Savino 2011 {published data only}
- Savino F, Viola S, Tarasco V, Lupica MM, Castagno E, Oggero R, et al. Bone mineral status in breast-fed infants: influence of vitamin D supplementation. European Journal of Clinical Nutrition 2011;65(3):335-9. [DOI: 10.1038/ejcn.2010.274] [PMID: ] [DOI] [PubMed] [Google Scholar]
Shakiba 2010 {published data only}
- Shakiba M, Sadr S, Nefei Z, Mozaffari-Khosravi H, Lotfi MH, Bemanian MH. Combination of bolus dose vitamin D with routine vaccination in infants: a randomised trial. Singapore Medical Journal 2010;51(5):440-5. [PMID: ] [PubMed] [Google Scholar]
Siafarikas 2011 {published data only}
- Siafarikas A, Piazena H, Feister U, Bulsara MK, Meffert H, Hesse V. Randomised controlled trial analysing supplementation with 250 versus 500 units of vitamin D3, sun exposure and surrounding factors in breastfed infants. Archives of Disease in Childhood 2011;96(1):91-5. [DOI: 10.1136/adc.2009.178301] [PMID: ] [DOI] [PubMed] [Google Scholar]
Terashita 2017 {published data only}
- Terashita S, Nakamura T, Igarashi N. Longitudinal study on the effectiveness of vitamin D supplements in exclusively breast-fed infants. Clinical Pediatric Endocrinology 2017;26(4):215-22. [DOI: 10.1297/cpe.26.215] [PMID: ] [DOI] [PMC free article] [PubMed] [Google Scholar]
Tomimoto 2018 {published data only}
- Tomimoto K. A study of vitamin D supplementation in breast fed infant with vitamin D deficiency [ビタミンD欠乏状態にある母乳栄養児における 適切なビタミンD補充の検討 ]. Journal of the Japan Pediatric Society 2018;122(11):1683-91. [Google Scholar]
Wagner 2013 {published data only}
- Wagner CL, Howard CR. Maternal vitamin D supplementation (vitD-S) during lactation: results of a two-site RCT. Breastfeeding Medicine 2013;8:S-2. [Google Scholar]
- Wagner CL, McNeil R, Hamilton SA, Winkler J, Rodriguez Cook C, Warner G, et al. A randomized trial of vitamin D supplementation in 2 community health center networks in South Carolina. American Journal of Obstetrics and Gynecology 2013;208(2):137.e1-.e13. [DOI: 10.1016/j.ajog.2012.10.888] [PMID: ] [DOI] [PMC free article] [PubMed] [Google Scholar]
Zamora 1999 {published data only}
- Zamora SA, Rizzoli R, Belli DC, Slosman DO, Bonjour JP. Vitamin D supplementation during infancy is associated with higher bone mineral mass in prepubertal girls. Journal of Clinical Endocrinology and Metabolism 1999;84(12):4541-4. [DOI: 10.1210/jcem.84.12.6183] [PMID: ] [DOI] [PubMed] [Google Scholar]
Ziegler 2014 {published data only}
- Ziegler EE, Koo WW, Nelson SE, Jeter JM. Lack of effect of graded doses of Vitamin D on bone metabolism of breastfed infants. Journal of Clinical Nutrition and Metabolism 2017;1(1):105. [PMID: ] [PMC free article] [PubMed] [Google Scholar]
- Ziegler EE, Nelson SE, Jeter JM. Iron stores of breastfed infants during the first year of life. Nutrients 2014;6(5):2023-34. [DOI: 10.3390/nu6052023] [PMID: ] [DOI] [PMC free article] [PubMed] [Google Scholar]
- Ziegler EE, Nelson SE, Jeter JM. Vitamin D supplementation of breastfed infants: a randomized dose-response trial. Pediatric Research 2014;76:177-83. [DOI: 10.1038/pr.2014.76] [PMID: ] [DOI] [PMC free article] [PubMed] [Google Scholar]
References to studies awaiting assessment
Kim 2010 {published data only}
- Kim MJ, Na B, No SJ, Han HS, Jeong EH, Lee W, et al. Nutritional status of vitamin D and the effect of vitamin D supplementation in Korean breast-fed infants. Journal of Korean Medical Science 2010;25(1):83-9. [DOI: 10.3346/jkms.2010.25.1.83] [PMID: ] [DOI] [PMC free article] [PubMed] [Google Scholar]
Wagner 2018 {published data only}
- Wagner C, Newton DA, Baatz JE. Maternal vitamin D (VitD) status affects hepatitis B vaccine (HBV) response in breastfeeding infants. In: Breastfeeding Medicine.Conference: 19th International Society for Research in Human Milk and Lactation conference, ISRHML Japan. Vol. 13. 2018:A-12. [CENTRAL: CN-01669515]
References to ongoing studies
ACTRN12614000334606 {published data only}
- ACTRN12614000334606. A placebo-controlled, randomised trial of vitamin D supplementation for infants in their first year of life, to prevent the development of food allergy by age 12 months. The VITALITY Trial [Can vitamin D supplementation in infants prevent food allergy in the first year of life? The VITALITY Trial]. www.anzctr.org.au/Trial/Registration/TrialReview.aspx?id=366006&isReview=tru (first received 20 March 2014).
- Allen KJ, Panjari M, Koplin JJ, Ponsonby AL, Vuillermin P, Gurrin LC, et al. VITALITY trial: protocol for a randomised controlled trial to establish the role of postnatal vitamin D supplementation in infant immune health. BMJ Open 2015;5(12):e009377. [DOI: 10.1136/bmjopen-2015-009377] [DOI] [PMC free article] [PubMed] [Google Scholar]
ACTRN12615000642583 {published data only}
- ACTRN12615000642583. Infants of vitamin D deficient mothers - trial comparing pentavite and vitamin D3 supplement - effect on vitamin D level at 6 weeks [Infants of vitamin D deficient mothers - trial comparing 2 supplement options with vitamin D levels repeated at 6 weeks]. www.anzctr.org.au/Trial/Registration/TrialReview.aspx?id=362437 (first received 24 April 2012).
ACTRN12618001992291 {unpublished data only}
- ACTRN12618001992291. The Vaccination Infant Supplementation (VISS) Study - assessing the effect of vitamin D and probiotic supplementation around vaccination on infant's temperature and sleep pattern [Randomised placebo-controlled trial investigating the effect of 8 weeks supplementation with probiotics and vitamin D around routine childhood immunisation on infant's ear temperature, growth, and sleeping pattern in 4-24 month-old infants.]. anzctr.org.au/Trial/Registration/TrialReview.aspx?id=376526&isReview=true (first received 5 December 2018).
ChiCTR1800020179 {unpublished data only}
- ChiCTR1800020179. Study for vitamins and fatty acids status of breast milk and effects of related supplementation during lactation on the health of mothers and infants: a randomized clinical trial [Study for vitamins and fatty acids status of breast milk and effects of related supplementation during lactation on the breast milk composition and the health of mothers and infants: a randomized clinical trial]. www.chictr.org.cn/showprojen.aspx?proj=33888 (first received 19 December 2018).
Additional references
Adams 2010
- Adams JS, Hewison M. Update in vitamin D. Journal of Clinical Endocrinology & Metabolism 2010;95(2):471-8. [DOI: 10.1210/jc.2009-1773] [PMID: ] [DOI] [PMC free article] [PubMed] [Google Scholar]
Andiran 2002
- Andiran N, Yordam N, Ozön A. Risk factors for vitamin D deficiency in breast-fed newborns and their mothers. Nutrition 2002;18(1):47-50. [DOI: 10.1016/s0899-9007(01)00724-9] [PMID: ] [DOI] [PubMed] [Google Scholar]
Armas 2004
- Armas LA, Hollis BW, Heaney RP. Vitamin D2 is much less effective than vitamin D3 in humans. Journal of Clinical Endocrinology and Metabolism 2004;89(11):5387-91. [DOI: 10.1210/jc.2004-0360] [PMID: ] [DOI] [PubMed] [Google Scholar]
Butte 2001
- Butte NF, Lopez-Alarcon MG, Garza C. Nutrient adequacy of exclusive breastfeeding for the term infant during the first six months of life. In: Expert Consultation on the Optimal Duration of Exclusive Breastfeeding. Geneva: World Health Organization, 2001. [Google Scholar]
Clarke 2008
- Clarke B. Normal bone anatomy and physiology. Clinical Journal of the American Society of Nephrology 2008;3(Suppl 3):S131-9. [DOI: 10.2215/CJN.04151206] [PMID: ] [DOI] [PMC free article] [PubMed] [Google Scholar]
Crabtree 2014
- Crabtree NJ, Arabi A, Bachrach LK, Fewtrell M, El-Hajj Fuleihan G, Kecskemethy HH, et al. Dual-energy X-ray absorptiometry interpretation and reporting in children and adolescents: the revised 2013 ISCD Pediatric Official Positions. Journal of Clinical Densitometry 2014;17:225-42. [DOI] [PubMed] [Google Scholar]
Creo 2017
- Creo AL, Thacher TD, Pettifor JM, Strand MA, Fischer PR. Nutritional rickets around the world: an update. Paediatrics and International Child Health 2017;37(2):84-98. [DOI: 10.1080/20469047.2016.1248170] [PMID: ] [DOI] [PubMed] [Google Scholar]
Crocker 2011
- Crocker B, Green TJ, Barr SI, Beckingham B, Bhagat R, Dabrowska B, et al. Very high vitamin D supplementation rates among infants aged 2 months in Vancouver and Richmond, British Columbia, Canada. BMC Public Health 2011;11:905. [DOI: 10.1186/1471-2458-11-905] [PMID: ] [DOI] [PMC free article] [PubMed] [Google Scholar]
Dawodu 2003
- Dawodu A, Agarwal M, Hossain M, Kochiyil J, Zayed R. Hypovitaminosis D and vitamin D deficiency in exclusively breast-feeding infants and their mothers in summer: a justification for vitamin D supplementation of breast-feeding infants. Journal of Pediatrics 2003;142(2):169-73. [DOI: 10.1067/mpd.2003.63] [PMID: ] [DOI] [PubMed] [Google Scholar]
EFSA 2016
- EFSA NDA Panel (EFSA Panel on Dietetic Products, Nutrition and Allergies), Scientific opinion on dietary reference values for vitamin D. Dietary reference values for vitamin D. European Food Safety Authority Journal 2016;14(10):4547. [DOI: 10.2903/j.efsa.2016.4547] [DOI] [Google Scholar]
Elder 2014
- Elder CJ, Bishop NJ. Rickets. Lancet 2014;383(9929):1665-76. [DOI: 10.1016/S0140-6736(13)61650-5] [PMID: ] [DOI] [PubMed] [Google Scholar]
Fraser 1967
- Fraser D, Kooh SW, Scriver CR. Hyperparathyroidism as the cause of hyperaminoaciduria and phosphaturia in human vitamin D deficiency. Pediatric Research 1967;1(6):425-35. [DOI: 10.1203/00006450-196711000-00001] [PMID: ] [DOI] [PubMed] [Google Scholar]
GRADEpro GDT [Computer program]
- McMaster University (developed by Evidence Prime) GRADEpro GDT. Version (accessed 26 June 2018). Hamilton (ON): McMaster University (developed by Evidence Prime), 2015. Available at gradepro.org.
Haggerty 2010
- Haggerty LL. Maternal supplementation for prevention and treatment of vitamin D deficiency in exclusively breastfed infants. Breastfeeding Medicine 2010;6(3):137-44. [DOI: 10.1089/bfm.2010.0025] [PMID: ] [DOI] [PubMed] [Google Scholar]
Haugen 2016
- Haugen J, Ulak M, Chandyo RK, Henjum S, Thorne-Lyman AL, Ueland PM, et al. Low prevalence of vitamin D insufficiency among Nepalese infants despite high prevalence of vitamin D insufficiency among their mothers. Nutrients 2016;8(12):825. [DOI: 10.3390/nu8120825] [PMID: ] [DOI] [PMC free article] [PubMed] [Google Scholar]
Health Canada 2012
- Health Canada. Vitamin D and calcium: updated dietary reference intakes. www.canada.ca/en/health-canada/services/food-nutrition/healthy-eating/vitamins-minerals/vitamin-calcium-updated-dietary-reference-intakes-nutrition.html (accessed 25 July 2017).
Heinig 2003
- Heinig MJ. Vitamin D and the breastfed infant: controversies and concerns. Journal of Human Lactation 2003;19(3):247-9. [DOI: 10.1177/0890334403255420] [PMID: ] [DOI] [PubMed] [Google Scholar]
Higgins 2011
- Higgins JP, Green S, editor(s). Cochrane Handbook for Systematic Reviews of Interventions Version 5.1.0 (updated March 2011). The Cochrane Collaboration, 2011. Available from training.cochrane.org/handbook/archive/v5.1.
Higgins 2017
- Higgins JP, Thomas J, Chandler J, Cumpston M, Li T, Page MJ, Welch VA (editors). Cochrane Handbook for Systematic Reviews of Interventions Version 5.2.0 (updated June 2017). The Cochrane Collaboration, 2017. Available from training.cochrane.org/handbook.
Holick 1980
- Holick MF, MacLaughlin JA, Clark MB, Holick SA, Potts JT Jr, Anderson RR, et al. Photosynthesis of previtamin D3 in human skin and the physiologic consequences. Science 1980;210(4466):203-5. [DOI: 10.1126/science.6251551] [PMID: ] [DOI] [PubMed] [Google Scholar]
Holick 1981
- Holick MF. The cutaneous photosynthesis of previtamin D3: a unique photoendocrine system. Journal of Investigative Dermatology 1981;77(1):51-8. [DOI: 10.1111/1523-1747.ep12479237] [PMID: ] [DOI] [PubMed] [Google Scholar]
Holick 1992
- Holick MF, Shao Q, Liu WW, Chen TC. The vitamin D content of fortified milk and infant formula. New England Journal of Medicine 1992;326(18):1178-81. [DOI: 10.1056/NEJM199204303261802] [PMID: ] [DOI] [PubMed] [Google Scholar]
Hollis 1981
- Hollis BW, Roos BA, Draper HH, Lambert PW. Vitamin D and its metabolites in human and bovine milk. Journal of Nutrition 1981;111(7):1240-8. [DOI: 10.1093/jn/111.7.1240] [PMID: ] [DOI] [PubMed] [Google Scholar]
IOM 2011
- Institute of Medicine (US) Standing Committee on the Scientific Evaluation of Dietary Reference Intakes. Dietary Reference Intakes for Calcium, Phosphorus, Magnesium, Vitamin D, and Fluoride. Washington (DC): National Academies Press (US), 2011. [DOI: 10.17226/5776] [DOI] [PubMed] [Google Scholar]
Kasalová 2015
- Kasalová E, Aufartová J, Krčmová LK, Solichová D, Solich P. Recent trends in the analysis of vitamin D and its metabolites in milk – a review. Food Chemistry 2015;171:177-90. [DOI: 10.1016/j.foodchem.2014.08.102] [PMID: ] [DOI] [PubMed] [Google Scholar]
Koo 2013
- Koo W, Walyat N. Vitamin D and skeletal growth and development. Current Osteoporosis Reports 2013;11(3):188-93. [DOI: 10.1007/s11914-013-0156-1] [PMID: ] [DOI] [PubMed] [Google Scholar]
Lerch 2007
- Lerch C, Meissner T. Interventions for the prevention of nutritional rickets in term born children. Cochrane Database of Systematic Reviews 2007, Issue 4. Art. No: CD006164. [DOI: 10.1002/14651858.CD006164.pub2] [DOI] [PMC free article] [PubMed] [Google Scholar]
Lovell 2016
- Lovell AL, Wall CR, Grant CC. Do maternal dietary vitamin D intake and sunlight exposure affect the vitamin D status of exclusively breastfed infants? Nutrition & Dietetics 2016;73(5):420-6. [DOI: 10.1111/1747-0080.12254] [DOI] [Google Scholar]
Major 2013
- Major JM, Graubard BI, Dodd KW, Iwan A, Alexander BH, Linet MS, et al. Variability and reproducibility of circulating vitamin D in a nationwide U.S. population. Journal of Clinical Endocrinology and Metabolism 2013;98(1):97-104. [DOI: 10.1210/jc.2012-2643] [PMID: ] [DOI] [PMC free article] [PubMed] [Google Scholar]
Matsuoka 1992
- Matsuoka LY, Wortsman J, Dannenberg MJ, Hollis BW, Lu Z, Holick MF. Clothing prevents ultraviolet-B radiation-dependent photosynthesis of vitamin D3. Journal of Clinical Endocrinology and Metabolism 1992;75(4):1099-103. [DOI: 10.1210/jcem.75.4.1328275] [PMID: ] [DOI] [PubMed] [Google Scholar]
Merewood 2012
- Merewood A, Mehta SD, Grossman X, Chen TC, Mathieu J, Holick MF, et al. Vitamin D status among 4-month-old infants in New England: a prospective cohort study. Journal of Human Lactation 2012;28(2):159-66. [DOI: 10.1177/0890334411434802] [PMID: ] [DOI] [PubMed] [Google Scholar]
Misra 2008
- Misra M, Pacaud D, Petryk A, Collett-Solberg PF, Kappy M, Drug and Therapeutics Committee of the Lawson Wilkins Pediatric Endocrine Society. Vitamin D deficiency in children and its management: review of current knowledge and recommendations. Pediatrics 2008;122(2):398-417. [DOI: 10.1542/peds.2007-1894] [PMID: ] [DOI] [PubMed] [Google Scholar]
Munns 2016
- Munns CF, Shaw N, Kiely M, Specker BL, Thacher TD, Ozono K, et al. Global consensus recommendations on prevention and management of nutritional rickets. Journal of Clinical Endocrinology and Metabolism 2016;101(2):394-415. [DOI: 10.1210/jc.2015-2175] [PMID: ] [DOI] [PMC free article] [PubMed] [Google Scholar]
NHS 2017
- National Health Service, United Kingdom. Sun safety for children. www.nhs.uk/conditions/pregnancy-and-baby/pages/safety-in-the-sun.aspx# (accessed 25 January 2017).
NICE 2014
- National Institute for Health and Care Excellence. Vitamin D: increasing supplement use in at-risk groups (Public Health Guideline PH56). www.nice.org.uk/guidance/ph56 (accessed 1 February 2017).
Oliveri 2015
- Oliveri B, Mastaglia SR, Brito GM, Seijo M, Keller GA, Somoza J, et al. Vitamin D3 seems more appropriate than D2 to sustain adequate levels of 25OHD: a pharmacokinetic approach. European Journal of Clinical Nutrition 2015;69(6):697-702. [DOI: 10.1038/ejcn.2015.16] [PMID: ] [DOI] [PubMed] [Google Scholar]
Palacios 2019a
- Palacios C, Kostiuk LK, Peña‐Rosas JP. Vitamin D supplementation for women during pregnancy. Cochrane Database of Systematic Reviews 2019, Issue 7. Art. No: CD008873. [DOI: 10.1002/14651858.CD008873.pub4] [DOI] [PMC free article] [PubMed] [Google Scholar]
Palacios 2019b
- Palacios C, Trak‐Fellermeier MA, Martinez RX, Lopez‐Perez L, Lips P, Salisi JA, et al. Regimens of vitamin D supplementation for women during pregnancy. Cochrane Database of Systematic Reviews 2019, Issue 10. Art. No: CD013446. [DOI: 10.1002/14651858.CD013446] [DOI] [PMC free article] [PubMed] [Google Scholar]
Perrine 2010
- Perrine CG, Sharma AJ, Jefferds ME, Serdula MK, Scanlon KS. Adherence to vitamin D recommendations among US infants. Pediatrics 2010;125(4):627-32. [DOI: 10.1542/peds.2009-2571] [PMID: ] [DOI] [PubMed] [Google Scholar]
Pettifor 2004
- Pettifor JM. Nutritional rickets: deficiency of vitamin D, calcium, or both? American Journal of Clinical Nutrition 2004;80(6 Suppl):1725S-9S. [DOI: 10.1093/ajcn/80.6.1725S] [PMID: ] [DOI] [PubMed] [Google Scholar]
Pezzuti 2017
- Pezzuti IL, Kakehasi AM, Filgueiras MT, De Guimarães JA, De Lacerda IAC, Silva IN. Imaging methods for bone mass evaluation during childhood and adolescence: an update. Journal of Pediatric Endocrinology and Metabolism 2017;30(5):485-97. [DOI: 10.1515/jpem-2016-0252] [PMID: ] [DOI] [PubMed] [Google Scholar]
Pharange 2015
- Pharande P, Pammi M, Collins CT, Zhou SJ, Abrams SA. Vitamin D supplementation for prevention of vitamin D deficiency in preterm and low birth weight infants. Cochrane Database of Systematic Reviews 2015, Issue 2. Art. No: CD011529. [DOI: 10.1002/14651858.CD011529] [DOI] [Google Scholar]
Pludowski 2013
- Pludowski P, Holick MF, Pilz S, Wagner CL, Hollis BW, Grant WB, et al. Vitamin D effects on musculoskeletal health, immunity, autoimmunity, cardiovascular disease, cancer, fertility, pregnancy, dementia and mortality - a review of recent evidence. Autoimunity Reviews 2013;12(10):976-89. [DOI: 10.1016/j.autrev.2013.02.004] [PMID: ] [DOI] [PubMed] [Google Scholar]
Prentice 2013
- Prentice A. Nutritional rickets around the world. Journal of Steroid Biochemistry and Molecular Biology 2013;136:201-6. [DOI: 10.1016/j.jsbmb.2012.11.018] [PMID: ] [DOI] [PubMed] [Google Scholar]
RevMan 2020 [Computer program]
- The Cochrane Collaboration Review Manager 5 (RevMan 5). Version 5.4. The Cochrane Collaboration, 2020.
Roth 2018
- Roth DE, Abrams SA, Aloia J, Bergeron G, Bourassa MW, Brown KH, et al. Global prevalence and disease burden of vitamin D deficiency: a roadmap for action in low- and middle-income countries. Annals of the New York Academy of Sciences 2018;1430(1):44-79. [DOI: 10.1111/nyas.13968] [PMID: ] [DOI] [PMC free article] [PubMed] [Google Scholar]
Salameh 2016
- Salameh K, Al-Janahi NS, Reedy AM, Dawodu A. Prevalence and risk factors for low vitamin D status among breastfeeding mother-infant dyads in an environment with abundant sunshine. International Journal of Women's Health 2016;8:529-35. [DOI: 10.2147/IJWH.S107707] [PMID: ] [DOI] [PMC free article] [PubMed] [Google Scholar]
Schünemann 2013
- Schünemann H, Brożek J, Guyatt G, Oxman A, editor(s). Handbook for grading the quality of evidence and the strength of recommendations using the GRADE approach (updated October 2013). GRADE Working Group, 2013. Available from gdt.guidelinedevelopment.org/app/handbook/handbook.html.
Shore 2013a
- Shore RM, Chesney RW. Rickets: part I. Pediatric Radiology 2013;43(2):140-51. [DOI: 10.1007/s00247-012-2532-x] [PMID: ] [DOI] [PubMed] [Google Scholar]
Shore 2013b
- Shore RM, Chesney RW. Rickets: part II. Pediatric Radiology 2013;43(2):152-72. [DOI: 10.1007/s00247-012-2536-6] [PMID: ] [DOI] [PubMed] [Google Scholar]
Taylor 2010
- Taylor JA, Geyer LJ, Feldman KW. Use of supplemental vitamin D among infants breastfed for prolonged periods. Pediatrics 2010;125(1):105-11. [DOI: 10.1542/peds.2009-1195] [PMID: ] [DOI] [PubMed] [Google Scholar]
Umaretiya 2017
- Umaretiya PJ, Oberhelman SS, Cozine EW, Maxson JA, Quigg SM, Thacher TD. Maternal preferences for vitamin D supplementation in breastfed infants. Annals of Family Medicine 2017;15(1):68-70. [DOI: 10.1370/afm.2016] [PMID: ] [DOI] [PMC free article] [PubMed] [Google Scholar]
US Dietary Guidelines Advisory Committee 2020
- Dietary Guidelines Advisory Committee. Scientific Report of the 2020 Dietary Guidelines Advisory Committee: Advisory Report to the Secretary of Agriculture and the Secretary of Health and Human Services. www.dietaryguidelines.gov/2020-advisory-committee-report (accessed 20 August 2020).
Við Streym 2016
- Við Streym S, Hojskov CS, Møller UK, Heickendorff L, Vestergaard P, Mosekilde L, et al. Vitamin D content in human breast milk: a 9-mo follow-up study. American Journal of Clinical Nutrition 2016;103(1):107-14. [DOI: 10.3945/ajcn.115.115105] [PMID: ] [DOI] [PubMed] [Google Scholar]
Wagner 2008
- Wagner CL, Greer FR, American Academy of Pediatrics Section on Breastfeeding, American Academy of Pediatrics Committee on Nutrition. Prevention of rickets and vitamin D deficiency in infants, children, and adolescents. Pediatrics 2008;122(5):1142-52. [DOI: 10.1542/peds.2008-1862] [PMID: ] [DOI] [PubMed] [Google Scholar]
Wharton 2003
- Wharton B, Bishop N. Rickets. Lancet 2003;362(9393):1389-400. [DOI: 10.1016/S0140-6736(03)14636-3] [PMID: ] [DOI] [PubMed] [Google Scholar]
WHO 2003
- World Health Organization, UNICEF. Global strategy for infant and young child feeding. whqlibdoc.who.int/publications/2003/9241562218.pdf (accessed 24 January 2017).
Winzenberg 2010
- Winzenberg TM, Powell S, Shaw KA, Jones G. Vitamin D supplementation for improving bone mineral density in children. Cochrane Database of Systematic Reviews 2010, Issue 10. Art. No: CD006944. [DOI: 10.1002/14651858.CD006944.pub2] [DOI] [PubMed] [Google Scholar]
Winzenberg 2013a
- Winzenberg T, Jones G. Vitamin D and bone health in childhood and adolescence. Calcified Tissue International 2013;92(2):140-50. [DOI: 10.1007/s00223-012-9615-4] [PMID: ] [DOI] [PubMed] [Google Scholar]
Winzenberg 2013b
- Winzenberg TM, Shaw KA, Van der Mei IAF, Jones G. Vitamin D supplementation in infancy for improving bone density. Cochrane Database of Systematic Reviews 2013, Issue 7. Art. No: CD010658. [DOI: 10.1002/14651858.CD010658] [DOI] [Google Scholar]
References to other published versions of this review
Tan 2018
- Tan ML, Abrams SA, Osborn DA. Vitamin D supplementation for term breastfed infants to prevent vitamin D deficiency and improve bone health. Cochrane Database of Systematic Reviews 2018, Issue 6. Art. No: CD013046. [DOI: 10.1002/14651858.CD013046] [DOI] [PMC free article] [PubMed] [Google Scholar]