Significance
Phenol soluble modulins (PSMs) are an important class of peptides secreted by Staphylococcus aureus bacteria. The toxicity to human cells and unique ability of one such peptide, PSMα3, to aggregate into an α-helical amyloid-like structure may hold a key to a better understanding of the virulence of dangerous pathogens such as methicillin resistant S. aureus. In reporting a detailed two-dimensional infrared (2DIR) analysis of PSMα3, we found direct evidence of multiple aggregate architectures existing in equilibrium with one another. We also discovered a unique and characteristic 2DIR spectroscopic signature that unambiguously reports on the presence of the unusual and highly cytotoxic cross-α amyloid structure.
Keywords: cross-α fibril, 2DIR, PSMα3, coherent cross-peak
Abstract
The formation of ordered cross-β amyloid protein aggregates is associated with a variety of human disorders. While conventional infrared methods serve as sensitive reporters of the presence of these amyloids, the recently discovered amyloid secondary structure of cross-α fibrils presents new questions and challenges. Herein, we report results using Fourier transform infrared spectroscopy and two-dimensional infrared spectroscopy to monitor the aggregation of one such cross-α–forming peptide, phenol soluble modulin alpha 3 (PSMα3). Phenol soluble modulins (PSMs) are involved in the formation and stabilization of Staphylococcus aureus biofilms, making sensitive methods of detecting and characterizing these fibrils a pressing need. Our experimental data coupled with spectroscopic simulations reveals the simultaneous presence of cross-α and cross-β polymorphs within samples of PSMα3 fibrils. We also report a new spectroscopic feature indicative of cross-α fibrils.
Amyloids are elongated fibers of proteins or peptides typically composed of stacked cross β-sheets (1, 2). Self-assembling amyloids are notorious for their involvement in human neurodegenerative diseases such as Alzheimer’s and Parkinson’s diseases (1, 2). Phenol soluble modulins (PSMs) are amyloid peptides secreted by the bacteria Staphylococcus aureus (S. aureus) (3–5). Of the PSM family, PSMα3 is of recent interest due to its unique secondary structure upon fibrillation. Whereas other PSM variants undergo conformational changes with aggregation, the α-helical PSMα3 peptide retains its secondary structure while stacking in a manner reminiscent of β-sheets, forming what has been termed cross-α fibrils (3, 4, 6). Although “α-sheet” amyloid fibrils have been previously observed in two-dimensional infrared (2DIR) (7) and associated with PSMs (8), the novel cross-α fibril is distinct from that class of structures. To avoid confusion between these two similarly named but distinct secondary structures, a comparison between the α-sheet domain in cytosolic phosphatase A2 (9) (Protein Data Bank [PDB] identification:1rlw) (10) and cross-α fibrils adopted by PSMα3 (PDB ID:5i55) (3) has been highlighted in SI Appendix, Fig. S1. Interestingly, shorter terminations of PSMα3 have been shown to exhibit β-sheet polymorphs (11). The proposed cross-α fibril structure of the full-length PSMα3 peptide has been confirmed with X-ray diffraction and circular dichroism (4). The present study aims to further characterize these fibrils with linear and nonlinear infrared spectroscopies.
S. aureus is an infectious human pathogen with the ability to form communities of microorganisms called biofilms that hinder traditional treatment methods (12–14). PSMs contribute to inflammatory response and play a crucial role in structuring and detaching biofilms (11, 12, 14). While biofilm growth requires the presence of multiple PSMs (14, 15), Andreasen and Zaman have demonstrated that PSMα3 acts as a scaffold, seeding the amyloid formation of other PSMs (5). To effectively inhibit S. aureus biofilm growth, a better understanding of PSMα3 aggregation is needed.
The α-helical structure of PSMα3 (12) presents a challenge for probing the vibrational modes and secondary structure of both the monomer and the fibrils. While IR spectroscopy has been used extensively to characterize β-sheets (16–19), the spectral features associated with α-helices are difficult to distinguish from those of the random coil secondary structure (20, 21). This limitation has left researchers to date with an incomplete picture of the spectroscopic features unique to cross-α fibers. The present work combines a variety of 2DIR methods to remove these barriers and probe the active infrared vibrational modes of cross-α fibers.
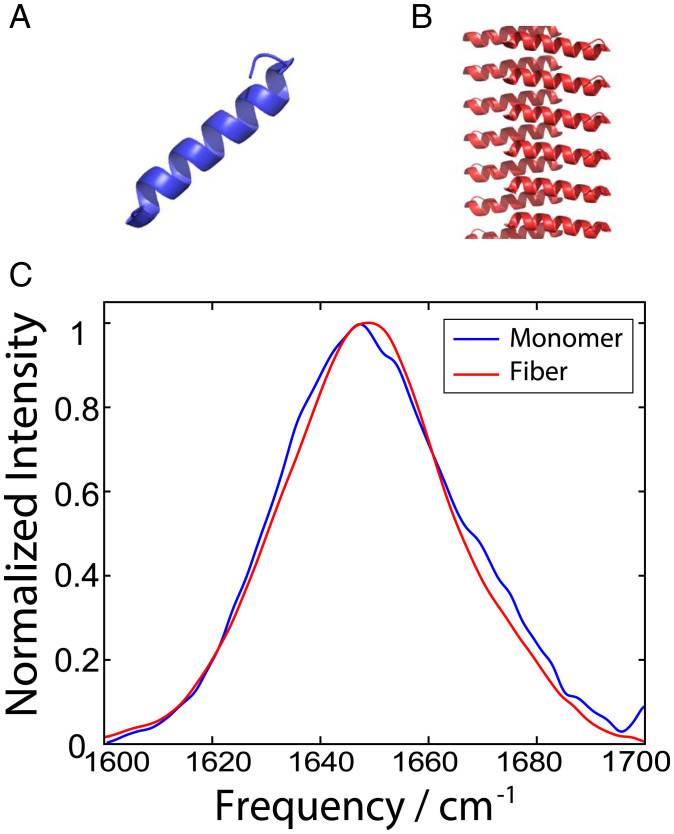
The full-length, 22-residue PSMα3 peptide was synthesized and prepared for aggregation studies following reported methods (3, 4, 11). A total of 10 mM PSMα3 was incubated in D2O at room temperature over 7 d. These data were compared to the monomer treated under similar conditions. Monomeric samples were prepared at a significantly lower concentration of 0.5 mM to prevent aggregation. Fiber formation was confirmed by transmission electron microscopy (see SI Appendix, Fig. S2 for details). Fourier transform infrared (FTIR) spectra were taken for both the fibrils in solution as well as the low concentration monomers. Spectroscopic simulations of the PSMα3 monomer and fibers were performed on previously reported PDB structures (PDB identification: 5i55) (3) (Fig. 1).
Fig. 1.
PDB structures of PSMα3 (A) monomers and (B) cross-α fibers extended along the screw axis. (C) FTIR spectra of 0.5 mM monomeric PSMα3 (blue) compared to the 10 mM PSMα3 fibril (red) in D2O upon aggregation.
Results
In general, IR spectra of monomeric α-helices can typically be characterized by three nearly degenerate modes: the A mode and the doubly degenerate E modes, appearing as a broad peak centered at 1,650 cm−1 (17, 21, 22). Comparing the FTIR spectrum (Fig. 1C) of the low concentration monomer (blue) with that of the fibrils in solution (red) reveals a broad peak centered around 1,650 cm−1 in both spectra, with no significant spectroscopic differences. This broad peak is indicative of either an α-helical or random coil secondary structure (23). FTIR alone is unable to distinguish between the two structures or resolve any conformational changes between the two samples. To address these ambiguities, we turned to the versatile technique of 2DIR spectroscopy. 2DIR has been widely used in studies of protein folding (24, 25) and amyloid aggregation (18, 26) because of its sensitivity to secondary structure (27, 28). Similar to 2D NMR, 2DIR is a correlation spectroscopy that reports on vibrationally coupled modes via the emergence of cross-peaks (29). In efforts to isolate cross-peaks, different combinations of the pump and probe beam polarizations may be employed. The present study employs polarization-dependent 2DIR using a combination of broad band (BB) and narrow band (NB) pump experiments in order to isolate cross-peaks characteristic of secondary and tertiary structure (18, 30).
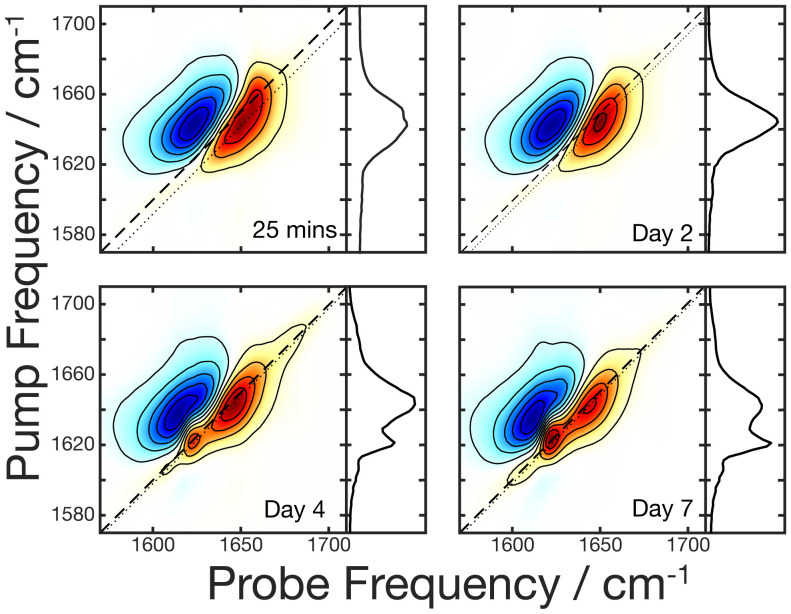
A 2DIR spectrum stretches the linear spectrum over two axes, with each peak in the FTIR appearing as a peak pair. The positive peak (red) corresponds to the ground state bleach and stimulated emission (the 0 to 1 vibrational transition), while the negative peak (blue) corresponds to the excited state absorption (the 1 to 2 transition). To investigate potential conformational changes during the fibrillation process, a weeklong incubation was continuously monitored with 2DIR using an eight-frame phase cycling scheme as described below. Fig. 2 shows the spectra taken at relatively equally spaced time points during the incubation process during which significant spectral changes occur. The 2DIR spectrum in Fig. 2A has one spectral feature centered around 1,650 cm−1 (probe) at 25 min into the incubation. This peak position is consistent with the initial α-helical structure of the monomer observed in the FTIR spectrum. No significant spectral changes were observed until day 4 (Fig. 2C), when a second peak pair emerged at 1,622 cm−1 (probe) along with a low intensity peak at 1,680 cm−1. The 1,620-cm−1 spectral region is predominantly characteristic of β-sheets (17, 23, 29). The low-intensity peak at 1,680 cm−1 is consistent with parallel β-sheets (26, 31). Β-sheets have a defining set of cross-peaks, making them easy to distinguish from other spectral features in this region (19, 31). To definitively assign this peak pair at 1,622 cm−1 to β-sheets, we relied on polarization-dependent spectra, which will be discussed below. By day 7 (Fig. 2D), no further spectral changes were observed other than the increase of signal in the diagonal peaks. The increased signal at 1,622 cm−1 is strong evidence of the growth of β-sheets, and while not obvious from the normalized signals in Fig. 2, the absolute intensity of the 1,650-cm−1 peak also increased over time, which is indicative of growth of an excitonic signal (32).
Fig. 2.
2DIR spectra monitoring the weeklong aggregation of 10 mM PSMα3 in D2O taken at the time points indicated in Lower Right. The dotted lines correspond to the diagonal slices shown in the panels to the right of each spectrum.
It is important to note that while the signal in an FTIR spectrum scales as μ2 (the transition dipole moment squared), 2DIR signals scale as μ4, leading to signal enhancement for highly coupled systems such as the protein backbone of a β-sheet (27, 32–34). Therefore, it is not surprising that despite the strong intensity of the 1,622 cm−1 peak in the 2DIR spectrum, this peak is not readily apparent in the FTIR data. A recent study estimated that 20 to 40% of PSMα3 fibrils adopt a β-sheet population. These investigators have also shown that short regions within PSMα3 act as seeds for amyloid β-aggregation (5). In the spectrum, a peak remains at 1,649 cm−1 after incubation. To determine whether this peak originates from cross-α fibrils or solubilized monomers, we turned to phase cycling (35–37) (see SI Appendix for details).
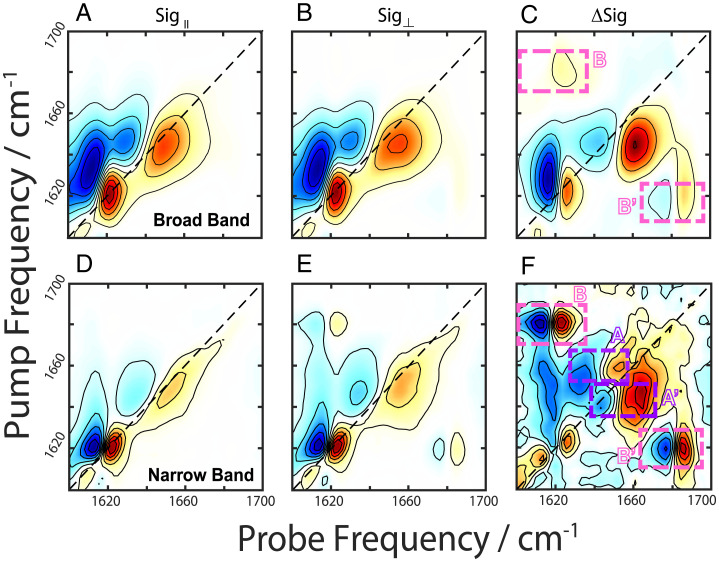
We performed BB 2DIR experiments with eight-frame phase cycling (38) using both parallel (Fig. 3A) and perpendicular (Fig. 3B) polarizations on a 1-wk incubated sample at a spot with high scattering to ensure fibril signals are being collected (39, 40) (SI Appendix, Fig. S3, Center and Phase Cycling Schemes). These spectra show peaks in both the α/random coil and β-dominant spectral regions (1,650 and 1,620 cm−1, respectively). Fig. 3C shows a difference spectrum between the normalized parallel and perpendicular spectra. In a difference spectrum, the diagonal peaks are suppressed, enhancing the cross-peak signals (41, 42). The BB difference spectrum (Fig. 3C) reveals a potential set of cross-peaks (denoted B’) at (probe, pump) = (1,689, 1,622) cm−1; however, the signal for its matching peak pair, which should appear in the region denoted “B,” is weak and difficult to resolve. In addition, there remains peaks along the diagonal.
Fig. 3.
2DIR spectra of aggregated PSMα3 taken with parallel (column 1) and perpendicular (column 2) polarizations using broad band pump (A–C) and narrow band pump (D–F) pulses taken at the same sample position. The difference spectra are shown in the last column with the dashed boxed highlighting cross-peak regions for α-helices (purple) denoted A and A’ and α -sheets (pink) denoted B and B’.
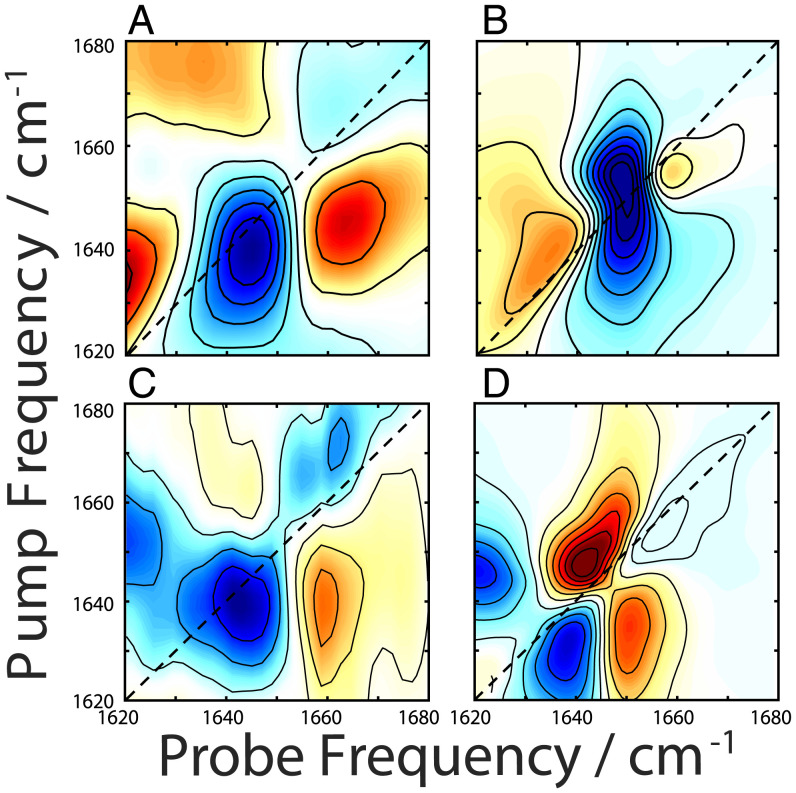
A BB measurement simultaneously excites all modes within the spectral bandwidth. This leads to the so-called “diagonal” cross-peaks that are prevalent in Fig. 3C (42). Here, we define diagonal cross-peak as peaks lying along the diagonal arising from interactions between multiple oscillators. We point to figure 4.13 in ref. 42 in which these peaks were first referred to as diagonal cross-peaks (42). An effective strategy to remove these diagonal cross-peak signals and isolate the coherent off-diagonal cross-peak signal is to preferentially excite one mode at a time, which can be achieved by switching to an NB 2D measurement (42, 43). Despite the inherently noisier signal with this technique (42, 43), collecting NB spectra offers advantages in analyzing spectra because of the reduced number of pathways probed (interstate coherences in ref. 43 are eliminated) (42, 43) as well as allowing for direct comparison with previously reported spectra taken in a similar manner. The NB difference spectrum (Fig. 3F) reveals cross-peak pairs at (probe, pump) = (1,620, 1,687) cm−1 and (1,682, 1,623) cm−1 (denoted B and B’, respectively), consistent with previously reported β-sheets (31). We also observe characteristic α-helical cross-peak pairs at (probe, pump) = (1,653, 1,662) and (1,663, 1,645) cm−1, denoted A and A’. (21, 24, 25) The peaks in these regions arise from coupling between the A and E modes. Random coil peptides would not give rise to any cross-peaks (20); hence, we can confidently assign the 1,650-cm−1 peak to α-helices.
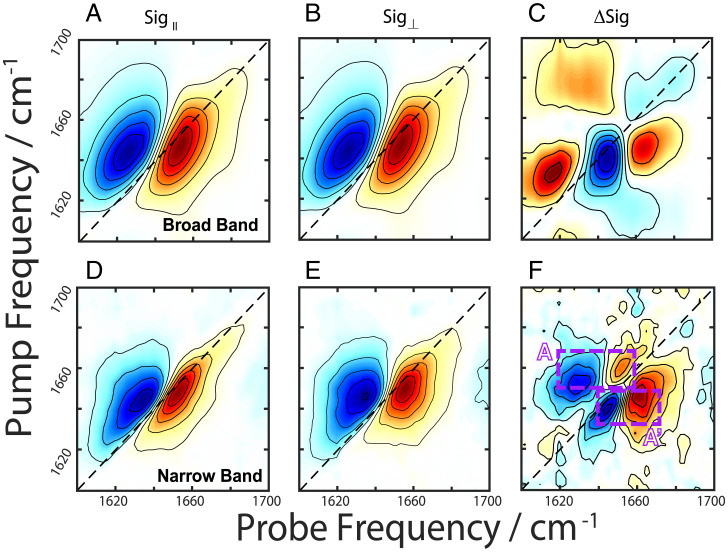
In order to isolate spectral features of purely cross-α fibrils, the BB (Fig. 4 A–C) and NB (Fig. 4 D and E) pump experiments were repeated at a new location in the sample where only α-helical peaks (1,650 cm−1) were present, along with scattered light indicating the presence of fibrils (SI Appendix, Fig. S3, Center). Once again, a strong coherent signal appeared along the diagonal of the BB polarization difference spectrum (Fig. 4C), while the NB difference spectrum (Fig. 4F) revealed α-helical cross-peaks (A and A’) at (probe, pump) = (1,661, 1,648) cm−1 and (1,651, 1,662) cm−1, matching those in Fig. 3F. The coherent signal along the diagonal of the BB polarization difference spectrum (Fig. 4C) has the structure of a non-rephasing line shape, which is consistent with a diagonal cross-peak between two strongly coupled states.
Fig. 4.
2DIR spectra of PSMα3 cross-α/β fibrils taken with parallel (column 1) and perpendicular (column 2) polarizations using broad band pump (A–C) and narrow band pump (D–F) pulses taken at the same sample position. The difference spectra are shown in the last column with the dashed boxed highlighting cross-peak regions for the α-helix (purple) denoted A and A’.
To ensure this spectroscopic signal is unique to cross-α fibrils and not inherent to monomeric PSMα3, the BB experiments were repeated with a monomeric sample (SI Appendix, Fig. S4). The monomer BB difference spectrum does not reveal the same coherent cross-peak pattern as the fibril but rather shows peaks similar to those denoted A and A’ in Figs. 3F and 4F. Therefore, we assign the peak pattern in Fig. 4C to a diagonal coherent cross-peak between modes within the stacked cross-α fibril. The stacked structure allows for new combinations of A and E mode interactions that would not be possible in the monomeric α-helix alone, suggesting that this signal can serve as a probe of cross-α formation
In order to validate the assignments of the experimental spectra, 2DIR simulations were performed. Due to the extended nature of the system, it was necessary to simulate a 40-unit-cell-long system (structure shown in Fig. 1B), which corresponded to 1,760 interacting peptide units. Because a conventional sum over state 2DIR simulations protocols would be unfeasible on such a large system, we opted to use the nonlinear exciton scattering approach of Mukamel (44–49) (see SI Appendix for details). The parallel and perpendicular BB 2D spectra were simulated for the 40-unit fibril of PSMα3, and the difference spectrum is plotted in Fig. 5B. The simulated BB difference spectrum (Fig. 5B) possesses a strong peak with a non-rephasing line shape along the diagonal, similar to what was observed experimentally (Fig. 5A). In addition, the simulated difference spectrum of the PSMα3 monomer prior to aggregation are also consistent with the experimental spectrum (Fig. 5 C and D). Therefore, this peak pattern in the polarization difference spectrum can be used to infer the presence of cross-α fibrils. While identifying this peak required the collection of multiple spectra, some versions of the 2DIR experiment can directly access the information in the polarization difference spectrum in a single measurement (42).
Fig. 5.
2DIR broad band pump difference spectra of PSMα3 cross-α/β fibrils (A) experimental (B) simulated spectrum of a 40-unit fiber. The PSMα3 monomer difference spectra are shown in the bottom row for (C) experiment and (D) simulation.
Discussion
In conclusion, the 22-residue peptide PSMα3 was shown to exhibit cross-α and cross-β polymorphism at room temperature within the same samples. Structural polymorphism, in the sense of different structures being observed under different aggregation conditions, has been observed in the past for PSM peptides (4, 11); the present work is evidence of α/β polymorphs coexisting within the same sample. We also present a spectroscopic signature, resulting from coherent cross-peaks in the 2DIR data, that uniquely reports on cross-α fibril secondary structure. Further study is required to identify the specific spectroscopic pathways giving rise to this coherent cross-peak, while more sophisticated modeling may be needed to allow quantitative, rather than just qualitative, identification of fibril species.
Materials and Methods
Peptide Synthesis.
Phenol soluble modulin alpha-3 (PSMα3), MEFVAKLFKFFKDLLGKFLGNN-NH2, was synthesized on a PS3 peptide synthesizer following conventional Fmoc synthesis on a Rink-amide resin (50). The peptide was cleaved with trifluoroacetic acid (TFA). Following synthesis, the crude peptide was purified on a Jasco LC-4000 HPLC system with a RP-C18 column with molecular weight confirmed by matrix assisted laser desorption/ionization mass spectrometry. The pure peptide was then suspended in hexafluoroisopropanol and 10% (vol/vol) HCl to exchange TFA. The peptide was then lyophilized overnight and stored as a powder. For IR samples, the dry peptide was suspended in deuterated hexafluoroisopropanol (HFIP-d) to exchange amide hydrogens with deuterium. The sample was left to exchange for 45 min. This procedure was repeated twice, with the second lyophilization cycle taking place over night to remove any trace solvent.
FTIR Spectroscopy.
All FTIR samples were prepared under dry air in a custom sample holder and sandwiched between two 2 × 25.4–mm CaF2 windows (Crystran Ltd.) with a 50.8-μm spacer (Scientific Commodities, Inc.). FTIR spectra were taken with a Thermo-Nicolet iS50R FTIR spectrometer and detected with an external 1 × 1–mm 20-MHz photovoltaic mercury–cadmium–telluride (MCT) detector in a sealed box under dry air to prevent inference of atmospheric water.
2DIR Spectroscopy.
Details for the 2DIR laser system are described elsewhere (50, 51). Briefly, 3.5-mJ, 30-fs, 800-nm pulses from a 1-kHz repetition rate Astrella laser system (Coherent) are directed into a TOPAS prime OPA (Light Conversion) followed by a homebuilt AgGaS2-based difference frequency generator to produce our broadband mid-IR beam. The pump beam is sent through an AOM-based mid-IR pulse shaper (PhaseTech Spectroscopy) in order to generate the pulse sequences necessary to perform 2DIR. The waiting time delay between the pump and probe pulses was set to 100 fs. Beam waists were measured to be ∼30 μm using the 80/20 knife-edge method. The probe was directed through the sample into a homebuilt monochromator where the spectrum was detected with an MCT focal plane array camera (Teledyne Catalina). The reference beam spectrum was detected simultaneously on the same camera. Data were processed using a custom MATLAB code. Details on NB 2DIR experiments are located in SI Appendix.
Supplementary Material
Acknowledgments
A.L.S. gratefully acknowledges support from the College of Science at the University of Notre Dame. We thank Dr. Mijoon Lee in the Mass Spectrometry and Proteomics Facility at University of Notre Dame and Dr. Maksym Zhukovskyi in the Integrated Imaging Facility at University of Notre Dame. We also thank Dr. Allen Oliver for helpful discussions.
Footnotes
The authors declare no competing interest.
This article is a PNAS Direct Submission. M.Z. is a guest editor invited by the Editorial Board.
This article contains supporting information online at https://www.pnas.org/lookup/suppl/doi:10.1073/pnas.2114923119/-/DCSupplemental.
Data Availability
All study data are included in the article and/or SI Appendix.
References
- 1.Eisenberg D., Jucker M., The amyloid state of proteins in human diseases. Cell 148, 1188–1203 (2012). [DOI] [PMC free article] [PubMed] [Google Scholar]
- 2.Nilsson M. R., Techniques to study amyloid fibril formation in vitro. Methods 34, 151–160 (2004). [DOI] [PubMed] [Google Scholar]
- 3.Tayeb-Fligelman E., et al. , The cytotoxic Staphylococcus aureus PSMα3 reveals a cross-α amyloid-like fibril. Science 355, 831–833 (2017). [DOI] [PMC free article] [PubMed] [Google Scholar]
- 4.Tayeb-Fligelman E., Salinas N., Tabachnikov O., Landau M., Staphylococcus aureus PSMα3 cross-α fibril polymorphism and determinants of cytotoxicity. Structure 28, 301–313.e6 (2020). [DOI] [PubMed] [Google Scholar]
- 5.Zaman M., Andreasen M., Cross-talk between individual phenol-soluble modulins in Staphylococcus aureus biofilm enables rapid and efficient amyloid formation. eLife 9, 1–17 (2020). [DOI] [PMC free article] [PubMed] [Google Scholar]
- 6.Das M., Dash S., Bhargava B. L., Computational studies of fibrillation induced selective cytotoxicity of cross-α amyloid – Phenol soluble modulin A3. Chem. Phys. 535, e59776 (2020). [Google Scholar]
- 7.Hilaire M. R., Ding B., Mukherjee D., Chen J., Gai F., Possible existence of α-sheets in the amyloid fibrils formed by a TTR105-115 mutant. J. Am. Chem. Soc. 140, 629–635 (2018). [DOI] [PMC free article] [PubMed] [Google Scholar]
- 8.Bleem A., Francisco R., Bryers J. D., Daggett V., Designed α-sheet peptides suppress amyloid formation in Staphylococcus aureus biofilms. NPJ Biofilms Microbiomes 3, 16 (2017). [DOI] [PMC free article] [PubMed] [Google Scholar]
- 9.Armen R. S., Alonso D. O. V., Daggett V., Anatomy of an amyloidogenic intermediate: Conversion of beta-sheet to alpha-sheet structure in transthyretin at acidic pH. Structure 12, 1847–1863 (2004). [DOI] [PubMed] [Google Scholar]
- 10.Perisic O., Fong S., Lynch D. E., Bycroft M., Williams R. L., Crystal structure of a calcium-phospholipid binding domain from cytosolic phospholipase A2. J. Biol. Chem. 273, 1596–1604 (1998). [DOI] [PubMed] [Google Scholar]
- 11.Salinas N., Colletier J. P., Moshe A., Landau M., Extreme amyloid polymorphism in Staphylococcus aureus virulent PSMα peptides. Nat. Commun. 9, 3512 (2018). [DOI] [PMC free article] [PubMed] [Google Scholar]
- 12.Towle K. M., et al. , Solution structures of phenol-soluble modulins α1, α3, and β2, virulence factors from Staphylococcus aureus. Biochemistry 55, 4798–4806 (2016). [DOI] [PubMed] [Google Scholar]
- 13.Satpathy S., Sen S. K., Pattanaik S., Raut S., Review on bacterial biofilm: An universal cause of contamination. Biocatal. Agric. Biotechnol. 7, 56–66 (2016). [Google Scholar]
- 14.Periasamy S., et al. , How Staphylococcus aureus biofilms develop their characteristic structure. Proc. Natl. Acad. Sci. U.S.A. 109, 1281–1286 (2012). [DOI] [PMC free article] [PubMed] [Google Scholar]
- 15.Schwartz K., Syed A. K., Stephenson R. E., Rickard A. H., Boles B. R., Functional amyloids composed of phenol soluble modulins stabilize Staphylococcus aureus biofilms. PLoS Pathog. 8, e1002744 (2012). [DOI] [PMC free article] [PubMed] [Google Scholar]
- 16.Lomont J. P., Ostrander J. S., Ho J.-J. J., Petti M. K., Zanni M. T., Not all β-sheets are the same: Amyloid infrared spectra, transition dipole strengths, and couplings investigated by 2D IR spectroscopy. J. Phys. Chem. B 121, 8935–8945 (2017). [DOI] [PMC free article] [PubMed] [Google Scholar]
- 17.Baiz C. R., Reppert M., Tokmakoff A., “An introduction to protein 2D IR spectroscopy” in Ultrafast Infrared Vibrational Spectroscopy, Fayer M. D., Ed. (CRC Press, Boca Raton, 2013), pp. 361–404. [Google Scholar]
- 18.Shim S. H., Strasfeld D. B., Ling Y. L., Zanni M. T., Automated 2D IR spectroscopy using a mid-IR pulse shaper and application of this technology to the human islet amyloid polypeptide. Proc. Natl. Acad. Sci. U.S.A. 104, 14197–14202 (2007). [DOI] [PMC free article] [PubMed] [Google Scholar]
- 19.Demirdöven N., et al. , Two-dimensional infrared spectroscopy of antiparallel β-sheet secondary structure. J. Am. Chem. Soc. 126, 7981–7990 (2004). [DOI] [PubMed] [Google Scholar]
- 20.Grechko M., Zanni M. T., Quantification of transition dipole strengths using 1D and 2D spectroscopy for the identification of molecular structures via exciton delocalization: Application to α-helices. J. Chem. Phys. 137, 184202 (2012). [DOI] [PMC free article] [PubMed] [Google Scholar]
- 21.Woutersen S., Hamm P., Time-resolved two-dimensional vibrational spectroscopy of a short α-helix in water. J. Chem. Phys. 115, 7737–7743 (2001). [Google Scholar]
- 22.Lee S. H., Krimm S., General treatment of vibrations of helical molecules and application to transition dipole coupling in amide I and amide II modes of α-helical poly(L-alanine). Chem. Phys. 230, 277–295 (1998). [Google Scholar]
- 23.Barth A., Zscherp C., What vibrations tell us about proteins. Q. Rev. Biophys. 35, 369–430 (2002). [DOI] [PubMed] [Google Scholar]
- 24.Huerta-Viga A., Woutersen S., Protein denaturation with guanidinium: A 2D-IR study. J. Phys. Chem. Lett. 4, 3397–3401 (2013). [DOI] [PMC free article] [PubMed] [Google Scholar]
- 25.Panman M. R., van Dijk C. N., Meuzelaar H., Woutersen S., Communication: Nanosecond folding dynamics of an alpha helix: Time-dependent 2D-IR cross peaks observed using polarization-sensitive dispersed pump-probe spectroscopy. J. Chem. Phys. 142, 041103 (2015). [DOI] [PubMed] [Google Scholar]
- 26.Middleton C. T., Buchanan L. E., Dunkelberger E. B., Zanni M. T., Utilizing lifetimes to suppress random coil features in 2D IR spectra of peptides. J. Phys. Chem. Lett. 2, 2357–2361 (2011). [DOI] [PMC free article] [PubMed] [Google Scholar]
- 27.Deflores L. P., Ganim Z., Nicodemus R. A., Tokmakoff A., Amide I′-II’ 2D IR spectroscopy provides enhanced protein secondary structural sensitivity. J. Am. Chem. Soc. 131, 3385–3391 (2009). [DOI] [PubMed] [Google Scholar]
- 28.Khalil M., Demirdöven N., Tokmakoff A., Demirdo N., Tokmakoff A., Coherent 2D IR spectroscopy: Molecular structure and dynamics in solution. J. Phys. Chem. A 107, 5258–5279 (2003). [Google Scholar]
- 29.Ghosh A., Ostrander J. S., Zanni M. T., Watching proteins wiggle: Mapping structures with two-dimensional infrared spectroscopy. Chem. Rev. 117, 10726–10759 (2017). [DOI] [PMC free article] [PubMed] [Google Scholar]
- 30.Hamm P., Lim M., DeGrado W. F., Hochstrasser R. M., The two-dimensional IR nonlinear spectroscopy of a cyclic penta-peptide in relation to its three-dimensional structure. Proc. Natl. Acad. Sci. U.S.A. 96, 2036–2041 (1999). [DOI] [PMC free article] [PubMed] [Google Scholar]
- 31.Cheatum C. M., Tokmakoff A., Knoester J., Signatures of β-sheet secondary structures in linear and two-dimensional infrared spectroscopy. J. Chem. Phys. 120, 8201–8215 (2004). [DOI] [PubMed] [Google Scholar]
- 32.Dunkelberger E. B., Grechko M., Zanni M. T., Transition dipoles from 1D and 2D infrared spectroscopy help reveal the secondary structures of proteins: Application to amyloids. J. Phys. Chem. B 119, 14065–14075 (2015). [DOI] [PMC free article] [PubMed] [Google Scholar]
- 33.Kim Y. S., Hochstrasser R. M., Applications of 2D IR spectroscopy to peptides, proteins, and hydrogen-bond dynamics. J. Phys. Chem. B 113, 8231–8251 (2009). [DOI] [PMC free article] [PubMed] [Google Scholar]
- 34.Kim Y. S., Hochstrasser R. M., Chemical exchange 2D IR of hydrogen-bond making and breaking. Proc. Natl. Acad. Sci. U.S.A. 102, 11185–11190 (2005). [DOI] [PMC free article] [PubMed] [Google Scholar]
- 35.Middleton C. T., Woys A. M., Mukherjee S. S., Zanni M. T., Residue-specific structural kinetics of proteins through the union of isotope labeling, mid-IR pulse shaping, and coherent 2D IR spectroscopy. Methods 52, 12–22 (2010). [DOI] [PMC free article] [PubMed] [Google Scholar]
- 36.Ghosh A., et al. , Experimental implementations of 2D IR spectroscopy through a horizontal pulse shaper design and a focal plane array detector. Opt. Lett. 41, 524–527 (2016). [DOI] [PMC free article] [PubMed] [Google Scholar]
- 37.Shim S.-H., Zanni M. T., How to turn your pump-probe instrument into a multidimensional spectrometer: 2D IR and Vis spectroscopies via pulse shaping. Phys. Chem. Chem. Phys. 11, 748–761 (2009). [DOI] [PMC free article] [PubMed] [Google Scholar]
- 38.Baiz C. R., Schach D., Tokmakoff A., Ultrafast 2D IR microscopy. Opt. Express 22, 18724–18735 (2014). [DOI] [PMC free article] [PubMed] [Google Scholar]
- 39.Hall D., et al. , Protein aggregate turbidity: Simulation of turbidity profiles for mixed-aggregation reactions. Anal. Biochem. 498, 78–94 (2016). [DOI] [PubMed] [Google Scholar]
- 40.Nishida J., et al. , Structural dynamics inside a functionalized metal-organic framework probed by ultrafast 2D IR spectroscopy. Proc. Natl. Acad. Sci. U.S.A. 111, 18442–18447 (2014). [DOI] [PMC free article] [PubMed] [Google Scholar]
- 41.Zanni M. T., Ge N. H., Kim Y. S., Hochstrasser R. M., Two-dimensional IR spectroscopy can be designed to eliminate the diagonal peaks and expose only the crosspeaks needed for structure determination. Proc. Natl. Acad. Sci. U.S.A. 98, 11265–11270 (2001). [DOI] [PMC free article] [PubMed] [Google Scholar]
- 42.Hamm P., Zanni M. T., Concepts and Methods of 2D Infrared Spectroscopy (Cambridge University Press, 2011). [Google Scholar]
- 43.Cervetto V., Helbing J., Bredenbeck J., Hamm P., Double-resonance versus pulsed Fourier transform two-dimensional infrared spectroscopy: An experimental and theoretical comparison. J. Chem. Phys. 121, 5935–5942 (2004). [DOI] [PubMed] [Google Scholar]
- 44.Mukamel S., “Many-body and cooperative effects in the nonlinear response” in Principles of Nonlinear Optical Spectroscopy, Lapp M., Nishizawa J.-I., Snavely B. B., Stark H., Tam A. C., Wilson T., Eds. (Oxford University Press, New York, 1998), vol. 168, pp. 479–519. [Google Scholar]
- 45.Abramavicius D., Mukamel S., Time-domain chirally-sensitive three-pulse coherent probes of vibrational excitons in proteins. Chem. Phys. 318, 50–70 (2005). [Google Scholar]
- 46.Zhuang W., Abramavicius D., Hayashi T., Mukamel S., Simulation protocols for coherent femtosecond vibrational spectra of peptides. J. Phys. Chem. B 110, 3362–3374 (2006). [DOI] [PMC free article] [PubMed] [Google Scholar]
- 47.Abramavicius D., Palmieri B., Voronine D. V., Šanda F., Mukamel S., Coherent multidimensional optical spectroscopy of excitons in molecular aggregates; quasiparticle versus supermolecule perspectives. Chem. Rev. 109, 2350–2408 (2009). [DOI] [PMC free article] [PubMed] [Google Scholar]
- 48.Zhang W. M., Meier T., Chemyak V., Mukamel S., Exciton-migration and three-pulse femtosecond optical spectroscopies of photosynthetic antenna complexes. J. Chem. Phys. 108, 7763–7774 (1998). [Google Scholar]
- 49.Torii H., Tasumi M., Model calculations on the amide-I infrared bands of globular proteins. J. Chem. Phys. 96, 3379–3387 (1992). [Google Scholar]
- 50.Edun D. N., Flanagan M. R., Serrano A. L., Does liquid-liquid phase separation drive peptide folding? Chem. Sci. (Camb.) 12, 2474–2479 (2020). [DOI] [PMC free article] [PubMed] [Google Scholar]
- 51.Cracchiolo O. M., Geremia D. K., Corcelli S. A., Serrano A. L., Hydrogen bond exchange and Ca2+ binding of aqueous N-methylacetamide revealed by 2DIR spectroscopy. J. Phys. Chem. B 124, 6947–6954 (2020). [DOI] [PubMed] [Google Scholar]
Associated Data
This section collects any data citations, data availability statements, or supplementary materials included in this article.
Supplementary Materials
Data Availability Statement
All study data are included in the article and/or SI Appendix.


