Abstract
PURPOSE
Small-cell lung cancer (SCLC) is the deadliest form of lung cancer, partly because of its short doubling time. Delays in imaging identification and diagnosis of nodules create a risk for stage migration. The purpose of our study was to determine if a machine learning radiomics model can detect SCLC on computed tomography (CT) among all nodules at least 1 cm in size.
MATERIALS AND METHODS
Computed tomography scans from a single institution were selected and resampled to 1 × 1 × 1 mm. Studies were divided into SCLC and other scans comprising benign, adenocarcinoma, and squamous cell carcinoma that were segregated into group A (noncontrast scans) and group B (contrast-enhanced scans). Four machine learning classification models, support vector classifier, random forest (RF), XGBoost, and logistic regression, were used to generate radiomic models using 59 quantitative first-order and texture Imaging Biomarker Standardization Initiative compliant PyRadiomics features, which were found to be robust between two segmenters with minimum Redundancy Maximum Relevance feature selection within each leave-one-out-cross-validation to avoid overfitting. The performance was evaluated using a receiver operating characteristic curve. A final model was created using the RF classifier and aggregate minimum Redundancy Maximum Relevance to determine feature importance.
RESULTS
A total of 103 studies were included in the analysis. The area under the receiver operating characteristic curve for RF, support vector classifier, XGBoost, and logistic regression was 0.81, 0.77, 0.84, and 0.84 in group A, and 0.88, 0.87, 0.85, and 0.81 in group B, respectively. Nine radiomic features in group A and 14 radiomic features in group B were predictive of SCLC. Six radiomic features overlapped between groups A and B.
CONCLUSION
A machine learning radiomics model may help differentiate SCLC from other lung lesions.
INTRODUCTION
Lung cancer is the second most commonly diagnosed cancer among men and women and the most common cause of cancer-related deaths in the United States, with over 140,000 estimated deaths to occur in 2020 alone.1 The subtype with the worst prognosis is small-cell lung cancer (SCLC), which represents 13% of all lung cancers.2 The 5-year overall survival for SCLC is 6.5% compared with 20.5% for non–small-cell lung cancer (NSCLC).3 SCLC is typically divided into limited stage (LS) versus extensive stage (ES) disease, with ES representing disease that cannot be encompassed into a tolerable radiation field. Two thirds of patients present with ES-SCLC.4 Notably, survival in SCLC varies markedly for LS versus ES, with 5-year survival at 27.2% for LS-SCLC and 2.9% for ES-SCLC.3 SCLC has an aggressive doubling time as short as 25-54 days.5 Therefore, early detection of SCLC is critical to expedite diagnosis and treatment. A delay of 1-2 months between initial imaging and diagnosis could be within the doubling time of the tumor and is not uncommon.6 In a National Cancer Database study, 28% of patients with SCLC underwent treatment initiation more than 28 days after diagnosis.7 Presumably, the time to treatment from initial imaging was significantly longer. These longer delays could result in stage migration whereby a patient with initially localized disease can develop metastatic disease, adversely affecting overall prognosis and survival.
CONTEXT
Key Objective
Can a machine learning radiomics model be used to predict if a lung nodule on computed tomography (CT) is likely to be small-cell lung cancer (SCLC)?
Knowledge Generated
Several machine learning classifiers were able to accurately identify whether a nodule was SCLC on either noncontrast (NC) and/or contrast-enhanced (CE) CT scans. A random forest radiomic classifier performed well on both NC and CE CT scans with an area under the receiver operating characteristic curve of 0.81 and 0.88, respectively, with six radiomic features found in common for both NC and CE scans that were predictive of SCLC.
Relevance
A machine learning radiomics model could be used for early prediction of SCLC on CT and allow for more rapid triage to tissue diagnosis, thus reducing the risk of stage migration.
Currently, apart from surgical or needle biopsy, no clear method exists to distinguish SCLC from other subtypes of lung cancers or from benign nodules when identified incidentally or on screening computed tomography (CT) examinations. A possible method to allow early distinction is through the use of radiomics, which uses combinations of quantitative imaging features for diagnostic or predictive purposes.8,9 Radiomic feature analysis has been used to distinguish benign from malignant nodules, to determine tumor phenotypes and patient prognosis, and to determine response to treatment.10-15 Most existing studies have aimed to categorize nodules as benign or malignant or to classify the subtype of malignancy. For radiomics to potentially allow appropriate triage of patients with SCLC, it will need to correctly identify SCLC among all types of nodules, benign and malignant. The purpose of this study is to determine if a radiomics model can adequately distinguish SCLC among histology of other nodules for lesions that are 1 cm or larger within the lung, specifically those that are benign, adenocarcinoma, and squamous cell carcinoma (SCC), for both contrast and noncontrast (NC) CT scans. Our subject population comes from the Veterans Health Administration (VA), the largest integrated health care system in the United States with 170 medical centers and over 1,000 outpatient care sites. As the incidence of smoking, a known risk factor for lung cancer, is high within VA patients,16-18 it provides an opportunity to study radiomics in a population at great risk of lung cancer.
MATERIALS AND METHODS
Patient Selection
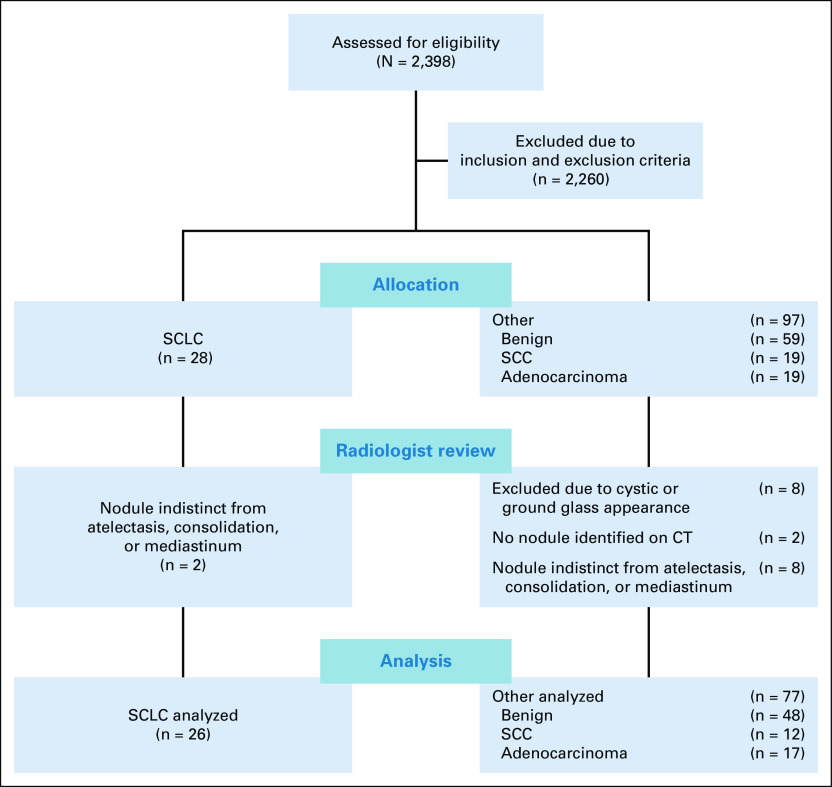
This retrospective study was approved by the Institutional Review Board overseeing research at both the VA Palo Alto Health Care System and Stanford University. All images were obtained from a single VA medical center. We obtained chest CT studies exhibiting two types: cancerous and benign nodules. Figure 1 displays a flow diagram comparing the study groups. Studies from December 2015 to 2018 were included in the analysis and were obtained from the local tumor registry and from a review of radiology reports for benign nodules. For the cancer studies, the inclusion criteria were presence of SCLC, adenocarcinoma, or SCC. Exclusion criteria included (1) no CT chest scan available prior to diagnosis; (2) tumor indistinct from atelectasis, mediastinum, or consolidation; (3) tumor < 1 cm in greatest diameter; (4) tumor predominantly ground glass or cystic; or (5) no standard kernel CT series available. For benign studies, inclusion criteria were presence of a solid nodule 1 cm or larger in greatest diameter and confirmation of benign lesion. We considered a lesion benign if the patient had (1) a biopsy with adequate tissue confirming the lesion was noncancerous, (2) follow-up imaging demonstrating resolution of the lesion within 2 years of the initial study, (3) serial follow-up chest CT imaging for at least 2 years confirming no change in the lesion, or (4) prior imaging from a minimum of 2 years earlier showing no change. For benign lesions, we considered exclusion criteria as (1) low-dose technique that we defined as a dose length product < 200 mGy-cm, (2) series reconstruction without a standard soft-tissue kernel with contiguous axial images 2.5 mm or less in thickness, (3) ground glass nodules, and (4) known active metastatic cancer. In both cases, lesions were limited to 1 cm or larger in greatest diameter for both technical and clinical concerns. Clinically, the risk of cancer for a nodule 1-1.5 cm (12.2% at baseline and 13.8% at 2 years) is over twice that for nodules 8-10 mm in size (5.8% at baseline and 6.4% at 2 years) with the risk increasing substantially with size.19 In addition, only 13% of SCLC is found at < 1 cm in size in a screening population because of its aggressive nature, and we could not identify any in our lung cancer registry.20 From a technical standpoint, a prior study has shown a minimum volume, typically > 1,000 mm3, which is recommended to calculate some radiomic features.21
FIG 1.
Patient selection flowchart for both cancer and benign nodules. CT chest scan reports were reviewed for presence of a nodule and then imaging selected on the basis of the listed exclusion criteria. CT, computed tomography; SCC, squamous cell cancer; SCLC, small-cell lung cancer.
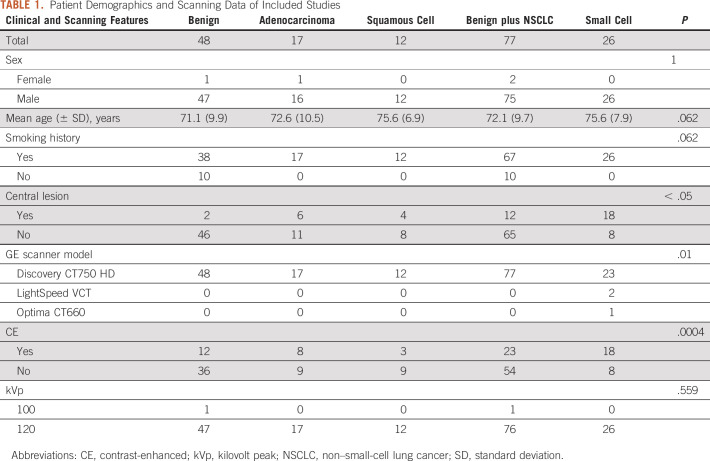
After final study selection, the available series for each study were reviewed, and series with contiguous axial 1.25 mm thickness slices with a standard soft-tissue kernel were chosen for all studies. The 1.25 mm thickness slices were used as this was consistently present in all studies. We selected only scans performed before any initial diagnosis or treatment intervention and collected age, sex, smoking, and lesion centrality data for all patients. A lesion was considered central if it directly communicated with the hilum or mediastinum. Finally, the data were divided into two groups: group A was composed of all NC scans within the data set and group B was composed of all contrast-enhanced (CE) scans within the data set. Within each group, studies were either classified as SCLC or other—with other composed of adenocarcinoma, SCC, or benign nodules.
Computational Analysis
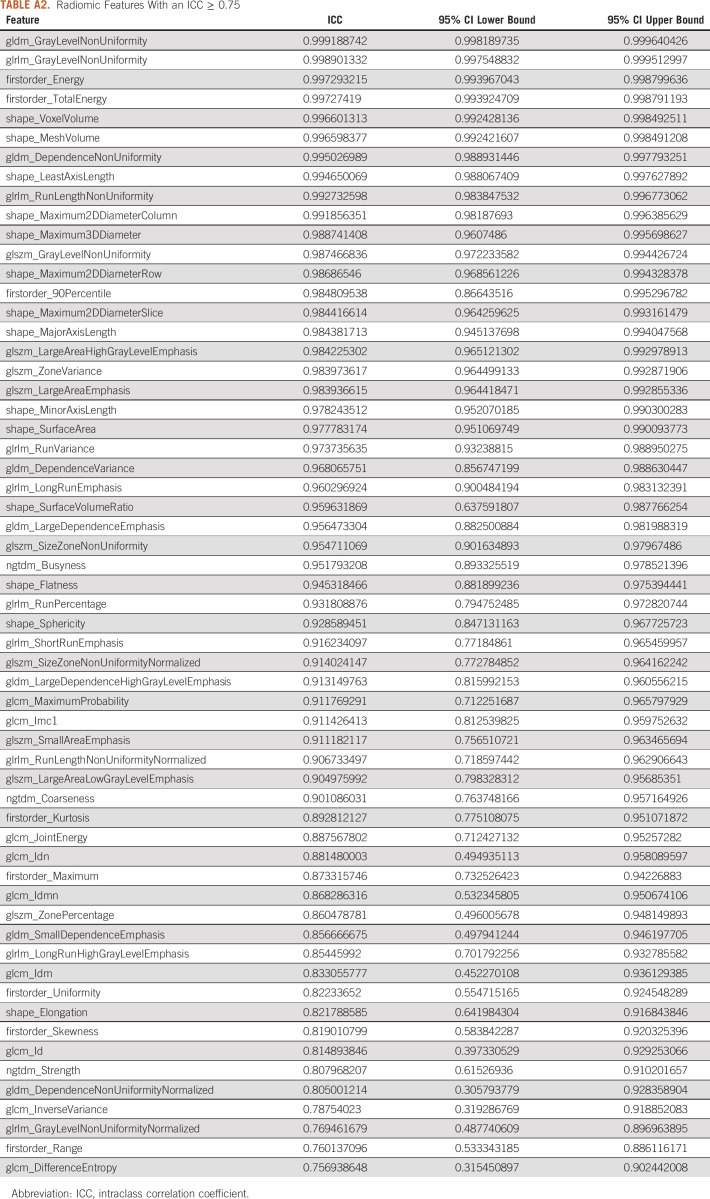
A board-certified radiologist with 10 years of experience segmented all scans using the software program ITK-SNAP22 using either autosegmentation or adaptive brush tools with manual adjustments in axial, coronal, and sagittal planes using both lung and abdomen viewing windows as needed. Eighteen scans, eight contrast and 10 NC, were randomly selected by an individual not performing segmentations and without viewing the scans. A second board-certified radiologist with 5 years of experience segmented these 18 scans using the same technique to measure interobserver agreement. We used the following rules for segmentation: (1) all solid areas of the tumor were included in the segmentation, (2) areas of tumor that were cystic were excluded from the segmentation, (3) on CE scans, lobar blood vessels were excluded from the segmentation, and (4) dense ground glass or nodularity contiguous with the lesion as visualized on lung windows were included in the segmentation. For image processing, resampling was performed to correct for voxel differences to a size of 1 × 1 × 1 mm. We used PyRadiomics version 3.023 with default settings for feature extraction. Among the 120 features available, we selected only 105 features meeting the standards of the Image Biomarkers Standardization Initiative (IBSI).24 Intraclass correlation coefficients (ICCs) were generated for the features using the segmentations for the 18 scans performed by two different radiologists. For feature reduction, only features with an excellent25 ICC ≥ 0.75 were chosen for inclusion. Z-score normalization was performed across the features in the training set to generate a heatmap. Features from the following PyRadiomics classes were included: (1) first-order features, (2) shape features, (3) gray-level co-occurrence matrix, (4) gray-level run matrix, (5) neighboring gray-tone difference matrix, and (6) gray-level dependence matrix. The clinical characteristics in Table 1 were also included. Each classifier was trained using a leave-one-out-cross-validation (LOOCV). For each LOOCV, we applied (1) synthetic minority oversampling technique to overcome the class imbalance,26-28 (2) Z-score normalization for scaling, and (3) minimum Redundancy Maximum Relevance for top-performing feature selection (n = 5).29 The following four machine learning classifiers were used with the hyperparameters listed in Appendix Table A1: random forest (RF), support vector classifier (SVC), XGBoost (XGB), and logistic regression (LR). We applied the same method for group A and group B. In addition, we created a clinical model using each classifier with sex, age, smoking, and lesion location features. Given prior work showing RF to have a high prognostic performance with high stability,30 we created a final RF model using the intersection of all the top five features in the LOOCV. Feature importance was then determined from this final RF model.
TABLE 1.
Patient Demographics and Scanning Data of Included Studies
Statistical Analysis
One-versus-rest modeling with a LOOCV was performed for SCLC versus other using each machine learning classifier for each group. Interobserver agreement was assessed for all 105 IBSI compliant features using ICC with a two-way random average measure. For each classifier, we calculated the mean area under the receiver operating characteristic curve (AUROC) and plotted the receiver operating characteristic (ROC) curve of the RF classifier with its 95% CI, calculated using 2,000 stratified bootstrap samples for each group. We used a two-sided DeLong's test31 to compare the AUROC of the RF, SVC, XGB, and LR classification models and to compare clinical, radiomic, and clinical with radiomic models. We compared the clinical and scanning characteristics between the SCLC and other (benign and NSCLC) groups using an unpaired t-test for continuous variables and Fisher's exact test for categorical variables (Table 1). A P value < .05 was considered statistically significant for all comparisons. The final RF model was used to generate Shapley Additive Explanation (SHAP) plots demonstrating feature importance.32 SHAP plots allow representation of the average contribution of a feature, either negative or positive, to the prediction when taking all possible combinations of features into account. Machine learning models were executed using Python 3.9 (Python Software Foundation, Beaverton, OR), and all statistical analyses were performed using R 4.0.2 (The R Foundation for Statistical Computing, Vienna, Austria).
RESULTS
For the studies with cancerous nodules, a total of 28 patients with SCLC, 18 patients with adenocarcinoma, and 12 patients with SCC met the inclusion and exclusion criteria while a total of 48 patients met the inclusion and exclusion criteria for benign nodules (Fig 1). A total of 103 unique studies were included in the analysis with demographics and scanning data detailed in Table 1. Group A contained eight SCLC and 54 other NC scans, whereas group B contained 18 SCLC and 23 other CE scans. Using an ROC power test, group A had a power of 0.8 to detect an AUROC of 0.79 and group B had a power of 0.8 to detect an AUROC of 0.74.
A total of 59 IBSI-compliant radiomic features had an ICC ≥ 0.75 (Appendix Table A2) and were included in the classifier training. Figure 2 illustrates the heatmap generated after Z-score normalization before training. We trained the machine learning classifiers with and without inclusion of the clinical features; however, including them did not demonstrate a significant performance improvement (P > .1 for all classifiers in both groups; Appendix Table A3), and the results are reported without incorporation of these. The average AUROC for each classifier in group A and group B is listed in Table 2 for both the radiomics and clinical models. No classifier performed statistically better in either group (P > .2), except for LR, which performed better than SVC in group A (P = .04). In addition, the clinical model, despite having a lower AUROC across the board for all classifiers, did not have statistically lower performance except for LR and XGB classifiers in group A. Figure 3 shows the ROC curves for the RF classifier.
FIG 2.
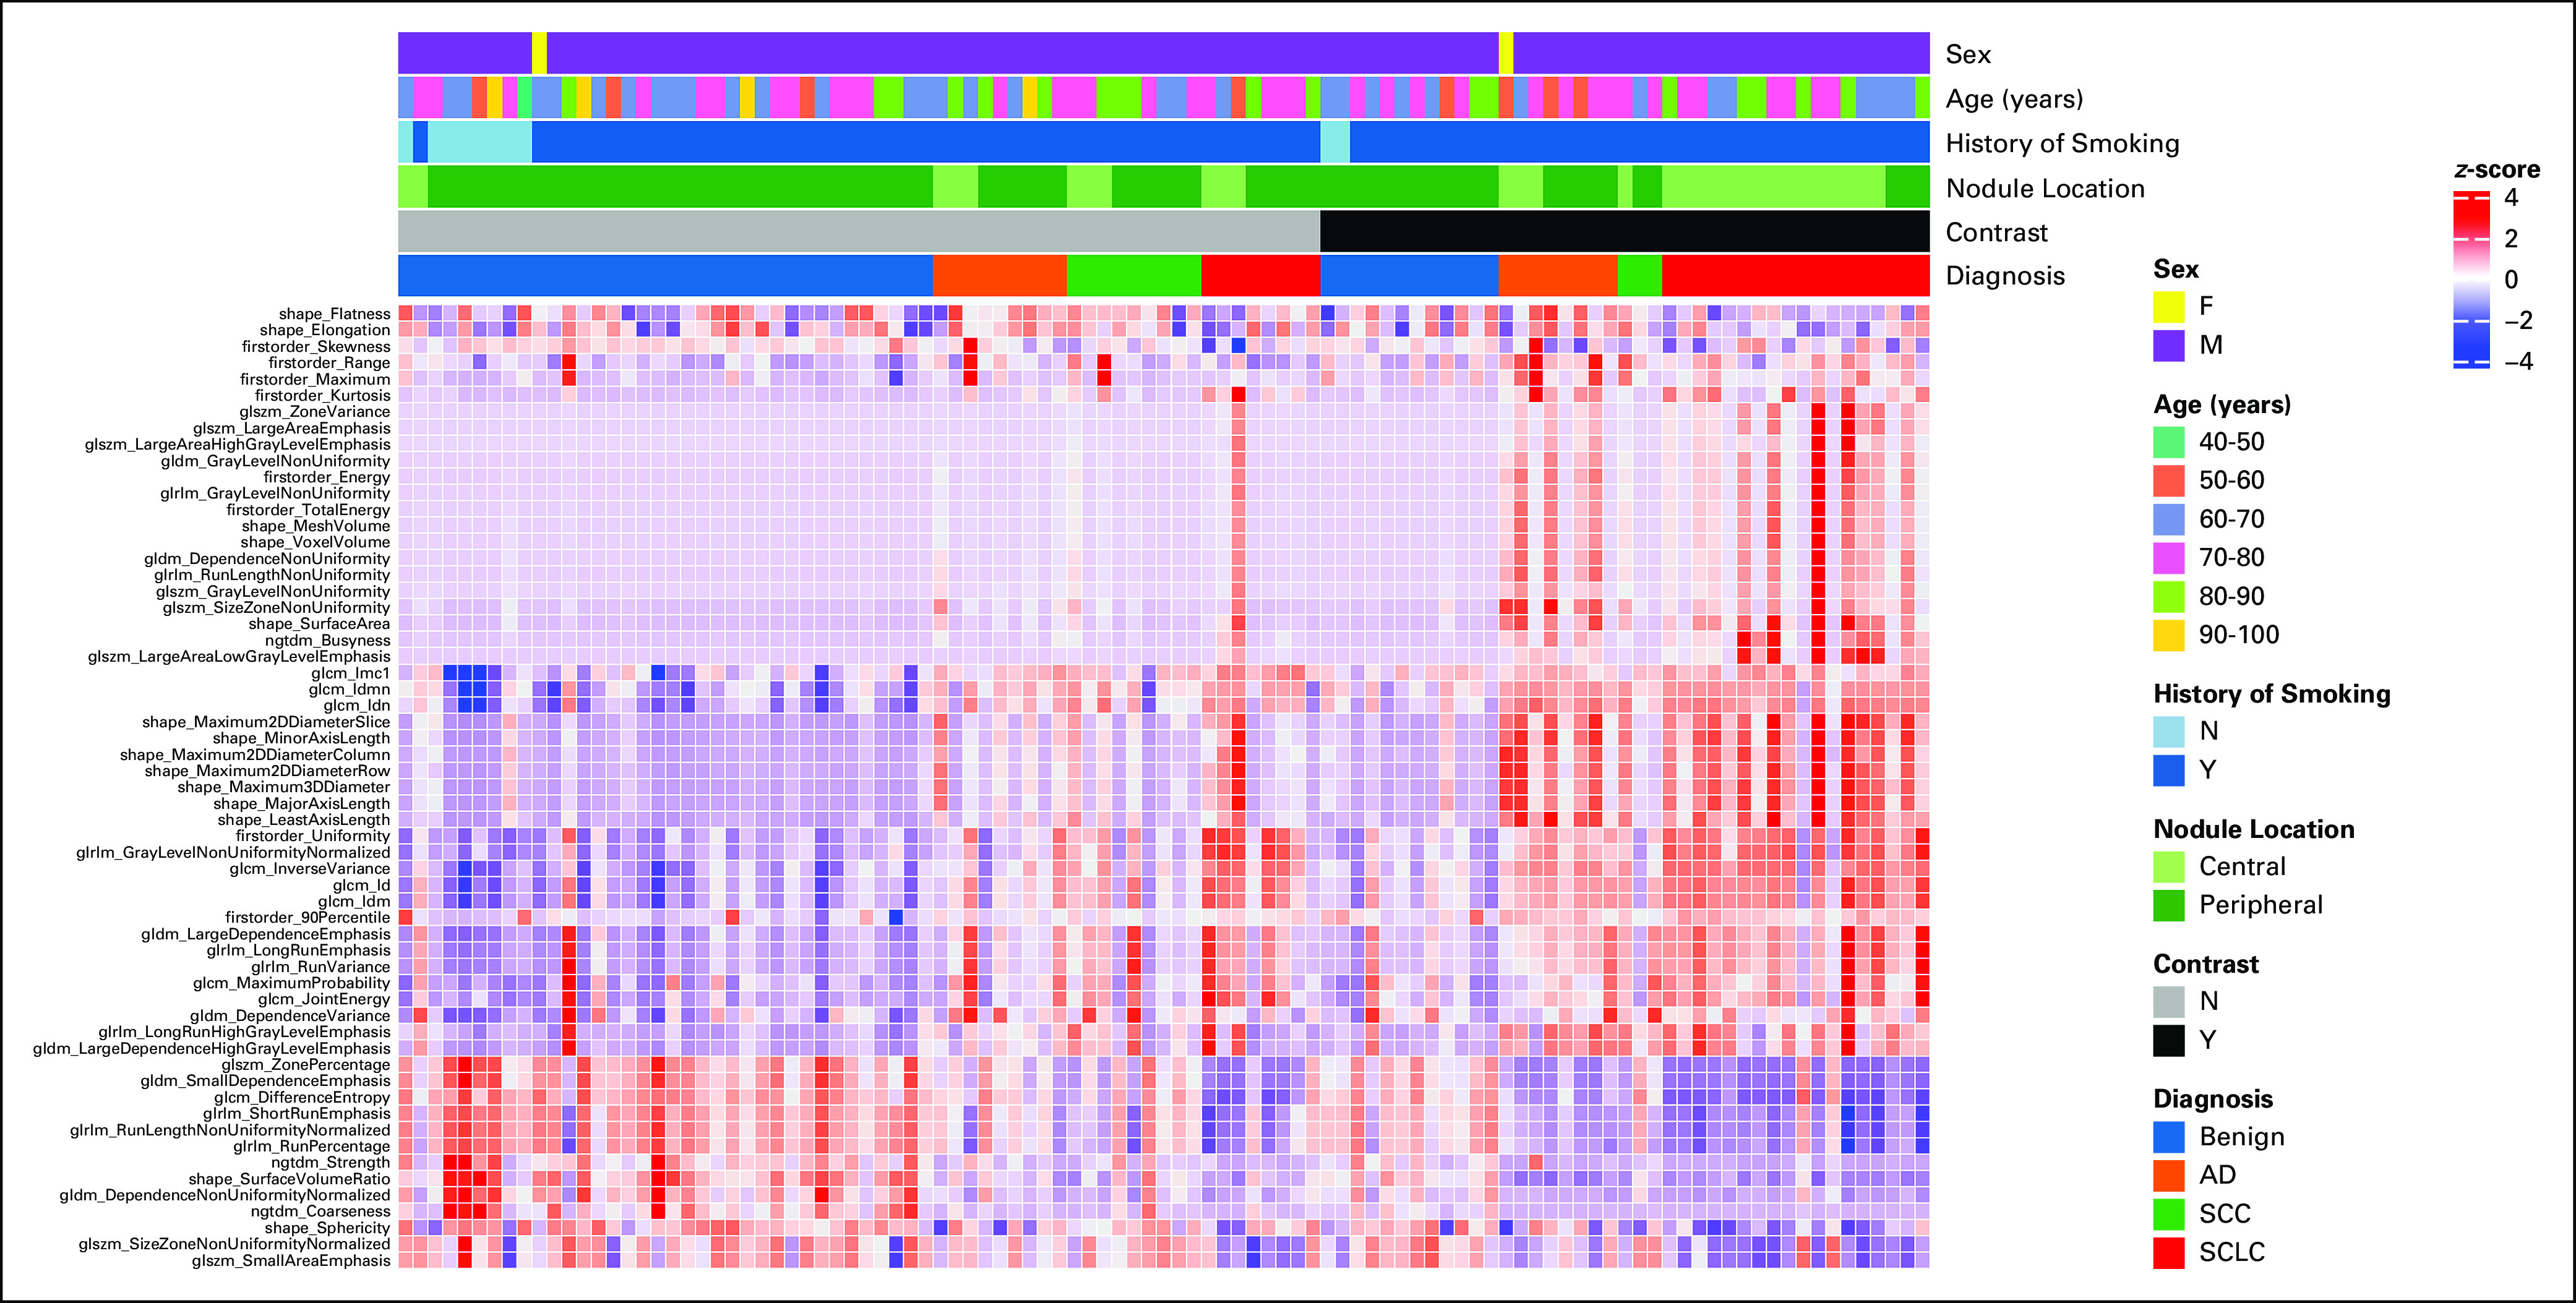
Heatmap demonstrating radiomic feature Z-score values for benign, SCLC, adenocarcinoma, and SCC across 59 features with a high intraclass correlation between two segmenters. Each column represents a unique patient. Contrast usage shows a different Z-score distribution for malignant tumors compared with benign lesions and NC scans. Therefore, separate models were generated for the use of contrast versus NC studies. AD, Adenocarcinoma; F, female; M, male; N, no; NC, noncontrast; SCC, squamous cell cancer; SCLC, small-cell lung cancer; Y, yes.
TABLE 2.
AUROC (95% CI) for Different Machine Learning Classifiers
FIG 3.
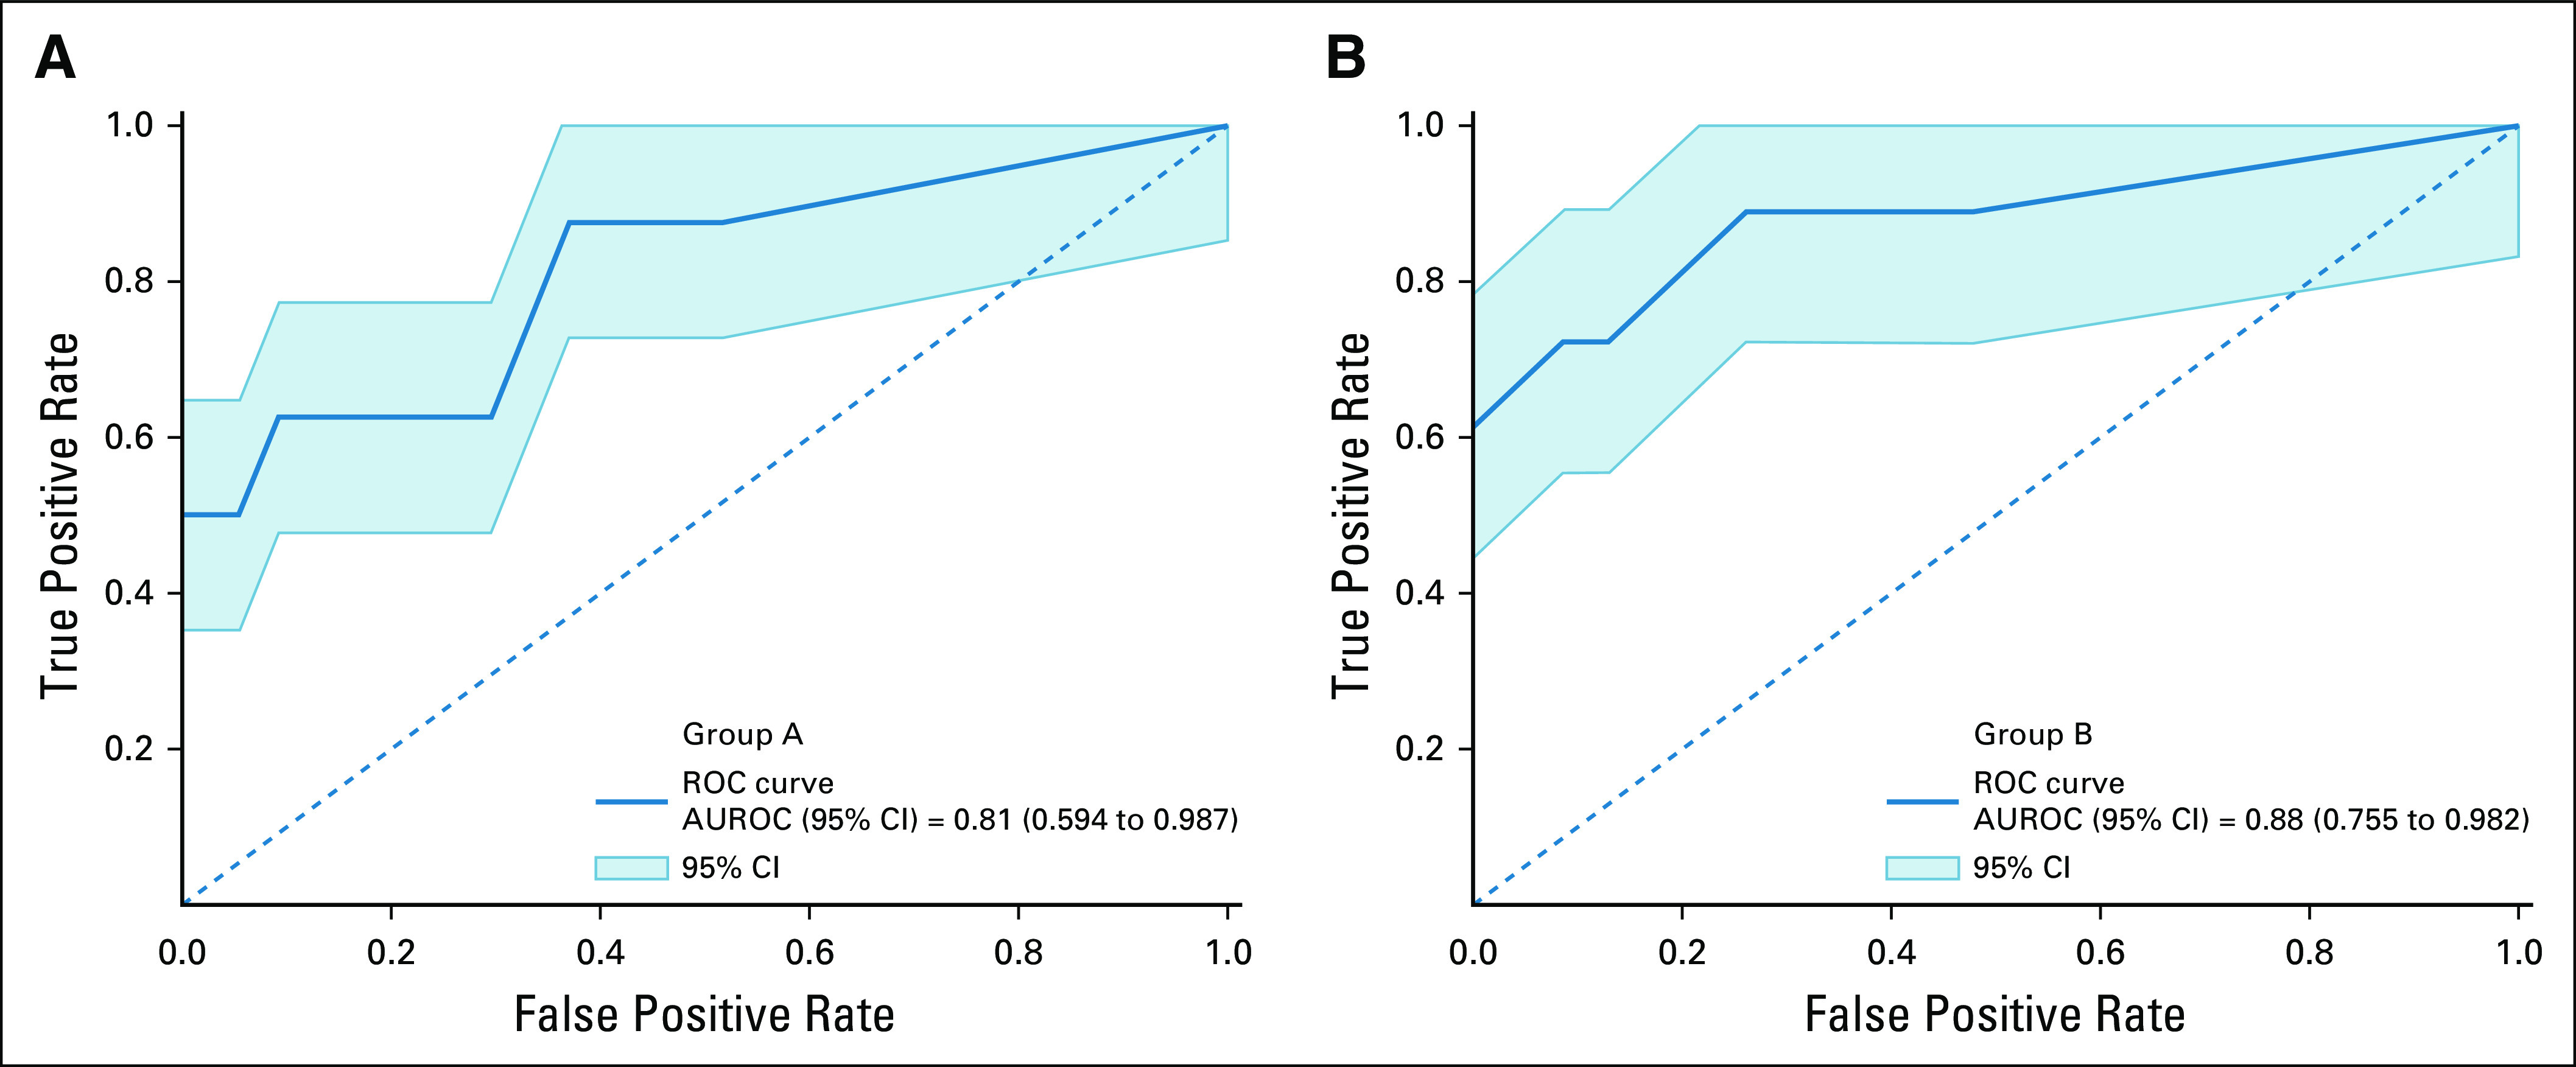
ROC for the RF classifier. The mean AUROC is obtained across all LOOCVs, and its performance in determining SCLC from all other lung nodules in (A) group A (NC) and (B) group B (CE) scans is shown. Note that the mean AUROC is > 0.8 in both groups, suggesting good discrimination of SCLC. AUROC, area under the receiver operating characteristic curve; CE, contrast-enhanced; LOOCV, leave-one-out-cross-validation; NC, noncontrast; RF, random forest; ROC, receiver operating characteristic curve; SCLC, small-cell lung cancer.
There were nine features that formed the union across all LOOCVs for group A and 14 features for group B. These features were used to generate a RF model, and the SHAP values for each feature are shown in Figure 4. The following six features overlapped between group A and B: firstorder_Range, firstorder_Skewness, glszm_LargeAreaLowGrayLevelEmphasis, glszm_SmallAreaEmphasis, glcm_Imc1, and glrlm_GrayLevelNonUniformityNormalized.
FIG 4.
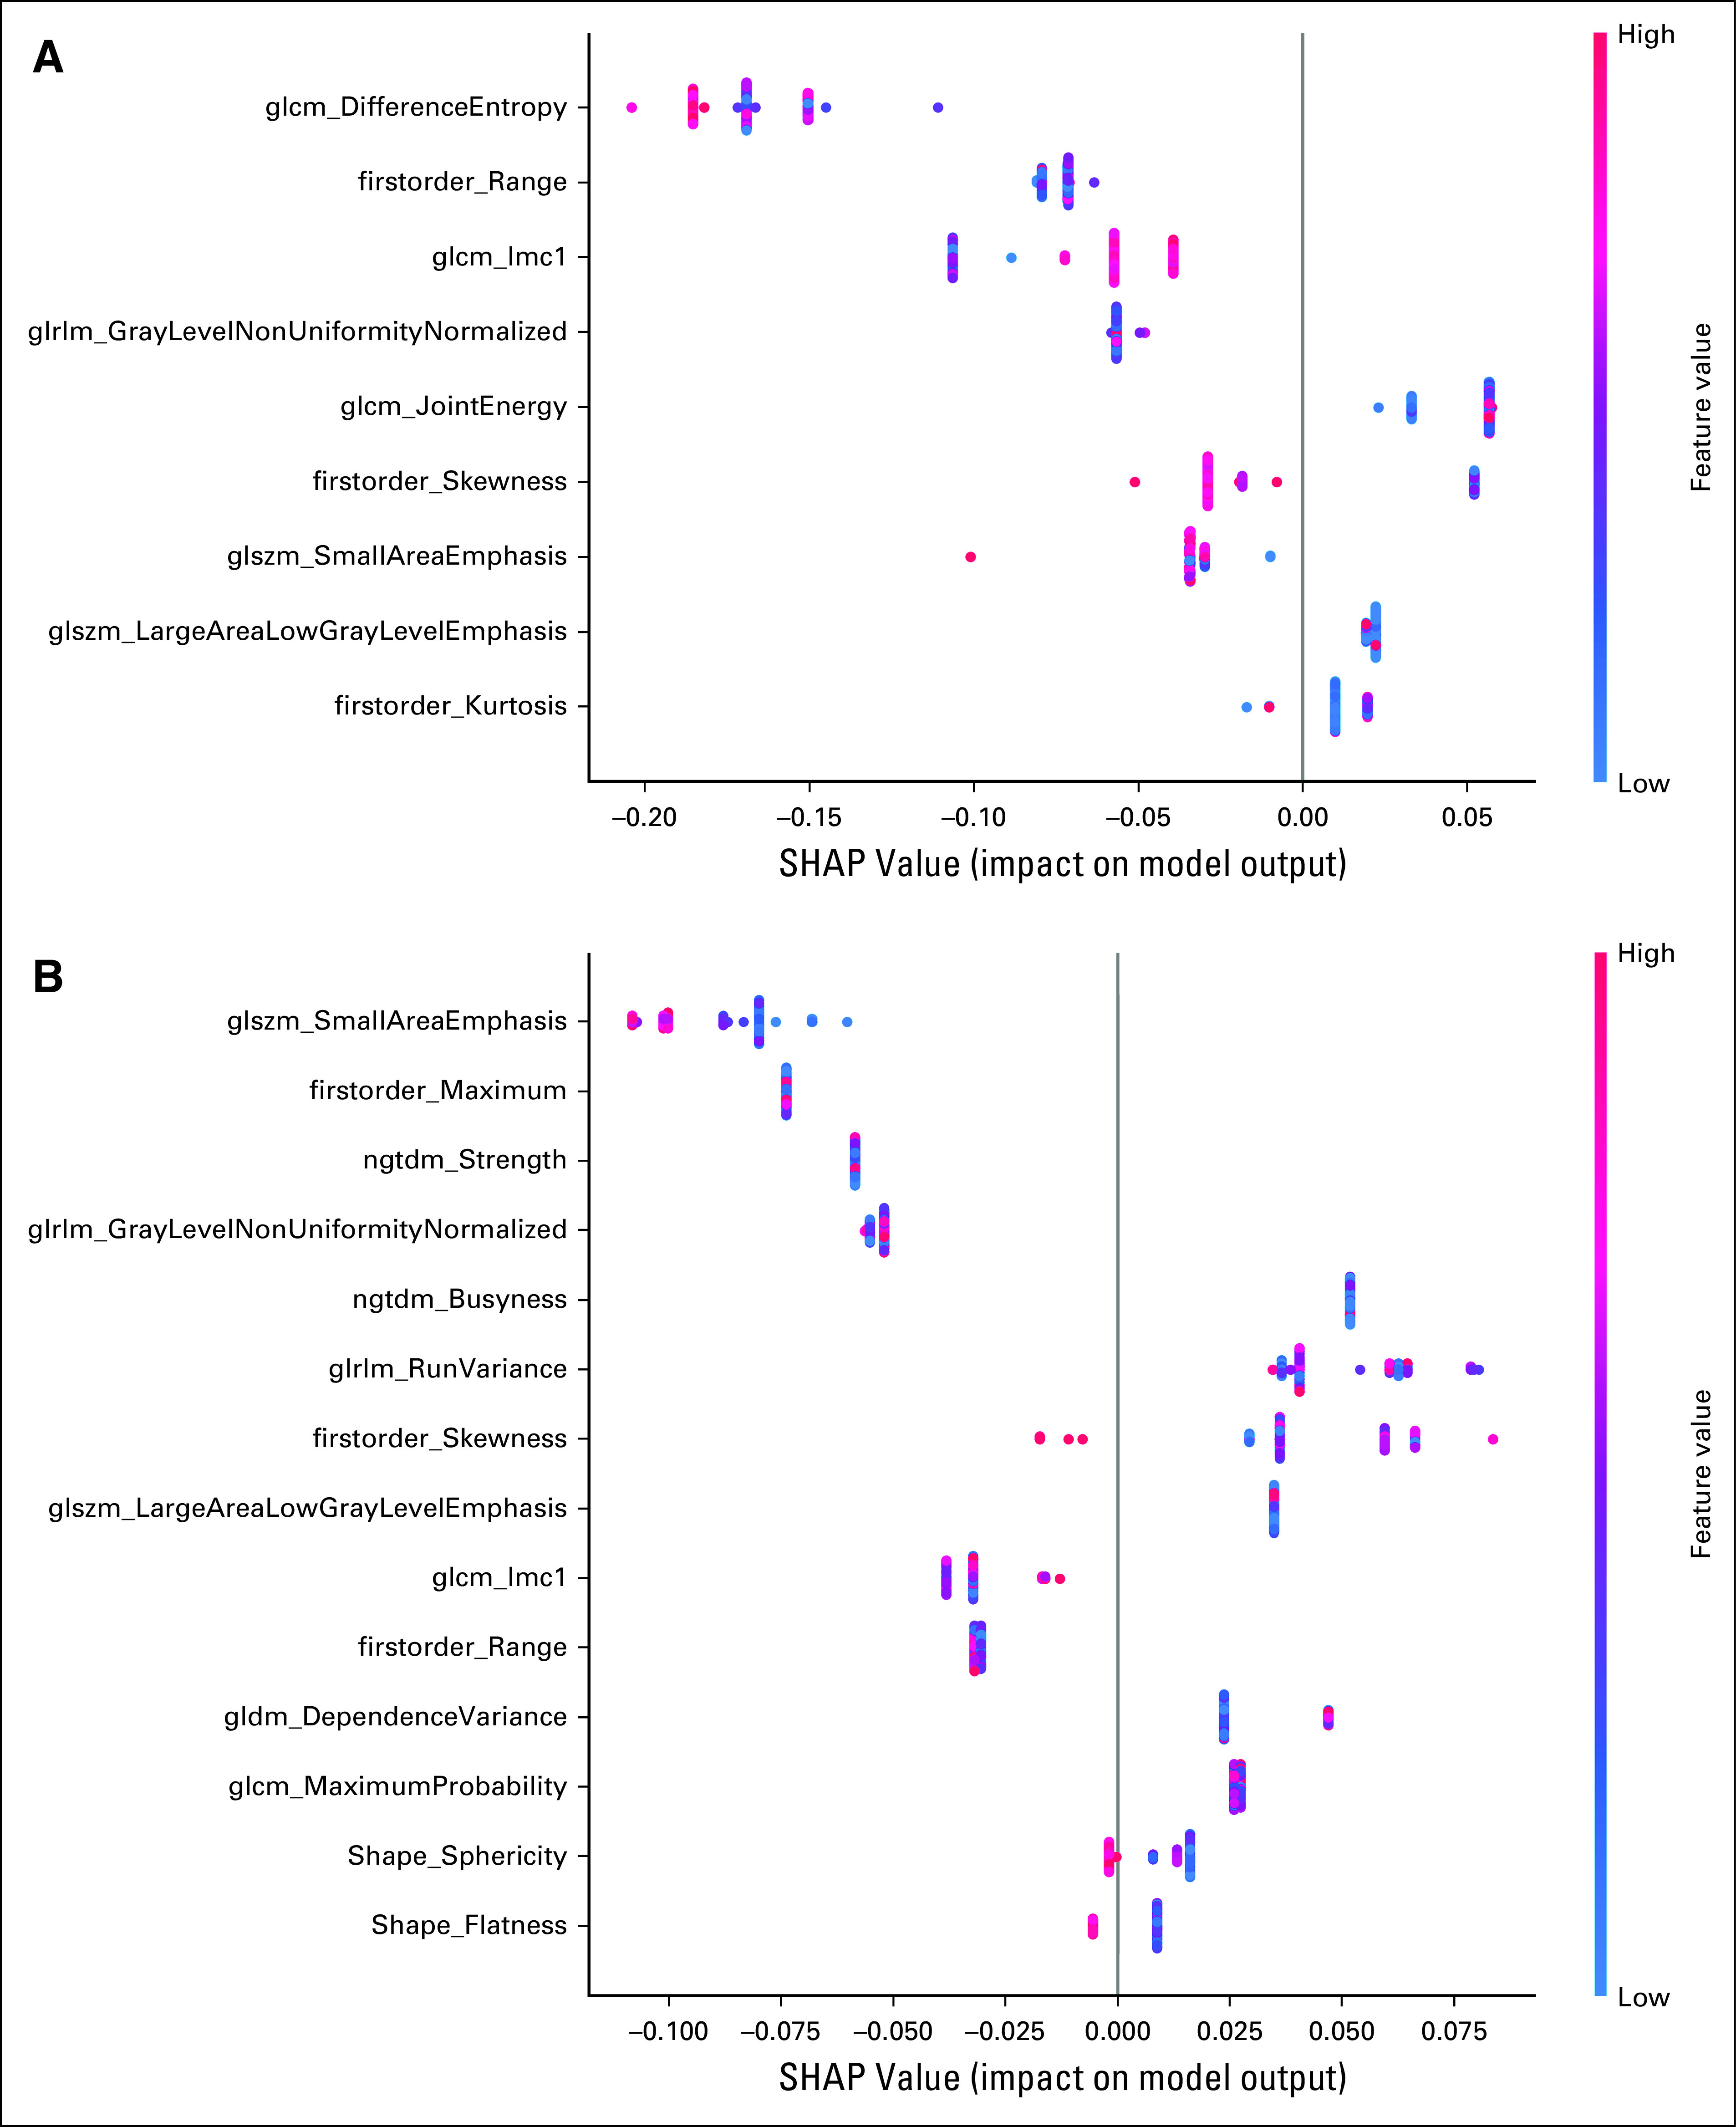
Feature importance on the basis of SHAP values as determined by the RF model for (A) group A and (B) group B scans. RF, random forest; SHAP, Shapley Additive Explanation.
DISCUSSION
Our results demonstrate the possibility of using radiomics for distinguishing SCLC from other lung lesion histology. Lung cancer screening to date has demonstrated little impact in improving survival for patients with SCLC. The National Lung Screening Trial (NLST) found a significant benefit for low-dose screening CT in patients diagnosed with NSCLC, but no benefit was seen in patients diagnosed with SCLC, as the yearly time frame between screening examinations could allow for the growth and progression of tumor.4,33 In the NLST trial, the 3-year survival was only 8% in those patients with ES-SCLC compared with 83% in those patients with LS-SCLC. Therefore, methods to detect SCLC earlier are needed, which is where radiomics may provide a solution.
Our study separated both contrast and NC studies into different cohorts. A prior study demonstrated a distinct difference in feature selection and feature importance between CE and NC scans.34 Interestingly, the heatmap illustrated in Figure 2 shows a radiomic signature that appears similar in both CE and NC cases for SCLC, yet different from the other group suggesting that a single model may be able to predict SCLC, regardless of contrast administration. CE, however, is a confounding factor in our study as 18 of 26 SCLC were CE. Separate radiomic NC (group A) and CE (group B) models were therefore developed.
When comparing the clinical model with the radiomics model, it is not clear whether radiomics performs better than clinical features alone. The results for the clinical model for group A were underpowered, whereas the results for the clinical and radiomic models for group B were similar to one another. Lesion centrality is likely a driving factor on the clinical model, as SCLC is known to be more central in location,35 and was the only statistically significant clinical factor between the SCLC and other cohorts. Regarding the combined model, a prior study showed no improvement in performance when clinical and radiomic features were combined, and our study had similar findings.36 A larger sample size will likely help to determine the impact of clinical features on radiomics and is an area that our group is actively working on.
Six features were seen to overlap between the group A and group B RF models in predicting SCLC, and these may be feasible to use in creating a combined model. Given that the features were predominantly texture features, this may reflect the tumor heterogeneity of SCLC, as previously described.34,37 Determining direct correlation between radiomic features and histologic features such as proliferation, necrosis, and vascularity is difficult with our small and heterogeneous data set but may be feasible if these features are found to be consistent in larger independent data sets.
Although this is the first published study demonstrating the efficacy of radiomics in distinguishing SCLC from other lung histology including benign lesions, other studies have found radiomics or deep learning to be effective in distinguish SCLC from other lung cancer histologies.12,34,38,39 Similar to our experience, studies that have looked at SCLC versus NSCLC have generally performed well using a variety of classifiers, including deep learning, least absolute shrinkage and selection operator, support vector machine, and RF, but have struggled to separate SCLC from SCC.12,34,38,39 Our findings add to the body of evidence that there may a unique radiomic signature for SCLC that can be used for earlier identification.
Clinically, if validated, this study could result in earlier detection of SCLC which may allow for earlier treatment assuming that barriers, including time and expertise for tumor segmentation, can be overcome. Reproduction of this study is critical to independent confirmation of the results. Therefore, the TRIPOD multivariable prediction model reporting guidelines were used.40 On the basis of these guidelines, the current study is a TRIPOD 1b analysis type. Future studies should incorporate an independent test set to strengthen the model. Finally, the radiomic quality score (RQS)41 for the study is a 5 (positive points for criteria 1, 2, 5, 6, 9, and 14; negative points for criteria 12). A recent literature review of 75 radiomics studies in NSCLC found the median RQS was 6 (interquartile range 2-12.25).42 This study therefore has an RQS score in line with many existing studies.
There are several limitations to the existing study. The size of the existing study cohort is a major limitation, particularly because it prevented holding out some of the data for an independent validation. In addition, the imaging studies were from a single center, so no external validation was performed. Given the known challenges in reproducing radiomic results between institutions,43 the existing results require further investigation with a multi-institutional cohort using correction algorithms to help mitigate differences between scanners and techniques.44 This is particularly important since the data set used for this study did not have wide variations in scanning techniques aside from the use of contrast. Although this helps to minimize variables impacting a radiomics model creation, it may not be applicable to scans from other institutions. A final limitation is the gender imbalance of our existing data set. Given that the data were obtained from a VA hospital, the proportion of male patients is markedly larger than the proportion of female patients. As a result, it is uncertain whether the results will be applicable across genders.
In conclusion, radiomics may be an effective method to distinguish SCLC from other malignant and nonmalignant histology on both NC and CE CT. Further evaluation with a larger and multi-institutional data set is required to confirm the findings.
ACKNOWLEDGMENT
This material is the result of work supported with resources and the use of facilities at the VA Palo Alto Health Care System, Palo Alto, CA.
Appendix
TABLE A1.
Hyperparameter Selections for Each Machine Learning Classifier
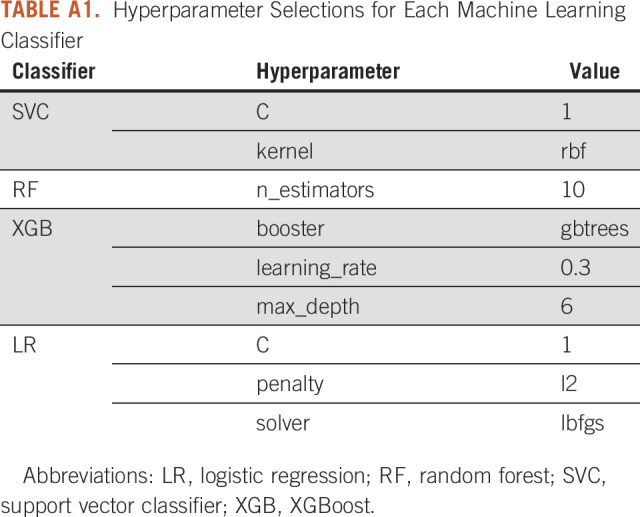
TABLE A2.
Radiomic Features With an ICC ≥ 0.75
TABLE A3.
AUROC of the Model Using Clinical and Radiomic Features Versus Radiomic Only Features
Rajesh P. Shah
Consulting or Advisory Role: Genentech, Intuitive Surgical, Histosonics Artio Medical, Inc
Research Funding: Merit Medical Systems
Millie Das
Honoraria: Plexus
Consulting or Advisory Role: Jazz Pharmaceuticals, AstraZeneca, BeiGene
Research Funding: Novartis, Verily, Varian Medical Systems, AbbVie, United Therapeutics, Cellsight Technologies
Olivier Gevaert
Research Funding: Nividien Inc, Lucence Diagnostics, Onc.AI
Sandy Napel
Consulting or Advisory Role: Fovia
Patents, Royalties, Other Intellectual Property: Several patents, none currently licensed
No other potential conflicts of interest were reported.
DISCLAIMER
The funding sources had no role in study design, in the collection, analysis and interpretation of data, in the writing of the report, or in the decision to submit the article for publication.
SUPPORT
Supported by an institutional grant from the Stanford University Artificial Intelligence in Medicine and Imaging Center; and by the National Institutes of Health grant number U24 CA180927. H.M.S. is supported by the Big Data Scientific Training Enhancement Program (BD-Step).
AUTHOR CONTRIBUTIONS
Conception and design: Rajesh P. Shah, Millie Das, Olivier Gevaert, Sandy Napel
Financial support: Olivier Gevaert, Rajesh P. Shah, Sandy Napel
Administrative support: Olivier Gevaert
Collection and assembly of data: Rajesh P. Shah, Shefali Verma, Peiyi Xie
Data analysis and interpretation: Rajesh P. Shah, Heather M. Selby, Pritam Mukherjee, Millie Das, Sachin Malik, Olivier Gevaert, Sandy Napel
Manuscript writing: All authors
Final approval of manuscript: All authors
Accountable for all aspects of the work: All authors
AUTHORS' DISCLOSURES OF POTENTIAL CONFLICTS OF INTEREST
The following represents disclosure information provided by the authors of this manuscript. All relationships are considered compensated unless otherwise noted. Relationships are self-held unless noted. I = Immediate Family Member, Inst = My Institution. Relationships may not relate to the subject matter of this manuscript. For more information about ASCO’s conflict of interest policy, please refer to www.asco.org/rwc or ascopubs.org/cci/author-center.
Open Payments is a public database containing information reported by companies about payments made to US-licensed physicians (Open Payments).
Rajesh P. Shah
Consulting or Advisory Role: Genentech, Intuitive Surgical, Histosonics Artio Medical, Inc
Research Funding: Merit Medical Systems
Millie Das
Honoraria: Plexus
Consulting or Advisory Role: Jazz Pharmaceuticals, AstraZeneca, BeiGene
Research Funding: Novartis, Verily, Varian Medical Systems, AbbVie, United Therapeutics, Cellsight Technologies
Olivier Gevaert
Research Funding: Nividien Inc, Lucence Diagnostics, Onc.AI
Sandy Napel
Consulting or Advisory Role: Fovia
Patents, Royalties, Other Intellectual Property: Several patents, none currently licensed
No other potential conflicts of interest were reported.
REFERENCES
- 1.Siegel RL, Miller KD, Jemal A.Cancer statistics, 2020 CA Cancer J Clin 707–302020 [DOI] [PubMed] [Google Scholar]
- 2.American Cancer Society Cancer Facts & Figures 2020Atlanta: American Cancer Society2020 [DOI] [PMC free article] [PubMed] [Google Scholar]
- 3.Howlader N, Noone AM, Krapcho M, et al. SEER Cancer Statistics Review, 1975-2017. 2020. https://seer.cancer.gov/csr/1975_2017/ [Google Scholar]
- 4.National Comprehensive Cancer Network . Small Cell Lung Cancer (Version 1.2021) https://www.nccn.org/professionals/physician_gls/pdf/sclc.pdf [Google Scholar]
- 5. Harris K, Khachaturova I, Azab B, et al. Small cell lung cancer doubling time and its effect on clinical presentation: A concise review. Clin Med Insights Oncol. 2012;6:CMO.S9633. doi: 10.4137/CMO.S9633. [DOI] [PMC free article] [PubMed] [Google Scholar]
- 6.Common JL, Mariathas HH, Parsons K, et al. Reducing wait time for lung cancer diagnosis and treatment: Impact of a multidisciplinary, centralized referral program Can Assoc Radiol J 69322–3272018 [DOI] [PubMed] [Google Scholar]
- 7.Bhandari S, Kumar R, Pham D, et al. Treatment timing in small cell lung cancer, a national cancer database analysis Am J Clin Oncol 43362–3652020 [DOI] [PubMed] [Google Scholar]
- 8.Napel S, Mu W, Jardim‐Perassi BV, et al. Quantitative imaging of cancer in the postgenomic era: Radio(geno)mics, deep learning, and habitats Cancer 1244633–46492018 [DOI] [PMC free article] [PubMed] [Google Scholar]
- 9.Li R, Xing L, Napel S, et al. Radiomics and Radiogenomics: Technical Basis and Clinical Applications. Boca Raton, FL: CRC Press; 2019. [Google Scholar]
- 10. Chen C-H, Chang C-K, Tu C-Y, et al. Radiomic features analysis in computed tomography images of lung nodule classification. PLoS One. 2018;13:e0192002. doi: 10.1371/journal.pone.0192002. [DOI] [PMC free article] [PubMed] [Google Scholar]
- 11.Zhu X, Dong D, Chen Z, et al. Radiomic signature as a diagnostic factor for histologic subtype classification of non-small cell lung cancer Eur Radiol 282772–27782018 [DOI] [PubMed] [Google Scholar]
- 12.E L, Lu L, Li L, et al. Radiomics for classification of lung cancer histological subtypes based on nonenhanced computed tomography Acad Radiol 261245–12522019 [DOI] [PubMed] [Google Scholar]
- 13. Aerts HJWL, Velazquez ER, Leijenaar RTH, et al. Decoding tumour phenotype by noninvasive imaging using a quantitative radiomics approach. Nat Commun. 2014;5:4006. doi: 10.1038/ncomms5006. [DOI] [PMC free article] [PubMed] [Google Scholar]
- 14.Choi W, Oh JH, Riyahi S, et al. Radiomics analysis of pulmonary nodules in low-dose CT for early detection of lung cancer Med Phys 451537–15492018 [DOI] [PMC free article] [PubMed] [Google Scholar]
- 15.Zhou M, Leung A, Echegaray S, et al. Non–small cell lung cancer radiogenomics map identifies relationships between molecular and imaging phenotypes with prognostic implications Radiology 286307–3152018 [DOI] [PMC free article] [PubMed] [Google Scholar]
- 16. Bergman BP, Mackay DF, Morrison D, et al. Smoking-related cancer in military veterans: Retrospective cohort study of 57,000 veterans and 173,000 matched non-veterans. BMC Cancer. 2016;16:311. doi: 10.1186/s12885-016-2347-5. [DOI] [PMC free article] [PubMed] [Google Scholar]
- 17.Brown DW.Smoking prevalence among US veterans J Gen Intern Med 25147–1492010 [DOI] [PMC free article] [PubMed] [Google Scholar]
- 18. Odani S, Agaku IT, Graffunder CM, et al. Tobacco product use among military veterans—United States, 2010–2015. Morb Mortal Wkly Rep. 2018;67:7. doi: 10.15585/mmwr.mm6701a2. [DOI] [PMC free article] [PubMed] [Google Scholar]
- 19.Pinsky PF, Gierada DS, Nath PH, et al. Lung cancer risk associated with new solid nodules in the national lung screening trial Am J Roentgenol 2091009–10142017 [DOI] [PubMed] [Google Scholar]
- 20.Austin JHM, Yip R, D’Souza BM, et al. Small-cell carcinoma of the lung detected by CT screening: Stage distribution and curability Lung Cancer 76339–3432012 [DOI] [PubMed] [Google Scholar]
- 21. Lee S-H, Cho H, Lee HY, et al. Clinical impact of variability on CT radiomics and suggestions for suitable feature selection: A focus on lung cancer. Cancer Imaging. 2019;19:54. doi: 10.1186/s40644-019-0239-z. [DOI] [PMC free article] [PubMed] [Google Scholar]
- 22.Yushkevich PA, Piven J, Hazlett HC, et al. User-guided 3D active contour segmentation of anatomical structures: Significantly improved efficiency and reliability Neuroimage 311116–11282006 [DOI] [PubMed] [Google Scholar]
- 23.van Griethuysen JJM, Fedorov A, Parmar C, et al. Computational radiomics system to decode the radiographic phenotype Cancer Res 77e104–e1072017 [DOI] [PMC free article] [PubMed] [Google Scholar]
- 24. Zwanenburg A, Leger S, Vallières M, et al. Image biomarker standardisation initiative-feature definitions. ArXiv. 2016 Prepr ArXiv161207003. [Google Scholar]
- 25.Cicchetti DV.Guidelines, criteria, and rules of thumb for evaluating normed and standardized assessment instruments in psychology Psychol Assess 6284–2901994 [Google Scholar]
- 26.Chawla NV, Bowyer KW, Hall LO, et al. SMOTE: Synthetic minority over-sampling technique J Artif Intell Res 16321–3572002 [Google Scholar]
- 27.Tunali I, Gray JE, Qi J, et al. Novel clinical and radiomic predictors of rapid disease progression phenotypes among lung cancer patients treated with immunotherapy: An early report Lung Cancer 12975–792019 [DOI] [PMC free article] [PubMed] [Google Scholar]
- 28. Wu L, Gao C, Xiang P, et al. CT-imaging based analysis of invasive lung adenocarcinoma presenting as ground glass nodules using peri- and intra-nodular radiomic features. Front Oncol. 2020;10:838. doi: 10.3389/fonc.2020.00838. [DOI] [PMC free article] [PubMed] [Google Scholar]
- 29.Auffarth B, López M, Cerquides J.Comparison of redundancy and relevance measures for feature selection in tissue classification of CT images Perner P.Advances in Data Mining. Applications and Theoretical Aspects Berlin, Heidelberg, Germany: Springer; 2010. pp 248–262http://link.springer.com/10.1007/978-3-642-14400-4_20 [Google Scholar]
- 30. Parmar C, Grossmann P, Bussink J, et al. Machine learning methods for quantitative radiomic biomarkers. Sci Rep. 2015;5:13087. doi: 10.1038/srep13087. [DOI] [PMC free article] [PubMed] [Google Scholar]
- 31. DeLong ER, DeLong DM, Clarke-Pearson DL. Comparing the areas under two or more correlated receiver operating characteristic curves: A nonparametric approach. Biometrics. 1988;44:837. [PubMed] [Google Scholar]
- 32.Lundberg SM, Lee S-I.A Unified Approach to Interpreting Model Predictions. NIPS 2017.
- 33.Thomas A, Pattanayak P, Szabo E, et al. Characteristics and outcomes of small cell lung cancer detected by CT screening Chest 1541284–12902018 [DOI] [PMC free article] [PubMed] [Google Scholar]
- 34.E L, Lu L, Li L, et al. Radiomics for classifying histological subtypes of lung cancer based on multiphasic contrast-enhanced computed tomography J Comput Assist Tomogr 43300–3062019 [DOI] [PMC free article] [PubMed] [Google Scholar]
- 35.Carter BW, Glisson BS, Truong MT, et al. Small cell lung carcinoma: Staging, imaging, and treatment considerations Radiographics 341707–17212014 [DOI] [PubMed] [Google Scholar]
- 36. Grossmann P, Stringfield O, El-Hachem N, et al. Defining the biological basis of radiomic phenotypes in lung cancer. Elife. 2017;6:e23421. doi: 10.7554/eLife.23421. [DOI] [PMC free article] [PubMed] [Google Scholar]
- 37. Chen BT, Chen Z, Ye N, et al. Differentiating peripherally-located small cell lung cancer from non-small cell lung cancer using a CT radiomic approach. Front Oncol. 2020;10:593. doi: 10.3389/fonc.2020.00593. [DOI] [PMC free article] [PubMed] [Google Scholar]
- 38. Liu S, Liu S, Zhang C, et al. Exploratory study of a CT radiomics model for the classification of small cell lung cancer and non-small-cell lung cancer. Front Oncol. 2020;10:1268. doi: 10.3389/fonc.2020.01268. [DOI] [PMC free article] [PubMed] [Google Scholar]
- 39. Guo Y, Song Q, Jiang M, et al. Histological subtypes classification of lung cancers on CT images using 3D deep learning and radiomics. Acad Radiol. 2020:S1076633220303603. doi: 10.1016/j.acra.2020.06.010. [DOI] [PubMed] [Google Scholar]
- 40.Collins GS, Reitsma JB, Altman DG, et al. Transparent reporting of a multivariable prediction model for individual prognosis or diagnosis (TRIPOD): The TRIPOD statement Eur Urol 671142–11512015 [DOI] [PubMed] [Google Scholar]
- 41.Lambin P, Leijenaar RTH, Deist TM, et al. Radiomics: The bridge between medical imaging and personalized medicine Nat Rev Clin Oncol 14749–7622017 [DOI] [PubMed] [Google Scholar]
- 42.Fornacon-Wood I, Faivre-Finn C, O’Connor JPB, et al. Radiomics as a personalized medicine tool in lung cancer: Separating the hope from the hype Lung Cancer 146197–2082020 [DOI] [PMC free article] [PubMed] [Google Scholar]
- 43.Steiger P, Sood R.How can radiomics Be consistently applied across imagers and institutions? Radiology 29160–612019 [DOI] [PubMed] [Google Scholar]
- 44.Orlhac F, Frouin F, Nioche C, et al. Validation of a method to compensate multicenter effects affecting CT radiomics Radiology 29153–592019 [DOI] [PubMed] [Google Scholar]


