

Abstract
Introduction
Illicitly manufactured fentanyl continues to fuel the opioid overdose crisis throughout the USA and Canada. However, little is known about factors associated with knowingly or unknowingly using fentanyl. Therefore, we sought to identify the prevalence and correlates of suspected/known and unknown exposure to fentanyl (excluding the prescribed one) among people who inject drugs (PWID), including associated overdose risks.
Methods
Data were derived from three prospective cohort studies of community-recruited people who use drugs in Vancouver, Canada in 2016–2017. Multivariable logistic regression was used to identify correlates of suspected/known exposure (i.e. urine drug screen positive and self-reporting past 3-day exposure) and unknown exposure to fentanyl (i.e. urine drug screen positive and self-reporting no past three-day exposure), respectively.
Results
Among 590 PWID, 296 (50.2%) tested positive for fentanyl. Of those, 143 (48.3%) had suspected/known and 153 (51.7%) had unknown exposure to fentanyl. In multivariable analyses, using supervised injection sites and possessing naloxone were associated with both suspected/known and unknown exposure (all P < 0.05). Injecting drugs alone (adjusted odds ratio 3.26; 95% confidence interval: 1.72–6.16) was associated with known exposure, but not with unknown exposure.
Discussion and Conclusions
We found a high prevalence of fentanyl exposure in our sample of PWID, with one half of those exposed consuming fentanyl unknowingly. While those exposed to fentanyl appeared more likely to utilise some overdose prevention services, PWID with suspected/known fentanyl exposure were more likely to inject alone, indicating a need for additional overdose prevention efforts for this group.
Keywords: fentanyl, opioids, injection drug use, overdose, harm reduction
INTRODUCTION
In recent years, there has been an exponential growth in the number of fatal drug overdoses throughout the USA and Canada [1–3]. The Canadian province of British Columbia (BC) experienced a rapid rise in opioid overdoses earlier than many other jurisdictions in North America, with drug overdose mortality rates in 2017 being two- to three-fold higher compared to national averages in Canada and the USA [2, 4]. A recent study also estimated that between 2014 and 2016, life expectancy at birth in the province declined by 0.12 years due to drug overdose deaths alone [5]. While a public health emergency was declared in April 2016 [6], and a range of overdose prevention interventions have been implemented since then [7], the province continues to see high numbers of fatal overdoses, although showing some declining trends in 2019 [3].
The key contributor to the overdose crisis is illicitly-manufactured fentanyl (a potent synthetic opioid) and its analogues that have contaminated the illicit drug supply [8, 9]. In BC, fentanyl has been attributed to the dramatic increase in overdose mortality since 2012, with fentanyl-detection rates in illicit drug overdose deaths increasing from 4% in 2012 to 86% in 2018 [10]. Fentanyl is commonly added to or sold as heroin [9, 11, 12], although other street drugs in the unregulated market, including stimulants and counterfeit medications (e.g. benzodiazepine pills), have also been found to contain fentanyl [13, 14]. Previous studies reported that people who use drugs struggle to discern substances sold as heroin and may be unknowingly exposed to fentanyl [11, 15]. A recent qualitative study in Vancouver, BC [16] reported that people who use illicit drugs generally had a high level of trust for their regular drug dealers, who they believed would provide them with accurate information regarding the contents of the drug sold (e.g. whether the drug is cut with fentanyl). However, the extent to which street-level drug dealers possess and convey accurate information on the contents of the drug to their clients is not known. People may also obtain drugs from unfamiliar sources from time to time, and therefore may not always be aware of the contents of the drug they obtain [16].
As fentanyl has increasingly contaminated the illicit drug supply, previous studies also reported that some people who use drugs have adapted their drug-using practices in an effort to prevent an overdose, including reducing the frequency of drug use, using drugs with others and carrying naloxone [17]. A recent cross-sectional study from three cities in the USA reported that approximately 60% of their community-recruited sample of people who use illicit drugs (n = 334) had ever suspected fentanyl exposure prior to using their drugs, and the prevalence of engaging in some harm reduction behaviour (e.g. using less of the drug) among those with suspected fentanyl exposure was relatively high at 39% [18]. However, since the self-report data were not corroborated with biological markers of fentanyl exposure, the extent to which those individuals accurately identified their exposure to fentanyl was unknown.
While knowledge of fentanyl exposure may be an important factor influencing individuals’ drug-using behaviour, potential differences in overdose risks associated with known and unknown exposure to fentanyl have not been fully characterised, particularly among people who inject drugs (PWID). A recent survey of 486 people who use drugs across BC documented that about 60% had been recently exposed to fentanyl, with 64% of them reporting known exposure to fentanyl [19]. This study found that those who preferred injection to non-injection drug use were more likely to report known exposure to fentanyl [19]. Building on this previous study and considering that PWID is the population that suffers from extremely high mortality from drug overdoses [20, 21], it is important to characterise overdose risks associated with known and unknown exposure to fentanyl among PWID. Therefore, we sought to estimate the prevalence and correlates (including overdose risk behaviour) of suspected/known and unknown exposure to fentanyl (excluding the prescribed one) among PWID in Vancouver.
METHODS
Study setting and design
Data were derived from three ongoing prospective cohort studies of people who use drugs in Vancouver: the Vancouver Injection Drug Users Study (VIDUS), the AIDS Care Cohort to evaluate Exposure to Survival Services (ACCESS) and the At-Risk Youth Study (ARYS). Detailed descriptions of these cohorts have been previously published elsewhere [22, 23]. In brief, VIDUS enrols HIV-seronegative adults (≥18 years of age) who injected illicit drugs in the month prior to enrolment. ACCESS enrols HIV-seropositive adults who used an illicit drug in the month prior to enrolment, and ARYS enrols street-involved youth aged 14–26 years who used an illicit drug in the month before enrolment. The cohorts use harmonised data collection procedures to allow for pooled.
At baseline and semi-annually thereafter, participants complete an interviewer-administered questionnaire, which elicits a range of information including demographic data, substance use and health-care access. Since June 2016, a multi-panel qualitative urine drug screen (UDS) using BTNX Rapid Response Multi-Drug Test Panel (Markham, ON, Canada) has been added to the data collection procedures. This rapid chromatographic immunoassay qualitatively and simultaneously detected multiple substances in urine within 5 minutes. As described previously [24], the screened substances (calibrator, cut-off value in ng/mL) included: fentanyl (fentanyl, 100, and norfentanyl, 20); morphine/heroin (morphine, 100); methadone metabolite (2-ethylidine-1, 5-dimethyl-3, 3-diphenylpyrrolidine, 100); buprenorphine (BUP-3-d-Glucoronide, 10); cocaine (benzoylecgonine, 150); amphetamine/methamphetamine (d-amphetamine, 1000); benzodiazepine (oxazepam, 300). The UDS kit has separate panel strips for each substance. If only one coloured line appears on the strip, it means that it tested positive for the substance. Two lines on the strip indicate a negative result. If no line appears on the strip, the UDS is invalid. While detection times after use of these substances vary depending on many factors, including routes of administration, frequencies of use and doses, the BTNX fentanyl test panel with the aforementioned cut-off values is believed to detect exposure to fentanyl within a maximum of past 3 days [25]. All three cohorts have received approvals from the University of British Columbia/Providence Health Care Research Ethics Board.
Study sample and measures
Eligibility criteria for the present cross-sectional study included: completing both the interviewer-administered questionnaire and UDS between December 2016 and May 2017; and reporting having injected illicit drugs in the past 6 months. Additional sample restrictions were made based on the combinations of the UDS and self-report data that were used to derive the primary outcome as described below.
The primary outcome was recent exposure to fentanyl (excluding the prescribed one), which was classified as suspected/known exposure versus unknown exposure versus no exposure. Specifically, we defined suspected/known exposure as having a positive UDS result for fentanyl and self-reporting suspected exposure to fentanyl in the past 3 days. Suspected exposure to fentanyl was ascertained from a question: “Have you used any drugs that you knew or now believe contained fentanyl? If yes, when was the last time you used such drugs?” In this question, fentanyl referred to non-prescribed fentanyl only. Trained interviewers asked this question either before administering the UDS or without showing or corroborating the results of UDS if UDS had been administered before the interview, in order to avoid reporting bias. Unknown exposure to fentanyl was defined as having a positive UDS result for fentanyl and self-reporting no suspected exposure to fentanyl in the past 3 days. Two participants who were classified as unknown fentanyl exposure but self-reported use of prescribed fentanyl in the last 24 h were excluded from the analytic sample to ensure that this category only includes cases of unknown exposure to non-prescribed fentanyl. No exposure to fentanyl was defined as having a negative UDS result for fentanyl. Among 335 individuals who tested negative for fentanyl, 42 (12.2%) reported suspected exposure to fentanyl in the past 3 days and were excluded from the analysis. Determination of the analytic study sample is further described in Figure 1.
Figure 1.
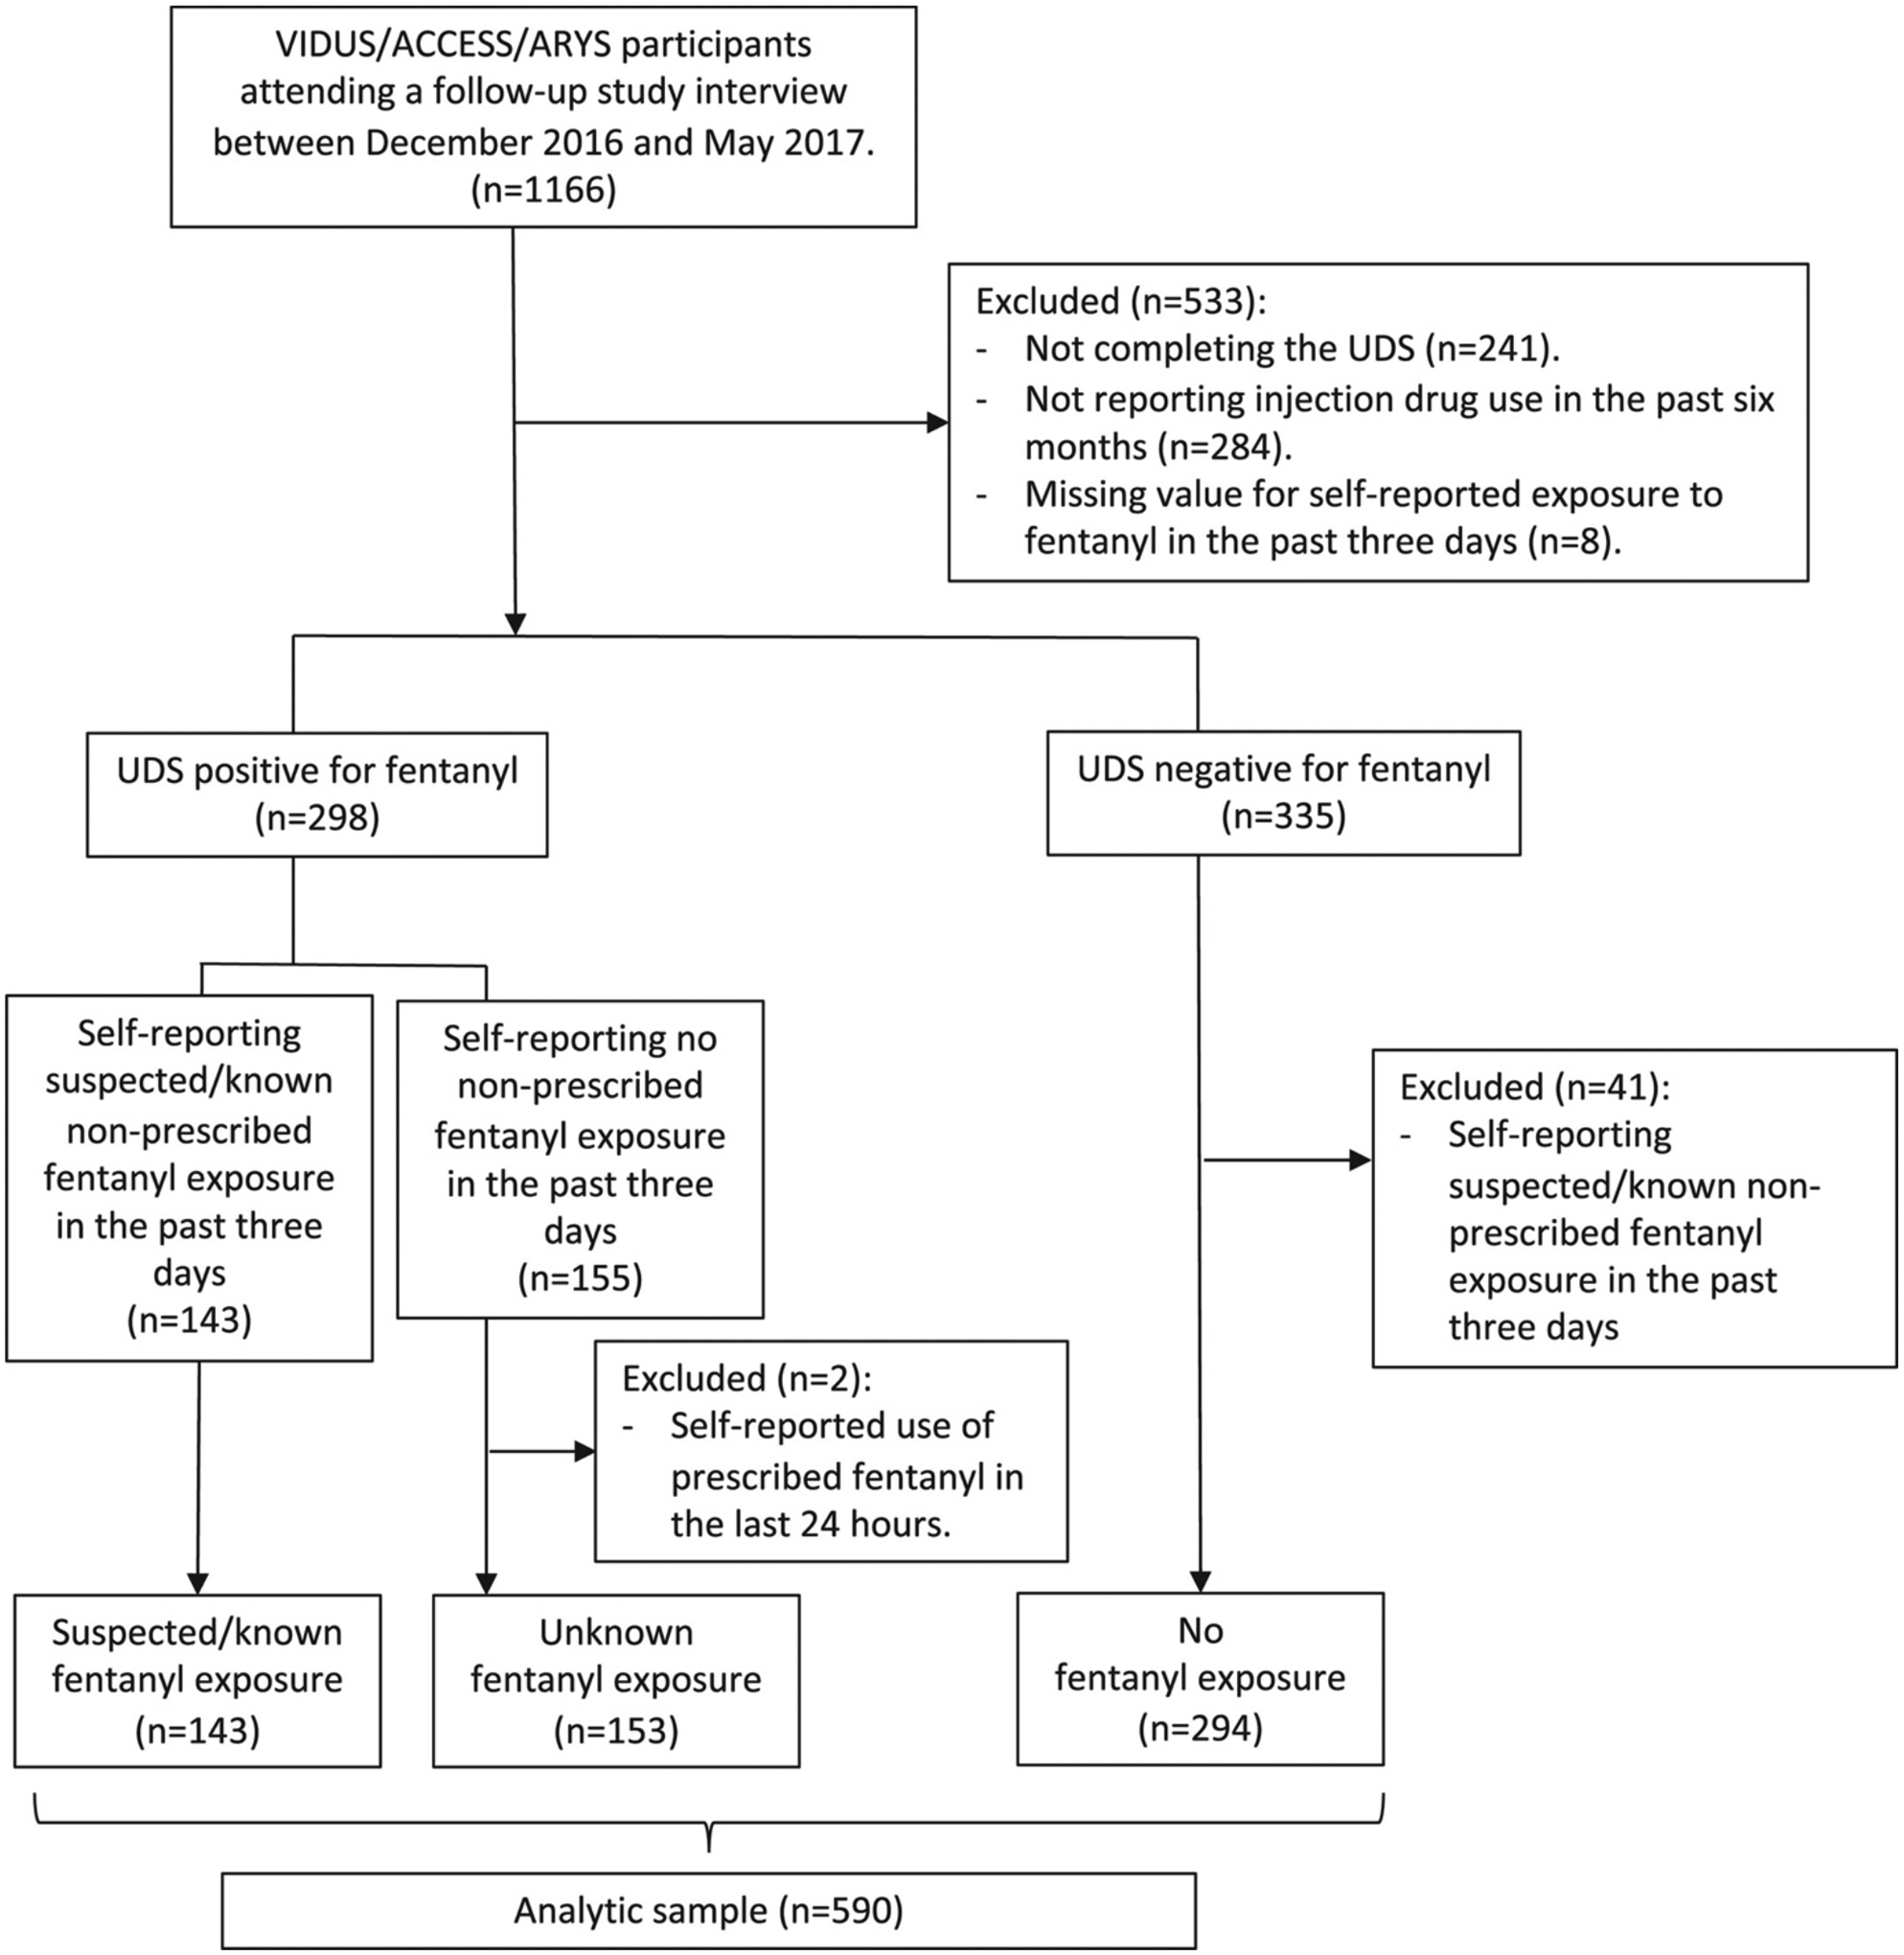
Determination of the analytic sample
ACCESS, AIDS Care Cohort to evaluate Exposure to Survival Services; ARYS, At-Risk Youth Study; UDS, urine drug screen; VIDUS, Vancouver Injection Drug Users Study.
In order to identify potentially distinct patterns of recent substance use among the three groups of the primary outcome measure, we examined UDS results of six substances (i.e. morphine, methadone metabolite, buprenorphine, cocaine, amphetamine/methamphetamine and benzodiazepine) as well as self-reported patterns of use for eight substance over the past 3 days, including heroin, non-medical use of prescription opioids (PO), cocaine, crack cocaine, crystal methamphetamine, speedball (i.e. combining an opioid and cocaine) or goofball (i.e. combining an opioid and crystal methamphetamine) injection, exclusive use of stimulants (i.e. either cocaine, crack cocaine or crystal methamphetamine, but no opioids), and benzodiazepine (non-medical use). Non-medical use of POs was defined as using POs when they were not prescribed for the participant or that the participant took only for the experience or feeling they caused.
We also considered a range of factors that we hypothesized might be associated with suspected/known and unknown exposure to fentanyl based on previous studies [19, 24, 26]. Demographic variables included: age (continuous, per year older); sex (female vs. male); and ethnicity/ancestry (White vs. non-White). For behavioural and social-structural factors, we considered patterns reported in the past 6 months unless otherwise specified because most of the relevant questions in the questionnaire referred to the past 6 months. Substance use-related variables included: ≥ daily heroin injection, ≥ daily non-medical use of PO, ≥ daily cocaine injection, ≥ daily crack smoking, ≥ daily crystal methamphetamine use (either injection or non-injection), ≥ daily alcohol use and non-medical use of benzodiazepine. Variables related to overdose risks and prevention included: experiencing a non-fatal overdose (defined as having a negative reaction from using too much drugs by accident); injecting alone; being enrolled in opioid agonist therapy (OAT); using a supervised injection/overdose prevention site; and currently possessing naloxone. Social and structural exposures in the past 6 months included: residence in the Downtown Eastside neighbourhood in Vancouver, an area with a large open drug market; being homeless; recent incarceration; and inability to access any community health or social services (e.g. food services, housing, counsellor, social worker), defined as reporting having been unable to access any of these services when they wanted. Unless otherwise stated, all variables were dichotomized as yes versus no.
Statistical analyses
As a first step, we examined the sample characteristics stratified by recent exposure to fentanyl, using the Pearson’s chi-squared test (for categorical variables) and Kruskal–Wallis test (for continuous variables). Next, in order to identify a set of factors associated with higher odds of suspected/known and unknown exposure to fentanyl, respectively, we built two multivariable logistic regression models: Model 1 compared suspected/known versus no exposure to fentanyl, and Model 2 compared unknown versus. no exposure to fentanyl. In addition, we fit Model 3 to compare suspected/known versus unknown exposure to fentanyl. Because of highly skewed distributions (see Table 1), the variables of ≥ daily heroin injection and ≥ daily non-medical use of PO were removed from the multivariable modelling procedure for each model. For all models, we used an a priori-defined backward model selection procedure based on examination of Akaike Information Criterion (AIC) to fit a multivariable model [27]. In brief, we constructed a full model including all variables that were associated with the outcome at P < 0.10 in bivariable analyses. After examining the AIC of the model, we removed the variable with the largest P-value and built a reduced model. We continued this iterative process until we reached the lowest AIC score. All P-values were two-sided. All statistical analyses were performed using SAS 9.4 (Cary, North Carolina, USA).
Table 1.
Sample characteristics stratified by exposure to fentanyl among 590 PWID in Vancouver, Canada, 2016–2017
| Characteristic | Exposure to fentanyl | P-value | |||
|---|---|---|---|---|---|
| Total, 590 (100%) | Suspected/known, 143 (24.2%) | Unknown, 153 (25.9%) | No exposure, 294 (49.8%) | ||
| Age (median, Q1–Q3) | 45.7 (34.6–53.7) | 38.6 (30.9–49.2) | 43.3 (34.7–50.6) | 49.3 (38.9–55.4) | <0.001* |
| Female | 225 (38%) | 60 (42%) | 65 (42%) | 100 (34%) | 0.129 |
| White | 323 (55%) | 82 (57%) | 85 (56%) | 156 (53%) | 0.682 |
| DTES residenceb | 403 (68%) | 106 (74%) | 112 (73%) | 185 (63%) | 0.020 |
| Homeless | 109 (18%) | 38 (27%) | 29 (19%) | 42 (14%) | 0.008 |
| Incarceration | 40 (7%) | 19 (13%) | 13 (9%) | 8 (3%) | <0.001 |
| Inability to access any community health or social servicesa | 143 (24%) | 44 (31%) | 39 (26%) | 60 (20%) | 0.058 |
| Non-fatal overdosea | 127 (22%) | 46 (32%) | 36 (24%) | 45 (15%) | <0.001 |
| Injecting alonea | 436 (74%) | 126 (88%) | 101 (66%) | 209 (71%) | <0.001 |
| Opioid agonist therapya | 360 (61%) | 99 (69%) | 102 (67%) | 159 (54%) | 0.002 |
| Supervised injection/overdose prevention sites usea | 283 (48%) | 91 (64%) | 85 (56%) | 107 (36%) | <0.001 |
| Currently possessing naloxone | 397 (67%) | 106 (74%) | 117 (77%) | 174 (59%) | <0.001 |
| Self-reported substance use in the past 6 monthsa | |||||
| ≥Daily heroin injectiona,b | 182 (31%) | 100 (70%) | 67 (44%) | 15 (5%) | <0.001 |
| ≥Daily non-medical PO usea | 19 (3%) | 9 (6%) | 2 (1%) | 8 (3%) | 0.050** |
| ≥Daily cocaine injectiona | 33 (6%) | 8 (6%) | 5 (3%) | 20 (7%) | 0.304 |
| ≥Daily crack smokinga | 42 (7%) | 11 (8%) | 13 (9%) | 18 (6.1%) | 0.621 |
| ≥Daily crystal methamphetamine usea | 112 (19%) | 34 (24%) | 29 (19%) | 49 (17%) | 0.206 |
| ≥Daily alcohol usea | 44 (7%) | 5 (4%) | 15 (10%) | 24 (8%) | 0.096 |
| Non-medical use of benzodiazepinea | 36 (6%) | 9 (6%) | 8 (5%) | 19 (7%) | 0.870 |
| Self-reported substance use in the past 3 days | |||||
| Heroin | 285 (48%) | 132 (92%) | 110 (72%) | 43 (15%) | <0.001 |
| Non-medical use of PO | 41 (7%) | 16 (11%) | 7 (5%) | 18 (6%) | 0.060 |
| Cocaine | 88 (15%) | 18 (13%) | 17 (11%) | 53 (18%) | 0.100 |
| Crack cocaine | 108 (18%) | 20 (14%) | 28 (18%) | 60 (20%) | 0.265 |
| Crystal methamphetamine | 229 (39%) | 70 (49%) | 60 (39%) | 99 (34%) | 0.008 |
| Speedball or goofball injection | 74 (13%) | 34 (24%) | 28 (18%) | 12 (4%) | <0.001 |
| Using stimulants but no opioidsb | 162 (27%) | 1 (1%) | 18 (12%) | 143 (49%) | <0.001** |
| Non-medical use of benzodiazepine | 13 (2%) | 4 (3%) | 3 (2%) | 6 (2%) | 0.873** |
| UDS positive for: | |||||
| Morphine | 343 (58%) | 135 (94%) | 131 (86%) | 77 (26%) | <0.001 |
| Methadone metabolite | 318 (54%) | 83 (58%) | 96 (63%) | 139 (47%) | 0.004 |
| Buprenorphine | 34 (6%) | 7 (5%) | 6 (4%) | 21 (7%) | 0.336 |
| Cocaine | 313 (53%) | 73 (51%) | 95 (62%) | 145 (49%) | 0.032 |
| Amphetamine | 299 (51%) | 100 (70%) | 84 (55%) | 115 (39%) | <0.001 |
| Benzodiazepine | 118 (20%) | 42 (29%) | 26 (17%) | 50 (17%) | 0.006 |
| Cohort designation | 0.022 | ||||
| VIDUS | 302 (51%) | 79 (55%) | 76 (50%) | 147 (50%) | |
| ACCESS | 204 (35%) | 35 (25%) | 56 (36%) | 113 (38%) | |
| ARYS | 84 (14%) | 29 (20%) | 21 (14%) | 34 (12%) | |
P-value was obtained from the Kruskal–Wallis test.
P-value was obtained from the Fisher’s exact test.
Stimulants include any of cocaine, crack cocaine or crystal methamphetamine.
Behaviours/events in the past 6 months.
ACCESS, AIDS Care Cohort to evaluate Exposure to Survival Services; ARYS, At-Risk Youth Study; DTES, Downtown Eastside; PO, prescription opioid; PWID, people who inject drugs; Q, quartile; UDS, urine drug screen; VIDUS, Vancouver Injection Drug Users Study.
RESULTS
Sample characteristics
In total, 590 participants were eligible for the present study. As shown in Table 1, 225 (38%) were female, 323 (55%) self-identified as White and the median age was 46 (quartile 1–3: 35–54) years. A total of 296 (50%) individuals tested positive for fentanyl, of whom 143 (48%) had suspected/known and 153 (52%) had unknown exposure to fentanyl.
Regarding the self-reported substance use in the past 3 days (see Table 1), there was a significantly higher prevalence of reported stimulant use but no opioid use among those who were not exposed to fentanyl (49%) when compared to those with suspected/known and unknown exposure to fentanyl (0.7% and 12%) (P < 0.001). However, crystal methamphetamine use was the highest among those with suspected/known exposure to fentanyl (49%), followed by those with unknown exposure (39%) and no exposure to fentanyl (34%) (P = 0.008). The prevalence of reporting speedball or goofball injection followed a similar pattern.
Also shown in Table 1, the UDS results of the six substances were similar to the findings on self-reported substance use in the past days. Specifically, the prevalence of positive UDS results for morphine was significantly higher among those with known and unknown exposure to fentanyl (94% and 86%) compared to those with no exposure to fentanyl (26%) (P < 0.001). The prevalence of positive UDS results for amphetamine was the highest among those with suspected/known exposure to fentanyl (70%), followed by those with unknown exposure (55%) and no exposure to fentanyl (39%) (P < 0.001).
Table 2 lists the top five combinations of positive UDS results identified among those with suspected/known and unknown exposure to fentanyl, respectively, accounting for approximately a half of each sub-sample. As shown, among those with suspected/known exposure to fentanyl, all combinations included both morphine and one of the stimulants (amphetamine or cocaine), as did all but one combination (methadone metabolite and morphine) among those with unknown exposure to fentanyl.
Table 2.
The top five combinations of positive UDS results among PWID with suspected/known and unknown exposure to fentanyl in Vancouver, Canada, 2016–2017
| Combination | n | % |
|---|---|---|
| Among PWID with suspected/known exposure to fentanyl (n = 143) | ||
| Amphetamine + methadone metabolite + morphine | 23 | 16 |
| Amphetamine + cocaine + methadone metabolite + morphine | 17 | 12 |
| Amphetamine + morphine | 14 | 10 |
| Amphetamine + cocaine + morphine | 10 | 7 |
| Cocaine + methadone metabolite + morphine | 9 | 6 |
| Among PWID with unknown exposure to fentanyl (n = 155) | ||
| Amphetamine + cocaine + methadone metabolite + morphine | 26 | 17 |
| Cocaine + methadone metabolite + morphine | 21 | 14 |
| Amphetamine + morphine | 15 | 10 |
| Methadone metabolite + morphine | 13 | 8 |
| Amphetamine + methadone metabolite + morphine | 12 | 8 |
The associations that had p-value of <0.05 are highlighted in bold.
PWID, people who inject drugs; UDS, urine drug screen.
Factors associated with suspected/known and unknown exposure to fentanyl
Table 3 presents the results of bivariable and multivariable logistic regression analyses. As shown in both Model 1 (comparing suspected/known vs. no exposure to fentanyl) and Model 2 (comparing unknown vs. no exposure to fentanyl), younger age, OAT use, use of supervised injection/overdose prevention sites, and possession of naloxone were independently and positively associated with both suspected/known and unknown fentanyl exposure (all P < 0.05). Downtown Eastside residence [adjusted odds ratio (AOR) 2.00; 95% confidence interval (CI) 1.18, 3.39], incarceration (AOR 3.21; 95% CI 1.22, 8.46), self-reported inability to access to any community health or social services (AOR 1.83; 95% CI 1.08, 3.11), non-fatal overdose (AOR 2.01; 95% CI 1.14, 3.54) and injecting alone (AOR 3.26; 95% CI 1.72, 6.16) were independently and positively associated with suspected/known exposure to fentanyl, but not with unknown exposure to fentanyl. In Model 3 (comparing suspected/known vs. unknown exposure to fentanyl), injecting alone was independently and positively associated with suspected/known exposure (AOR 3.77; 95% CI 2.04, 6.99).
Table 3.
Bivariable and multivariable logistic regression analyses of factors associated with suspected/known and unknown exposure to fentanyl among 590 PWID in Vancouver, Canada, 2016–2017
| Variable | Model 1 (suspected/known vs. no exposure) | Model 2 (unknown vs. no exposure) | Model 3 (suspected/known vs. unknown exposure) | |||||||||
|---|---|---|---|---|---|---|---|---|---|---|---|---|
| OR (95% CI) | P-value | AOR (95% CI) | P-value | OR (95% CI) | P-value | AOR (95% CI) | P- value | OR (95% CI) | P-value | AOR (95% CI) | P-value | |
| Age (per year increase) | 0.95 (0.93, 0.97) | <0.001 | 0.95 (0.93, 0.97) | <0.001 | 0.97 (0.95, 0.99) | <0.001 | 0.97 (0.95, 0.99) | 0.001 | 0.98 (0.96, 1.00) | 0.021 | 0.98 (0.96, 1.00) | 0.043 |
| Female | 1.41 (0.93, 2.12) | 0.105 | 1.42 (0.95, 2.12) | 0.088 | 0.99 (0.62, 1.57) | 0.968 | ||||||
| White | 1.19 (0.80, 1.78) | 0.399 | 1.11 (0.75, 1.64) | 0.616 | 1.08 (0.68, 1.70) | 0.757 | ||||||
| DTES residencea | 1.69 (1.08, 2.63) | 0.021 | 2.00 (1.18, 3.39) | 0.010 | 1.61 (1.05, 2.47) | 0.030 | 1.56 (0.98, 2.48) | 0.060 | 1.05 (0.62, 1.76) | 0.857 | ||
| Homelessa | 2.17 (1.32, 3.56) | 0.002 | 1.40 (0.83, 2.36) | 0.201 | 1.55 (0.89, 2.68) | 0.119 | ||||||
| Incarcerationa | 5.48 (2.34, 12.85) | <0.001 | 3.21 (1.22, 8.46) | 0.018 | 3.32 (1.34, 8.19) | 0.009 | 2.45 (0.94, 6.36) | 0.065 | 1.65 (0.78, 3.48) | 0.188 | ||
| Inability to access any health or social servicesa | 1.73 (1.10, 2.72) | 0.019 | 1.83 (1.08, 3.11) | 0.026 | 1.33 (0.84, 2.11) | 0.227 | 1.30 (0.78, 2.16) | 0.313 | ||||
| Non-fatal overdosea | 2.61 (1.63, 4.20) | <0.001 | 2.01 (1.14, 3.54) | 0.015 | 1.70 (1.04, 2.77) | 0.035 | 1.52 (0.89, 2.60) | 0.129 | 1.54 (0.92, 2.57) | 0.098 | 1.49 (0.86, 2.56) | 0.154 |
| Injecting alonea | 3.01 (1.71, 5.31) | <0.001 | 3.26 (1.72, 6.16) | <0.001 | 0.79 (0.52, 1.20) | 0.270 | 3.82 (2.08, 7.00) | <0.001 | 3.77 (2.04, 6.99) | <0.001 | ||
| Opioid agonist therapya | 1.91 (1.25, 2.92) | 0.003 | 1.82 (1.10, 3.00) | 0.020 | 1.70 (1.13, 2.55) | 0.011 | 1.82 (1.16, 2.85) | 0.010 | 1.12 (0.69, 1.83) | 0.637 | ||
| Supervised injection/overdose prevention sites usea | 3.06 (2.02, 4.63) | <0.001 | 2.01 (1.25, 3.25) | 0.004 | 2.18 (1.47, 3.25) | <0.001 | 1.94 (1.27, 2.96) | 0.002 | 1.40 (0.88, 2.23) | 0.158 | ||
| Currently possessing naloxone | 1.98 (1.27, 3.07) | 0.003 | 1.72 (1.02, 2.90) | 0.041 | 2.24 (1.44, 3.48) | <0.001 | 1.81 (1.13, 2.92) | 0.015 | 0.88 (0.52, 1.50) | 0.640 | ||
| Self-reported substance use in the past 6 monthsa | ||||||||||||
| ≥Daily cocaine injectiona | 0.81 (0.35, 1.89) | 0.629 | 0.46 (0.17, 1.26) | 0.131 | 1.75 (0.56, 5.49) | 0.335 | ||||||
| ≥Daily crack smokinga | 1.28 (0.59, 2.78) | 0.537 | 1.42 (0.68, 2.99) | 0.351 | 0.90 (0.39, 2.07) | 0.801 | ||||||
| ≥Daily crystal methamphetamine usea | 1.56 (0.95, 2.55) | 0.077 | 1.17 (0.70, 1.94) | 0.546 | 1.33 (0.76, 2.33) | 0.312 | ||||||
| ≥Daily alcohol usea | 0.41 (0.15, 1.09) | 0.074 | 0.34 (0.11, 1.04) | 0.058 | 1.22 (0.62, 2.41) | 0.560 | 0.33 (0.12, 0.94) | 0.038 | 0.39 (0.13, 1.15) | 0.088 | ||
| Non-medical use of benzodiazepinea | 0.97 (0.43, 2.21) | 0.946 | 0.80 (0.34, 1.87) | 0.604 | 1.22 (0.46, 3.25) | 0.694 | ||||||
| Cohort designation | ||||||||||||
| ACCESS (vs. VIDUS) | 0.58 (0.36, 0.92) | 0.021 | 0.96 (0.63, 1.46) | 0.845 | 0.60 (0.36, 1.02) | 0.058 | ||||||
| ARYS (vs. VIDUS) | 1.59 (0.90, 2.80) | 0.110 | 1.19 (0.65, 2.20) | 0.568 | 1.33 (0.70, 2.53) | 0.387 | ||||||
Behaviours/events in the past 6 months. Bold = P-value of <0.05.
ACCESS, AIDS Care Cohort to evaluate Exposure to Survival Services; AOR, adjusted odds ratio; ARYS, At-Risk Youth Study; CI, confidence interval; DTES, Downtown Eastside; OR, odds ratio; PO, prescription opioid; PWID, people who inject drugs; VIDUS, Vancouver Injection Drug Users Study.
DISCUSSION
We found that approximately one-half of our community-recruited sample of PWID in Vancouver tested positive for fentanyl, and one-half of these individuals reported being unknowingly exposed to fentanyl. Combined data from UDS and self-reported use of drugs indicated that polysubstance use, most commonly involving illicit opioids and crystal methamphetamine, was prevalent among those exposed to fentanyl, particularly among those with suspected/known exposure. In multivariable analyses, PWID who had recent exposure to fentanyl were more likely to be younger, on OAT, use supervised consumption sites and carry naloxone regardless of being aware or unaware of fentanyl exposure. Those who suspected their fentanyl exposure were additionally more likely to have recently injected drugs alone, experienced a non-fatal overdose, been incarcerated and been unable to access health or social services. When comparing PWID who were and were not aware of fentanyl exposure, injecting alone was the only factor that remained independently associated with suspected/known exposure to fentanyl.
We found a high prevalence of polysubstance use involving illicit opioids and crystal methamphetamine among those with fentanyl exposure, and the prevalence of the past 3-day use of crystal methamphetamine was the highest (nearly 50%) among those with suspected/known fentanyl exposure. This is in line with recent reports documenting increasing trends in co-detection of fentanyl and methamphetamine in fatal drug overdose cases in the USA [28] and BC [29]. Specifically, in BC, there has been a five-fold increase in the number of illicit drug toxicity deaths involving crystal methamphetamine since 2014, the majority (87%) of which also involved fentanyl [29]. Similarly, several studies in the USA have also suggested a marked increase in methamphetamine use among people who use opioids in recent years [30–34]. Qualitative data in an online survey suggested that there might be a range of factors motivating people who use opioids to use methamphetamine, including high-seeking, balancing the effect of opioids and its easy availability as a substitute for opioids [33]. However, in our multivariable regression analyses, at least daily use of crystal methamphetamine was not significantly associated with either suspected/known or unknown exposure to fentanyl, indicating that those exposed to fentanyl may be engaging in less frequent use of crystal methamphetamine. Future research should investigate motivations for, practices and effects of co-use of street opioids and crystal methamphetamine in more depth.
The significant association between non-fatal overdose and suspected/known fentanyl exposure could have two possible interpretations. It may be that those individuals with suspected/known fentanyl exposure are simply at a higher risk of overdose. Alternatively, because of the way suspected/known fentanyl exposure was ascertained, it may be that some of those with suspected/known fentanyl exposure might have not necessarily been aware of their fentanyl exposure at the time of their drug use but became aware after they experienced a non-fatal overdose in the past 3 days. However, unfortunately, our dataset did not allow us to determine how many of the 46 (32% of the suspected/known fentanyl exposure group) individuals reporting both suspected fentanyl exposure in the past 3 days and non-fatal overdose in the past 6 months fell into such cases.
Of concern, those who engaged in overdose risk behaviour (i.e. injecting alone) were more likely to report suspected/known exposure to fentanyl. Such behaviour was not as salient among individuals with unknown fentanyl exposure. These findings may suggest that this sub-population of PWID with suspected/known exposure to fentanyl might be at a particularly high risk of experiencing a fatal overdose. While future research needs to establish the temporal relationship between injecting alone and known fentanyl exposure, given the well-known highly toxic illicit drug supply in our study setting [35], it may be that some PWID were injecting alone despite knowingly using drugs that contained fentanyl. In this regard, a large body of literature on HIV/AIDS demonstrates that individual-level education about HIV risk behaviour (e.g. syringe sharing) alone would not be sufficient to enable PWID to avoid HIV risk behaviour unless broader social and structural factors that shape risk environments and constrain PWID’s ability to exercise harm reduction practices are addressed [36]. A recent rapid ethnographic study from our study setting also reported that some women who use drugs do not utilise housing-based overdose prevention sites (i.e. supervised consumption sites) and intentionally used drugs alone at their home as they considered those overdose prevention sites to be unsafe environments [37]. Taken together, there is an urgent need to understand why some PWID inject alone and address the fatal overdose risk associated with this behaviour.
Further, while PWID exposed to fentanyl appeared more likely to access some key overdose prevention services such as supervised consumptions sites, naloxone and OAT, those who were aware of fentanyl exposure were more likely to have recently been incarcerated and report inability to access health/social services. These markers of overdose risk and structural vulnerability did not stand out among PWID with unknown exposure to fentanyl. Collectively, our findings suggest that those with suspected/known exposure to fentanyl may be the ones who particularly suffer from marginalisation and bear the greatest overdose risks. Therefore, our study findings indicate a need for structural interventions to address the upstream drivers of overdose risk, in addition to individual-level overdose prevention interventions that have been the primary responses to the ongoing opioid overdose crisis in the USA and Canada to date.
This study has some limitations. First, the cross-reactivity of the UDS may have resulted in over- or underestimation of the recent exposure to some substances [38], although a previous study documented that the UDS panel used in the present study had high specificity and sensitivity for fentanyl detection [39]. Also, our UDS panel did not screen 6-monoacetylmorphine (a specific metabolite of heroin) or fentanyl analogues such as carfentanil. Second, self-reported data may be influenced by some reporting bias, although such data have been shown to be mostly valid in studies involving PWID [40]. Third, a non-random sample used in the present study limits the generalisability of our findings.
In sum, we found that a half of PWID in our sample tested positive for fentanyl, with a half of these individuals being unknowingly exposed to fentanyl. Co-use of illicit opioids and crystal methamphetamine appeared highly prevalent among those exposed to fentanyl, particularly those with suspected/known exposure. While those exposed to fentanyl were more likely to access some key overdose prevention services, those who were aware of fentanyl exposure were also more likely to inject drugs alone, experience recent incarceration and report inability to access health or social services, indicating that this sub-population of PWID may be particularly marginalised and at a high risk of fatal overdose. These findings indicate a need for scaling up ongoing overdose prevention efforts by addressing not only opioid use but also stimulant use, and the social and structural factors that shape overdose risk behaviour among this population.
Acknowledgement
The authors thank the study participants for their contribution to the research, as well as current and past researchers and staff. The study was supported by the US National Institutes of Health (NIH) (U01DA038886, U01DA021525). This research was undertaken, in part, thanks to funding from the Canada Research Chairs program through a Tier 1 Canada Research Chair in Inner City Medicine which supports EW, and the Canadian Institutes of Health Research (CIHR) Canadian Research Initiative on Substance Misuse (SMN-139148). KH holds the St. Paul’s Hospital Chair in Substance Use Research and is supported in part by a NIH grant (U01DA038886), a CIHR New Investigator Award (MSH-141971), a Michael Smith Foundation for Health Research (MSFHR) Scholar Award and the St. Paul’s Foundation. M-JM is supported by the NIH (U01DA0251525), a CIHR New Investigator Award, and a MSFHR Scholar Award. KD is supported by a MSFHR/St. Paul’s Hospital Foundation–Providence Health Care Career Scholar Award and a CIHR New Investigator Award. NF is supported by a MSFHR/St. Paul’s Foundation Scholar Award.
Footnotes
Conflict of Interest
EW has a part-time appointment as the Chief Medical Officer with Numinus, a company that operates a testing and research lab facility and works towards potential addiction treatment and other therapeutic applications of psychedelic substances. M-JM’s institution has received an unstructured gift from NG Biomed, Ltd., to support his research. M-JM is the Canopy Growth professor of cannabis science at the University of British Columbia, a position created by unstructured gifts to the university from Canopy Growth, a licensed producer of cannabis, and the Government of British Columbia’s Ministry of Mental Health and Addictions. Neither of EW’s employer or the funder that supports M-JM had any role in study design; collection, analysis and interpretation of data; writing the report; and the decision to submit the report for publication. All authors declare no conflict of interest.
REFERENCES
- [1].Jalal H, Buchanich JM, Roberts MS, Balmert LC, Zhang K, Burke DS. Changing dynamics of the drug overdose epidemic in the United States from 1979 through 2016. Science 2018;361:eaau1184. [DOI] [PMC free article] [PubMed] [Google Scholar]
- [2].Public Health Agency of Canada. Opioid-related harms in Canada (2020). Available at: https://infobase.phac-aspc.gc.ca/datalab/national-surveillance-opioid-mortality.html#AORD (accessed June 2020).
- [3].British Columbia Coroners Service. Illicit drug toxicity deaths in BC: January 1, 2010—March 31, 2020. Burnaby, BC: Ministry of Public Safety & Solicitor General, 2020. Available at: https://www2.gov.bc.ca/assets/gov/birth-adoption-death-marriage-and-divorce/deaths/coroners-service/statistical/illicit-drug.pdf. [Google Scholar]
- [4].Scholl L, Seth P, Kariisa M, Wilson N, Baldwin G. Drug and opioid-involved overdose deaths—United States, 2013–2017. MMWR Morb Mortal Wkly Rep 2018;67:1419–27. [DOI] [PMC free article] [PubMed] [Google Scholar]
- [5].Xibiao Y, Jenny S, Bonnie H, Mark T, Perry Robert WK. Impact of drug overdose-related deaths on life expectancy at birth in British Columbia. Health Promot Chronic Dis Prev Can 2018;38:248–51. [DOI] [PMC free article] [PubMed] [Google Scholar]
- [6].BC Government News. Provincial health officer declares public health emergency. 2016; Available at: https://news.gov.bc.ca/releases/2016HLTH0026-000568 (accessed May 2020).
- [7].Province of British Columbia. Overdose prevention. Available at: https://www2.gov.bc.ca/gov/content/overdose/what-you-need-to-know/overdose-prevention (accessed May 2020).
- [8].Ciccarone D. Fentanyl in the US heroin supply: a rapidly changing risk environment. Int J Drug Policy 2017;46:107–11. [DOI] [PMC free article] [PubMed] [Google Scholar]
- [9].Dowell D, Noonan RK, Houry D. Underlying factors in drug overdose deaths. JAMA 2017;318:2295–6. [DOI] [PMC free article] [PubMed] [Google Scholar]
- [10].British Columbia coroners service. Fentanyl-detected illicit drug toxicity deaths: January 1, 2012 to January 31, 2020. Burnaby, BC: British Columbia Coroners Service; 2020;2020. Available at: https://www2.gov.bc.ca/assets/gov/birth-adoption-death-marriage-and-divorce/deaths/coroners-service/statistical/fentanyl-detected-overdose.pdf. [Google Scholar]
- [11].Ciccarone D, Ondocsin J, Mars SG. Heroin uncertainties: exploring users’ perceptions of fentanyl-adulterated and -substituted “heroin”. Int J Drug Policy 2017;46:146–55. [DOI] [PMC free article] [PubMed] [Google Scholar]
- [12].Mars SG, Ondocsin J, Ciccarone D. Sold as heroin: perceptions and use of an evolving drug in Baltimore, MD. J Psychoactive Drugs 2018;50: 167–76. [DOI] [PMC free article] [PubMed] [Google Scholar]
- [13].Tupper KW, McCrae K, Garber I, Lysyshyn M, Wood E. Initial results of a drug checking pilot program to detect fentanyl adulteration in a Canadian setting. Drug Alcohol Depend 2018;190:242–5. [DOI] [PubMed] [Google Scholar]
- [14].Green TC, Gilbert M. Counterfeit medications and fentanyl. JAMA Intern Med 2016;176:1555–7. [DOI] [PubMed] [Google Scholar]
- [15].Amlani A, McKee G, Khamis N, Raghukumar G, Tsang E, Buxton JA. Why the FUSS (fentanyl urine screen study)? A cross-sectional survey to characterize an emerging threat to people who use drugs in British Columbia. Canada Harm Reduct J 2015;12:54. [DOI] [PMC free article] [PubMed] [Google Scholar]
- [16].Bardwell G, Boyd J, Arredondo J, McNeil R, Kerr T. Trusting the source: the potential role of drug dealers in reducing drug-related harms via drug checking. Drug Alcohol Depend 2019;198:1–6. [DOI] [PMC free article] [PubMed] [Google Scholar]
- [17].McKnight C, Des Jarlais DC. Being “hooked up” during a sharp increase in the availability of illicitly manufactured fentanyl: adaptations of drug using practices among people who use drugs (PWUD) in New York City. Int J Drug Policy 2018;60:82–8. [DOI] [PMC free article] [PubMed] [Google Scholar]
- [18].Rouhani S, Park JN, Morales KB, Green TC, Sherman SG. Harm reduction measures employed by people using opioids with suspected fentanyl exposure in Boston, Baltimore, and Providence. Harm Reduct J 2019;16:39. [DOI] [PMC free article] [PubMed] [Google Scholar]
- [19].Karamouzian M, Papamihali K, Graham B et al. Known fentanyl use among clients of harm reduction sites in British Columbia. Canada Int J Drug Policy 2020;77:102665. [DOI] [PubMed] [Google Scholar]
- [20].Mathers BM, Degenhardt L, Bucello C, Lemon J, Wiessing L, Hickman M. Mortality among people who inject drugs: a systematic review and meta-analysis. Bull World Health Organ 2013;91: 102–23. [DOI] [PMC free article] [PubMed] [Google Scholar]
- [21].Smolina K, Crabtree A, Chong M et al. Patterns and history of prescription drug use among opioid-related drug overdose cases in British Columbia, Canada, 2015–2016. Drug Alcohol Depend 2019;194: 151–8. [DOI] [PubMed] [Google Scholar]
- [22].Wood E, Kerr T, Marshall BD et al. Longitudinal community plasma HIV-1 RNA concentrations and incidence of HIV-1 among injecting drug users: prospective cohort study. BMJ 2009;338:b1649. [DOI] [PMC free article] [PubMed] [Google Scholar]
- [23].Wood E, Stoltz JA, Montaner JS, Kerr T. Evaluating methamphetamine use and risks of injection initiation among street youth: the ARYS study. Harm Reduct J 2006;3:18. [DOI] [PMC free article] [PubMed] [Google Scholar]
- [24].Hayashi K, M M-JJ, Lysyshyn M et al. Substance use patterns associated with recent exposure to fentanyl among people who inject drugs in Vancouver, Canada: a cross-sectional urine toxicology screening study. Drug Alcohol Depend 2018;183:1–6. [DOI] [PMC free article] [PubMed] [Google Scholar]
- [25].Silverstein JH, Rieders MF, McMullin M, Schulman S, Zahl K. An analysis of the duration of fentanyl and its metabolites in urine and saliva. Anesth Analg 1993;76:618–21. [DOI] [PubMed] [Google Scholar]
- [26].Carroll JJ, Marshall BDL, Rich JD, Green TC. Exposure to fentanyl-contaminated heroin and overdose risk among illicit opioid users in Rhode Island: a mixed methods study. Int J Drug Policy 2017;46: 136–45. [DOI] [PMC free article] [PubMed] [Google Scholar]
- [27].Burnham KP, Anderson DR. Model selection and multimodel inference: a practical information-theoretic approach. Second. New York, NY: Springer-Verlag, 2002. [Google Scholar]
- [28].Kariisa M, Scholl L, Wilson N, Seth P, Hoots B. Drug overdose deaths involving cocaine and psychostimulants with abuse potential—United States, 2003–2017. MMWR Morb Mortal Wkly Rep 2019;68:388–95. [DOI] [PMC free article] [PubMed] [Google Scholar]
- [29].British Columbia Coroners Service. Illicit drug deaths with methamphetamine involved 2008–2017 Burnaby, BC. Burnaby, BC.: Ministry of Public Safety & Solicitor General, 2019. Available at:. https://www2.gov.bc.ca/assets/gov/birth-adoption-death-marriage-and-divorce/deaths/coroners-service/statistical/methamphetamine.pdf. [Google Scholar]
- [30].Al-Tayyib A, Koester S, Langegger S, Heroin RL. Methamphetamine injection: an emerging drug use pattern. Subst Use Misuse 2017;03:1051–8. [DOI] [PMC free article] [PubMed] [Google Scholar]
- [31].Glick SN, Burt R, Kummer K, Tinsley J, Banta-Green CJ, Golden MR. Increasing methamphetamine injection among non-MSM who inject drugs in King County, Washington. Drug Alcohol Depend 2018;182: 86–92. [DOI] [PMC free article] [PubMed] [Google Scholar]
- [32].Meacham MC, Strathdee SA, Rangel G, Armenta RF, Gaines TL, Garfein RS. Prevalence and correlates of heroin-methamphetamine co-injection among persons who inject drugs in San Diego, California, and Tijuana, Baja California, Mexico. J Stud Alcohol Drugs 2016;77: 774–81. [DOI] [PMC free article] [PubMed] [Google Scholar]
- [33].Ellis MS, Kasper ZA, Cicero TJ. Twin epidemics: the surging rise of methamphetamine use in chronic opioid users. Drug Alcohol Depend 2018;193:14–20. [DOI] [PubMed] [Google Scholar]
- [34].Jones CM, Underwood N, Compton WM. Increases in methamphetamine use among heroin treatment admissions in the United States, 2008–17. Addiction 2020;115:347–53. [DOI] [PMC free article] [PubMed] [Google Scholar]
- [35].Moallef S, Nosova E, Milloy MJ et al. Knowledge of fentanyl and perceived risk of overdose among persons who use drugs in Vancouver, Canada. Public Health Rep 2019;134:423–31. [DOI] [PMC free article] [PubMed] [Google Scholar]
- [36].Strathdee SA, Hallett TB, Bobrova N et al. HIV and risk environment for injecting drug users: the past, present, and future. Lancet 2010;376: 268–84. [DOI] [PMC free article] [PubMed] [Google Scholar]
- [37].Collins AB, Boyd J, Hayashi K, Cooper HLF, Goldenberg S, McNeil R. Women’s utilization of housing-based overdose prevention sites in Vancouver, Canada: an ethnographic study. Int J Drug Policy 2019;76: 102641. [DOI] [PMC free article] [PubMed] [Google Scholar]
- [38].Saitman A, P H-DD, Fitzgerald RL. False-positive interferences of common urine drug screen immunoassays: a review. J Anal Toxicol 2014;38: 387–96. [DOI] [PubMed] [Google Scholar]
- [39].Sherman SG, Park JN, Glick J et al. FORECAST study summary report. Johns Hopkins Bloomberg School of Public Health; 2018. Available at. https://americanhealth.jhu.edu/sites/default/files/inline-files/Fentanyl_Executive_Summary_032018.pdf (accessed May 2020). [Google Scholar]
- [40].Darke S Self-report among injecting drug users: a review. Drug Alcohol Depend 1998;51:253–63, discussion 267–8. [DOI] [PubMed] [Google Scholar]