

Summary
The lateral hypothalamic area (LHA) regulates feeding and reward related behavior, but because of its molecular and anatomical heterogeneity, the functions of defined neuronal populations are largely unclear. Glutamatergic neurons within the LHA (LHAVglut2) negatively regulate feeding and appetitive behavior. However, this population comprises transcriptionally distinct and functionally diverse neurons that project to diverse brain regions, including the lateral habenula (LHb) and ventral tegmental area (VTA). To resolve the function of distinct LHAVglut2 populations, we systematically compared projections to the LHb and VTA using viral tracing, single-cell sequencing, electrophysiology, and in vivo calcium imaging. LHAVglut2 neurons projecting to the LHb or VTA are anatomically, transcriptionally, electrophysiologically, and functionally distinct. While both populations encode appetitive and aversive stimuli, LHb projecting neurons are especially sensitive to satiety state and feeding hormones. These data illuminate the functional heterogeneity of LHAVglut2 neurons, suggesting that reward and aversion are differentially processed in divergent efferent pathways.
Introduction
The lateral hypothalamic area (LHA) is a neuroanatomical hub that regulates diverse motivated behaviors, including feeding and reward (Abrahamsen et al., 1995; Berthoud and Münzberg, 2011; Rossi and Stuber, 2018; Stuber and Wise, 2016). LHA lesions abolish feeding, and electrical stimulation promotes food approach and consumption (Anand and Brobeck, 1951; Hoebel and Teitelbaum, 1962; Margules and Olds, 1962). However, recent studies have shown that the LHA comprises functionally, transcriptionally, and anatomically distinct neuronal populations. (González et al., 2016; Jennings et al., 2013, 2015; Lazaridis et al., 2019; Mickelsen et al., 2019; Nieh et al., 2015; Rossi et al., 2019). Because of this complexity, which cells constitute functionally distinct cell types and how they coordinate motivated behavior remain largely unknown.
Adding an additional layer of complexity to understanding LHA function, circulating signals, such as the anorexigenic adipose-derived hormone leptin and the orexigenic gut-derived hormone ghrelin, influence feeding behavior via both direct and indirect action on LHA cells. Leptin infusion into LHA reduces food intake and body weight (Leinninger et al., 2009), whereas ghrelin infusion increases food intake (Olszewski et al., 2003). Both leptin and ghrelin are thought to regulate behavior via influences on mesolimbic dopamine (Cone et al., 2014; Domingos et al., 2011), but the circuit mechanisms underlying this are still being investigated (Abizaid et al., 2006; Fulton et al., 2006; Leinninger et al., 2009; Liu et al., 2017) see (Zessen et al., 2012) for review. Currently, little is known about how feeding hormones influence activity dynamics of defined LHA neuronal populations in vivo.
One LHA neuronal population residing upstream of dopaminergic cells that has been shown to regulate feeding, reward, and aversion is glutamatergic neurons expressing the vesicular glutamate transporter type 2 (encoded by Slc17a6, hereafter referred to as Vglut2). LHAVglut2 activation suppresses feeding and is aversive (Jennings et al., 2013; Rossi et al., 2019). However, LHAVglut2 neurons show considerable heterogeneity in their in vivo response dynamics during rewarding and aversive events (Lazaridis et al., 2019; Rossi et al., 2019). LHAVglut2 neurons also project to diverse brain regions, including the lateral habenula (LHb; LHAVglut2→LHb) and ventral tegmental area (VTA; LHAVglut2→VTA), two brain regions known to regulate reward and aversion (Lammel et al., 2012; Trusel et al., 2019). Indeed, activation of both LHAVglut2→LHb and LHAVglut2→VTA projections promotes avoidance (de Jong et al., 2019; Nieh et al., 2016; Stamatakis et al., 2016). Despite this, little is known about in vivo activity dynamics of individual neurons projecting to the LHb or VTA. Even less is known about their anatomical, transcriptional, or electrophysiological properties.
Here, we systematically compared LHAVglut2→LHb and LHAVglut2→VTA neurons. Using viral-mediated projection targeting, we found that LHAVglut2→LHb and LHAVglut2→VTA neurons are distinguished by their anatomy, electrophysiological properties, and gene expression. In a series of in vivo two-photon calcium imaging experiments, we show that reward and aversion-associated stimuli (sucrose and quinine) are differentially encoded within these pathways. Finally, we demonstrate that satiety state and feeding hormones uniquely alter the sucrose reward encoding properties of LHAVglut2→LHb and LHAVglut2→VTA neurons. Together, these results highlight the functional heterogeneity of LHAVglut2 neurons and show how reward and aversion are uniquely processed by divergent efferent pathways.
Results
LHAVglut2→LHb and LHAVglut2→VTA projections are anatomically distinct
To determine whether LHAVglut2 projections to the LHb and VTA are the same or unique cells, we used retrograde viral tracing. Cre-inducible, retrogradely trafficked viral vectors were microinjected into the LHb (retroAAV-DIO-eYFP) and VTA (retroAAV-DIO-mCherry) (Figure 1A–C and S1A–B). Fluorophore expression was examined within the LHA using fluorescence in situ hybridization. LHAVglut2→LHb and LHAVglut2→VTA projections showed unique expression patterns across the anterior-posterior LHA axis: LHAVglut2→LHb projections were more concentrated in the anterior LHA, whereas LHAVglut2→VTA projections were more concentrated in the posterior LHA (Figure 1D–F). LHAVglut2→VTA cells were found in greater numbers than LHAVglut2→LHb cells, but both were observed more frequently than double labeled cells (Figure 1G), indicating LHAVglut2→LHb and LHAVglut2→VTA projection pathways are largely anatomically distinct.
Figure 1: LHAVglut2→LHb and LHAVglut2→VTA projections are anatomically distinct.
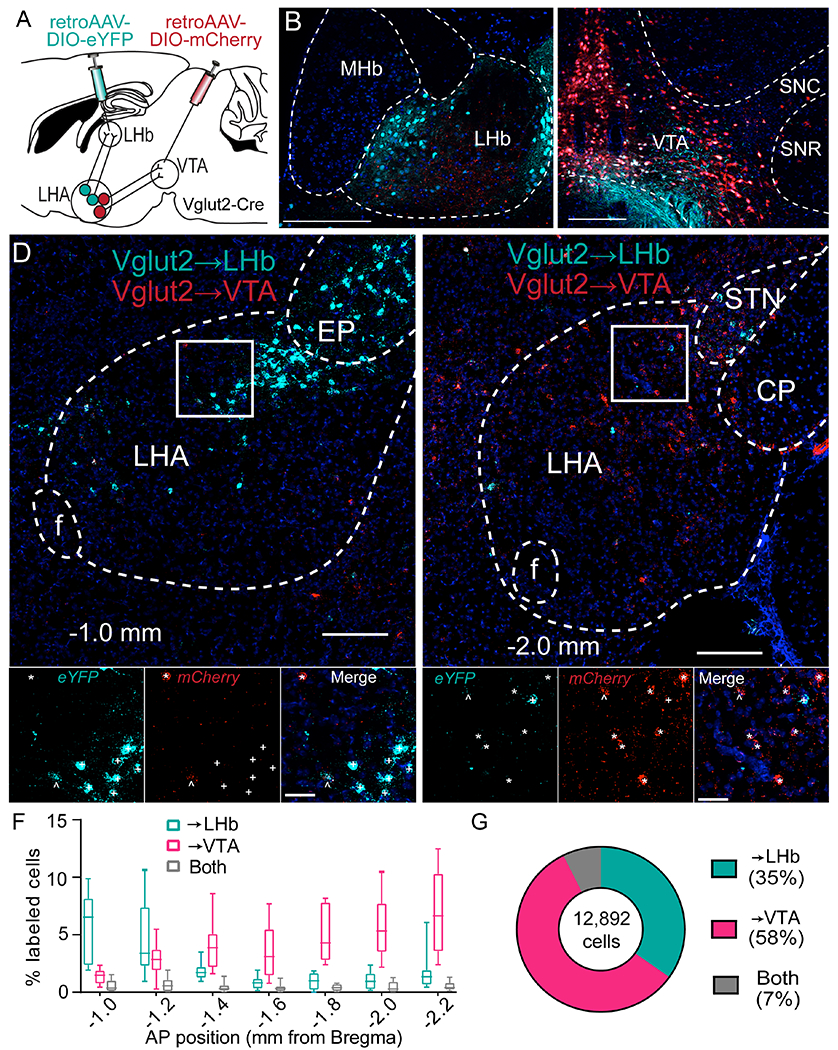
A. Dual retrovirus strategy.
B-C. Examples of locally transduced cells at LHb and VTA injection sites. Blue, DAPI. Scale bars, 200 μm.
D-E. Confocal micrographs showing in situ hybridization of eYFP and mCherry expression in anterior (D) and posterior LHA (E). Approximate AP coordinates are shown. Scale bars: 200 μm top, 50 μm bottom. +, eYFP+; *, mCherry+; ^, eYFP+/mCherry+.
F. Relative density of LHAVglut2→LHb and LHAVglut2→VTA projections throughout the AP extent of the LHA (n=10 hemispheres; 5 mice; effect of Projection: F(2,18)=65.83, p=5.3e-9; no effect of AP location: F(6,54)=1.97, p=0.09; Interaction: F(12,108)=12.05, p=4.0e-15).
G. Proportion of cells classified as projecting to LHb, VTA, or both. CP, cerebral peduncle; EP, entopeduncular nucleus; MHb, medial habenula; SNC, substantia nigra pars compacta; SNR, pars reticulata; STN, subthalamic nucleus.
LHAVglut2→LHb and LHAVglut2→VTA projections are transcriptionally distinct
We next sought to test whether LHA→LHb and LHA→VTA projections exhibited unique transcriptional signatures by combining retrograde viral labeling and single-cell mRNA sequencing. Wild-type mice were injected with retroAAV-hSyn-eYFP in the LHb and retroAAV-CAG-tdTomato in the VTA to label projection neurons (Figure S1C). LHA tissue punches were collected, and single cells were processed via a Chromium v3 droplet based mRNA sequencing pipeline (Figure 2A; Hashikawa et al., 2020). Low quality cells and doublets were removed, and clustering was performed on 34,518 cells (Figure S1D–H). Of these, 17,378 were classified as neurons, which formed 32 subclusters (Figure 2B). Following quality control steps, we detected a median of 5,544 unique molecular identifiers (UMIs), 3,106 genes, 38,544 reads, and 5% mitochondrial reads per neuron. We detected eYFP (n=257 neurons) and tdTomato (n=1,595 neurons) transcripts in largely non-overlapping LHA neurons (Figures 2C and S1I). LHb projections were primarily glutamatergic, while VTA projections were more heterogeneous (Figure S1J). To determine if eYFP and tdTomato populations express unique marker genes, we performed logistic regression based differential gene expression analysis, revealing 106 differentially expressed genes (Figure 2D) and suggesting that LHA→LHb and LHA→VTA projections are transcriptionally distinguishable using multiple gene markers.
Figure 2: LHAVglut2→LHb and LHAVglut2→VTA projections are transcriptionally distinct.

A. Experimental pipeline. Fluorophore-encoding retrogradely trafficked AAVs were injected into LHb and VTA. LHA tissue punches were taken and single-cell RNA sequencing was performed.
B. UMAP showing 32 LHA neuronal subclusters (n=6).
C. Proportion of labeled cells expressing tdTomato (tdT), eYFP, or both.
D. DEG analysis comparing eYFP+ and tdTomato+ cells reveals 106 differentially expressed genes (orange and green; p<0.01, dashed line). Positive log fold change (logFC) indicates enrichment in eYFP+ cells. Highlighted genes were selected for in situ validation (See Figure 3).
E. eYFP+ and tdTomato+ cells are enriched in distinct neuronal subclusters.
F. Pax6 and Pdyn expression within neuronal subclusters.
G. Neuronal subclusters are distinguished by unique genes. Highlighted clusters were targeted for in situ validation.
Previous LHA sequencing results defined neuronal subclusters by combinatorial gene expression (Mickelsen et al., 2019; Rossi et al., 2019), and we extend these findings, demonstrating how LHA→LHb and LHA→VTA projection neurons segregate within defined subclusters. Clusters could first be classified based on expression of genes commonly used to target distinct LHA cell types, including Hcrt, Pmch, Slc32a1 (Vgat), and Vglut2, and secondary marker genes including neuropeptides, receptors, or transcription factors (Figure S1K–L). Clusters marked by Hcrt and Pmch also expressed low levels of Vglut2. eYFP and tdTomato labeled cells exhibited unique distributions within the neuronal subclusters (Figure 2E). Of the neuronal subclusters enriched with labeled cells, four also expressed high levels of Vglut2. They could be further differentiated by the presence of subcluster-specific gene markers, including Pax6 and Sostdc1 (LHAVglut2→LHb clusters); Hcrt, Pdyn and Pitx2 (LHAVglut2→VTA clusters); and Nptx2 (LHAVglut2→LHb and LHAVglut2→VTA clusters) (Figure 2F–G and S1K–L). The densest concentrations of labeled cells were found in distinct subclusters. Specifically, Pax6 robustly labeled Glut1, which was highly enriched with eYFP+ cells, whereas Pdyn labeled the glutamatergic hypocretin/orexin (Pdyn/Hcrt) cluster, which was enriched with tdTomato+ cells (Figure 2F). Nptx2 expressing cells were concentrated within both Glut1 and Pdyn/Hcrt clusters. The eYFP-rich Glut2 cluster was marked by Sostdc1, and the tdTomato-rich Glut14 cluster expressed Pitx2. Collectively, single-cell mRNA sequencing revealed that LHAVglut2→LHb and LHAVglut2→VTA projection populations express distinct molecular markers.
To cross-validate the observed transcriptional patterns, expression of genes that distinguish the two projections was assessed in situ with sequential single molecule hybridization chain reaction (HCR; von Buchholtz et al., 2021; Choi et al., 2018) for nine genes that characterized LHAVglut2→LHb and LHAVglut2→VTA enriched neuronal clusters (Vglut2, Vgat, Pax6, Pdyn, Nptx2, Sostdc1, Pitx2, eYFP, and tdTomato; Figure 3A–B). In each of three HCR rounds, mRNA from three genes were labeled and imaged. Between rounds, probes from the previous round were digested to permit new hybridization. Cells from all rounds were then aligned using brightfield images. mRNA puncta were quantified within single cells based on DAPI staining (HALO, Indica Labs). Each gene exhibited a unique spatial expression pattern within the LHA (Figures 3C–K and S2A–B). In agreement with previous results (Figure 1), eYFP and tdTomato expressing cells were spatially intermixed (Figure 3L). Proportions of virally labeled cells also expressing gene markers for LHAVglut2→LHb and LHAVglut2→VTA populations were similar between sequencing and HCR (Figure 3M–O). Consistently, the log fold-change between eYFP+ and tdTomato+ cells for the nine genes targeted for HCR was highly correlated across methodologies (Figure 3P). Based on the single-cell sequencing, we predicted that Nptx2 would label both projection populations with enrichment in Pdyn+ cells; however, HCR analysis indicates that this gene may be more highly expressed within the LHAVglut2→LHb neurons. We then asked whether the mRNA expression data could be used to identify eYFP+ and tdTomato+ cells using support vector machine (SVM) based classification. Both sequencing and HCR data performed equally well at classifying the two projections (Figures 3Q and S2C–D). These results confirm that LHAVglut2→LHb and LHAVglut2→VTA projections are transcriptionally distinct.
Figure 3: HCR validation of single-cell sequencing results.

A. Dual retrograde virus strategy used to profile LHA projection neurons.
B. Sequential HRC workflow. Three genes were targeted per round.
C-K. Example expression of the nine genes targeted. Rows correspond to HCR rounds. Scale bar, 200 μm. Λ eYFP+, < tdT+
L. Normalized spatial distribution of eYFP+ and tdTomato+ cells within LHA.
M-N. Proportion of eYFP+ and tdTomato+ cells expressing each of the 7 marker genes in HCR (M) and RNA sequencing (N) experiments.
O. Percent cells expressing each gene is highly correlated between sequencing and HCR experiments (r=0.81, p=0.00047).
P. LogFC values were highly correlated between RNA sequencing and HCR experiments (r=0.94, p=0.00015). Negative values indicate enrichment in tdTomato+ cells.
Q. HCR and RNA sequencing data are equally effective at classifying cells as eYFP+ or tdTomato+ (* Bonferroni adjusted p<0.05).
LHAVglut2→LHb and LHAVglut2→VTA projections are electrophysiologically distinct
To assess whether functional differences accompany the observed transcriptional differences, LHAVglut2→LHb and LHAVglut2→VTA neurons were targeted for whole cell patch clamp recording (Figure 4A). Overall, LHAVglut2→LHb neurons were more active at rest and more excitable than VTA projectors (Figure 4B–J). LHAVglut2→LHb and LHAVglut2→VTA projections showed similar resting potentials (Figure 4C) and action potential amplitudes (Figure 4D). However, LHb projectors had lower membrane capacitance (Figure 4E), more hyperpolarized spike thresholds (Figure 4F), and smaller afterhyperpolarizations (Figure 4G), which likely underlie the increased spontaneous firing (Figure 4H), lower rheobase (Figure 4I), and increased spiking during positive current injections (Figure 4J). Consistent with the distinct electrophysiological signatures, these properties could be used to decode the projection target (Figure 4K).
Figure 4: LHAVglut2→LHb and LHAVglut2→VTA projections are electrophysiologically distinct.

A. Dual retrovirus strategy (left) and example cells (right).
B. Example whole cell recording of basal firing rate (left), current step injections (center; −20, 0, and +190 pA injections), and rheobase (right; 10 ms current injections, 10 pA steps).
C. Resting potential (46/47 cells; 11/10 mice; t(91)=0.01, p=0.99).
D. Action potential amplitude (45/46 cells; 11/10 mice; t(89)=0.01, p=0.99).
E. Membrane capacitance (46/47 cells; 11/10 mice; t(91)=2.69, p=0.008).
F. Action potential threshold (45/46 cells; 11/10 mice; t(89)=4.56, p=0.00002).
G. Afterhyperpolarization (AHP) amplitude (45/46 cells; 11/10 mice; t(89)=2.53, p=0.01).
H. Cell attached spontaneous firing rate (30/35 cells; 8/7 mice; t(63)=4.02, p=0.0002).
I. Rheobase (46/47 cells; 11/10 mice; t(91)=5.62, p=2e-7).
J. Current step injection (spikes per 800 ms sweep. 45/46 cells; 11/10 mice. Effect of Current: F(19,1691)=69.92, p<1e-6; Effect of Projection: F(1,89)=6.34, p=0.01; Interaction: F(19,1691)=3.77, p<1e-6). Mean±s.e.m.
K. Electrophysiological properties can be used to decode the projection target (p=0.002).
LHAVglut2→LHb and LHAVglut2→VTA projection neurons differentiate appetitive and aversive tastants in vivo
Previous studies have implicated both LHAVglut2→LHb and LHAVglut2→VTA projections in regulating reward and aversion (de Jong et al., 2019; Lazaridis et al., 2019; Nieh et al., 2016; Stamatakis et al., 2016); however, the underlying single neuron activity dynamics are largely uncharacterized. To address this, we combined projection- and cell-type-specific viral targeting with in vivo two-photon calcium imaging using the INTERSECT strategy to record activity dynamics from LHAVglut2→LHb and LHAVglut2→VTA neurons during presentation of appetitive and aversive tastes (Fenno et al., 2014, 2020; Figure 5A and S3). Thirsty mice were randomly presented with sucrose and quinine solutions (75/25% of trials, respectively; Figure 5B). Because mice could not predict which solution would be delivered, they reliably consumed both tastants; however, licking ceased earlier on quinine trials compared with sucrose trials (Figure 5C). Many neurons showed excitatory responses that were timelocked to sucrose and quinine consumption (Figure 5D–H). Consistent with previous reports (de Jong et al., 2019; Lazaridis et al., 2019), neurons belonging to each projection pathway showed greater responses to quinine than to sucrose (Figure 5I). Interestingly, quinine potentiated the responses of LHAVglut2→VTA neurons significantly more than LHAVglut2→LHb neurons (Figure 5J–K), yielding greater ability to decode the delivered tastant from activity dynamics of individual LHAVglut2→VTA neurons compared with LHAVglut2→LHb neurons (Figure 5L). LHAVglut2→VTA neurons were also more responsive to water consumption than were LHAVglut2→LHb neurons (Figure S4). Together, these results suggest that LHAVglut2→LHb and LHAVglut2→VTA pathways respond to both positive and negative valence tastants, though responses are greatest to aversive stimuli.
Figure 5: LHAVglut2→LHb and LHAVglut2→VTA projections differentiate appetitive and aversive tastants.

A. Intersectional virus strategy.
B. Experimental design.
C. Average±s.e.m. lick rate for all trials (n=10 mice).
D. Example field of view for LHAVglut2→LHb (top) and LHAVglut2→VTA (bottom) recordings.
E. Calcium dynamics extracted from the cells in D.
F-G. Single LHAVglut2→LHb and LHAVglut2→VTA ROI activity dynamics for sucrose and quinine trials. Data are aligned to first lick after tastant delivery (dashed line). Right, mean responses. ROIs correspond to arrows in D. Heatmap scale bar: 2s.
H. Population activity dynamics for sucrose and quinine trials for LHAVglut2→LHb and LHAVglut2→VTA (n=5 mice/group) recordings. Mean±s.e.m. traces at bottom. Scale bar 2s.
I. AUC for LHAVglut2→LHb and LHAVglut2→VTA recordings for sucrose and quinine trials (effect of Tastant: F(1,268)=63.48, p=4.7e-14; no effect of Projection: F(1,268)=1.75, p=0.19; Interaction: F(1,268)=3.97, p=0.047). *, Tukey multiple comparisons test p<0.05. Mean+s.e.m.
J. ROI sucrose and quinine responses are correlated (LHb: Pearson r=0.86, p<1.0e-15; VTA: r=0.72, p<1.0e-15; *, F test to compare intercepts: F(1,267)=10.48, p=0.0014).
K. Percent ROIs in which quinine response magnitude is higher (↑), lower (↓), or unchanged (↔) relative to sucrose response (paired t-test, p<0.05). Populations compared with chi-squared test (X2=15.60, p=0.0004).
L. Activity of individual ROIs belonging to both projections can decode delivered tastant (Welch’s t test LHb model vs shuffle: t(275.4)=14.98, p<1.0e-15; VTA model vs shuffle: t(236.2)=20.84, p>1.0e-15; t test LHb model vs VtA model: t(268)=2.10, p=0.037).
Reward encoding in LHAVglut2→LHb and LHAVglut2→VTA projections depends on satiety state and is modified by feeding hormones
LHA neurons have long been known to alter food reward encoding according to satiety state (de Araujo et al., 2006; Burton et al., 1976; Rossi et al., 2019). To test whether sucrose reward encoding in LHAVglut2 projections is affected by satiety state, we recorded activity dynamics from LHAVglut2→LHb and LHAVglut2→VTA projections when mice were ad lib. fed and after a 24 hr fast (Figure 6). While fasting elevated total sucrose seeking (Figure S5A), consummatory lick patterning was similar between conditions (Figure S5B–C). Individual neurons from both LHAVglut2→LHb and LHAVglut2→VTA projection populations responded more vigorously to sucrose consumption when fasted compared to when fed (Figure 6A–D), but this difference could not be explained by differences in licking (Figure S5D–G). Notably, the projections exhibited reliable differences in their temporal dynamics; LHAVglut2→LHb responses tended to peak more quickly than LHAVglut2→VTA responses. Analysis of basal dynamics in vivo in the absence of sucrose consumption also supports the observed ex vivo electrophysiological differences in which LHAVglut2→LHb neurons are more active and excitable than LHAVglut2→VTA neurons (Figure S5H–K). Individual neuron responses in fasted and fed conditions were highly correlated in vivo (Figure 6E). In agreement with the increased response magnitudes after fasting, a greater proportion of both LHAVglut2→LHb and LHAVglut2→VTA neurons were responsive when mice were fasted compared to when fed (Figure 6F), and activity dynamics of both populations could be used to decode the mouse’s satiety state (Figure 6G). Interestingly, when mice were fed, a greater proportion of LHAVglut2→LHb than LHAVglut2→VTA neurons responded to sucrose consumption but fasting eliminated this difference (Figure 6F). This is supported by the observation that fasting reduces dissimilarities between electrical properties of LHAVglut2→LHb and LHAVglut2→VTA neurons ex vivo (Figure S6A–H). Decoding analysis revealed significantly greater ability to discriminate the projection target in fed mice relative to fasted mice using electrophysiological properties (Figure S6I). Synaptic input onto both LHAVglut2→LHb and LHAVglut2→VTA neurons was uniformly affected by fasting (Figure S6J–S). Collectively, the results of fasting experiments suggest that satiety states robustly shape the activity of both LHAVglut2→LHb and LHAVglut2→VTA neuron populations, with fasting reducing the functional dissimilarity between pathways.
Figure 6: Satiety modifies reward encoding in LHAVglut2→LHb and LHAVglut2→VTA projections in vivo.

A. Field of view for LHAVglut2→LHb (top) and LHAVglut2→VTA (bottom) projections.
B. Single ROI examples (arrows in A) of activity dynamics during sucrose consumption when mice are fed and fasted. Data are aligned to first lick after sucrose delivery (dashed line). Bottom, mean response. Scale bars: 10% ΔF/F (bottom). Horizontal scale, 2s.
C. LHAVglut2→LHb and LHAVglut2→VTA population responses during sucrose consumption (n=5 mice/group). Bottom, mean±s.e.m. Vertical scale, 2% ΔF/F. Horizontal scale, 2s.
D. AUC is increased by fasting in both projection populations (effect of Fasting: F(1,578)=21.77, p=3.8e-6; no effect of Projection: F(1,578)=3.40, p=0.07; no Interaction: F(1,578)=0.15, p=0.70). *, Tukey multiple comparisons test p<0.05. Mean+s.e.m.
E. AUC values are correlated in fed and fasted ROIs (LHb: Pearson r=0.79, p<1.0e-15; VTA: r=0.75, p<1.0e-15; *, F test to compare slopes: F(1,287)=5.96, p=0.015).
F. Percent cells responding to sucrose consumption. Both projections showed more responsivity when fasted than when fed (LHb: X2=25.56, p=2.8e-6; VTA: X2=36.95, p=9.4e-9). When fed, LHb projectors are more responsive than VTA projectors to sucrose consumption (X2=12.58, p=1.9e-3), whereas projections show similar responsivity when fasted (X2=1.71, p=0.42).
G. Activity dynamics from single ROIs of both projections could be used to decode satiety state significantly better than shuffled data (LHb: Welch’s t(280.26)=7.13, p=8.5e-12; VTA: t(237.27)=6.18, p=2.7e-9).
Because satiety state alters encoding of sucrose rewards in LHAVglut2→LHb and LHAVglut2→VTA neurons, we hypothesized that their activity dynamics might therefore be influenced by circulating feeding hormones, which are known to fluctuate based on energy state (Bagnasco et al., 2002; Jensen et al., 2013). Leptin and ghrelin exert opposing control over feeding via the LHA (Leinninger et al., 2009; Olszewski et al., 2003). mRNA for the leptin receptor, Lepr, and the ghrelin receptor, Ghsr, are found within many LHA cells, including a subset of LHAVglut2→LHb and LHAVglut2→VTA neurons (Figure S7A–H). We tested whether these hormones influenced sucrose reward encoding by injecting leptin (1.5 mg/kg i.p. fasted), ghrelin (1.0 mg/kg i.p. fed), or vehicle control (saline fasted and fed) 30 min prior to imaging (Figure 7A–B). Consistent with their opposing effects on 24 hr food intake (Figure S7I–J), leptin increased the latency to retrieve sucrose rewards (Figure 7C), whereas ghrelin reduced it (Figure 7D) without disrupting lick patterning or reward consumption (Figure S7K–L) in both groups. Both LHAVglut2→LHb and LHAVglut2→VTA neurons altered sucrose encoding after leptin, but in opposing directions. Leptin reduced response magnitude in LHAVglut2→LHb neurons and potentiated responses in LHAVglut2→VTA neurons (Figure 7E–H). In contrast, ghrelin potentiated LHAVglut2→LHb responses but had little effect on the responses of LHAVglut2→VTA neurons (Figure 7I–L). This pattern is also reflected in the proportion of neurons with significantly altered responses relative to vehicle control (Figure S7M). Thus, circulating feeding hormones tune reward encoding properties of molecularly defined LHA projection neurons in vivo, suggesting that LHAVglut2→LHb and, to a lesser extent, LHAVglut2→VTA neurons integrate peripheral signals to orchestrate feeding.
Figure 7: Feeding hormones differentially modify reward encoding in LHAVglut2→LHb and LHAVglut2→VTA projections.

A. Experimental design. Leptin was injected into fasted mice and ghrelin injected into fed mice.
B. Example fields of view.
C. Leptin increases the latency to lick following reward delivery for both groups (* effect of Leptin: F(1,390)=5.02, p=0.026; no effect of Projection: F(1,390)=0.15, p=0.70; no Interaction: F(1,390)=0.19, p=0.66).
D. Ghrelin reduces the latency to lick following reward delivery for both groups (* effect of Ghrelin: F(1,389)=6.39, p=0.012; no effect of Projection: F(1,389)=0.04, p=0.85; no Interaction: F(1,389)=0.04, p=0.85).
E. Population heatmap showing individual cell responses to vehicle and leptin injections.
F-G. Mean±s.e.m. response of LHAVglut2→LHb (F) and LHAVglut2→VTA (G) projections during sucrose consumption after leptin administration.
H. Leptin reduces evoked response magnitude in LHb projections and increases response magnitude in VTA projections (effect of Leptin: F(1,370)=10.50, p=0.0013; effect of Projection: F(1,370)=7.60, p=0.006; Interaction: F(1,370)=63.99, p=1.6e-14. * Sidak’s multiple comparisons test, p<0.001). V, vehicle; L, leptin.
I. Population heatmap showing individual cell responses to vehicle and ghrelin.
J-K. Mean±s.e.m. response of LHAVglut2→LHb (J) and LHAVglut2→VTA (K) projections during sucrose consumption after ghrelin administration.
L. Ghrelin reduces evoked response magnitude in LHb projections (no effect of Ghrelin: F(1,313)=1.56, p=0.21; no effect of Projection: F(1,313)=2.94, p=0.087; Interaction: F(1,313)=14.94, p=0.00013. * Sidak’s multiple comparisons test, p<0.001). V, vehicle; G, ghrelin. Mean+s.e.m.
Discussion
Here, we performed a systematic analysis of lateral hypothalamic glutamate neurons projecting to the LHb or VTA. We demonstrate that LHAVglut2→LHb and LHAVglut2→VTA projections are anatomically, transcriptionally, electrophysiologically, and functionally distinct from one another. LHAVglut2→LHb neurons are commonly found in anterior LHA, are more likely to express Pax6, and are more excitable than LHAVglut2→VTA neurons, which tend to reside in posterior LHA, more commonly express Pdyn/Hcrt, and are less excitable. Functionally, both LHAVglut2→LHb and LHAVglut2→VTA neurons encode appetitive and aversive tastants but encode aversion with greater responses at the concentrations used in this study. Interestingly, VTA projectors show more pronounced quinine responses than LHb projectors. Both LHAVglut2→LHb and LHAVglut2→VTA projections show reliable excitatory responses to sucrose rewards, which are facilitated by fasting. However, LHAVglut2→LHb neurons are more responsive when mice are fed than are LHAVglut2→VTA neurons. Finally, feeding hormones differentially influence these populations such that leptin blunts LHAVglut2→LHb and potentiates LHAVglut2→VTA food reward encoding. In contrast, ghrelin potentiates LHAVglut2→LHb encoding but has little effect on LHAVglut2→VTA dynamics. Collectively, these results suggest functional divergence in which both LHAVglut2→LHb and LHAVglut2→VTA projections signal aversive events, but LHAVglut2→LHb neurons may play a greater role in guiding feeding.
Transcriptional characterization of LHAVglut2→LHb and LHAVglut2→VTA neurons
To test whether LHAVglut2→LHb and LHAVglut2→VTA neurons are molecularly distinct, we combined single-cell mRNA profiling with viral projection labeling. LHAVglut2→LHb and LHAVglut2→VTA projections tend to fall into transcriptionally distinct neuronal subclusters (Figure 2). Our results agree with previous LHA single-cell sequencing experiments that identified transcriptionally unique LHA subclusters without factoring in projection targets (Mickelsen et al., 2019; Rossi et al., 2019). These subclusters are classified based on the expression of Vgat or Vglut2, which are non-uniformly distributed within the LHA (Figure S2), as well as expression of subcluster specific markers (Wang et al., 2021). LHAVglut2→LHb neurons were concentrated in the cluster marked by Vglut2 and Pax6, whereas LHAVglut2→VTA neurons were concentrated in the cluster marked by Vglut2, Pdyn, and Hcrt. This pattern was confirmed in situ; however, we cannot conclusively say that the LHAVglut2→LHb and LHAVglut2→VTA projections further characterized here express Pax6 or Pdyn/Hcrt, respectively. Future studies are needed to test whether LHAPax6→LHb and LHAPdyn/Hcrt→VTA populations are functionally similar to LHAVglut2→LHb and LHAVglut2→VTA projections. Interestingly, sequencing identified more VTA-projecting than LHb-projecting cells. This is partly due to the relative heterogeneity of VTA projections that could be targeted with the nonspecific viral strategy. Numerous LHA cell types project to the VTA including those expressing GABA, glutamate, hypocretin, neurotensin, and melanin-concentrating hormone (Fadel and Deutch, 2002; Liu et al., 2017; Nieh et al., 2016; Woodworth et al., 2018). In contrast, LHA cells projecting to LHb are thought to be primarily glutamatergic (Lazaridis et al., 2019; Stamatakis et al., 2016). Indeed, our data agree with these observations (Figures 2E and S1J). The specific promoters used to target each pathway (i.e., hSyn or CAG) may also contribute to the increased proportion of VTA-projecting cells recovered (Jackson et al., 2016; Powell et al., 2015).
Notably, LHA→LHb and LHA→VTA projections were uniquely distributed within neuronal subclusters. Whereas LHA→LHb neurons were relatively restricted within a few primarily glutamatergic subclusters, LHA→VTA neurons were more broadly distributed across GABAergic and glutamatergic clusters (Figure 2E). The LHAVglut2 subcluster with the greatest concentration of VTA-projecting cells was marked by Pdyn and Hcrt, the gene encoding orexin/hypocretin. We used Pdyn for further validation because Hcrt was weakly expressed in many subclusters (Figure 2G); however, highly-expressing orexin neurons comprise a sizable subset of LHAVglut2→VTA neurons that largely overlaps with the LHAVglut2→VTA Pdyn+ population (Mickelsen et al., 2017). Thus, we consider LHA→VTA neurons expressing Pdyn and Hcrt a single population. However, much research into this cell type has specifically focused on orexin neurons. LHA orexin neurons express Vglut2 (Rosin et al., 2003; also see Figure 2G) and project to the VTA (Fadel and Deutch, 2002; Iyer et al., 2018) where they directly and indirectly regulate dopamine neuron activity (Baimel et al., 2017; Borgland et al., 2008; Korotkova et al., 2003) to influence reward-related behavior and feeding (Harris and Aston-Jones, 2006; Harris et al., 2005; Nakamura et al., 2000; Teegala et al., 2020). Our results agree with known LHA→VTA diversity (Nieh et al., 2015) as well as the anatomy and function of orexin neurons (de Lecea et al., 1998; Peyron et al., 1998), but future work must disentangle the contributions of LHAPdyn/Hcrt→VTA neurons from the wider LHAVglut2→VTA population.
Functional differences in reward and aversion encoding in LHAVglut2→LHb and LHAVglut2→VTA neurons
Both LHAVglut2→LHb and LHAVglut2→VTA projections signal appetitive and aversive stimuli with predominately excitatory responses, though quinine elicits stronger responses than sucrose (Figure 5). Broadly, this aligns with single cell calcium imaging of LHAVglut2→LHb neurons (Lazaridis et al., 2019) and fiber photometry of LHAVglut2→VTA projections (de Jong et al., 2019) in which foot shocks elicit excitatory responses. We show for the first time that individual LHAVglut2 projection neurons encode both appetitive and aversive stimuli. LHAVglut2→VTA neurons showed comparatively greater responses to quinine than did LHAVglut2→LHb neurons, suggesting that VTA projections may be preferentially tuned for aversive stimuli. Interestingly, LHAVglut2→VTA neurons also showed greater responses than LHAVglut2→LHb neurons to water rewards when mice were thirsty (Figure S4), although activity of both populations was weaker for water than for sucrose or quinine. These results support the idea that VTA projectors are particularly responsive to highly salient stimuli, with the strongest responses being elicited by stimuli with negative valance. The broad tuning suggests that these neurons are not simply conveying reward or aversion signals but may represent higher level functions such as those associated with terminating ongoing actions, including feeding, consummatory behavior, and reward seeking.
In addition to responding to aversive events, both LHAVglut2→LHb and LHAVglut2→VTA projections were active during sucrose consumption, and response magnitudes increased when motivation to obtain food was elevated by fasting (Figure 6). In contrast to the observation that LHAVglut2→VTA neurons were more responsive to quinine, LHAVglut2→LHb neurons were more responsive than LHAVglut2→VTA projections to sucrose consumption when mice were fed. However, this difference was eliminated by fasting, suggesting that circuit level or systemic factors may differentially regulate LHAVglut2→LHb and LHAVglut2→VTA activity in response to satiety.
LHAVglut2→LHb and LHAVglut2→VTA projections exhibit pronounced electrophysiological differences, which support in vivo imaging results. LHAVglut2→LHb neurons were more excitable and more active at rest than LHAVglut2→VTA neurons (Figure 4). LHAVglut2→VTA neurons spontaneously fired at ~2 Hz (Figure 4H), which is consistent with recordings from identified orexin neurons (Li et al., 2002). LHAVglut2→LHb responses peaked sooner after sucrose consumption than did LHAVglut2→VTA responses (Figures 6 and 7). Differences in excitability may underlie these unique response profiles. The proportion of sucrose responsive neurons was greater in LHAVglut2→LHb than in LHAVglut2→VTA projection populations when mice were fed but fasting eliminated this difference (Figure 6F). This was mirrored ex vivo, as fasting reduced electrophysiological dissimilarities between the projection populations (Figure S6).
Hormonal modification of LHAVglut2→LHb and LHAVglut2→VTA reward encoding
Because LHAVglut2→LHb and LHAVglut2→VTA neurons were more responsive to sucrose after a fast (Figure 6), we hypothesized that circulating hormones, which are opponently regulated by fasting (Bagnasco et al., 2002), may underlie these changes. Systemic administration of leptin and ghrelin uniquely affected sucrose encoding dynamics in LHAVglut2→LHb and LHAVglut2→VTA neurons (Figure 7). Much evidence has demonstrated that leptin and ghrelin can influence behavior via the LHA and connected brain regions, yet the effects on neural activity in vivo are largely unknown. Lepr expressing neurons project to the VTA to regulate downstream activity (Liu et al., 2017) and food motivation (Leinninger et al., 2009; Schiffino et al., 2019). While LHA Lepr neurons are often considered exclusively GABAergic (Leinninger et al., 2009), previous reports have demonstrated that a subset of hypothalamic Lepr neurons express glutamatergic markers (Mickelsen et al., 2019; Romanov et al., 2017). Furthermore, leptin depolarizes LHA Lepr neurons and increases accumbens dopamine release in brain slices (Leinninger et al., 2009), which is consistent with our observation that leptin potentiated LHAVglut2→VTA sucrose dynamics in vivo. Similarly, intra-LHA ghrelin potentiates feeding (López-Ferreras et al., 2017; Olszewski et al., 2003) and striatal dopamine release (Cone et al., 2014), though it is unknown if LHb projections are involved. Whereas peripheral ghrelin tends to quickly increase food intake (Wang et al., 2014; Wren et al., 2001), leptin tends to reduce food intake more slowly (Barrachina et al., 1997). Despite this, both leptin and ghrelin can produce physiological changes within 30 min (Di Marzo et al., 2001; Wren et al., 2000). Consistently, we observed opposing effects on licking approximately 30 min after peripheral injection (Figure 7C,D), suggesting that head-fixed sucrose consumption may be more sensitive than free feeding assays.
Consistent with previous studies (Mickelsen et al., 2019; Romanov et al., 2017; Rossi et al., 2019), we detected only sparse Lepr and Ghsr expression with single-cell sequencing. We therefore used in situ hybridization to observe Ghsr and Lepr expression on projection neurons (Figure S7). Because LHAVglut2→LHb and LHAVglut2→VTA neurons express Lepr and Ghsr and because leptin and ghrelin act in LHA, it is possible that the observed changes in sucrose encoding are caused by direct action on the imaged neurons. However, the observed responses likely involve circuit level effects. Most LHA Lepr and Ghsr expression is on cells that were not identified LHb or VTA projections (Figure S7B,E). Furthermore, leptin and ghrelin can influence the electrical activity of other LHA cell types including orexin and melanin-concentrating hormone neurons (Liu et al., 2017; Yamanaka et al., 2003). Additionally, leptin and ghrelin act in both upstream (e.g., arcuate nucleus) and downstream (e.g., VTA) brain regions, so the net effects on neurocircuit dynamics are difficult to predict. Thus, we tested whether feeding hormones influence the net activity of molecularly and anatomically defined LHA projection neurons in vivo and demonstrate for the first time that leptin blunts LHAVglut2→LHb and facilitates LHAVglut2→VTA sucrose encoding. Conversely, ghrelin facilitates LHAVglut2→LHb dynamics while LHAVglut2→VTA responses are unaffected (Figure 7). Whether similar responses are observed in other LHA cell types remains to be tested.
Systemic leptin and ghrelin administration failed to fully recapitulate the sucrose encoding dynamics observed in fed and fasted states, respectively. Specifically, ghrelin administration in fed mice did not cause LHAVglut2→VTA neurons to respond to sucrose as if mice were fasted, and leptin given to fasted mice did not cause LHAVglut2→VTA neurons to respond as if fed. While circulating leptin and ghrelin levels vary with energy state, fasting causes widespread physiological changes extending beyond feeding hormones (Jensen et al., 2013). Thus, other factors that are not present in exogenous hormone manipulation may contribute to the effects of fasting on these pathways. Indeed, many other peripherally derived hunger and satiety signals, including insulin, glucagon, glucagon-like peptide-1, amylin, or cholecystokinin, may influence LHAVglut2→LHb and LHAVglut2→VTA activity. Future studies will be needed to test how they influence sucrose encoding.
Comparison of projection neurons to the LHAVglut2 population
Overall, responses observed in LHAVglut2→LHb and LHAVglut2→VTA projections are consistent with the known function and activity patterns of the wider LHAVglut2 population. Previous reports demonstrated that LHAVglut2 neurons encode positive and negative valence stimuli with excitatory responses (Lazaridis et al., 2019; Rossi et al., 2019). Both LHAVglut2→LHb and LHAVglut2→VTA projection populations, which comprise a subset of the LHAVglut2 population, primarily responded to appetitive and aversive stimuli with excitatory responses. Consistent with the proposed role of LHAVglut2 neuron activation in halting ongoing appetitive behavior, LHAVglut2→LHb and LHAVglut2→VTA projections showed elevated quinine responses, which were associated with truncated licking bouts. LHAVglut2→LHb and LHAVglut2→VTA projections also showed distinct temporal dynamics (Figures 6 and 7), which is in accordance with LHAVglut2 response heterogeneity (Lazaridis et al., 2019; Rossi et al., 2019). We speculate that the timing of responses within the LHA-LHb-VTA circuitry may be important for guiding reward related behavior.
In contrast to the general similarities between the LHAVglut2 population and the responses of LHb- and VTA-projecting subsets, fasting uniquely affects LHAVglut2→LHb and LHAVglut2→VTA projections. Both populations are more responsive when mice are fasted, and we previously showed that LHAVglut2 neurons are less responsive after feeding (Rossi et al. 2019). Importantly, some LHAVlglut2 neurons exhibit greater sucrose responses when fasted. We speculate that the small proportion of LHAVglut2 neurons projecting to LHb or VTA are among the cells that increased responding after fasting.
Collectively, LHAVglut2 neurons are thought to negatively regulate feeding because food intake is suppressed by bulk LHAVglut2 activation (Jennings et al., 2013; Rossi et al., 2019) and facilitated by inhibition (Jennings et al., 2013). Mice avoid LHAVglut2 stimulation and prefer LHAVglut2 inhibition (Jennings et al., 2013; Lazaridis et al., 2019; Rossi et al., 2019). While activation of either LHAVglut2→LHb (Stamatakis et al., 2016) or LHAVglut2→VTA (de Jong et al., 2019; Nieh et al., 2016) neurons is aversive, their relationship with feeding is less consistent. LHAVglut2→LHb manipulations influence food intake (Stamatakis et al., 2016), but LHAVglut2→VTA manipulations do not (Nieh et al., 2015, 2016). Consistently, LHAVglut2→LHb projections are probably more involved in guiding feeding because 1) they are sensitive to both leptin and ghrelin (i.e., leptin makes these neurons respond as if mice are sated, and ghrelin makes them respond as if mice are fasted), and 2) LHb projectors are more responsive to food rewards when fed. We therefore hypothesize that both LHAVglut2→LHb and LHAVglut2→VTA populations work in concert to orchestrate reward- and aversion-related behavior in general, whereas LHAVglut2→LHb neurons additionally regulate feeding.
Star Methods
Resource Availability
Lead Contact
Further information and requests for resources and reagents should be directed to Garret Stuber (gstuber@uw.edu).
Materials Availability
This study did not generate new unique reagents.
Data and Code Availability
The NCBI Gene Expression Omnibus accession number for the single-cell RNA sequencing data reported in this paper is GSE169176. All code used to analyze the data presented in this paper are available on the Stuber lab Github repository (www.github.com/stuberlab).
Experimental Model and Subject Details
Mice
Adult male and female mice were used for all experiments. Specific breakdown of age/sex are given for each experiment in the corresponding methods description. For single-cell sequencing and HCR experiments, C57BL/6J mice (Jackson Laboratory) were used. For all other experiments, Vglut2-ires-Cre (Jackson Laboratory strain #028863) (Vong et al., 2011) were used. Unless undergoing a fasting experiment, mice were maintained with ad lib. access to food and water. Mice were maintained on a 12 hr light-dark cycle. All experiments were conducted in accordance with the National Institutes of Health Guide for the Care and Use of Laboratory Animals and were approved by the Institutional Animal Care and Use Committee and the University of Washington.
Method Details
Surgery
Mice were anaesthetized with isoflurane (maintained at <1.5%) and were placed in a stereotaxic frame (Kopf Instruments). Ophthalmic ointment was placed on the eyes, and lidocaine (1 mg/kg) was injected s.c. at the incision site. Following surgery, 5 mg/kg carpofen was administered i.p. All viruses were infused through stainless steel injectors at a rate of 100 nL/min. Injectors were left in place for at least 10 minutes following each infusion. The following coordinates were used (in mm relative to Bregma): −1.35 AP, 0.95 ML, −5.15 DV from brain surface for LHA; −3.08-3.10 AP, 0.55 ML, −4.25 DV from brain surface for VTA; and −1.5 AP, 1.2 ML, −3.15 from skull at 15 degrees from vertical for LHb. After surgery, mice were monitored and allowed to recover for at least two weeks prior to experimental manipulations.
Slice electrophysiology
Vglut2-Cre mice (n = 20, 10 male, 10 female, aged 3-4 months at time of surgery) were injected bilaterally with retroAAV-Ef1α-DIO-mCherry and retroAAV-Ef1α-DIO-eYFP in LHb and VTA (viruses counterbalanced between brain regions; 250-300 nL per injection). Approximately 6 weeks later mice were deeply anesthetized with pentobarbital and transcardially perfused with ice-cold sucrose cutting solution containing (in mM): 75 sucrose, 87 NaCl, 1.25 NaH2P04, 7 MgCl2, 0.5 CaCl2, 25 NaHCO3, 301-307 mOsm. Brains were rapidly removed, and coronal sections were taken through the LHA at 300 μm. Sections were incubated in aCSF at 32 °C containing (in mM): 126 NaCl, 2.5 KCl, 1.2 NaH2P04, 1.2 MgCl2, 2.4 CaCl2, 26 NaHCO3, 15 glucose, 303-308 mOsm. Fluorescence was visualized under 40x objective, and cells located in the LHA and expressing either mCherry or eYFP but not both were targeted for patching.
To assess excitability whole-cell current clamp recordings were performed by pulling borosilicate pipettes at 3.5-5.5 MΩ and backfilling with solution containing (in mM): 135potassium gluconate, 4KCl, 10 HEPES, 4ATP, 0.3GTP (pH 7.35, 285mOsm). Spontaneous synaptic input was assessed with whole-cell voltage clamp recordings with Cs-Methanesulfonate internal solution containing (in mM): 117 Cs-Methanesulfonate, 20 HEPES, 0.4 EGTA, 2.8 NaCl, 5 TEA, 5 ATP, and 0.5 GTP (pH 7.35, 285 mOsm). Recordings lasted 2-5 min at −70 mV and +10 mV holding potential for EPSCs and IPSCs, respectively. For fasting experiments, mice were deprived for 24 hr prior to sacrificing. All other methods were identical.
Single-Cell sequencing
C57BL/6J mice (n = 7, 4 male, 3 female, 6-8 weeks old at time of surgery) were injected bilaterally with retroAAV2-hSyn-eYFP in LHb and retroAAV2-CAG-tdTomato in VTA (300-400 μL). Approximately 6 weeks later, one mouse was used for histological analysis. The remaining six mice were deeply anesthetized with sodium pentobarbital and phenytoin sodium and transcardially perfused with 10 mL ice-cold NMDG-aCSF containing 96 mM NMDG, 2.5 mM KCl, 1.35 mM NaH2PO4, 30 mM NaHCO3, 20 mM HEPES, 25 mM glucose, 2 mM thiourea, 5 mM Na+ascorbate, 3 mM Na+pyruvate, 0.6 mM glutathione-ethyl-ester, 2 mM N-acetyl-cysteine, 0.5 mM CaCl2, 10 mM MgSO4; pH 7.35–7.40, 300-305 mOsm. Six 280 μm sections through the LHA were collected in NMDG-aCSF on a vibratome. Sections recovered in NMDG-aCSF containing 500 nM TTX, 10 μM APV, 10 μM DNQX (NMDG-aCSF-R) at room temperature for 40 minutes. After recovery, LHA tissue was isolated with tissue punches and incubated in NMDG-aCSF-R containing 1.0 mg/mL pronase for 50 minutes at room temperature. Following digestion, tissue from all animals was transferred to 1.0 mL NMDG-aCSF-R supplemented with 0.05% BSA (NMDG-aCSF-BSA), pooled, and mechanically dissociated with a patch pipet fire-polished to an internal diameter of 200-300 μm. The suspension was washed in 12 mL NMDG-aCSF-BSA, sedimented at 220 xg for 6 minutes at 18°C. Dead cells and cellular fragments were removed using a MACS® Dead Cell Removal Kit (Miltenyi Biotec, Bergisch Gladbach, Germany) using 100 μL of dead cell removal beads and one MACs LS column following the standard manufacturer protocol. Following the final wash, cells were sedimented at 220 xg for 6 minutes at 4°C and resuspended in PBS containing 0.05% nuclease-free BSA for a final concentration of 700-800 cell/μL.
Single-cell RNA-sequencing was performed using Chromium Single Cell 3’ v3 chemistry (10X Genomics, Pleasanton, CA) following manufacturer recommendations unless otherwise noted. Approximately 16,000-18,000 pooled cells were loaded into an individual well of a Single Cell B Chip, with three wells used in total for three reactions. cDNA amplification and sample indexing were each performed using 11 cycles. Library size distribution and concentrations were determined with an Agilent 4200 Tapestation High Sensitivity D5000 ScreenTape and a Thermo Scientific Qubit dsDNA HS Assay, respectively. Each reaction library was sequenced on an individual lane of an Illumina HiSeq 4000 using 2x150 chemistry following the standard 10X Genomics v3 paired-end configuration by Genewiz, Inc. (South Plainfield, NJ). Between approximately 370-430 million reads were generated per lane with a mean quality score >32 across all lanes.
Demultiplexing was performed with 1 mismatch allowed using Illumina bcl2fastq v2.18.0.12. Initial read processing and generation of digital expression matrices was performed using 10X Genomics Cell Ranger v3.1.0 with 128 GB of memory on 24 cores. Sequences were aligned to a modified mm10 3.0.0 genome assembled with eYFP and tdTomato transgenic sequences. The reference sequences for eYFP and tdTomato were taken from Addgene plasmids #26972 and #59462, respectively and included the entire region from the start codon to the end of the 3’ UTR on the (+) strand (Fig S1G). Coverage was assessed with SAMtools v1.10 (Li et al., 2009).
HCR
C57BL/6J mice (n = 3, 1 male, 2 female, ~5 months old at time of surgery) were injected bilaterally with retroAAV2-hSyn-eYFP in LHb and retroAAV2-CAG-tdTomato in VTA (300-400 μL per injection). Six weeks later, mice were anesthetized and rapidly decapitated. Brains were quickly removed and fresh frozen at −80 °C. Sections through the AP extent of the LHA were cut at 20 μm, mounted on slides, and stored at −80 °C. 6-12 sections were quantified per mouse.
A total of nine genes were targeted in three sequential HCR rounds. The probe sets were as follows: Pax6, Sostdc1, eYFP (Round 1); tdTomato, Slc32a1, Slc17a6 (Round 2); and Nptx2, Pdyn, Pitx2 (Round 3). Sections were processed according to the sequential hybridization chain reaction (HCR) protocol (Molecular Instruments) with modifications noted below. Sections were fixed in 4% PFA at 4°C, dehydrated in serial ethanol washes, and treated with RNAscope Protease IV (ACDBio). Sections were then rinsed and hybridized overnight at 37°C with probes targeting the first gene set. Sections were then washed, and probes were amplified with fluorophores (Alexa 488, 546, and 647) overnight at room temperature. Next, sections were washed, and autofluorescence was quenched using a Vector TrueVIEW Autofluorescence Quenching kit (Vector labs cat# SP-8400). DAPI was applied in the first round only. Slides were coverslipped with VECTASHIELD Vibrance Antifade Mounting Medium and allowed to cure at RT for 2 hours before imaging. After the first two rounds of imaging, coverslips were removed, and sections were washed to remove mounting medium. The probes were then digested with DNase I (Sigma cat# 4716728001), and the next probe set was hybridized. Images were acquired using a Zeiss Axio Imager 2 microscope at 10x magnification.
RNAscope in situ hybridization
Vglut2-Cre mice (n = 5, 1 male, 4 female aged ~6wk at time of surgery) were injected bilaterally with retroAAV-Ef1α-DIO-mCherry in VTA and retroAAV-Ef1α-DIO-eYFP in LHb (400 nL per injection). Six weeks later, mice were anesthetized and rapidly decapitated. Brains were quickly removed and fresh frozen at −80 °C. Sections were cut at 20 μm, mounted on slides, and stored at −80 °C. Sections were fixed in 4% PFA at 4°C, dehydrated in ethanol, and processed with RNAscope (Advanced Cell Diagnostics). Sections were hybridized with the following probes: mCherry (cat. #431201), eYFP (cat. #312131), and either Ghsr (cat. #426141) or Lepr (cat. #402731). Following amplification, sections were counterstained with DAPI. Images were taken throughout the anterior-posterior extent of the LHA with a Zeiss Axio Imager 2 microscope at 10x magnification and fluorescence puncta were quantified via HALO software (Indica Labs). Cells were classified as mCherry- or eYFP-positive if they expressed five or more puncta. To assess overlap in Lepr, Ghsr, and Slc32a1 (Vgat), lateral hypothalamus of wild-type mice (n = 3, 2 male, 1 female, aged ~3 months) were processed as above, but sections were hybridized with Lepr, Ghsr, and Slc32a1 (cat #319191) probes.
In vivo 2p imaging
Vglut2-Cre mice (n = 10, 6 male, 4 female, aged 2-4 months at time of surgery) were injected unilaterally with 400 nL retroAAV-Ef1α-mCherry-IRES-FlpO (Addgene #55634) (Fenno et al., 2014) in either the LHb (n = 5) or VTA (n = 5). AAV8-Ef1α-CreOn/FlpOn-GCaMP6m (Addgene #137119) (Fenno et al., 2020) (400 nL) was then injected into the LHA. Next, a 0.6 mm diameter x 7.3 mm length GRIN lens (Inscopix) was slowly lowered into place above the LHA and affixed with glue. Finally, a head fixation ring was placed on the skull with the lens in the center, and everything was secured in place with dental cement. Mice recovered for 5 weeks before testing began.
Mice were acclimated to head fixation for two daily 15-min sessions prior to conducting the experiments. Generally, imaging sessions occurred in two phases beginning ~5 min after mice were headfixed: a 10-min baseline period in which basal calcium dynamics were monitored while mice remained at rest followed by a session in which tastants (~2 μL/trial) were delivered through a spout positioned directly in front of mouse’s mouth. Licks were recorded via a lickometer, and calcium dynamics were recorded for 25 s (125 frames) around the lick delivery. Rarely, mice failed to lick during this window. These trials were excluded from downstream analyses post hoc.
All experiments were conducted within 4 hr of the start of the dark cycle. For fasted experiments, mice were food restricted for 24 hr prior to testing; for fed experiments, mice had ad lib. access to food for at least 24 hr prior to testing. For sucrose/quinine and water tests, mice were water restricted for 24 hr prior to testing. For most sessions, 20 trials were conducted in which 10% sucrose solution was randomly delivered to each mouse without explicit cues. The exceptions to this were the sucrose/quinine session in which 60 trials were performed (15 trials 1.5 mM quinine, 45 trials 10% sucrose solution, random order) and the water session in which 20 trials of tap water were examined. For pharmacology experiments, mice were injected i.p. with 0.3 mL of either 1.5 mg/kg leptin (Sigma cat. #L3772) dissolved in sterile saline, 1.0 mg/kg ghrelin (Tocris cat. #1465) dissolved in sterile saline, or sterile saline alone (vehicle control) 30 min before imaging began each day (conducted in pseudorandom order with washout days after drug injections).
Imaging was conducted using an Olympus multiphoton microscope equipped with resonant scanners and GaAsP PMTs as described previously (Rossi et al., 2019). Calcium dynamics were imaged through the GRIN lens with a 20x air objective (Olympus, LCPLN20XIR, 0.45 NA, 8.3 mm WD). Two-photon excitation was accomplished using a Mai-Tai Deep See laser system (Spectra Physics) set to 920 nm wavelength. Data were collected at 5 Hz with Olympus FluoView software. Prior to each imaging session, FOVs were manually aligned with projections from the previous day.
Following the conclusion of experiments, mice were perfused with 4% PFA and the heads were post fixed for ~48 hr with lenses still in place before the brains were dissected. After post-fixation, brains were sliced coronally at 40 μm, mounted, and imaged with a Zeiss Axio Imager 2 microscope at 10x magnification to confirm lens placement.
Quantification and Statistical Analysis
Data analysis for slice electrophysiology
Data were processed using Clampfit v11.0.3.03 (Molecular Devices) and analyzed using GraphPad Prism v8.3.0. All tests were two-sided and corrected for multiple comparisons or unequal variance where appropriate. Spontaneous activity was assessed via cell-attached recordings and cells were considered spontaneously active if they fired <10 spikes/min. A greater proportion of LHAVglut2→LHb (30/30) than LHAVglut2→VTA (30/35) cells were spontaneously active (X2=4.64, p=0.03). To test whether electrical properties could be used to decode the projection target, support vector classification was performed using scikit-learn with GridSearch cross validation. Classifications were optimized using linear and rbf kernels with C parameter ranges 10−3, 10−2, 10−1, 100, 101, 102,103 for both and gamma range 10−3, 10−2, 10−1, 100, 101, 102,103 using the following neuron properties: whole cell spike rate, rheobase, spike threshold, spike duration, AHP duration, and total spikes elicited during current step injections.
Data analysis for single-cell mRNA sequencing and clustering
Clustering was performed using Seurat v3.1.2 (Stuart et al., 2019) and custom code in R v3.6.1 unless noted. Cells in which ≤ 1,000 unique genes and ≥ 15 percent mitochondrial reads were detected were removed from analysis. Doublets were removed using DoubletDetection v2.5.4 (Adam Gayoso and Jonathan Shor, 2020) on Python 3.7 run in R v3.6.1 via Reticulate v1.14. The first 50 dimensions were used in the doublet classifier with 100 iterations. A voter threshold of 0.5 and p-value threshold of 1−12 were used in the classification. 34,518 cells were retained for the final analysis with a median of 2,250 unique genes and 4,783 unique transcripts, and a mean of 25,640 reads detected per cell.
Filtered data were transformed using a regularized negative binomial regression via SCTransform (Hafemeister and Satija, 2019; Stuart et al., 2019) with percent mitochondrial reads as a latent variable. Variable genes accounting for 20% of all genes in the dataset were used as input. Samples were integrated using canonical correlation analysis reduction (Butler et al., 2018; Stuart et al., 2019) with all genes used as anchor features. Pearson residuals from the regularized negative binomial regression and integration were calculated for all genes. Principal components were calculated on all genes, and the first 70 components were used as input for UMAP (McInnes et al., 2020) with 40 neighbors, a minimum distance of 0.50, and a spread of 0.40 as parameters. Clustering was performed using the Louvain algorithm with multilevel refinement (Rodriguez and Laio, 2014; Rotta and Noack, 2011) with a K parameter of 15 and a resolution of 0.025 (all cells) or 0.88 (neurons).
Feature discovery was performed on the Pearson residuals from the regularized negative binomial regression using a likelihood-ratio test for single-cell data as implemented in Seurat (Hafemeister and Satija, 2019; Macosko et al., 2015; McDavid et al., 2013). Canonical features were used for cluster cell-type assignment. Definitive cluster markers could not be obtained for two neuronal sub-clusters, and these clusters were removed from downstream analysis. Differential expression between eYFP+ and tdTomato+ cells was assessed using a logistic-regression based likelihood ratio test with Bonferroni corrected p values on log-transformed SCT counts for genes found in at least 5% of eYFP+ or tdTomato+ cells via Seurat.
Prepossessing, alignment, generation of digital expression matrices, SCTransform, sample integration, dimensionality reduction, clustering, and feature discovery were run on a Dell blade-based cluster running Linux RedHat Enterprise 7.7. All other steps were performed on an Apple MacBook Pro running macOS 10.15.3.
Data analysis for HCR
Following the final HCR round, images were registered based on the brightfield images using RNAscope HiPlex Image registration software (ACDBio). Cell segmentation (based on the DAPI image) and fluorescent puncta quantification were performed on the registered images using HALO software (Indica Labs). Data were then imported to a Python workflow in which the number of fluorescent puncta required to be classified as expressing a given gene was adjusted based on visual inspection of the expression patterns in tissue, distribution of puncta per cell, and background levels for all cells uniformly. Puncta filters were as follows: Pax6, 4; Sostdc1, 6; eYFP, 6; Vgat, 5; tdTomato, 4; Vglut2, 5; Nptx2, 10; Pdyn, 2; Pitx2, 6. To determine whether RNA expression data from HCR or single-cell sequencing experiments could be used to classify cells as eYFP+ or tdTomato+, SVM based classification was employed as described above. Classifications were optimized using linear and rbf kernels using filtered HCR count data or SCT adjusted sequencing count data corresponding to expression of Pax6, Sostdc1, Vgat, Vglut2, Nptx2, Pdyn, and Pitx2. To prevent the disparity between the number of eYFP+ and tdTomato+ cells from unevenly influencing the classification accuracy, the cell numbers were equalized by randomly selecting a subset from the larger, tdTomato+ population prior to each classification run. Training was performed on a random 50% subset of data for each of 1,000 runs. To assess how the number of genes influenced decoding accuracy, a random subset of 1-6 genes were removed from the training on each run.
Data analysis for in vivo imaging
Tastant trials were concatenated, and data were motion corrected using a planar hidden Markov model via SIMA (Kaifosh et al., 2014). ROIs were hand drawn and manually tracked across imaging sessions using standard deviation and mean projections. Neuropil contamination was removed using FISSA (Keemink et al., 2018), and signals were extracted for subsequent analysis using custom Python code.
Calcium events were identified and quantified as described previously (Rossi et al., 2019). For tastant trials, motion corrected and neuropil decontaminated fluorescence values were aligned to the first lick after tastant delivery and then normalized to the mean fluorescence value across the 3 s window immediately preceding the first consummatory lick (first lick after tastant delivery). Unless otherwise noted, statistical tests and classification were performed using a 6-s consummatory window beginning at the first lick after the tastant was delivered. To determine whether neurons were significantly responsive to tastant delivery, a paired t-test (p < 0.05) was conducted comparing the mean fluorescence in the 3-s window preceding the first lick after delivery and with the mean fluorescence in the 6-s window following the first lick after delivery for all trials. Because lick patterning after detection of sucrose and quinine was different, a shorter 3-s window was used to directly compare sucrose and quinine trials. Area under the curve (AUC) values were calculated for each neuron using the linear trapezoidal method within the consummatory window.
To assess whether calcium activity was correlated with lick rate, the normalized fluorescence values across the 6-s consummatory window on each trial were compared with the lick rate during the same period with a Pearson correlation. To test whether calcium dynamics of individual neurons could be used to decode the mouse’s satiety state or tastant delivered, support vector classification was performed using scikit-learn with GridSearch cross validation (Otis et al., 2017; Rossi et al., 2019). Classifications were optimized using linear and rbf kernels with C parameter ranges 10−3, 10−2, 10−1, 100, 101, 102,103 for both and gamma range 10−3, 10−2, 10−1, 100, 101, 102,103 using the normalized fluorescence values during the 6-s consummatory window.
Supplementary Material
Key Resources Table
| REAGENT or RESOURCE | SOURCE | IDENTIFIER |
|---|---|---|
| Bacterial and Virus Strains | ||
| AAV8-Ef1α-CreOn/FlpOn-GCaMP6m | Fenno et al., 2020 | Addgene Cat# 137119 |
| retroAAV-Ef1α-mCherry-IRES-FlpO | Fenno et al., 2014; Addgene | Addgene Cat# 55634 |
| retroAAV-Ef1α-DIO-mCherry | Addgene (packaged by UNC Vector Core) | Addgene Cat# 50462 |
| retroAAV-Ef1α-DIO-eYFP | Addgene (packaged by UNC Vector Core) | Addgene Cat# 27056 |
| retroAAV2-HSyn-eYFP | Deisseroth lab (packaged by UNC Vector Core) | UNC vector core (rgAAV-hSyn-eYFP) |
| retroAAV2-CAG-tdTomato | Addgene (packaged by UNC Vector Core) | Addgene Cat# 59462 |
| Chemicals, Peptides, and Recombinant Proteins | ||
| RNAscope Protease IV | ACDBio | Cat# 322336 |
| RNAscope DAPI | ACDBio | Cat# 320858 |
| Vector TrueVIEW Autofluorescence Quenching kit | Vector Labs | Cat# SP-8400 |
| DNase I | Sigma | Cat# 4716728001 |
| Leptin | Sigma | Cat# L3772 |
| Ghrelin | Tocris | Cat# 1465 |
| Critical Commercial Assays | ||
| Sequential HCR in situ hybridization kit | Molecular Instruments | HCR v3.0 Bundle |
| RNAscope Multiplex Reagent Kit | ACDBio | Cat# 320850 |
| Chromium Single Cell 3’ Library & Gel Bead Kit v3 | 10x Genomics | Cat# 1000092 |
| Chromium i7 Multiplex Kit | 10x Genomics | Cat# 120262 |
| Chromium Single Cell B Chip | 10x Genomics | Cat#1000154 |
| Chromium Controller & Accessory Kit | 10x Genomics | Cat# 120223 |
| Dead Cell Removal Kit | Miltenyi Biotec | Cat# 130-090-101 |
| Illumina HiSeq 4000 | Illumina | Cat# N/A |
| Deposited Data | ||
| Raw sequencing data | This paper | GEO: GSE169176 |
| Experimental Models: Organisms/Strains | ||
| Mouse: C57BL/6J | Jackson Laboratory | JAX: 000664; IMSR_JAX: 000664 |
| Mouse: Vglut2-ires-Cre | Vong et al., 2011 | JAX: 028863; IMSR_JAX: 028863 |
| Oligonucleotides | ||
| RNAscope mCherry probe | ACDBio | Cat# 431201 |
| RNAscope eYFP probe | ACDBio | Cat# 312131 |
| RNAscope GHSR probe | ACDBio | Cat# 426141 |
| RNAscope Lepr probe | ACDBio | Cat# 402731 |
| RNAscope Slc32a1 probe | ACDBio | Cat# 319191 |
| HCR Pax6 probe | Molecular Instruments | Accession# NM_001244198.2 |
| HCR Sostdc1 probe | Molecular Instruments | Acession# NM_025312.3 |
| HCR eYFP probe | Molecular Instruments | N/A |
| HCR tdTomato probe | Molecular Instruments | N/A |
| HCR Slc32a1 probe | Molecular Instruments | Acession# NM_009508 |
| HCR Slc17a6 probe | Molecular Instruments | Acession# NM_001286502.1 |
| HCR Nptx2 probe | Molecular Instruments | Acession# NM_016789.3 |
| HCR Pdyn probe | Molecular Instruments | Acession# NM_011098.4 |
| HCR Pitx2 probe | Molecular Instruments | Acession# NM_011098.4 |
| Software and Algorithms | ||
| RNAscope HiPlex Image registration software | ACDBio | Cat# 300065 |
| ImageJ (FIJI) | Imagej.nih.gov | Imagej.net ; RRID: SCR_002285 |
| R | N/A | r-project.org ; RRID: SCR_001905 |
| Seurat v3.1.2 | Stuart et al., 2019 | Satijalab.org ; RRID: SCR_016341 |
| DoubletDetection v2.5.4 | Gayoso et al., 2020 | Github.com/JonathanShor/DoubletDetection; RRID: N/A |
| bcl2fastq v2.18.0.12 | Illumina | Illumina.com; RRID: SCR_015058 |
| Cell Ranger v3.1.0 | 10x Genomics | 10xGenomics.com; RRID: SCR_017344 |
| SAMtools v1.10 | Li et al., 2009 | Htslib.org; RRID: SCR_002105 |
| pClamp v11.0.3 | Molecular Devices | Moleculardevices.com ; RRID: SCR_011323 |
| GraphPad Prism v9.0.0 | GraphPad Software | Graphpad.com ; RRID: SCR_002798 |
| Python v2.7 | N/A | Python.org ; RRID: SCR_008394 |
| SIMA v1.3.2 | Kaifosh et al., 2013 | Losonczylab.org |
| FISSA v0.7.2 | Keemink et al., 2018 | Github.com/Rochefort-lab/fissa |
| Scipy v1.2.1 | SciPy.org | SciPy.org ; RRID: SCR_008058 |
| Scikit-learn v0.20.3 | Pedregosa et al., 2011 | Scikit-learn.org; RRID: SCR_019053 |
| HALO | Indica Labs | Indicalab.com ; RRID: SCR_018350 |
Acknowledgements
We thank the Stuber lab for critical comments and Aditi Kumar for help with histology. This work was supported by Brain and Behavior Research Foundation NARSAD Young Investigator Awards (M.A.R and K.H.), the National Institutes of Health DK121883 (M.A.R.), NS007431 (M.L.B.), DA032750 and DA038168 (G.D.S.) and P30DA048736.
Footnotes
Declaration of Interests
The authors declare no competing interests.
References
- Abizaid A, Liu Z-W, Andrews ZB, Shanabrough M, Borok E, Elsworth JD, Roth RH, Sleeman MW, Picciotto MR, Tschöp MH, et al. (2006). Ghrelin modulates the activity and synaptic input organization of midbrain dopamine neurons while promoting appetite. J Clin Invest 116, 3229–3239. [DOI] [PMC free article] [PubMed] [Google Scholar]
- Abrahamsen GC, Berman Y, and Carr KD (1995). Curve-shift analysis of self-stimulation in food-restricted rats: relationship between daily meal, plasma corticosterone and reward sensitization. Brain Research 695, 186–194. [DOI] [PubMed] [Google Scholar]
- Anand BK, and Brobeck JR (1951). Hypothalamic Control of Food Intake in Rats and Cats. Yale J Biol Med 24, 123–140. [PMC free article] [PubMed] [Google Scholar]
- de Araujo IE, Gutierrez R, Oliveira-Maia AJ, Pereira A, Nicolelis MAL, and Simon SA (2006). Neural Ensemble Coding of Satiety States. Neuron 51, 483–494. [DOI] [PubMed] [Google Scholar]
- Bagnasco M, Kalra PS, and Kalra SP (2002). Ghrelin and Leptin Pulse Discharge in Fed and Fasted Rats. Endocrinology 143, 726–729. [DOI] [PubMed] [Google Scholar]
- Baimel C, Lau BK, Qiao M, and Borgland SL (2017). Projection-Target-Defined Effects of Orexin and Dynorphin on VTA Dopamine Neurons. Cell Reports 18, 1346–1355. [DOI] [PubMed] [Google Scholar]
- Barrachina MD, Martínez V, Wang L, Wei JY, and Taché Y (1997). Synergistic interaction between leptin and cholecystokinin to reduce short-term food intake in lean mice. PNAS 94, 10455–10460. [DOI] [PMC free article] [PubMed] [Google Scholar]
- Berthoud H-R, and Münzberg H (2011). The lateral hypothalamus as integrator of metabolic and environmental needs: From electrical self-stimulation to opto-genetics. Physiology & Behavior 104, 29–39. [DOI] [PMC free article] [PubMed] [Google Scholar]
- Borgland SL, Storm E, and Bonci A (2008). Orexin B/hypocretin 2 increases glutamatergic transmission to ventral tegmental area neurons. European Journal of Neuroscience 28, 1545–1556. [DOI] [PubMed] [Google Scholar]
- von Buchholtz LJ, Ghitani N, Lam RM, Licholai JA, Chesler AT, and Ryba NJP (2021). Decoding Cellular Mechanisms for Mechanosensory Discrimination. Neuron 109, 285–298.e5. [DOI] [PMC free article] [PubMed] [Google Scholar]
- Burton MJ, Rolls ET, and Mora F (1976). Effects of hunger on the responses of neurons in the lateral hypothalamus to the sight and taste of food. Experimental Neurology 51, 668–677. [DOI] [PubMed] [Google Scholar]
- Butler A, Hoffman P, Smibert P, Papalexi E, and Satija R (2018). Integrating single-cell transcriptomic data across different conditions, technologies, and species. Nature Biotechnology 36, 411–420. [DOI] [PMC free article] [PubMed] [Google Scholar]
- Choi HMT, Schwarzkopf M, Fornace ME, Acharya A, Artavanis G, Stegmaier J, Cunha A, and Pierce NA (2018). Third-generation in situ hybridization chain reaction: multiplexed, quantitative, sensitive, versatile, robust. Development 145. [DOI] [PMC free article] [PubMed] [Google Scholar]
- Cone JJ, McCutcheon JE, and Roitman MF (2014). Ghrelin Acts as an Interface between Physiological State and Phasic Dopamine Signaling. J. Neurosci 34, 4905–4913. [DOI] [PMC free article] [PubMed] [Google Scholar]
- Di Marzo V, Goparaju SK, Wang L, Liu J, Bátkai S, Járai Z, Fezza F, Miura GI, Palmiter RD, Sugiura T, et al. (2001). Leptin-regulated endocannabinoids are involved in maintaining food intake. Nature 410, 822–825. [DOI] [PubMed] [Google Scholar]
- Domingos AI, Vaynshteyn J, Voss HU, Ren X, Gradinaru V, Zang F, Deisseroth K, de Araujo IE, and Friedman J (2011). Leptin regulates the reward value of nutrient. Nature Neuroscience 14, 1562–1568. [DOI] [PMC free article] [PubMed] [Google Scholar]
- Fadel J, and Deutch AY (2002). Anatomical substrates of orexin–dopamine interactions: lateral hypothalamic projections to the ventral tegmental area. Neuroscience 111, 379–387. [DOI] [PubMed] [Google Scholar]
- Fenno LE, Mattis J, Ramakrishnan C, Hyun M, Lee SY, He M, Tucciarone J, Selimbeyoglu A, Berndt A, Grosenick L, et al. (2014). Targeting cells with single vectors using multiple-feature Boolean logic. Nat Methods 11, 763–772. [DOI] [PMC free article] [PubMed] [Google Scholar]
- Fenno LE, Ramakrishnan C, Kim YS, Evans KE, Lo M, Vesuna S, Inoue M, Cheung KYM, Yuen E, Pichamoorthy N, et al. (2020). Comprehensive Dual- and Triple-Feature Intersectional Single-Vector Delivery of Diverse Functional Payloads to Cells of Behaving Mammals. Neuron 107, 836–853. [DOI] [PMC free article] [PubMed] [Google Scholar]
- Fulton S, Pissios P, Manchon RP, Stiles L, Frank L, Pothos EN, Maratos-Flier E, and Flier JS (2006). Leptin Regulation of the Mesoaccumbens Dopamine Pathway. Neuron 51, 811–822. [DOI] [PubMed] [Google Scholar]
- Gayoso Adam, Shor Jonathan, Carr Ambrose J., Sharma Roshan, Pe’er Dana (2020, December 18). DoubletDetection (Version v3.0). Zenodo. 10.5281/zenodo.2678041 [DOI] [Google Scholar]
- González JA, lordanidou P, Strom M, Adamantidis A, and Burdakov D (2016). Awake dynamics and brain-wide direct inputs of hypothalamic MCH and orexin networks. Nature Communications 7, 11395. [DOI] [PMC free article] [PubMed] [Google Scholar]
- Hafemeister C, and Satija R (2019). Normalization and variance stabilization of single-cell RNA-seq data using regularized negative binomial regression. Genome Biol 20, 296. [DOI] [PMC free article] [PubMed] [Google Scholar]
- Harris GC, and Aston-Jones G (2006). Arousal and reward: a dichotomy in orexin function. Trends in Neurosciences 29, 571–577. [DOI] [PubMed] [Google Scholar]
- Harris GC, Wimmer M, and Aston-Jones G (2005). A role for lateral hypothalamic orexin neurons in reward seeking. Nature 437, 556–559. [DOI] [PubMed] [Google Scholar]
- Hashikawa Y, Hashikawa K, Rossi MA, Basiri ML, Liu Y, Johnston NL, Ahmad OR, and Stuber GD (2020). Transcriptional and Spatial Resolution of Cell Types in the Mammalian Habenula. Neuron 106, 743–758.e5. [DOI] [PMC free article] [PubMed] [Google Scholar]
- Hoebel BG, and Teitelbaum P (1962). Hypothalamic Control of Feeding and Self-Stimulation. Science 135, 375–377. [DOI] [PubMed] [Google Scholar]
- Iyer M, Essner RA, Klingenberg B, and Carter ME (2018). Identification of discrete, intermingled hypocretin neuronal populations. Journal of Comparative Neurology 526, 2937–2954. [DOI] [PMC free article] [PubMed] [Google Scholar]
- Jackson KL, Dayton RD, Deverman BE, and Klein RL (2016). Better Targeting, Better Efficiency for Wide-Scale Neuronal Transduction with the Synapsin Promoter and AAV-PHP.B. Front. Mol. Neurosci 9. [DOI] [PMC free article] [PubMed] [Google Scholar]
- Jennings JH, Rizzi G, Stamatakis AM, Ung RL, and Stuber GD (2013). The Inhibitory Circuit Architecture of the Lateral Hypothalamus Orchestrates Feeding. Science 341, 1517–1521. [DOI] [PMC free article] [PubMed] [Google Scholar]
- Jennings JH, Ung RL, Resendez SL, Stamatakis AM, Taylor JG, Huang J, Veleta K, Kantak PA, Aita M, Shilling-Scrivo K, et al. (2015). Visualizing Hypothalamic Network Dynamics for Appetitive and Consummatory Behaviors. Cell 160, 516–527. [DOI] [PMC free article] [PubMed] [Google Scholar]
- Jensen T, Kiersgaard M, Sørensen D, and Mikkelsen L (2013). Fasting of mice: a review. Lab Anim 47, 225–240. [DOI] [PubMed] [Google Scholar]
- de Jong JW, Afjei SA, Pollak Dorocic I, Peck JR, Liu C, Kim CK, Tian L, Deisseroth K, and Lammel S (2019). A Neural Circuit Mechanism for Encoding Aversive Stimuli in the Mesolimbic Dopamine System. Neuron 101, 133–151.e7. [DOI] [PMC free article] [PubMed] [Google Scholar]
- Kaifosh P, Zaremba JD, Danielson NB, and Losonczy A (2014). SIMA: Python software for analysis of dynamic fluorescence imaging data. Front. Neuroinform 8. [DOI] [PMC free article] [PubMed] [Google Scholar]
- Keemink SW, Lowe SC, Pakan JMP, Dylda E, van Rossum MCW, and Rochefort NL (2018). FISSA: A neuropil decontamination toolbox for calcium imaging signals. Scientific Reports 8, 3493. [DOI] [PMC free article] [PubMed] [Google Scholar]
- Korotkova TM, Sergeeva OA, Eriksson KS, Haas HL, and Brown RE (2003). Excitation of Ventral Tegmental Area Dopaminergic and Nondopaminergic Neurons by Orexins/Hypocretins. J. Neurosci 23, 7–11. [DOI] [PMC free article] [PubMed] [Google Scholar]
- Lammel S, Lim BK, Ran C, Huang KW, Betley MJ, Tye KM, Deisseroth K, and Malenka RC (2012). Input-specific control of reward and aversion in the ventral tegmental area. Nature 491, 212–217. [DOI] [PMC free article] [PubMed] [Google Scholar]
- Lazaridis I, Tzortzi O, Weglage M, Märtin A, Xuan Y, Parent M, Johansson Y, Fuzik J, Fürth D, Fenno LE, et al. (2019). A hypothalamus-habenula circuit controls aversion. Molecular Psychiatry 24, 1351–1368. [DOI] [PMC free article] [PubMed] [Google Scholar]
- de Lecea L, Kilduff TS, Peyron C, Gao X-B, Foye PE, Danielson PE, Fukuhara C, Battenberg ELF, Gautvik VT, Bartlett FS, et al. (1998). The hypocretins: Hypothalamus-specific peptides with neuroexcitatory activity. Proceedings of the National Academy of Sciences 95, 322–327. [DOI] [PMC free article] [PubMed] [Google Scholar]
- Leinninger GM, Jo Y-H, Leshan RL, Louis GW, Yang H, Barrera JG, Wilson H, Opland DM, Faouzi MA, Gong Y, et al. (2009). Leptin Acts via Leptin Receptor-Expressing Lateral Hypothalamic Neurons to Modulate the Mesolimbic Dopamine System and Suppress Feeding. Cell Metabolism 10, 89–98. [DOI] [PMC free article] [PubMed] [Google Scholar]
- Li H, Handsaker B, Wysoker A, Fennell T, Ruan J, Homer N, Marth G, Abecasis G, Durbin R, and 1000 Genome Project Data Processing Subgroup (2009). The Sequence Alignment/Map format and SAMtools. Bioinformatics 25, 2078–2079. [DOI] [PMC free article] [PubMed] [Google Scholar]
- Li Y, Gao X-B, Sakurai T, and van den Pol AN (2002). Hypocretin/Orexin Excites Hypocretin Neurons via a Local Glutamate Neuron—A Potential Mechanism for Orchestrating the Hypothalamic Arousal System. Neuron 36, 1169–1181. [DOI] [PubMed] [Google Scholar]
- Liu J-J, Bello NT, and Pang ZP (2017). Presynaptic Regulation of Leptin in a Defined Lateral Hypothalamus–Ventral Tegmental Area Neurocircuitry Depends on Energy State. J. Neurosci 37, 11854–11866. [DOI] [PMC free article] [PubMed] [Google Scholar]
- López-Ferreras L, Richard JE, Anderberg RH, Nilsson FH, Olandersson K, Kanoski SE, and Skibicka KP (2017). Ghrelin’s control of food reward and body weight in the lateral hypothalamic area is sexually dimorphic. Physiology & Behavior 176, 40–49. [DOI] [PMC free article] [PubMed] [Google Scholar]
- Macosko EZ, Basu A, Satija R, Nemesh J, Shekhar K, Goldman M, Tirosh I, Bialas AR, Kamitaki N, Martersteck EM, et al. (2015). Highly Parallel Genome-wide Expression Profiling of Individual Cells Using Nanoliter Droplets. Cell 161, 1202–1214. [DOI] [PMC free article] [PubMed] [Google Scholar]
- Margules DL, and Olds J (1962). Identical “Feeding” and “Rewarding” Systems in the Lateral Hypothalamus of Rats. Science 135, 374–375. [DOI] [PubMed] [Google Scholar]
- McDavid A, Finak G, Chattopadyay PK, Dominguez M, Lamoreaux L, Ma SS, Roederer M, and Gottardo R (2013). Data exploration, quality control and testing in single-cell qPCR-based gene expression experiments. Bioinformatics 29, 461–467. [DOI] [PMC free article] [PubMed] [Google Scholar]
- McInnes L, Healy J, and Melville J (2020). UMAP: Uniform Manifold Approximation and Projection for Dimension Reduction. ArXiv:1802.03426 [Cs, Stat]. [Google Scholar]
- Mickelsen LE, Kolling FW, Chimileski BR, Fujita A, Norris C, Chen K, Nelson CE, and Jackson AC (2017). Neurochemical Heterogeneity Among Lateral Hypothalamic Hypocretin/Orexin and Melanin-Concentrating Hormone Neurons Identified Through Single-Cell Gene Expression Analysis. ENeuro 4. [DOI] [PMC free article] [PubMed] [Google Scholar]
- Mickelsen LE, Bolisetty M, Chimileski BR, Fujita A, Beltrami EJ, Costanzo JT, Naparstek JR, Robson P, and Jackson AC (2019). Single-cell transcriptomic analysis of the lateral hypothalamic area reveals molecularly distinct populations of inhibitory and excitatory neurons. Nat Neurosci 22, 642–656. [DOI] [PMC free article] [PubMed] [Google Scholar]
- Nakamura T, Uramura K, Nambu T, Yada T, Goto K, Yanagisawa M, and Sakurai T (2000). Orexin-induced hyperlocomotion and stereotypy are mediated by the dopaminergic system11Published on the World Wide Web on 27 June 2000. Brain Research 873, 181–187. [DOI] [PubMed] [Google Scholar]
- Nieh EH, Matthews GA, Allsop SA, Presbrey KN, Leppla CA, Wichmann R, Neve R, Wildes CP, and Tye KM (2015). Decoding Neural Circuits that Control Compulsive Sucrose Seeking. Cell 160, 528–541. [DOI] [PMC free article] [PubMed] [Google Scholar]
- Nieh EH, Vander Weele CM, Matthews GA, Presbrey KN, Wichmann R, Leppla CA, Izadmehr EM, and Tye KM (2016). Inhibitory Input from the Lateral Hypothalamus to the Ventral Tegmental Area Disinhibits Dopamine Neurons and Promotes Behavioral Activation. Neuron 90, 1286–1298. [DOI] [PMC free article] [PubMed] [Google Scholar]
- Olszewski PK, Li D, Grace MK, Billington CJ, Kotz CM, and Levine AS (2003). Neural basis of orexigenic effects of ghrelin acting within lateral hypothalamus. Peptides 24, 597–602. [DOI] [PubMed] [Google Scholar]
- Otis JM, Namboodiri VMK, Matan AM, Voets ES, Mohorn EP, Kosyk O, McHenry JA, Robinson JE, Resendez SL, Rossi MA, et al. (2017). Prefrontal cortex output circuits guide reward seeking through divergent cue encoding. Nature 543, 103–107. [DOI] [PMC free article] [PubMed] [Google Scholar]
- Peyron C, Tighe DK, Pol A.N. van den, Lecea L. de, Heller HC, Sutcliffe JG, and Kilduff TS (1998). Neurons Containing Hypocretin (Orexin) Project to Multiple Neuronal Systems. J. Neurosci 18, 9996–10015. [DOI] [PMC free article] [PubMed] [Google Scholar]
- Powell SK, Rivera-Soto R, and Gray SJ (2015). Viral Expression Cassette Elements to Enhance Transgene Target Specificity and Expression in Gene Therapy. Discov Med 19, 49–57. [PMC free article] [PubMed] [Google Scholar]
- Rodriguez A, and Laio A (2014). Clustering by fast search and find of density peaks. Science 344, 1492–1496. [DOI] [PubMed] [Google Scholar]
- Romanov RA, Zeisel A, Bakker J, Girach F, Hellysaz A, Tomer R, Alpár A, Mulder J, Clotman F, Keimpema E, et al. (2017). Molecular interrogation of hypothalamic organization reveals distinct dopamine neuronal subtypes. Nature Neuroscience 20, 176–188. [DOI] [PMC free article] [PubMed] [Google Scholar]
- Rosin DL, Weston MC, Sevigny CP, Stornetta RL, and Guyenet PG (2003). Hypothalamic orexin (hypocretin) neurons express vesicular glutamate transporters VGLUT1 or VGLUT2. Journal of Comparative Neurology 465, 593–603. [DOI] [PubMed] [Google Scholar]
- Rossi MA, and Stuber GD (2018). Overlapping Brain Circuits for Homeostatic and Hedonic Feeding. Cell Metabolism 27, 42–56. [DOI] [PMC free article] [PubMed] [Google Scholar]
- Rossi MA, Basiri ML, McHenry JA, Kosyk O, Otis JM, van den Munkhof HE, Bryois J, Hübel C, Breen G, Guo W, et al. (2019). Obesity remodels activity and transcriptional state of a lateral hypothalamic brake on feeding. Science 364, 1271–1274. [DOI] [PMC free article] [PubMed] [Google Scholar]
- Rotta R, and Noack A (2011). Multilevel local search algorithms for modularity clustering. ACM J. Exp. Algorithmics 16, 2.3:2.1–2.3:2.27. [Google Scholar]
- Schiffino FL, Siemian JN, Petrella M, Laing BT, Sarsfield S, Borja CB, Gajendiran A, Zuccoli ML, and Aponte Y (2019). Activation of a lateral hypothalamic-ventral tegmental circuit gates motivation. PLOS ONE 14, e0219522. [DOI] [PMC free article] [PubMed] [Google Scholar]
- Stamatakis AM, Van Swieten M, Basiri ML, Blair GA, Kantak P, and Stuber GD (2016). Lateral Hypothalamic Area Glutamatergic Neurons and Their Projections to the Lateral Habenula Regulate Feeding and Reward. Journal of Neuroscience 36, 302–311. [DOI] [PMC free article] [PubMed] [Google Scholar]
- Stuart T, Butler A, Hoffman P, Hafemeister C, Papalexi E, Mauck WM, Hao Y, Stoeckius M, Smibert P, and Satija R (2019). Comprehensive Integration of Single-Cell Data. Cell 177, 1888–1902.e21. [DOI] [PMC free article] [PubMed] [Google Scholar]
- Stuber GD, and Wise RA (2016). Lateral hypothalamic circuits for feeding and reward. Nature Neuroscience 19, 198–205. [DOI] [PMC free article] [PubMed] [Google Scholar]
- Teegala SB, Sheng Z, Dalal MS, Hirschberg PR, Beck KD, and Routh VH (2020). Lateral hypothalamic orexin glucose-inhibited neurons may regulate reward-based feeding by modulating glutamate transmission in the ventral tegmental area. Brain Research 1731, 145808. [DOI] [PMC free article] [PubMed] [Google Scholar]
- Trusel M, Nuno-Perez A, Lecca S, Harada H, Lalive AL, Congiu M, Takemoto K, Takahashi T, Ferraguti F, and Mameli M (2019). Punishment-Predictive Cues Guide Avoidance through Potentiation of Hypothalamus-to-Habenula Synapses. Neuron 102, 120–127.e4. [DOI] [PubMed] [Google Scholar]
- Vong L, Ye C, Yang Z, Choi B, Chua S, and Lowell BB (2011). Leptin Action on GABAergic Neurons Prevents Obesity and Reduces Inhibitory Tone to POMC Neurons. Neuron 71, 142–154. [DOI] [PMC free article] [PubMed] [Google Scholar]
- Wang Q, Liu C, Uchida A, Chuang J-C, Walker A, Liu T, Osborne-Lawrence S, Mason BL, Mosher C, Berglund ED, et al. (2014). Arcuate AgRP neurons mediate orexigenic and glucoregulatory actions of ghrelin. Molecular Metabolism 3, 64–72. [DOI] [PMC free article] [PubMed] [Google Scholar]
- Wang Y, Eddison M, Fleishman G, Weigert M, Xu S, Henry FE, Wang T, Lemire AL, Schmidt U, Yang H, et al. (2021). Expansion-Assisted Iterative-FISH defines lateral hypothalamus spatio-molecular organization. BioRxiv 2021.03.08.434304. [DOI] [PubMed] [Google Scholar]
- Woodworth HL, Brown JA, Batchelor HM, Bugescu R, and Leinninger GM (2018). Determination of neurotensin projections to the ventral tegmental area in mice. Neuropeptides 68, 57–74. [DOI] [PMC free article] [PubMed] [Google Scholar]
- Wren AM, Small CJ, Ward HL, Murphy KG, Dakin CL, Taheri S, Kennedy AR, Roberts GH, Morgan DGA, Ghatei MA, et al. (2000). The Novel Hypothalamic Peptide Ghrelin Stimulates Food Intake and Growth Hormone Secretion. Endocrinology 141, 4325–4328. [DOI] [PubMed] [Google Scholar]
- Wren AM, Small CJ, Abbott CR, Dhillo WS, Seal LJ, Cohen MA, Batterham RL, Taheri S, Stanley SA, Ghatei MA, et al. (2001). Ghrelin Causes Hyperphagia and Obesity in Rats. Diabetes 50, 2540–2547. [DOI] [PubMed] [Google Scholar]
- Yamanaka A, Beuckmann CT, Willie JT, Hara J, Tsujino N, Mieda M, Tominaga M, Yagami K, Sugiyama F, Goto K, et al. (2003). Hypothalamic Orexin Neurons Regulate Arousal According to Energy Balance in Mice. Neuron 38, 701–713. [DOI] [PubMed] [Google Scholar]
- van Zessen R, van der Plasse G, and Adan R. a. H. (2012). Contribution of the mesolimbic dopamine system in mediating the effects of leptin and ghrelin on feeding. Proceedings of the Nutrition Society 71, 435–445. [DOI] [PubMed] [Google Scholar]
Associated Data
This section collects any data citations, data availability statements, or supplementary materials included in this article.
Supplementary Materials
Data Availability Statement
The NCBI Gene Expression Omnibus accession number for the single-cell RNA sequencing data reported in this paper is GSE169176. All code used to analyze the data presented in this paper are available on the Stuber lab Github repository (www.github.com/stuberlab).