

Abstract
Introduction
A few studies have identified childhood animal exposure as associated with adiposity, but results are inconsistent and differ in timing.
Methods:
We conducted an observational cohort study of children ages 4–8 in the Environmental Influences on Child Health Outcomes [ECHO] study. The main exposure was having a dog in the home and/or regular contact with farm animals during the first year of life. Outcomes of interest were child BMI percentile (adjusted for gender and age) categorized as normal/underweight (<85th percentile), overweight (85th to <95th), and obese (≥95th), and percent fat mass (continuous). Associations were analyzed using multinomial logistic regression and multivariable linear regression, respectively, with and without multiple imputation.
Results:
First year animal exposure occurred in 245 of 770 (31.8%) children. Children with early animal exposure had 0.53 (95% CI: 0.28, 0.997) times the odds of being in the obese BMI category compared to those exposed to animals after controlling for covariates: maternal pre-pregnancy BMI, race/ethnicity, reported child activity level, receiving food assistance, age child began daycare (<1 year vs 1+), exclusively breastfed x6 months, and NICU admission (n=721). Children with early animal exposure had, on average, 1.5% (95% CI: −3.0, −0.1) less fat mass than exposed children after adjustment for maternal BMI, race/ethnicity, activity, food assistance, breastfeeding, and maternal education (n=548). Multiple imputation did not alter either result.
Conclusion:
These results provide evidence that exposure to dogs or farm animals in the first year of life is associated with lower odds of obesity and lower percent fat mass in childhood.
Keywords: Obesity, Child, Dogs, African Americans, Asian Americans, Hispanic Americans
INTRODUCTION
Childhood overweight and obesity has become a national health problem in the United States, with approximately 16.5% of children ages 2 to 19 overweight and another 18.5% obese.1 High body mass index (BMI) in childhood has immediate and long term ill effects.2 A myriad of factors has been associated with childhood BMI, including early animal exposure. Studies have found prenatal and/or early childhood exposure to animals may be associated with lower risks of obesity, as well as asthma, allergies, sub-clinical atherosclerosis, attention deficit hyperactivity disorder, and schizophrenia.3–9 A possible mechanism behind these findings is the ‘Microflora Hypothesis’, which postulates that a diversity of favorable microbiota in the gut decreases certain chronic diseases.10 Studies investigating the relationship between animal exposure and childhood BMI are few, without a consensus on the timing and type of animal exposure that may affect childhood BMI, and with some finding no association.11,12
The objective of these analyses is to examine the association between early animal exposure and later adiposity. The first hypothesis is that regular exposure to dogs or farm animals during the first year of life is associated with decreased odds of high BMI. However, BMI may not be the best way to determine adiposity, especially under age nine.13 For any BMI, a child’s proportions of fat and fat-free mass may differ dramatically, with adiposity more strongly related to chronic conditions than BMI. Therefore, the second hypothesis is that early exposure to these animals is associated with a decreased percentage of fat mass in childhood.
METHODS
COHORT
The current study uses participants enrolled in the Eunice Kennedy Shriver National Institute of Child Health and Human Development Fetal Growth Studies - Singletons cohort. The study enrolled 2802 women ages 18 to 40 at 12 U.S. sites (2009–2013) between gestational weeks 8–13.14 Initially, enrollment was restricted to women without preexisting chronic diseases, medical conditions, or obesity (n=2334),15 with an added supplemental cohort of obese women (n=468).16
The Environmental Influences on Child Health Outcomes (ECHO) consisted of 1116 mother-child pairs recruited from 2017 to 2019 who participated in the NICHD Fetal Growth Studies. Children were ages four to eight, from ten of the original sites (Figure 1). The enrollment rate was 44.5% (1116/2373). Of the 1116 pairs, 831 children attended an in-person visit with height and weight measured. Written informed consent was obtained from the parent or legal guardian along with child assent depending on child age and state regulations. The study was approved by the Medical University of South Carolina Institutional Review Board (IRB; Pro00070764 & Pro00058961) and a Central IRB at Columbia University Medical Center (AAAR5769).
Figure 1. ECHO cohort flow chart, United States, 2017–2019, ages 4 to 8.
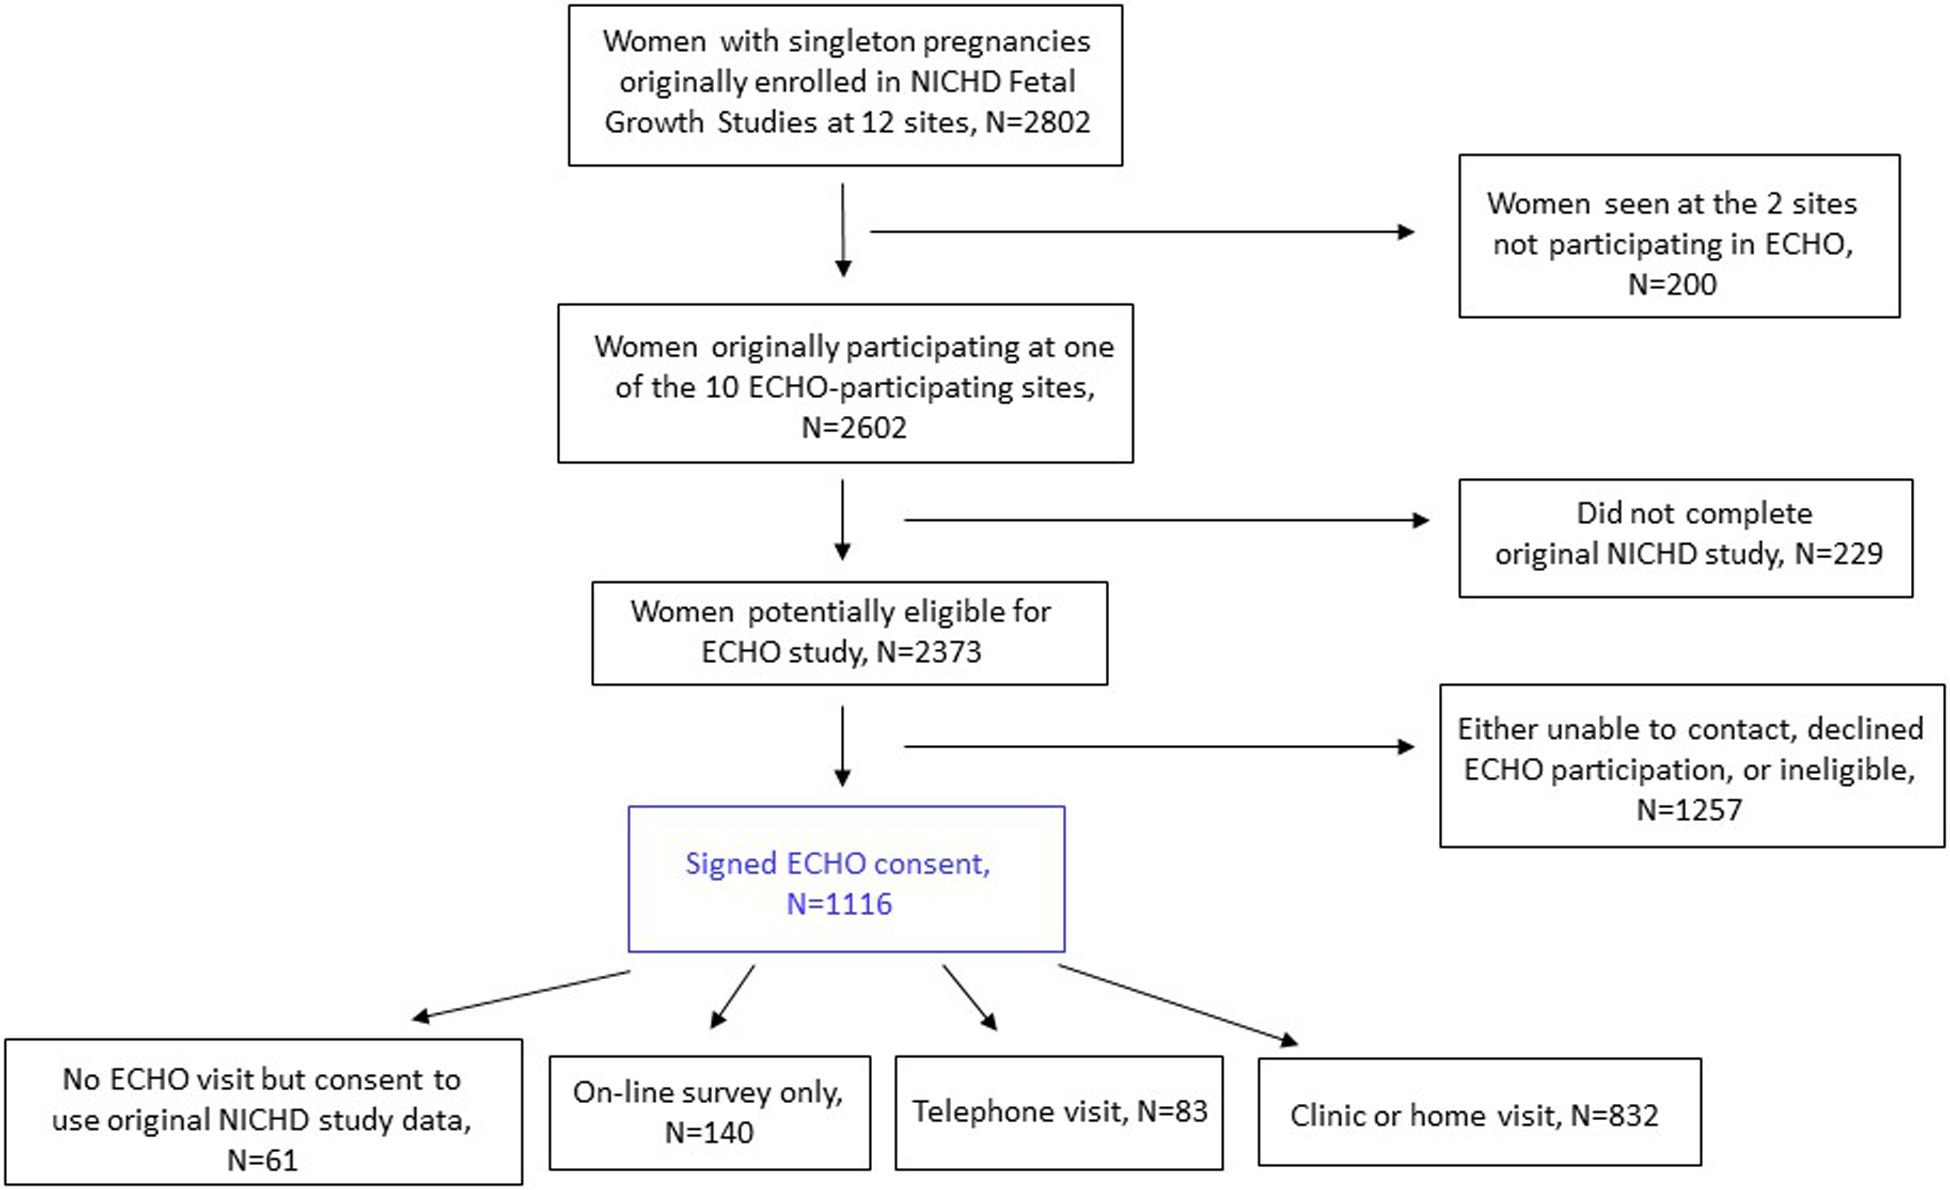
Note: 832 children had in-person visits, but one did not have their weight measured, so n=831 have BMI.
DATA COLLECTION
The decision to choose exposure to dogs or farm animals during the first year of life as the animal exposure for these analyses was based a priori on the scientific literature. Exposure to animals was defined as a ‘yes’ response to either ‘Did you have a dog in your home during the first year of your child’s life?’ or ‘In your child’s first year of life did he/she have regular (at least once a week) contact with farm animals (e.g., cattle, pigs, goats, sheep or poultry)?’, and ‘no’ if responses were negative. Three additional animal-related items were examined: whether there was a cat in the home during the child’s first year, and separately, whether a cat or dog was in the home in the twelve months prior to their study visit.
Children’s BMI percentile was based on the mean of repeated measures of height and weight. BMI percentile was calculated using the Center for Disease Control and Prevention (CDC) standard,17 and categorized as normal/underweight (<85th percentile), overweight (85th to <95th percentile), or obese (≥95th percentile). Twenty-five (3%) of the children were underweight (<5th BMI percentile). The second outcome, children’s percent fat mass, was measured via bioelectrical impedance (BIA), performed using an RJL Systems (rjlsystems.com) Quantum V portable device, and assessed as a continuous variable.
Demographic covariates included child age, gender, parent-reported race/ethnicity of child as a social construct (NHB, NHW, Hispanic, Asian), maternal education (high school or less, some college or more), and food assistance as a proxy for socioeconomic status (SES; ever received WIC, SNAP and/or free school meals, never).
Other variables included mother’s pre-pregnancy BMI (continuous, based on maternal report at the time of prenatal enrollment), parity (0, 1+), delivery mode (vaginal, C-section), admission to a neonatal intensive care unit (NICU) after birth (yes, no), whether child ever received breastmilk (yes, no), whether child was exclusively fed breast milk for ≥ 6 months (yes, no), antibiotic prescriptions in childhood (none, 1–2, 3–4, 5+), age child began daycare or school (prior to 1 year, ≥1 year), and child activity level. Child activity level was based on parent response to four items from the Preschool-aged Children’s Physical Activity Questionnaire18 which queried activity level and play motivation. Responses were averaged and dichotomized as higher activity or lower activity.
ANALYSES-CHILD’S BMI PERCENTILE
All analyses were done with SAS 9.4 (SAS Institute Inc., Cary, NC, USA, 2002–2012), with statistical significance at p<0.05. Independent variables were compared by child’s BMI percentile categories using Chi-square (or Fisher’s exact) and Kruskal-Wallis. Logistic regression was used to assess the individual association of each independent variable with the three BMI categories treated as nominal outcomes, with normal category as the reference. Variables associated with the outcome at a p-value ≤0.25 were entered into a multinomial logistic regression model. Non-significant covariates were removed individually, and the model rerun iteratively, assessing model fit and effects on other variables until reaching a final model (Model 1). Interaction between all covariates and early animal exposure, as well as between race/ethnicity and SES, were tested with none showing significance. The final model was run again using multiple imputation (MI) to account for missing data (Model 1a). Patterns of missing data appeared to be arbitrary and missing at random. PROC MI and PROC MIANALYZE were used for MI, with the fully conditional method (FCS), 25 imputations, and 20 burn-in iterations.
ANALYSES-CHILD’S PERCENT FAT MASS
Missing BIA measurements were due to issues such as technical problems with the machine, not able to remove metal jewelry, child unable to stay still, refusal due to fear, or incomplete visit. Multivariable linear regression models were run as reported for child’s BMI percentile (Model 2). None of the covariates had a significant interaction with early animal exposure. The final model was run using MI to account for missing data (Model 2a). PROC MI and PROC MIANALYZE were used for MI, with the FCS method, 100 imputations, and 30 burn-in iterations. Regression results are reported in terms of β estimates representing percent change.
RESULTS
CHILD’S BMI PERCENTILE
Of the 831 children with BMI measured, 16% were overweight and an additional 13% were obese, approximately half were female, race-ethnic group was evenly divided except for a smaller percentage of Asian/Pacific Islander and mean age was 6.8 years. Table 1 shows distributions of all variables, and their unadjusted associations with BMI categories. About one-third of children had been exposed to dogs (30.7%) or farm animals (1.8%) during their first year of life. While having a dog in the first year of life was related to both outcomes, exposure to cat in first year, or to cat or dog in prior year, were not significant.
Table 1.
Description of all variables considered, total and by child BMI percentile status, United States, 2017–2019, ages 4 to 8.
| All children, N=831, N (%) or Mean ± SD | Normal BMI, n=589, N (%) or Mean ± SD | Overweight BMI, n=134, N (%) or Mean ± SD | Obese BMI, n=108, N (%) or Mean ± SD | p-value | |
|---|---|---|---|---|---|
| Early exposure to animals (dog/farm, n=770) | 0.01 | ||||
| Yes | 245 (31.8%) | 190 (34.5%) | 36 (29.8%) | 19 (19.4%) | |
| No | 525 (68.2%) | 361 (65.5%) | 85 (70.3%) | 79 (80.6%) | |
| Child agea (years, n=831) | 6.8 ± 1.0 | 6.8 ± 1.0 | 6.8 ± 1.0 | 6.9 ± 0.9 | 0.70 |
| Child gender (n=831) | 0.99 | ||||
| Female | 402 (48.4%) | 286 (48.6%) | 64 (47.8%) | 52 (48.2%) | |
| Male | 429 (51.6%) | 303 (51.4%) | 70 (52.2%) | 56 (51.9%) | |
| Child race/ethnicity (n=831) | <.001 | ||||
| Asian/Pacific Islander | 105 (12.6%) | 91 (15.5%) | 11 (8.2%) | 3 (2.8%) | |
| Hispanic | 241 (29.0%) | 139 (23.6%) | 49 (36.6%) | 53 (49.1%) | |
| Non-Hispanic Black | 263 (31.7%) | 183 (31.1%) | 41 (30.6%) | 39 (36.1%) | |
| Non-Hispanic White | 222 (26.7%) | 176 (29.9%) | 33 (24.6%) | 13 (12.0%) | |
| Received food assistance (n=816) | <.001 | ||||
| Yes | 515 (63.1%) | 343 (59.2%) | 81 (61.8%) | 91 (85.9%) | |
| Never | 301 (36.9%) | 236 (40.8%) | 50 (38.2%) | 15 (14.2%) | |
| Maternal education (n=831) | <.001 | ||||
| Up to HS graduate | 197 (23.7%) | 117 (19.9%) | 40 (29.9%) | 40 (37.0%) | |
| Beyond HS | 634 (76.3%) | 472 (80.1%) | 94 (70.2%) | 68 (63.0%) | |
| Dog in home for first year (n=771) | 0.01 | ||||
| Yes | 237 (30.7%) | 184 (33.3%) | 35 (28.9%) | 18 (18.4%) | |
| No | 534 (69.3%) | 368 (66.7%) | 86 (71.1%) | 80 (91.6%) | |
| Cat in home for first year (n=768) | 0.91 | ||||
| Yes | 94 (12.2%) | 69 (12.6%) | 14 (11.6%) | 11 (11.2%) | |
| No | 674 (87.8%) | 480 (87.4%) | 107 (88.4%) | 87 (88.8%) | |
| Farm animals in first year (n=770) | 0.83 | ||||
| Yes | 14 (1.8%) | 11 (2.0%) | 1 (0.8%) | 2 (2.0%) | |
| No | 756 (98.2%) | 540 (98.0%) | 120 (99.2%) | 96 (98.0%) | |
| Dog in home in past 12 months (n=769) | 0.42 | ||||
| Yes | 286 (37.2%) | 207 (37.6%) | 48 (40.0%) | 31 (31.6%) | |
| No | 483 (62.8%) | 344 (62.4%) | 72 (60.0%) | 67 (68.4%) | |
| Cat in home in past 12 months (n=767) | 0.31 | ||||
| Yes | 94 (12.3%) | 73 (13.3%) | 13 (10.7%) | 8 (8.2%) | |
| No | 673 (87.7%) | 475 (86.7%) | 108 (89.3%) | 90 (91.8%) | |
| Maternal pre-pregnancy BMI (kg/m2, n=823) | 25.8 ± 5.5 | 25.1 ± 5.2 | 26.7 ± 5.3 | 29.1 ± 6.4 | <.001 |
| Parity (n=831) | 0.46 | ||||
| Primiparous | 378 (45.5%) | 276 (46.9%) | 56 (41.8%) | 46 (42.6%) | |
| Multiparous | 453 (54.5%) | 313 (53.1%) | 78 (58.2%) | 62 (57.4%) | |
| Delivery mode (N=830) | 0.26 | ||||
| C-section | 264 (31.8%) | 177 (30.1%) | 48 (35.8%) | 39 (36.1%) | |
| Vaginal | 566 (68.2%) | 411 (69.9%) | 86 (64.2%) | 69 (63.9%) | |
| NICU admission (n=828) | 0.19 | ||||
| Yes | 104 (12.6%) | 67 (11.4%) | 23 (17.2%) | 14 (13.0%) | |
| No | 724 (87.4%) | 519 (88.6%) | 111 (82.8%) | 94 (87.0%) | |
| Breastfed exclusively ≥6 months (n=782) | 0.001 | ||||
| Yes | 170 (21.7%) | 141 (25.1%) | 19 (15.3%) | 10 (10.4%) | |
| No | 612 (78.3%) | 421 (74.9%) | 105 (84.7%) | 26 (89.6%) | |
| Age began daycare/school (n=772) | 0.03 | ||||
| Before 1 year | 442 (57.3%) | 321 (58.1%) | 57 (47.5%) | 64 (64.7%) | |
| 1 year or older | 330 (42.8%) | 232 (42.0%) | 63 (52.5%) | 35 (35.4%) | |
| Antibiotic prescriptions (n=770) | 0.97 | ||||
| 0 | 183 (23.8%) | 134 (24.1%) | 26 (22.8%) | 23 (22.8%) | |
| 1–2 | 227 (29.5%) | 165 (29.7%) | 31 (27.2%) | 31 (30.7%) | |
| 3–4 | 163 (21.2%) | 117 (21.1%) | 27 (23.7%) | 19 (18.8%) | |
| 5+ | 197 (25.6%) | 139 (25.1%) | 30 (26.3%) | 28 (27.7%) | |
| Child activity (n=805) | 0.10 | ||||
| Lower | 307 (38.1%) | 209 (36.2%) | 49 (39.5%) | 49 (47.1%) | |
| Higher | 498 (61.9%) | 368 (63.8%) | 75 (60.5%) | 55 (52.9%) |
SD=standard deviation. Percentages may not sum to 100 due to rounding.
One child was 9.0 years of age.
Chi-square (or Fisher’s Exact test) was used to compare categorical variables by BMI categories, and Kruskal-Wallis test was used to compare continuous variables by BMI categories.
Unadjusted logistic regression showed children with early exposure to dogs/farm animals were significantly associated with 0.46 decreased odds of obesity (95% confidence interval [CI] 0.27, 0.78) compared to those unexposed. Variables of child race/ethnicity, food assistance, maternal education, pre-pregnancy BMI, parity, delivery mode, NICU, exclusive breast feeding, age beginning daycare/school, and activity level were entered in the initial multivariate model.
Table 2, Model 1, shows the final multinomial logistic regression model using listwise deletion. Early exposure to dogs/farm animals was significantly related to decreased odds of obesity (OR=0.53, 95% CI 0.28, 0.997), but not overweight, after covariate adjustment. Overall, 18% of participants with measured BMI were missing other variables in Model 1. Variables for early exposure to animals and age at start of daycare/school had the highest proportion of missing data, 7.3% and 7.1%, respectively. After MI, Model 1a continued to demonstrate that early animal exposure was significantly associated with decreased obesity (0.54, 95% CI 0.30, 0.95) but not overweight.
Table 2.
Multinomial logistic regression with 3 categories of child BMI percentile as outcome, with and without multiple imputation, United States, 2017–2019, ages 4 to 8.
| Model 1, N=681 OR (95% CI) | Model 1aa, N=831 OR (95% CI) | |
|---|---|---|
| Early exposure to animals (dog/farm) | ||
| Overweight | 0.84 (0.52, 1.36) | 0.75 (0.47, 1.19) |
| Obese | 0.53 (0.28, 0.997) | 0.54 (0.30, 0.95) |
| Child race/ethnicity (ref=Non-Hispanic White) | ||
| Asian/Pacific Islander overweight | 0.63 (0.27, 1.44) | 0.64 (0.30, 1.38) |
| Asian/Pacific Islander obese | 0.31 (0.06, 1.47) | 0.41 (0.11, 1.54) |
| Non-Hispanic Black overweight | 1.46 (0.74, 2.87) | 1.34 (0.72, 2.52) |
| Non-Hispanic Black obese | 1.60 (0.67, 3.80) | 1.51 (0.67, 3.40) |
| Hispanic overweight | 1.95 (1.02, 3.73) | 2.01 (1.11, 3.63) |
| Hispanic obese | 2.79 (1.21, 6.42) | 3.08 (1.42, 6.68) |
| Less active child | ||
| Overweight | 1.30 (0.83, 2.05) | 1.30 (0.86, 1.97) |
| Obese | 2.09 (1.24, 3.53) | 2.03 (1.27, 3.24) |
| Received food assistance | ||
| Overweight | 0.73 (0.43, 1.25) | 0.67 (0.41, 1.10) |
| Obese | 2.05 (0.97, 4.30) | 2.19 (1.09, 4.37) |
| Started daycare at <1 year | ||
| Overweight | 0.65 (0.42, 1.00) | 0.59 (0.40, 0.89) |
| Obese | 1.37 (0.80, 2.34) | 1.36 (0.84, 2.22) |
| Maternal pre-pregnancy BMI | ||
| Overweight | 1.06 (1.02, 1.10) | 1.05 (1.01, 1.09) |
| Obese | 1.10 (1.06, 1.15) | 1.10 (1.06, 1.14) |
| Not exclusively breastfed ×6 months | ||
| Overweight | 1.67 (0.94, 2.96) | 1.70 (0.99, 2.92) |
| Obese | 1.97 (0.92, 4.21) | 2.01 (0.99, 4.08) |
| Admitted to NICU after birth | ||
| Overweight | 1.85 (1.04, 3.28) | 1.59 (0.93, 2.72) |
| Obese | 0.99 (0.47, 2.09) | 0.92 (0.47, 1.80) |
OR=odds ratio, CI=confidence interval
All variables listed are adjusted for all other variables.
Model included multiple imputation. Variables used for imputation included all variables in the final model as well as auxiliary variables for mother’s reported current BMI, income during pregnancy, parity at pregnancy, pregnancy work status, time spent playing with a pet while pregnant, maternal education, dog ownership in the prior year, child’s current difficulty sleeping, and presence of TV in child’s bedroom.
CHILD’S PERCENT FAT MASS
Fat mass was measured in 611 children. Mean proportion of fat mass was 17.3% (standard deviation [SD]=0.08%). Univariate linear regression showed a 2.1% decrease in fat mass in children with early exposure to animals (95% CI −3.6%, −0.7%). Based on bivariate associations with the outcome, the variables child race/ethnicity, food assistance, maternal education, pre-pregnancy BMI, exclusive breast feeding, age beginning daycare/school, cat in home in prior year, and activity level were entered in the initial multivariable model.
Table 3, Model 2, shows the final multivariable linear regression model using listwise deletion. Early animal exposure was significantly related to a 1.5% (95% CI −3.0%, −0.1%) decrease in percent fat mass after covariate adjustment. Overall, 10% of participants with measured fat mass were missing other variables in Model 2. After MI, Model 2a continued to show that early exposure to dogs/farm animals was significantly associated with a 1.5% (95% CI −2.9%, −0.1%) decrease in percent fat mass after covariate adjustment.
Table 3.
Multivariable linear regression with continuous percent fat mass as outcome, United States, 2017–2019, ages 4 to 8.
| Model 2, N=548 β estimates (95% CI) | Model 2aa, N=611 β estimates (95% CI) | |
|---|---|---|
| Early exposure to animals (dog/farm) | −1.55 (−2.99, −0.11) | −1.48 (−2.88, −0.09) |
| Child race/ethnicity (ref=Non-Hispanic White) | ||
| Asian/Pacific Islander | 3.00 (0.86, 5.14) | 2.85 (0.75, 4.95) |
| Non-Hispanic Black | −2.86 (−4.82, −0.90) | −2.49 (−4.39, −0.58) |
| Hispanic | 1.08 (−0.88, 3.03) | 1.11 (−0.77, 2.99) |
| Less active child | 2.69 (1.34, 4.05) | 2.74 (1.43, 4.06) |
| Received food assistance | 3.05 (1.42, 4.69) | 3.05 (1.47, 4.63) |
| Maternal pre-pregnancy BMI (per kg/m2) | 0.24 (0.13, 0.36) | 0.26 (0.15, 0.38) |
| Not exclusively breastfed ×6 months | 1.46 (−0.08, 3.01) | 1.43 (−0.09, 2.95) |
| No maternal education beyond high school | 2.08 (0.33, 3.84) | 1.59 (−0.03, 3.22) |
CI=confidence interval
All variables listed are adjusted for all other variables.
Model included multiple imputation. Variables used for imputation included all variables in the final model as well as auxiliary variables for mother’s reported current BMI, income during pregnancy, pregnancy work status, time spent playing with a pet while pregnant, dog ownership in the prior year, age of child, presence of TV in child’s bedroom, and presence of biological father in home during pregnancy.
DISCUSSION
Children with early exposure to dog or farm animals in the first year of life had half the odds of being obese compared to unexposed children, using MI to account for missing data, and after covariate adjustment. Similarly, compared to children unexposed to dogs or farm animals in their first year, exposed children had, on average, 1.5% lower fat mass, again using MI and after adjustment for other covariates. A possible mechanism for these associations is gut microbiota. Multiple studies have found that animals in childhood, especially dogs or farm animals, affect gut microbiota,19–21 with some of these microbiota being inversely associated with weight.22 In the current study, this association with adiposity was primarily a consequence of exposure to dogs, with only 2% of children having early exposure to farm animals. Having a cat in the home during the first year of the child’s life was not significantly related to either outcome, and living with a cat is not considered as strong an influence on gut microbiome.20,23 Moreover, it appears there may be a critical time period for animal exposure early in life.23–25 Neither exposure to dogs nor cats in the 12 months preceding follow-up evaluation was associated with childhood BMI or fat mass.
BMI and percent fat mass do not necessarily correlate. Studies have shown about half of overweight children do not have high body fat, and proportion of body fat differs by race/ethnicity.26–28 Hispanic and Asian children in general have higher, and Black children lower, body fat compared to White children, regardless of BMI. In regard to race/ethnicity, it is important to consider it as a social construct, enmeshed with levels of discrimination that have been associated with BMI.29,30
Strengths of this study include extensive data collected on potential confounding variables, and information collected previously during pregnancy reducing reliance on long-term memory. There was also significant racial/ethnic and geographic diversity, contributing to generalizability of the findings. Limitations of this study are related to survey data collection and recall errors, the lack of more precise information regarding animal exposures, small effect size with wide CIs, and unmeasured confounders. It could be argued that having exposure to dog or farm animals equates to increased activity, however, child activity was included as a covariate, and current dog ownership did not show a significant relationship with our adiposity measures. Studies of current dog ownership in school age children found no relationship to activity, and varying relationships with weight.11,12,31
These analyses provide additional evidence that exposure to dogs and/or farm animals during the first year of life may be associated with lower odds of obesity and decreased percent body fat. The results remained consistent even after controlling for many potential confounding variables. If these relationships are confirmed, this is another positive aspect of pet ownership that could be used in public health messaging.
ACKNOWLEDGMENTS
The content is solely the responsibility of the authors and does not necessarily represent the official views of the National Institutes of Health.
NICHD-Fetal Growth Studies:
The research referred to in this presentation was supported by the Eunice Kennedy Shriver National Institute of Child Health and Human Development (NICHD) Intramural Funding and included American Recovery and Reinvestment Act funding via contract numbers HHSN275200800013C; HHSN275200800002I; HHSN27500006; HHSN275200800003IC; HHSN275200800014C; HHSN275200800012C; HHSN275200800028C; HHSN275201000009C and the authors acknowledged the research teams at all participating clinical centers including Christina Care Health Systems, University of California, Irvine, Long Beach Memorial Medical Center, Northwestern University, Medical University of South Carolina, Columbia University, New York Presbyterian Queens, St Peters’ University Hospital, University of Alabama at Birmingham, Women and Infants Hospital of Rhode Island, Fountain Valley Regional Hospital and Medical Center and Tufts University.
ECHO:
Research reported in this publication was supported by the Environmental Influences on Child Health Outcomes (ECHO) program, Office of The Director, National Institutes of Health, under Award Numbers UG3OD023316. Project Title: Exposome Contributors to Child Health Originating from National Fetal Growth Study (ECCHO-NFGS). We wish to thank the mothers and children who participated in ECHO for their time and effort.
Study data were collected and managed using REDCap electronic data capture tools* hosted by the South Carolina Clinical and Translational Science (SCTR) Institute at the Medical University of South Carolina. REDCap (Research Electronic Data Capture) is a secure, web-based software platform designed to support data capture for research studies, providing 1) an intuitive interface for validated data capture; 2) audit trails for tracking data manipulation and export procedures; 3) automated export procedures for seamless data downloads to common statistical packages; and 4) procedures for data integration and interoperability with external sources.
REDCap at SCTR is supported by the National Center for Advancing Translational Sciences of the National Institutes of Health under Grant Number UL1 TR001450.
*PA Harris, R Taylor, R Thielke, J Payne, N Gonzalez, JG. Conde, Research electronic data capture (REDCap) - A metadata-driven methodology and workflow process for providing translational research informatics support, J Biomed Inform. 2009 Apr;42(2):377-81.
PA Harris, R Taylor, BL Minor, V Elliott, M Fernandez, L O’Neal, L McLeod, G Delacqua, F Delacqua, J Kirby, SN Duda, REDCap Consortium, The REDCap consortium: Building an international community of software partners, J Biomed Inform. 2019 May 9 [doi: 10.1016/j.jbi.2019.103208].
Footnotes
DISCLOSURE: The authors report no conflict of interest.
Data availability:
Please contact Dr. Kelly J. Hunt, huntke@musc.edu
REFERENCES
- 1.Prevalence of Overweight, Obesity, and Severe Obesity Among Children and Adolescents Aged 2–19 Years: United States, 1963–1965 Through 2015–2016. National Center for Health Statistics, Centers for Disease Control and Prevention, 2018. (Accessed 4/27/2020, at https://www.cdc.gov/nchs/data/hestat/obesity_child_15_16/obesity_child_15_16.htm.) [Google Scholar]
- 2.Lee YS. Consequences of childhood obesity. Annals of the Academy of Medicine, Singapore: 2009;38:75–7. [PubMed] [Google Scholar]
- 3.O’Connor GT, Lynch SV, Bloomberg GR, et al. Early-life home environment and risk of asthma among inner-city children. Journal of Allergy and Clinical Immunology 2018;141:1468–75. [DOI] [PMC free article] [PubMed] [Google Scholar]
- 4.Stokholm J, Chawes BL, Vissing N, Bønnelykke K, Bisgaard H. Cat exposure in early life decreases asthma risk from the 17q21 high-risk variant. The Journal of Allergy and Clinical Immunology 2018;141:1598–606. [DOI] [PubMed] [Google Scholar]
- 5.Azad MB, Konya T, Maughan H, et al. Infant gut microbiota and the hygiene hypothesis of allergic disease: impact of household pets and siblings on microbiota composition and diversity. Allergy, Asthma & Clinical Immunology 2013;9:15. [DOI] [PMC free article] [PubMed] [Google Scholar]
- 6.McCloskey K, Vuillermin P, Carlin JB, et al. Perinatal microbial exposure may influence aortic intima-media thickness in early infancy. International Journal of Epidemiology 2017;46:209–18. [DOI] [PubMed] [Google Scholar]
- 7.Cassidy-Bushrow AE, Sitarik AR, Johnson-Hooper TM, et al. Prenatal pet keeping and caregiver-reported attention deficit hyperactivity disorder through preadolescence in a United States birth cohort. BMC Pediatrics 2019;19:390. [DOI] [PMC free article] [PubMed] [Google Scholar]
- 8.Yolken R, Stallings C, Origoni A, et al. Exposure to household pet cats and dogs in childhood and risk of subsequent diagnosis of schizophrenia or bipolar disorder. PLOS ONE 2019;14:e0225320. [DOI] [PMC free article] [PubMed] [Google Scholar]
- 9.Cassidy-Bushrow AE, Wegienka G, Havstad S, et al. Does pet-keeping modify the association of delivery mode with offspring body size? Maternal and Child Health Journal 2015;19:1426–33. [DOI] [PMC free article] [PubMed] [Google Scholar]
- 10.Stiemsma LT, Reynolds LA, Turvey SE, Finlay BB. The hygiene hypothesis: current perspectives and future therapies. ImmunoTargets and Therapy 2015;4:143–57. [DOI] [PMC free article] [PubMed] [Google Scholar]
- 11.Gadomski A, Scribani M, Krupa N, Jenkins P, Nagykaldi Z, Olson A. Pet Dogs and Children’s Health: Opportunities for Chronic Disease Prevention? Preventing Chronic Disease 2015;12. [DOI] [PMC free article] [PubMed] [Google Scholar]
- 12.Westgarth C, Heron J, Ness AR, et al. Is childhood obesity influenced by dog ownership? No cross-sectional or longitudinal evidence. Obesity Facts 2012;5:833–44. [DOI] [PMC free article] [PubMed] [Google Scholar]
- 13.Vanderwall C, Randall Clark R, Eickhoff J, Carrel AL. BMI is a poor predictor of adiposity in young overweight and obese children. BMC Pediatr 2017;17:135. [DOI] [PMC free article] [PubMed] [Google Scholar]
- 14.Grewal J, Grantz KL, Zhang C, et al. Cohort Profile: NICHD Fetal Growth Studies-Singletons and Twins. International Journal of Epidemiology 2018;47:25–l. [DOI] [PMC free article] [PubMed] [Google Scholar]
- 15.Buck Louis GM, Grewal J, Albert PS, et al. Racial/ethnic standards for fetal growth: the NICHD Fetal Growth Studies. Am J Obstet Gynecol 2015;213:449 e1–e41. [DOI] [PMC free article] [PubMed] [Google Scholar]
- 16.Zhang C, Hediger ML, Albert PS, et al. Association of Maternal Obesity With Longitudinal Ultrasonographic Measures of Fetal Growth: Findings From the NICHD Fetal Growth Studies-Singletons. JAMA Pediatr 2018;172:24–31. [DOI] [PMC free article] [PubMed] [Google Scholar]
- 17.A SAS Program for the 2000 CDC Growth Charts (ages 0 to <20 years). Division of Nutrition, Physical Activity, and Obesity, National Center for Chronic Disease Prevention and Health Promotion, Centers for Disease Control and Prevention, 2019. (Accessed 12/31/2019, at https://www.cdc.gov/nccdphp/dnpao/growthcharts/resources/sas.htm.)
- 18.Dwyer GM, Hardy LL, Peat JK, Baur LA. The validity and reliability of a home environment preschool-age physical activity questionnaire (Pre-PAQ). Int J Behav Nutr Phys Act 2011;8:86. [DOI] [PMC free article] [PubMed] [Google Scholar]
- 19.Martin R, Makino H, Cetinyurek Yavuz A, et al. Early-Life Events, Including Mode of Delivery and Type of Feeding, Siblings and Gender, Shape the Developing Gut Microbiota. PLOS ONE 2016;11:e0158498. [DOI] [PMC free article] [PubMed] [Google Scholar]
- 20.Barberán A, Dunn RR, Reich BJ, et al. The ecology of microscopic life in household dust. Proceedings of the Royal Society B: Biological Sciences 2015;282:20151139. [DOI] [PMC free article] [PubMed] [Google Scholar]
- 21.Stein MM, Hrusch CL, Gozdz J, et al. Innate Immunity and Asthma Risk in Amish and Hutterite Farm Children. New England Journal of Medicine 2016;375:411–21. [DOI] [PMC free article] [PubMed] [Google Scholar]
- 22.Tun HM, Konya T, Takaro TK, et al. Exposure to household furry pets influences the gut microbiota of infant at 3–4 months following various birth scenarios. Microbiome 2017;5:40. [DOI] [PMC free article] [PubMed] [Google Scholar]
- 23.Nielsen CC, Gascon M, Osornio-Vargas AR, et al. Natural environments in the urban context and gut microbiota in infants. Environment International 2020;142:105881. [DOI] [PubMed] [Google Scholar]
- 24.Tun HM, Bridgman SL, Chari R, et al. Roles of Birth Mode and Infant Gut Microbiota in Intergenerational Transmission of Overweight and Obesity From Mother to Offspring. JAMA Pediatrics 2018;172:368–77. [DOI] [PMC free article] [PubMed] [Google Scholar]
- 25.Stanislawski MA, Dabelea D, Wagner BD, et al. Gut Microbiota in the First 2 Years of Life and the Association with Body Mass Index at Age 12 in a Norwegian Birth Cohort. mBio 2018;9. [DOI] [PMC free article] [PubMed] [Google Scholar]
- 26.Willig AL, Hunter GR, Casazza K, Heimburger DC, Beasley TM, Fernandez JR. Body fat and racial genetic admixture are associated with aerobic fitness levels in a multiethnic pediatric population. Obesity (Silver Spring, Md) 2011;19:2222–7. [DOI] [PMC free article] [PubMed] [Google Scholar]
- 27.Flegal KM, Ogden CL, Yanovski JA, et al. High adiposity and high body mass index-for-age in US children and adolescents overall and by race-ethnic group. The American Journal of Clinical Nutrition 2010;91:1020–6. [DOI] [PMC free article] [PubMed] [Google Scholar]
- 28.Deurenberg P, Deurenberg-Yap M, Guricci S. Asians are different from Caucasians and from each other in their body mass index/body fat per cent relationship. Obesity Reviews: an Official Journal of the International Association for the Study of Obesity 2002;3:141–6. [DOI] [PubMed] [Google Scholar]
- 29.Bernardo CO, Bastos JL, González-Chica DA, Peres MA, Paradies YC. Interpersonal discrimination and markers of adiposity in longitudinal studies: a systematic review. Obesity Reviews 2017;18:1040–9. [DOI] [PubMed] [Google Scholar]
- 30.Nelson DS, Gerras JM, McGlumphy KC, et al. Racial Discrimination and Low Household Education Predict Higher Body Mass Index in African American Youth. Childhood Obesity 2018;14:114–21. [DOI] [PubMed] [Google Scholar]
- 31.Timperio A, Salmon J, Chu B, Andrianopoulos N. Is dog ownership or dog walking associated with weight status in children and their parents? Health Promotion Journal of Australia: Official Journal of Australian Association of Health Promotion Professionals 2008;19:60–3. [DOI] [PubMed] [Google Scholar]
Associated Data
This section collects any data citations, data availability statements, or supplementary materials included in this article.
Data Availability Statement
Please contact Dr. Kelly J. Hunt, huntke@musc.edu