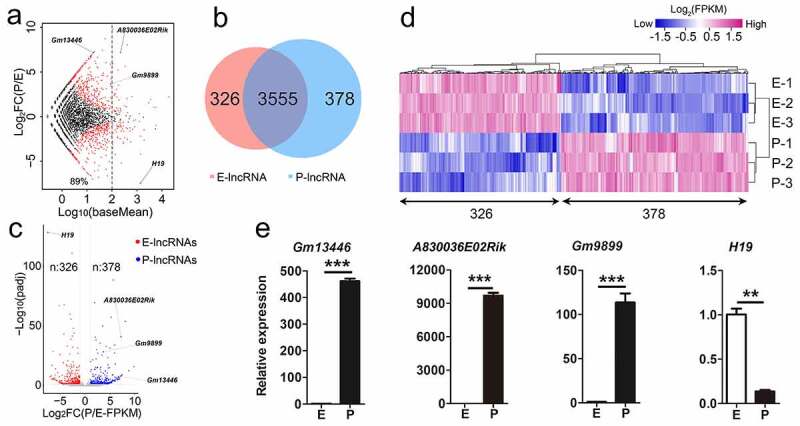
Figure 1.

Differentially expressed lncRNAs in the mouse developing cortex. (a) MA plot shows the transcript abundance and the fold change of lncRNAs in E-stage and P-stage cortices. Log10 (baseMean) represents transcript abundance; log2FC(P/E) represents the fold change of lncRNA transcript abundance at P-stage compared to E-stage. log2FC(P/E) = 0, lncRNA transcript abundance was equal at two stages; log2FC(P/E) > 0, lncRNA transcript abundance was higher in P-stage than in E-stage cortices; log2FC(P/E) < 0, lncRNA transcript abundance was lower in P-stage than in E-stage cortices. Red dots, padj < 0.05; black dots, padj > 0.05. (b) The Venn diagram shows 326 and 378 significantly differentially expressed lncRNAs in E-stage and P-stage cortices, and 3555 lncRNAs with no significantly differential transcript abundance in both E- and P-stage cortices. (c) The volcano plot shows significantly differentially expressed lncRNAs at E-stage and P-stage. Red dots represent 326 significantly enriched lncRNAs at E-stage. Blue dots represent 378 significantly enriched lncRNAs at P-stage, grey dots represent lncRNAs with no significantly differential expression. The criteria for filtering significantly differentially expressed lncRNAs were padj < 0.05, log2FC (P/E-FPKM) > 1 or < −1. (d) The heatmap shows significantly differentially expressed 326 lncRNAs in E-stage and 378 lncRNAs in P-stage cortices. (e) Quantitative real-time reverse transcription PCR (qRT-PCR) validated relative transcript abundance of lncRNAs in developing cortices. padj: adjusted p-value; E: E-stage; P: P-stage; FC: fold change; FPKM: fragments per kilobase of transcript per million mapped reads. Data are presented as mean ± SEM; n = 3 for all qRT-PCR; p values are in relation to the other stage (**: p < 0.05, ***: p < 0.005)
