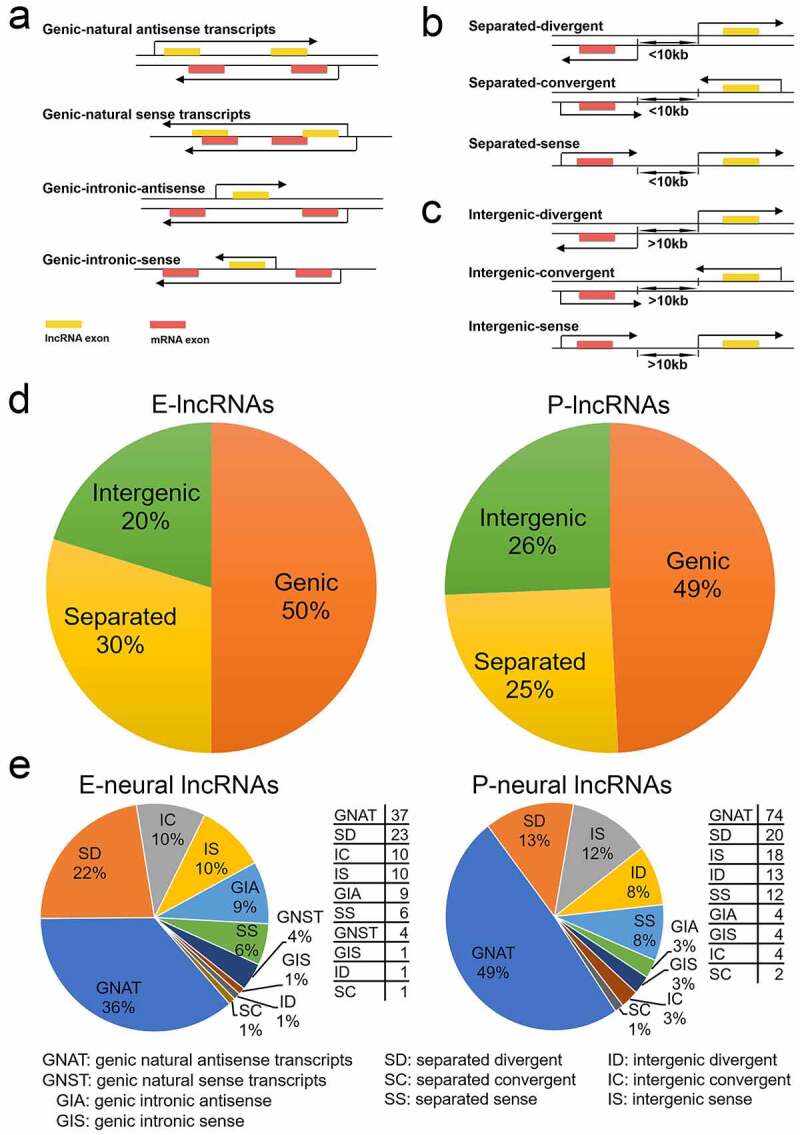
Figure 2.

Classification of significantly differentially expressed lncRNAs according to their genomic location relative to the nearest mRNAs in E- and P-stage cortices. (a) The four subclasses of genic lncRNAs with part of or all gene overlapped with the nearest mRNA. (b) The three subclasses of separated lncRNAs with a distance of less than 10kb to the nearest mRNA. (c) The three subclasses of intergenic lncRNAs with a distance of more than 10kb to the nearest mRNA. The arrow covering genes represents the transcription direction. (d) Pie charts show the proportion of 326 and 378 significantly differentially expressed lncRNAs in each classification at E- and P-stage. (e) Pie charts show the proportion of pre-selected potential neural-lncRNAs in each subclass at E- and P-stage; the tables show the numbers of pre-selected potential neural-lncRNAs in each subclass at E- and P-stage
