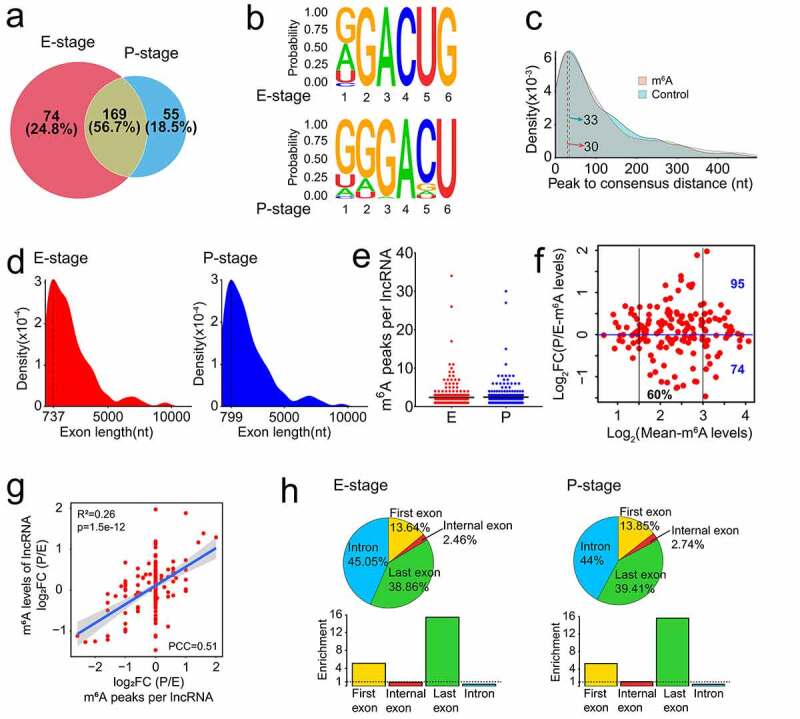
Figure 3.

Features of m6A methylated lncRNAs in embryonic and postnatal mouse cortices. (a) Venn diagram shows the distribution of m6A peaks in lncRNAs at E- and P-stage. (b) The enriched consensus motif of m6A peaks in lncRNAs at E- and P-stage. (c) Density plot shows the closest distance between the m6A peak summit and the consensus motif (RRACU) in peak regions, and the closest distance between the consensus motif and the midpoint of the randomly selected sequence in the genome with equal length as peak regions in controls. (d) Density plot shows the exon length of m6A peaks enriched in lncRNAs at E- and P-stage. (e) Scatter plot shows the numbers of m6A peak in lncRNAs at E- and P-stage. Black horizontal lines among dots represent the mean number of m6A peak in lncRNAs at E- and P-stage. (f) Scatter plot shows the transcript abundance of m6A methylated lncRNAs at E- and P-stage. (g) Scatter plot shows the positive correlation between the numbers of m6A peaks and the m6A levels of lncRNAs at E- and P-stage (PCC > 0.25 and p < 0.05). (h) The top: pie charts represent the proportion of m6A peaks in the four regions of lncRNAs at E- and P-stage. The bottom: histogram represents the enrichment of m6A peaks in the four regions of lncRNAs at E- and P-stage. nt: nucleotide; FC: fold change; PCC: Pearson correlation coefficients; R2: the goodness-of-fit for the linear regression model
