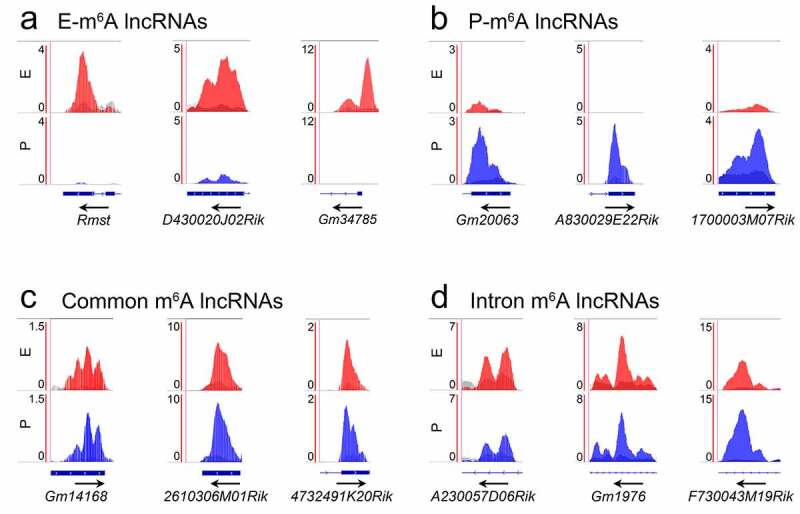
Figure 5.

Distribution pattern of m6A peaks in lncRNAs showed by Integrative Genomics Viewer (IGV). (a) The m6A peaks were specifically enriched in the exon of lncRNAs at E-stage. (b) The m6A peaks were specifically enriched in the exon of lncRNAs at P-stage. (c) The m6A peaks were co-enriched in the exon of lncRNAs at E- and P-stage. (d) The m6A peaks were co-enriched in the intron of lncRNAs at E- and P-stage. Red peaks: normalized IP read enrichment at E-stage; blue peaks: normalized IP read enrichment at P-stage; grey peaks: normalized input read enrichment. Blue bar: exon; blue thin line: intron. Arrow direction: the direction of gene transcription; arrow location: enriched m6A peaks overlap with the beginning, middle and end position of lncRNAs
