

Abstract
Bromopyrroles (BrPyr) are synthesized naturally by marine sponge symbionts and produced anthropogenically as byproducts of wastewater treatment. BrPyr interact with ryanodine receptors (RYRs) and sarco/endoplasmic reticulum (SR/ER) Ca2+-ATPase (SERCA). Influences of BrPyr on the neuronal network activity remain uncharted. BrPyr analogues with differing spectra of RYR/SERCA activities were tested using RYR-null or RYR1-expressing HEK293 and murine cortical neuronal/glial cocultures (NGCs) loaded with Fluo-4 to elucidate their mechanisms altering Ca2+ dynamics. The NGC electrical spike activity (ESA) was measured from NGCs plated on multielectrode arrays. Nanomolar tetrabromopyrrole (TBP, 1) potentiated caffeine-triggered Ca2+ release independent of extracellular [Ca2+] in RYR1-HEK293, whereas higher concentrations produce slow and sustained rise in cytoplasmic [Ca2+] independent of RYR1 expression. TBP, 2,3,5-tribromopyrrole (2), pyrrole (3), 2,3,4-tribromopyrrole (4), and ethyl 4-bromopyrrole-2-carboxylate (5) added acutely to NGC showed differential potency; rank order TBP (IC50 ≈ 220 nM) > 2 ≫ 5, whereas 3 and 4 were inactive at 10 μM. TBP >2 μM elicited sustained elevation of cytoplasmic [Ca2+] and loss of neuronal viability. TBP did not alter network ESA. BrPyr from marine and anthropogenic sources are ecological signaling molecules and emerging anthropogenic pollutants of concern to environmental and human health that potently alter ER Ca2+ dynamics and warrant further investigation in vivo.
Keywords: bromopyrroles, neurotoxicity, Ca2+ homeostasis, disinfectant byproducts, marine organohalogens, ryanodine receptors, sarco/endoplasmic reticulum Ca2+-ATPase (SERCA), structure–activity relationship
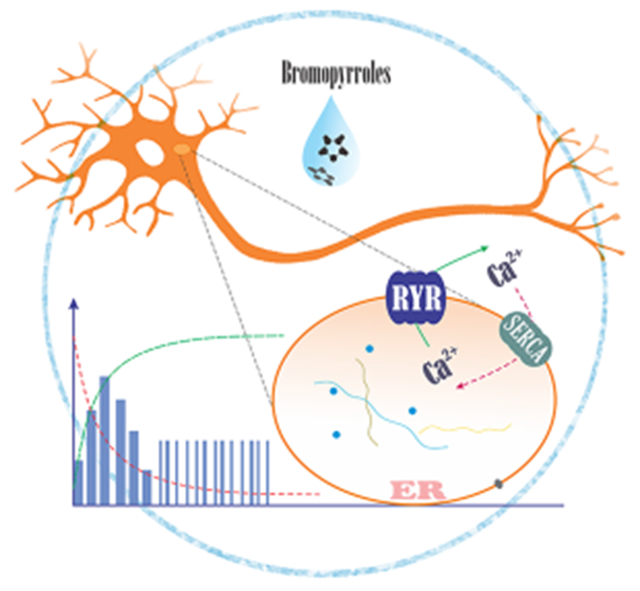
Graphical Abstract
INTRODUCTION
Thousands of naturally synthesized marine organohalogens (MOHs) have been identified in microbes and algae,1,2 many of which resemble anthropogenic persistent organic pollutants (POPs) known to harm human health.3,4 Biosynthetic gene clusters expressed within marine bacteria and sponge-microbiome-associated cyanobacterial endosymbionts produce polybrominated diphenyl ethers (PBDEs), bromopyrroles (BrPyr), and their derivatives.5–9 As demonstrated with anthropogenic POPs such as polychlorinated biphenyls (PCBs) and PBDEs, recent research with MOHs has shown that they target and alter the function of proteins broadly expressed within animal and plant cells known to regulate calcium (Ca2+) dynamics across the sarcoplasmic/endoplasmic reticulum (SR/ER).4,10,11 Ca2+ accumulated and stored within the SR/ER compartment represents the major intracellular source of Ca2+ used for properly shaping responses to physiological and pathophysiological signals.3,4 Such mechanisms have been postulated to regulate important bacteria–animal interactions significant to the marine ecology of benthic ecosystems,12 as well as produce toxicological sequelae when exposure to anthropogenic BrPyr congeners occurs at higher concentrations and without an ecological context.10,11,13–15
Biomonitoring studies have identified MOHs similar in the chemical structure to their anthropogenic counterparts in marine mammals,16–20 commercially important fish,21 Antarctic air,22 and seabirds and their eggs.1,23 MOHs have also been detected in human tissue samples, although the health impacts of such exposures are unknown.24 The increasingly wide distribution of MOHs, including elevated levels of volatile brominated alkanes such as bromoform, is likely to be driven by climate change along with increased anthropogenic sources, increasing the risk of negative impacts on global food webs, as well as humans and wildlife health.25
Several reports strongly suggest that BrPyr, exemplified by tetrabromopyrrole (TBP, 1) produced by the marine bacterium Pseudoalteromonas, serve as chemical cues for inducing larval metamorphosis of acroporid coral larvae26,27 and complete settlement (attachment and metamorphosis) of Caribbean coral larvae.28 Remarkably, several halogenated pyrroles, including TBP and 2,3,5-tribromopyrrole (2), are being identified as disinfection byproducts during the processing of drinking water13 and more recently detected in chlorinated toilet flushing water15 and the membrane bioreactor cleaning process during wastewater treatment;29 TBP and 2 were shown to have potent cytotoxicity, genotoxicity, and developmental toxicity.13,15 Exposure to nanomolar TBP for 24 h resulted in mortality of a number of phytoplankton species possibly related to increased oxidative stress and abnormal intracellular Ca2+ release, possibly mediated by the activity on IP3R.11 Recently, nanomolar TBP was shown to reduce larval urchin development and survival following short exposures.30 Taken together, BrPyr as a group should be considered as emerging environmental pollutants with risks to both environmental and human health due to their increasing anthropogenic sources.31
Our previous study showed that nanomolar to low micromolar TBP and 2 promoted Ca2+ release from ER/SR vesicles isolated from mammalian skeletal muscle by promoting the activation of ryanodine receptors (RYRs) and inhibiting sarco/endoplasmic reticulum (SERCA).10 Nevertheless, there remains a significant knowledge gap in understanding how these molecular mechanisms of BrPyr influence cellular signaling and their potential as neurotoxicants. Herein, we tested five pyrroles and analogues for altering intracellular Ca2+ dynamics using a RYR1 heterologous expression model in human embryonic kidney 293 (HEK 293) cells and a primary cortical neuronal/glial cocultures (NGCs) model from mice.
MATERIALS AND METHODS
Materials.
Figure 1 summarizes the pyrrole structures used in this study. TBP (1) and 2,3,5-tribromopyrrole (2) were chosen for the study based on their direct potency on RYR and SERCA activity and their ability to alter SR/ER Ca2+ dynamics, whereas pyrrole (3), 2,3,4-tribromopyrrole (4), and ethyl 4-bromopyrrole-2-carboxylate (5) were predicted as negative controls.10 Ryanodine (6) was used as a positive control. Details for all the chemicals and reagents used in this study are listed in Table S1 of the Supporting Information.
Figure 1.
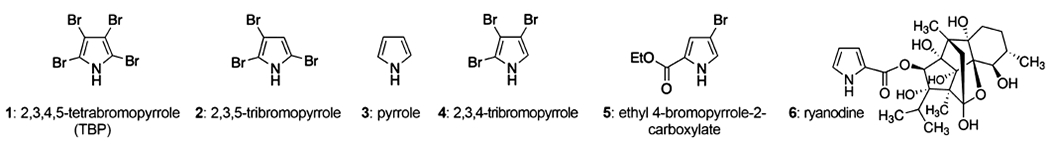
Structures of pyrroles selected for testing. A total of five pyrroles and ryanodine were selected for testing in either or both (TBP) cellular models: null/RYR1-expressing HEK 293 cell lines and primary murine cortical NGCs.
HEK 293 Cell Culture and Validation of RYR1 Expression.
The HEK 293 cell line (CRL-1573) obtained from ATCC (Manassas, VA) was transfected with RYR1 as previously reported.32,33 Cryopreserved RYR-null HEK 293 and RYR1-expressing HEK 293 cell lines were quickly thawed, diluted, plated, and expanded on 75 cm2 flasks in supplemented Dulbecco’s modified Eagle’s medium, followed by being verified for RyR1 expression using three approaches, as described in the Supporting Information. After verification and second passage, RYR-null HEK 293 and RYR1-expressing HEK 293 cells were plated onto a 96-well plate and acutely exposed to caffeine (100 μM)/Locke’s buffer in the absence or presence of TBP (0.1–2.0 μM) to measure the intracellular Ca2+ simultaneously across multiple wells. See the Supporting Information for more details on the HEK 293 cell lines culture, validation by western blotting (WB) and immunocytochemistry (ICC), measurements of intracellular Ca2+, and the analysis of responses of HEK 293 cell lines.
Primary Cortical NGCs.
Animal-related experiments were conducted in accordance with the guidelines of Animal Use and Care of the National Institutes of Health and approved by the University of California Davis Animal Use and Care Committee. The dissection procedures of cortical neurons from postnatal day 0–1 (male and female brains were pooled) C57BL/6J mice pups are detailed in the Supporting Information and as previously described.34 Briefly, the dissociated cells were suspended in the Neurobasal complete (NBC) medium (NBC medium supplemented with GS21 at 2% v/v, Gluta-Max at 1% v/v), (10 mM HEPES) with 5% fetal bovine serum. Then, the suspended cells were plated onto a poly-L-lysine (0.5 mg/mL in borate buffer) precoated 96-well imaging plate (BD, Franklin Lakes, NJ) and maintained at 37 °C with 5% CO2 and 95% humidity. A final concentration of 5 μM of cytosine β-d-arabinofuranoside was added at 24 to 30 h after plating to limit the growth of astrocyte. The presence and proportion of astrocyte and neuronal cells in the cultures at 7 days in vitro (DIV) were verified by ICC described in the Supporting Information.
Measurements of Intracellular Ca2+ Dynamics of NGCs.
At 7 DIV, NGCs were incubated for 1 h with 4 μM Fluo-4 plus 0.5 mg/mL bovine serum albumin in Locke’s buffer as previously described;35 NGCs were then gently rinsed, loaded to an imaging chamber, and recorded for spontaneous Ca2+ oscillations (SCOs) with the acute addition of the vehicle [0.1% dimethyl sulfoxide (DMSO)] or series concentrations of testing compounds. See the Supporting Information for more details of the measurements and SCO analyses.
NGCs Electrical Spike Activity Measurement.
Neuronal network field electrical spike activity (ESA), an aggregate measure of extracellular field potentials spontaneously produced by the neuronal networks, was recorded using NGCs cultured on 12-well microelectrode array (MEA) plates (Axion BioSystems, Atlanta, GA), as detailed in the Supporting Information and previously described.35 Briefly, the ESA was measured from 7 DIV NGCs with the acute addition of the vehicle or the indicated concentrations of TBP using the Axis software (Version 2.4, Axion BioSystems), with specific settings and data analysis software described in the Supporting Information.
Measurement of Neuronal Viability.
NGCs were exposed to the vehicle, TBP, or compound 2 at 7 DIV for 24 h, and the MTT assay was used to evaluate the neuronal toxicity as described in the Supporting Information and closely followed that published previously.36
Data Analysis.
For HEK 293 cell lines results, the curves of the initial rate and amplitude as a function of test concentration were fitted by nonlinear regression with the four-parameter equation using Prism GraphPad (Version 7.03; GraphPad Software Inc., San Diego, CA), as described in the Supporting Information, unpaired t-test assuming that a Gaussian distribution was used to compare the rates and amplitudes between TBP and TBP plus caffeine treatments.
The number of astrocytes and neurons was quantified using Image J (version 1.49s; U.S. National Institutes of Health), as detailed in the Supporting Information. SCO data from primary cultured NGCs were fitted by nonlinear curve fitting using Graph Pad Prism software. Potency/efficacy values were obtained by the nonlinear regression with the three-parameter or four-parameter equation detailed in the Supporting Information. One-way analysis of variance (ANOVA) followed by the post hoc Bonferroni’s multiple comparison test was used to compare differences between compounds (3, 4, and 5) and Veh (0.1% DMSO).
RESULTS AND DISCUSSION
Influence of TBP on Ca2+ Homeostasis in Null and RYR1-Expressing HEK 293 Cells.
Of the pyrroles tested to date, TBP and compound 2 were the most potent toward modifying RyR1 and SERCA.10 Considering their prevalence in environmental samples,15,29 their potential for producing developmental and genotoxicity,13,15,30 and related implications toward ecological systems,26–28 we focused initial cellular experiments on TBP.
Using RYR-null HEK 293 cells and a heterologous expression model that stably expressed RYR1, the exemplary BrPyr TBP was tested for its ability to modify SR/ER Ca2+ dynamics. First, HEK 293 cell lines were verified for their genotype with respect to RYR expression by WB and ICC approaches. Results showed that a high-molecular-weight monomeric subunit of RYR1 was detected at an extrapolated mass of ~565 kDa only in the RYR1-expressing HEK 293 line (Figures 2A and S1), results corroborated by intense staining detected using ICC with RYR1 antibody 34C (Figure 2B,C). Although the monoclonal antibody 34C has been shown to selectively detect RYR1 over RYR2 and RYR3 at the low titer used in the previous study,37 at the high titers used for ICC here (1:25 dilution), it loses specificity and detects all three. Nevertheless, repeated attempts with 34C using ICC failed to detect RYR expression in the null line regardless of the passage number (Figure 2B), whereas the line stably transduced consistently showed a high level of RYR1 expression (Figure 2C). Importantly, cells having either genotype expressed SERCA (Figure 2A).
Figure 2.
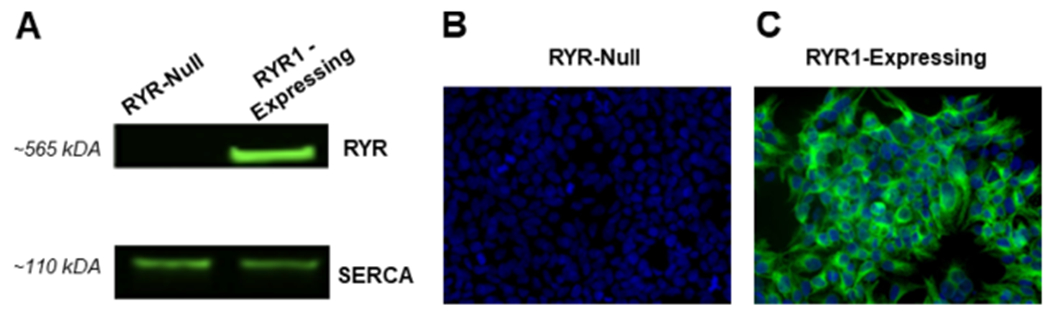
WB and ICC images showing the expression of RYR1 and SERCA in null and RYR1-transfected HEK 293 cell lines. (A) Representative image of a WB showing a prominent immunoreactive band of RYR1 (upper panel) at an extrapolated mass of 565 kDa in RYR1-expressing but not RYR1-null HEK 293 and SERCA (lower panel) at 110 kDa in both RYR1-expressing and RYR1-null HEK 293. (B,C) ICC images showing RyR1 expression in the RYR1-transfected HEK 293 cell line but not in the null line. These data are representative of at least three replicate determinations performed during the initial establishment of the cell lines. An example of an original (uncropped) RYR blot is shown in Figure S1 in the Supporting Information.
For the functional validation of RYR1 expression, HEK 293 cells were loaded with the intracellular Ca2+ indicator Fluo-4 to measure responses in cytoplasmic intracellular free Ca2+ ([Ca2+]i) concentration and tested for responses to 100 μM caffeine in the presence of a physiological level of extracellular [Ca2+]e (2.3 mM) or with the cell in a depleted [Ca2+]e buffer (0.3 mM). Regardless of [Ca2+]e, RYR1-expressing cells responded to 100 μM caffeine with a rapid rise in [Ca2+]i whose peak amplitude (initial amplitude) subsequently decayed back to the initial baseline (Table 1; “vehicle”, Figure 3B,C), whereas RYR-null cells did not respond to caffeine (Table 1; “vehicle”, Figure 4B,C). The first 3 s following the addition of the test compound were defined and used to calculate the “initial rate” of the rapid rise in [Ca2+]i (Figure S2, Supporting Information). Regardless of [Ca2+]e, RYR1-expressing or RYR-null cells exposed to TBP (0.1–2 μM) alone failed to elicit the initial rapid rise in [Ca2+]i seen with the addition of caffeine (Table 1 and Figures 3A,C; 4A,C; and S2). Rather, TBP produced a much slower rise in [Ca2+]i that was sustained over the length of the experiment and whose amplitude, defined as “secondary peak amplitude”, exhibited a similar concentration dependence in both RYR1-expressing and RYR-null lines (Table 1 and Figures 3A,C and 4A, C). TBP was previously shown to alter the binding of [3H]-ryanodine to RYR1 in a biphasic manner, increasing binding at a concentration ≤30 μM and sharply inhibiting binding at higher concentrations. In addition, TBP was shown to have a potent inhibitory activity toward SERCA, with 10 μM producing a near-complete inhibition of thapsigargin-sensitive SERCA.10 The slow rise of [Ca2+]i leading to a sustained secondary amplitude seen in RYR-null and RYR1-expressing cells could be fully explained by SERCA pump inhibition that led to the leak of Ca2+ from SR/ER stores into the cytoplasm. However, the lack of an initial rapid RYR1-dependent [Ca2+]i rise, as seen with caffeine challenge, was unexpected.
Table 1.
Concentration-Effect Parameters for Cytoplasmic Ca2+ Responses Measured in HEK 293 Cells That Are Either RyR-Null or RYR1-Expressing Induced by 2μM TBP in the Presence/Absence of Caffeinea
| Cell Type | [Ca2+]e Buffer | Caffeine (μM) | Initial Rate | Initial Peak Amplitude | Secondary Peak Amplitude | |||
|---|---|---|---|---|---|---|---|---|
|
| ||||||||
| EC50 (μM) [95% CI] | Max. Response Rate ± SEM | EC50 (μM)[95% CI] | Max. Response (%) ± SEM | EC50 (μM)[95% CI] | Max.Response (%) ± SEM | |||
| HEK 293 RYR-null | 0.3 mM Ca2+ | 0 | NA | 0.003 ±0.007 | NA | 4.4 ±1.6 | 0.5 [NA] | 43.6 ±11.3 |
| 100 | 1.1 [NA] | 0.005 ±0.002 | 0.9 [0.8 to 1.1] | 12.4 ±1.7 | 0.5 [NA] | 60.9 ±9.2 | ||
|
| ||||||||
| 2.3 mM Ca2+ | 0 | NA | 0.003 ±0.001 | 0.9 [NA] | 10.6 ±2.2 | 0.5 [NA] | 61.3 ±8.0 | |
| 100 | NA | 0.007 ±0.001 | 0.7 [NA] | 10.0 ±0.8 | 0.4 [0.3 to 1.3] | 75.5 ±7.4 | ||
|
| ||||||||
| HEK 293 RYR1 - expressing | 0.3 mM Ca2+ | 0 | NA | 0.020 ±0.003 | NA | 26.1 ±7.5 | 0.6 [0.3 to NA] | 28.5 ±4.8 |
| 100 | 1.2 [0.75 to NA] | 0.176 ±0.003 | 1.3 [0.8 to NA] | 126.7 ±15.0 | 1.0 [0.6 to NA] | 53.3 ±29.0 | ||
|
| ||||||||
| 2.3 mM Ca2+ | 0 | NA | 0.020 ±0.001 | 1.3 [NA to 2.8] | 25.7 ±2.4 | 1.8 [0.6 to NA] | 66.1 ±3.1 | |
| 100 | NA | 0.182 ±0.002 | NA | 101.1 ±10.3 | 1.0 [0.5 to NA] | 52.3 ±36.0 | ||
CI: confidence interval; SEM: standard error of mean; EC50: concentration at which 50% of maximal effect is observed; and NA: not applicable.
Figure 3.
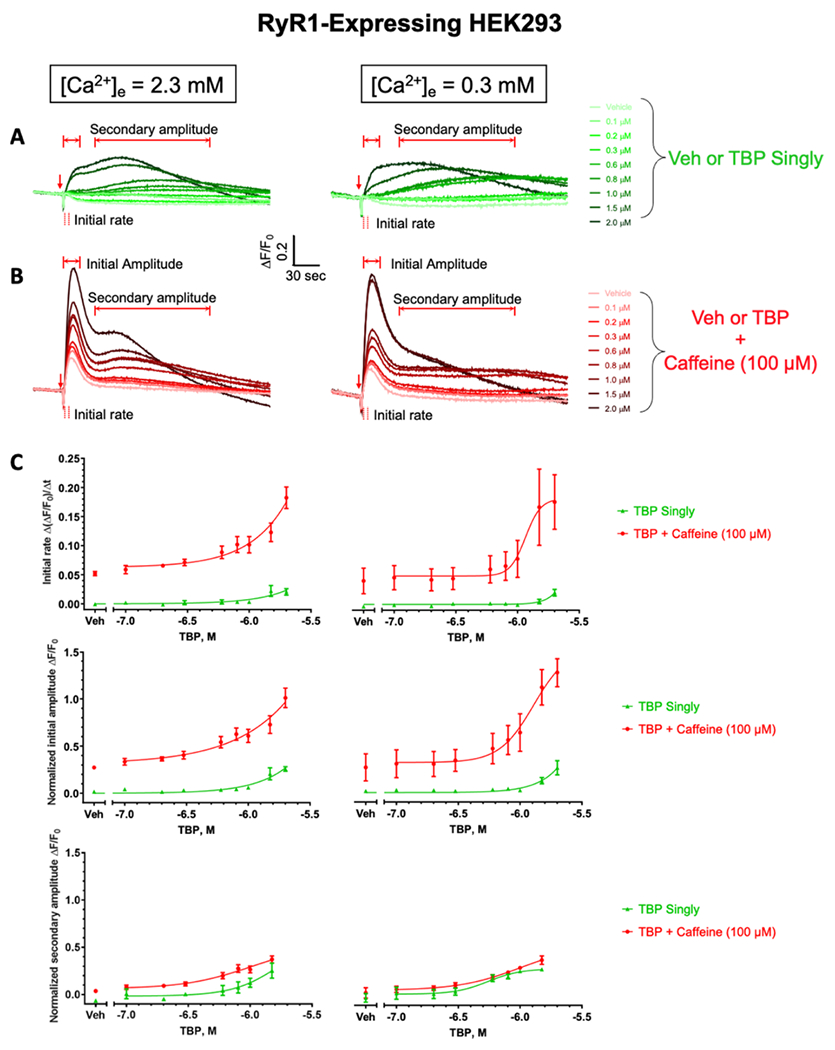
Effects of TBP exposure on resting intracellular Ca2+ in RYR1-expressing HEK 293 cell lines. Under two extracellular Ca2+ conditions (i.e., 2.3 vs 0.3 mM), the representative intracellular Ca2+ traces of RYR1-expressing HEK 293 cells in response to the addition of Veh or TBP without caffeine (A, green) and with 100 μM caffeine (B, red). The red arrows indicate timepoints when the compound was added. Summary data for initial rates and amplitudes shown in (C) were derived from 3 separate culture days with four replicates each and expressed as mean ± SEM. Calculation details of the initial rate are shown in Figure S2A–C. When appropriate, data were fitted with four-parameter nonlinear regression with GraphPad 7.03. Veh denotes 0.1% DMSO.
Figure 4.
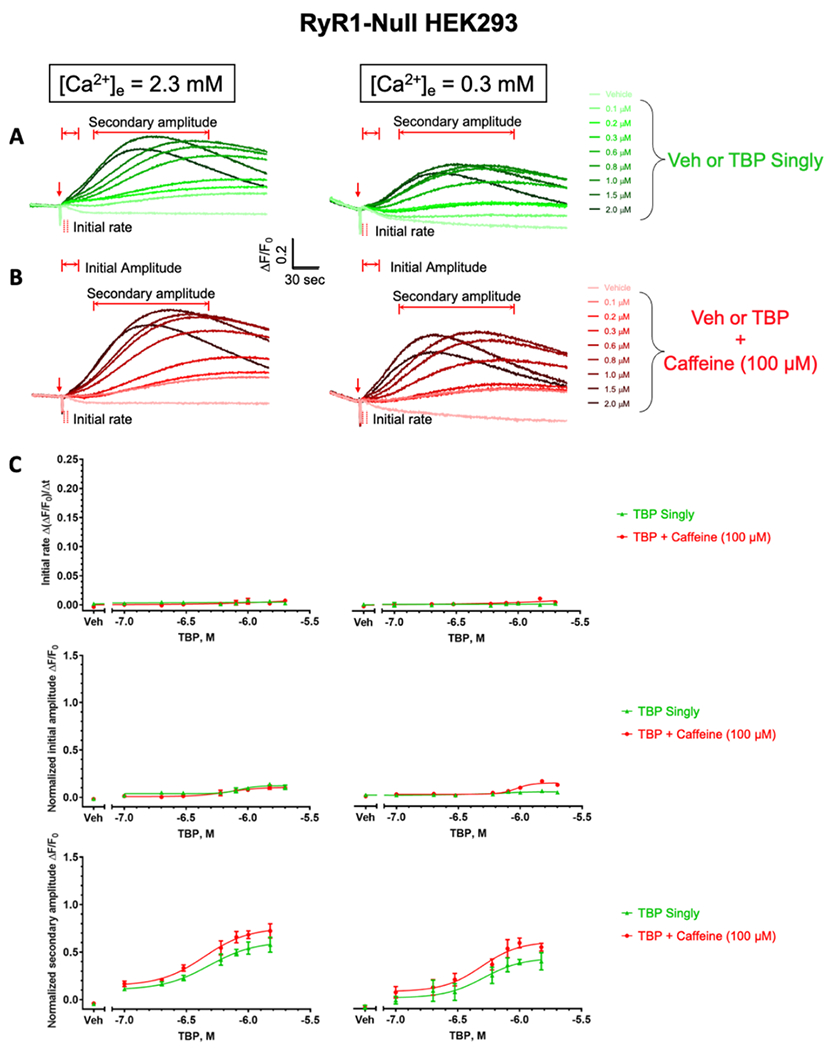
Effects of TBP exposure on resting intracellular Ca2+ in RYR-null HEK 293 cell lines. Under two external Ca2+ conditions (i.e., 2.3 vs 0.3 mM), the representative intracellular Ca2+ traces of RYR1-expressing HEK 293 cells in response to the addition of Veh or TBP without caffeine (A, green) and with 100 μM caffeine (B, red). The red arrows indicate timepoints when the compound was added. The initial rates and normalized initial and secondary amplitudes are summarized in (C), and data expressed as mean ± standard error of mean (SEM) were derived from 3 separate culture days, with four replicates each culture. Calculation details of initial rate are shown in Figure S2D–F. When appropriate, data were fitted with four-parameter nonlinear regression with GraphPad 7.03. Veh denotes 0.1% DMSO.
We posited that quiescent HEK 293 maintained its [Ca2+]i well below the threshold needed for TBP to elicit a caffeine-like activation of RYR1. In this regard, [3H]ryanodine-binding experiments with a number of BrPyr previously reported were performed in the presence of 2 μM free Ca2+,10 a concentration known to partially activate RYR1 in biochemical experiments and well above those maintained in resting HEK 293 cells (<100 nM).38
Since caffeine has long been known to shift the Ca2+-dependence of RYR1 channel activation to the left, thereby sensitizing the channels to other modulators,39 RYR-null and RYR1-expressing cells were exposed to caffeine (100 μM) in combination with TBP (0.1–2 μM). With these experimental conditions, TBP potentiated the caffeine-triggered rapid rise in [Ca2+]i, significantly increasing both the rate of initial rise measured over the first 3 s after addition and the amplitude of the initial peak in a manner dependent on the concentration of TBP, regardless of whether the measurements were made in replete (2.3 mM) or depleted (0.3 mM) [Ca2+]e (Table 1 and Figures 3B,C and S2). Compared to caffeine alone measured in replete [Ca2+]e, the presence of 2 μM TBP enhanced the initial rate by 3.50-fold (from 0.05202 to 0.1822 ΔF/F0/Δt; p = 0.0023) and the respective normalized initial amplitude by 3.62-fold (from 0.2729 to 1.011 ΔF/F0; p = 0.0021). By comparison, TBP in the presence of caffeine tested on cells in depleted [Ca2+]e increased the initial rate by 4.44-fold (from 0.04029 to 0.1759 ΔF/F0/Δt; p = 0.0314) and the initial amplitude by 4.78-fold (from 0.2652 to 1.267 ΔF/F0; p = 0.0084). Thus, TBP greatly potentiated rapid responses to caffeine by a mechanism independent of Ca2+ entry, presumably by directly sensitizing RYR1.
The observation that exposure of RYR-null cells to TBP and caffeine failed to elicit a rapid response strongly supported our conclusion (Figures 4B,C and S2). Moreover, the slower secondary response attributed to the SERCA pump inhibition by TBP was unresponsive to the presence of caffeine, [Ca2+]i, or RYR-expression.
Collectively, the results observed in a reduced heterologous expression cell model further support the fact that TBP selectively targets two intracellular molecular targets that work in an opposing manner to shape intracellular Ca2+ signals. We proceeded to test whether TBP and four additional BrPyr or analogues disrupt Ca2+-signaling dynamics in a more complex primary NGCs model.
BrPyr Alter Ca2+ Dynamics and Are Toxic to Murine NGCs.
Considering two actions of TBP observed in the HEK 293 cell model, (1) amplification of rapid caffeine-triggered Ca2+ release observed only in RYR1-expressing cells and (2) sustained elevation of cytoplasmic Ca2+ at higher concentrations observed in both RYR1-expressing and RYR-null cells, we proceeded to compare the influences of ryanodine and five pyrroles (Figure 1) for their ability to modify SCO in a mature cortical NGCs model described previously.35,40 We and others have shown the importance of glial cells in the developmental trajectory of neurons in the culture as their responsiveness to chemical agents.35 ICC was therefore performed at 7 DIV and indicated that glial fibrillary acidic protein (GFAP) positive glial cells constituted 3–4% of the total cell population with the remainder being microtubule-associated protein 2B (MAP2B) positive neurons (Figure 5A,B). In order to verify that this culture model was responsive to ryanodine and establish face validity, the cocultures were acutely exposed to ryanodine ranging from 1 to 300 μM (Figure 5C,D).
Figure 5.
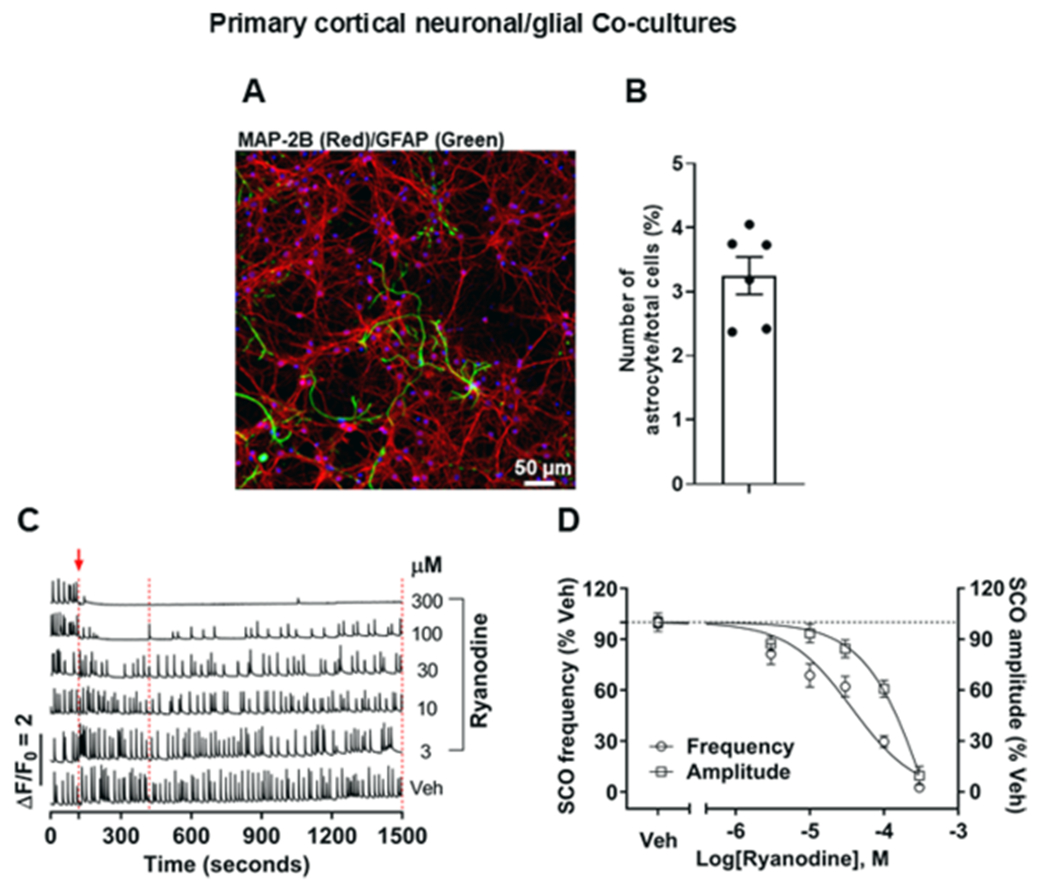
Cellular composition and functional responses to ryanodine of the cortical NGCs model. (A) Representative ICC image showing the presence and proportion of GFAP-positive glia and MAP2B-positive neurons (green: astrocytes and red: neurons). (B) Quantification of the number of astrocytes and neurons to determine the ratio at 7 DIV. Data expressed as mean ± SEM from two independent cultures with three replicate wells for each culture, and each date point represents the average of three randomly selected positions in each well. (C) SCOs obtained from representative wells in the same 96-well plate in the presence or absence of ryanodine exposure. The red arrow together with the dotted red line at 120 s indicates the timepoint when Veh or ryanodine was added. The data bracketed by two additional dashed lines were analyzed and are summarized in (D). (D) SCO data presented as normalized frequency (left Y-axis) and amplitude (right Y-axis), respectively. The dotted black line parallel to the X-axis in (E) indicates 100% of Veh. Data expressed as mean ± SEM were from three independent cultures, with six replicates for each culture. Three-parameter nonlinear regression was used to fit the curves with GraphPad 7.03. Veh denotes 0.1% DMSO.
Acute exposure of cultures at 7 DIV to ryanodine inhibits both neuronal SCO frequency and amplitude in a concentration-dependent manner (IC50 of 36.8 μM; 95% CI: 18.7–71.0 μM and 470.8 μM; 95% CI: 191.1–3853.0 μM, respectively) (Figure 5C,D). Complete inhibition of the SCO activity was achieved with 300 μM ryanodine within 10 s of exposure (Figure 5D). Considering the high specificity of ryanodine for RYRs, these results underscore the importance of ryanodine-sensitive ER Ca2+ channels in regulating the SCO activity within cortical neuronal networks. Importantly, ryanodine did not alter baseline cytoplasmic Ca2+ even at the highest concentration tested (300 μM), a finding consistent with its RYR specificity and lack of direct SERCA pump inhibition.
In contrast to ryanodine, TBP showed more than 10-fold greater potency toward inhibiting SCO frequency and reducing SCO amplitude (IC50 = 0.22 μM; 95% CI: 0.19–0.25 and 0.39 μM; 95% CI: 0.34–0.44, respectively) (Figure 6A,B). The complete inhibition of the SCO activity was achieved with 1 μM TBP within the first 100 s of exposure. A similar inhibitory profile was observed with the acute exposure of the cultures to 2,3,5-tribromopyrrole (compound 2), albeit with significantly lower potency than TBP (p < 0.001 for both frequency and amplitude) with IC50 values of 0.88 (95% CI: 0.79–0.97) and 1.13 μM (95% CI: 1.07–1.20) for frequency and amplitude, respectively (Figure 6C,D). The SCO inhibitory actions of TBP occurred in the absence of any measurable alteration in neuronal network ESA measured using MEA (Figure S3).
Figure 6.
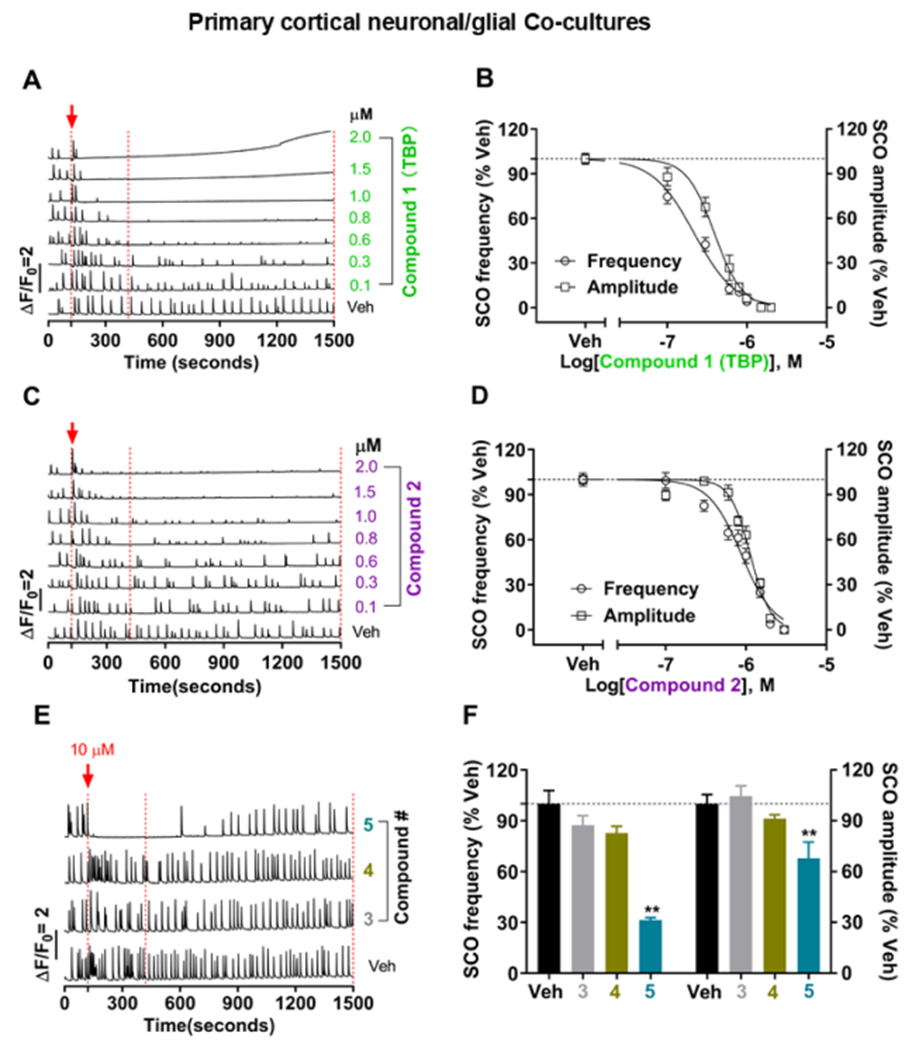
Structure–activity relationship of pyrrole congeners toward inhibiting the SCO activity in cortical neuronal networks. (A,C,E) show the representative traces of SCO patterns in the presence of Veh or compounds 1–5. The red arrows together with the dotted red lines indicate when Veh or the test compound was added. The data bracketed by the two additional dotted red lines were then analyzed and correspondingly summarized in (B,D,F) as shown in frequency and amplitude, respectively. The black dotted lines parallel to the X-axis in the right panels indicate 100% of Veh. Data expressed as mean ± SEM were from three independent cultures, with six replicates each. Four-parameter nonlinear regression was used to fit the curves. One-way ANOVA followed by the Bonferroni’s multiple comparison test was used to determine the statistical difference of mean between Veh- and test compound-treated groups with GraphPad 7.03, as indicated by **p < 0.01 vs Veh. Veh denotes 0.1% DMSO.
Unlike TBP, 2 μM compound 2 did not fully inhibit SCO events, suggesting lower efficacy. Interestingly, 10 μM compound 5 (ethyl 4-bromopyrrole-2-carboxylate) transiently eliminated the SCO activity for the first 600 s, although SCO frequency recovered to 68.59% (p < 0.001 vs Veh) and as did SCO amplitude to 32.13% (p < 0.05 vs Veh) by the end of the exposure period (Figure 6E,F). Two additional pyrroles, pyrrole (3) and 2,3,4-tribromopyrrole (4), were tested and found to lack activity at the highest concentration tested (10 μM) (Figure 6E,F).
Collectively, these results indicate that two ortho-bromine substituents are necessary for BrPyr to confer effects on SCO activity, with meta-bromine substituents further enhancing the effects, consistent with the SAR found in the previous receptor and Ca2+ flux studies with BrPyr.10 However, compound 5 was previously shown to have negligible impact toward RYR and SERCA,10 suggesting that its activity at the cellular level is likely to have distinct mechanisms.
Nevertheless, four of the BrPyr tested for the SCO activity closely follow the SAR previously reported using [3H]-ryanodine-binding analysis,10 suggesting that they were mediated by selective interaction with RYRs when tested at submicromolar concentrations. The inhibition of SCO events seen with exposure to ryanodine, TBP, or compound 2 in the coculture model adds further support that these compounds share a common mechanism of ER Ca2+ dysregulation. Indeed, TBP amplifies caffeine-triggered Ca2+ only in RYR1-expressing HEK 293 cells but not in their RYR-null counterpart. Although neither TBP nor compound 2 at ≤1μM produced a measurable elevation in baseline resting Ca2+ in the cortical NGCs, exposure to >1 μM TBP revealed a gradual rise in resting Ca2+, especially evident in the presence of cells exposed to 2 μM (Figure 6A, top trace). We posited that such an effect could stem from the inhibition of SERCA pumps as predicted from results from RYR-null HEK 293 cells (Figure 4) and previous biochemical studies.10
To further test this hypothesis, cortical NGCs were exposed to >1.0 μM of TBP or compound 2. Both TBP and compound 2 caused persistent elevation in intracellular baseline Ca2+ in cortical neurons whose onset was concentration-dependent (Figure 7A,B). The EC50 measured from area under the curves (AUCs) as described in the Materials and Methods part of the Supporting Information indicates that TBP was significantly more potent at producing a sustained elevation than compound 2 did (EC50 = 7.7 μM, 95% CI: 3.8–15.9 vs 17.3 μM, 95% CI: 14.1–21.9), respectively (p < 0.0001).
Figure 7.
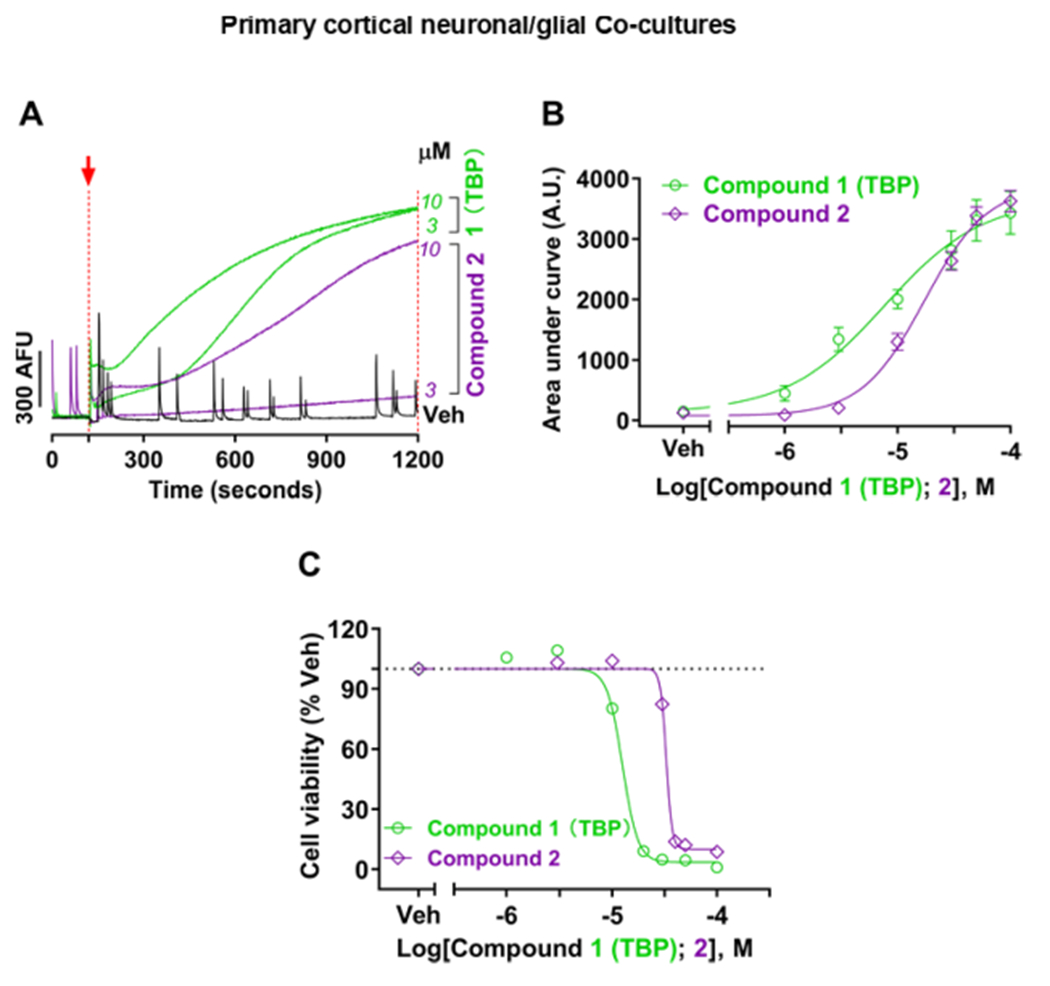
Influence of two exemplary BrPyrs on the elevation of intracellular Ca2+ and neurotoxicity in cortical neuronal networks. Cells were exposed to BrPyr congeners TBP and 2 at concentrations higher than those needed to fully inhibit the SCO activity. (A) Typical traces of sustained intracellular Ca2+ elevation in the presence of Veh (black), TBP (green), or compound 2 (purple). The red arrow and dotted line indicate the timing when the test compound or Veh was introduced. AUCs between two red broken lines from 120 to 1200 s were analyzed, summarized, and fitted in (B) as a function of the log value of concentrations tested. (C) Neuronal viability curves when subchronically exposed to TBP (green) or 2 (purple) for 24 h. The black dotted line parallel to the X-axis indicates 100% of Veh. All the data expressed as mean ± SEM were from three independent cultures, with six replicates each. Four-parameter nonlinear regression was used to fit the curves with GraphPad 7.03. Veh denotes 0.1% DMSO.
TBP and compound 2 have also been identified as cytotoxic disinfectant byproducts, with both cytotoxic and genotoxic activities in Chinese Hamster Ovary (CHO) cells13 and developmental toxicity in a marine invertebrate polychaete.15 In addition, TBP was recently reported to induce mortality of various phytoplankton species11 and reduce the survivorship and development of larval urchin at nanomolar concentrations.30 We therefore assessed whether exposure to TBP or compound 2 was subacutely (24 h) toxic to mammalian cortical NGCs. Figure 7C shows that both BrPyr were neurotoxic in the low μM concentrations with TBP being significantly more potent (p < 0.0001) than compound 2 [halfmaximal toxic concentrations TC50 = 12.6 μM (95% CI: 12.0–13.1) and 32.8 μM (95% CI: 31.7–33.5), respectively]. It is worth noting that compared to previous findings reporting a TC50 of 60.6 μM at 72 h exposure of CHO cells, compound 2 was a more potent neurotoxicant in the cortical NGC model, implying that neuronal networks might be especially sensitive to these compounds and similar BrPyr of marine and anthropogenic origin.
The present results provide the first evidence that acute exposure to exemplary BrPyr of potential concern to environmental and human health elicits two neurotoxic actions in a mammalian NGCs model, (i) inhibition of SCO activities at submicromolar concentrations that mimic those seen with acute exposure to ryanodine and (ii) at higher concentrations, persistently elevate cytoplasmic Ca2+ consistent with the inhibition of SERCA pumps that prevents resequestration of Ca2+ into the ER lumen. Evidence for both of these mechanisms was previously provided in biochemical studies and is likely working in a feedforward manner to promote acute neurotoxicity.10 The neurodevelopmental ramifications of RYR-mediated disruption of neuronal network activity by POPs, including PCBs and PBDEs, and their potential contribution to neurodevelopmental deficits have been recently reviewed.4,41,42 The added risk contributed by current levels of RYR-active PCB congeners found in aquatic ecosystems was recently calculated and a multiple mechanistic neurotoxic equivalency scheme was proposed to better predict risk.43 Evidence for the additivity of the PCBs, PBDEs, and related halogenated organics has been demonstrated.44 Whether BrPyr interact with distinct or overlapping binding sites to these POPs remains to be determined. It should be noted, however, that the pyrrole moiety of ryanodine is a major factor in orienting ryanodine within its binding pockets on RYR145 and defining its biological activity and selectivity amongst target species.46
Although BrPyr, regardless of their origin, are more chemically labile than PCBs and PBDEs in the environment to qualify classification as POPs, the two exemplary examples TBP and 2 investigated here have indeed been detected in waste and drinking water treatment streams and the membrane bioreactor cleaning process during wastewater treatment.13,15,29 Thus, BrPyr should be considered emerging pollutants with the potential of contributing genotoxic, carcinogenic, and neurotoxic risk not only to animal cells13 (including mammalian cells shown in this paper) but also capable of a broad-spectrum cytotoxicity to phytoplankton species11 and other marine species.15,30
Notably, the usage of seawater as toilet flushing water has increased with increasing demand along coastal areas currently approximated at 50% of the world population.31,47 As a result, substantial amounts of TBP, tribromopyrroles, tribromochloropyrroles, and tribromoiodopyrroles are anticipated to be produced as a result of incorporating seawater in wastewater treatment processes. BrPyr have been estimated to have a concentration ranging from nanogram/liter to microgram/liter,48 concentrations equivalent to those capable of altering Ca2+-signaling dynamics shown in the current study.
Finally, new sources of anthropogenic halopyrroles are emerging as potential insecticides that target invertebrate RYRs. For example, pyrrole-2-carboxamides are being considered for insecticidal development and recently shown to a share a binding domain with widely used anthranilic diamide insecticides.49 Notably, anthranilic diamides have recently been shown to interact with mammalian RYRs.50,51
Taken together, BrPyr and related halopyrroles may have broader ramifications to ecological and environmental health. The disruption of RYR-regulated signaling pathways has also been implicated in the induction and progression of idiopathic neurodegenerative diseases, such as Alzheimer’s disease.52–55
One limitation of the present work is that the experiments were conducted in vitro and await verification that the predicted outcomes can be demonstrated in vertebrates in vivo. What is also not clear is the role that astrocyte plays in response to BrPyr exposures. Additionally, our current neuronal model, which pooled male and female brains for preparing the NGC model, does not address potential differences in susceptibility between males and females.
Supplementary Material
ACKNOWLEDGMENTS
The authors acknowledge the work of Dr. Diptiman Bose for establishing the RyR1-HEK 293 line. This project was supported by grants OCE-1840842 and OCE-1837116 from the National Science Foundation and 1R01 ES030318 and 1R01 ES030316 from the National Institute of Environmental Health Sciences and China Scholarship Council (CSC 201507060027 to J.Z.).
Footnotes
Supporting Information
The Supporting Information is available free of charge at https://pubs.acs.org/doi/10.1021/acs.est.1c05214.
Detailed description of chemicals and reagents used, methods of the Null/HEK-RyR1 cell lines culture, validation and intracellular Ca2+ measurement, primary cortical neuronal culture, neuronal intracellular Ca2+ measurement, and neuronal ESA and viability measurements. (PDF)
Complete contact information is available at: https://pubs.acs.org/10.1021/acs.est.1c05214
The authors declare no competing financial interest.
Contributor Information
Jing Zheng, Department of Molecular Biosciences, School of Veterinary Medicine, University of California, Davis, California 95616, United States.
Shane Antrobus, Department of Molecular Biosciences, School of Veterinary Medicine, University of California, Davis, California 95616, United States.
Wei Feng, Department of Molecular Biosciences, School of Veterinary Medicine, University of California, Davis, California 95616, United States.
Trevor N. Purdy, Center for Marine Biotechnology and Biomedicine, Scripps Institution of Oceanography, and Skaggs School of Pharmacy and Pharmaceutical Sciences, University of California, San Diego, California 92037, United States
Bradley S. Moore, Center for Marine Biotechnology and Biomedicine, Scripps Institution of Oceanography, and Skaggs School of Pharmacy and Pharmaceutical Sciences, University of California, San Diego, California 92037, United States.
Isaac N. Pessah, Department of Molecular Biosciences, School of Veterinary Medicine, University of California, Davis, California 95616, United States.
REFERENCES
- (1).Mello FV; Kasper D; Alonso MB; Torres JPM Halogenated natural products in birds associated with the marine environment: A review. Sci. Total Environ 2020, 717, 137000. [DOI] [PubMed] [Google Scholar]
- (2).Agarwal V; Miles ZD; Winter JM; Eustáquio AS; El Gamal AA; Moore BS Enzymatic halogenation and dehalogenation reactions: Pervasive and mechanistically diverse. Chem. Rev 2017, 117, 5619–5674. [DOI] [PMC free article] [PubMed] [Google Scholar]
- (3).Pessah IN; Cherednichenko G; Lein PJ Minding the calcium store: Ryanodine receptor activation as a convergent mechanism of PCB toxicity. Pharmacol. Therapeut 2010, 125, 260–285. [DOI] [PMC free article] [PubMed] [Google Scholar]
- (4).Pessah IN; Lein PJ; Seegal RF; Sagiv SK Neurotoxicity of polychlorinated biphenyls and related organohalogens. Acta Neuropathol 2019, 138, 363–387. [DOI] [PMC free article] [PubMed] [Google Scholar]
- (5).Vaillancourt FH; Yeh E; Vosburg DA; Garneau-Tsodikova S; Walsh CT Nature’s inventory of halogenation catalysts: Oxidative strategies predominate. Chem. Rev 2006, 106, 3364–3378. [DOI] [PubMed] [Google Scholar]
- (6).Agarwal V; El Gamal AA; Yamanaka K; Poth D; Kersten RD; Schorn M; Allen EE; Moore BS Biosynthesis of polybrominated aromatic organic compounds by marine bacteria. Nat. Chem. Biol 2014, 10, 640–647. [DOI] [PMC free article] [PubMed] [Google Scholar]
- (7).El Gamal A; Agarwal V; Diethelm S; Rahman I; Schorn MA; Sneed JM; Louie GV; Whalen KE; Mincer TJ; Noel JP; Paul VJ; Moore BS Biosynthesis of coral settlement cue tetrabromopyrrole in marine bacteria by a uniquely adapted brominase-thioesterase enzyme pair. Proc. Natl. Acad. Sci. U. S. A 2016, 113, 3797–3802. [DOI] [PMC free article] [PubMed] [Google Scholar]
- (8).Agarwal V; Blanton JM; Podell S; Taton A; Schorn MA; Busch J; Lin Z; Schmidt EW; Jensen PR; Paul VJ; Biggs JS; Golden JW; Allen EE; Moore BS Metagenomic discovery of polybrominated diphenyl ether biosynthesis by marine sponges. Nat. Chem. Biol 2017, 13, 537–543. [DOI] [PMC free article] [PubMed] [Google Scholar]
- (9).El Gamal A; Agarwal V; Rahman I; Moore BS Enzymatic reductive dehalogenation controls the biosynthesis of marine bacterial pyrroles. J. Am. Chem. Soc 2016, 138, 13167–13170. [DOI] [PMC free article] [PubMed] [Google Scholar]
- (10).Zheng J; McKinnie SMK; El Gamal A; Feng W; Dong Y; Agarwal V; Fenical W; Kumar A; Cao Z; Moore BS; Pessah IN Organohalogens naturally biosynthesized in marine environments and produced as disinfection byproducts alter sarco/endoplasmic reticulum Ca2+ dynamics. Environ. Sci. Technol 2018, 52, 5469–5478. [DOI] [PMC free article] [PubMed] [Google Scholar]
- (11).Whalen KE; Kirby C; Nicholson RM; O’Reilly M; Moore BS; Harvey EL The chemical cue tetrabromopyrrole induces rapid cellular stress and mortality in phytoplankton. Sci. Rep 2018, 8, 15498. [DOI] [PMC free article] [PubMed] [Google Scholar]
- (12).Alker AT; Delherbe N; Purdy TN; Moore BS; Shikuma NJ Genetic examination of the marine bacterium Pseudoalteromonas luteoviolacea and effects of its metamorphosis-inducing factors. Environ. Microbiol 2020, 22, 4689–4701. [DOI] [PMC free article] [PubMed] [Google Scholar]
- (13).Richardson SD; Thruston AD; Rav-Acha C; Groisman L; Popilevsky I; Juraev O; Glezer V; McKague AB; Plewa MJ; Wagner ED Tribromopyrrole, brominated acids, and other disinfection byproducts produced by disinfection of drinking water rich in bromide. Environ. Sci. Technol 2003, 37, 3782–3793. [DOI] [PubMed] [Google Scholar]
- (14).Richardson SD; Plewa MJ; Wagner ED; Schoeny R; Demarini DM Occurrence, genotoxicity, and carcinogenicity of regulated and emerging disinfection by-products in drinking water: A review and roadmap for research. Mutat. Res 2007, 636, 178–242. [DOI] [PubMed] [Google Scholar]
- (15).Yang M; Zhang X Halopyrroles: A new group of highly toxic disinfection byproducts formed in chlorinated saline wastewater. Environ. Sci. Technol 2014, 48, 11846–11852. [DOI] [PubMed] [Google Scholar]
- (16).Haraguchi K; Hisamichi Y; Endo T Bioaccumulation of naturally occurring mixed halogenated dimethylbipyrroles in whale and dolphin products on the Japanese market. Arch. Environ. Contam. Toxicol 2006, 51, 135–141. [DOI] [PubMed] [Google Scholar]
- (17).Hoh E; Dodder NG; Lehotay SJ; Pangallo KC; Reddy CM; Maruya KA Nontargeted comprehensive two-dimensional gas chromatography/time-of-flight mass spectrometry method and software for inventorying persistent and bioaccumulative contaminants in marine environments. Environ. Sci. Technol 2012, 46, 8001–8008. [DOI] [PubMed] [Google Scholar]
- (18).Alonso MB; Maruya KA; Dodder NG; Lailson-Brito J Jr.; Azevedo A; Santos-Neto E; Torres JPM; Malm O; Hoh E Nontargeted screening of halogenated organic compounds in bottlenose dolphins (Tursiops truncatus) from Rio de Janeiro, Brazil. Environ. Sci. Technol 2017, 51, 1176–1185. [DOI] [PMC free article] [PubMed] [Google Scholar]
- (19).Vetter W; Lok B; Schlienz A; Müller M Thorough study of persistent organic pollutants and halogenated natural products in sperm whale blubber through preparative sample cleanup followed by fractionation with countercurrent chromatography. J. Chromatogr. A 2018, 1565, 114–123. [DOI] [PubMed] [Google Scholar]
- (20).Kunisue T; Goto A; Sunouchi T; Egashira K; Ochiai M; Isobe T; Tajima Y; Yamada TK; Tanabe S Anthropogenic and natural organohalogen compounds in melon-headed whales (Peponocephala electra) stranded along the Japanese coastal waters: Temporal trend analysis using archived samples in the environmental specimen bank (es-BANK). Chemosphere 2021, 269, 129401. [DOI] [PubMed] [Google Scholar]
- (21).Wu Q; Schlag S; Uren R; van der Lingen CD; Bouwman H; Vetter W Polyhalogenated compounds (halogenated natural products and POPs) in sardine (Sardinops sagax) from the South Atlantic and Indian Oceans. J. Agric. Food Chem 2020, 68, 6084–6091. [DOI] [PubMed] [Google Scholar]
- (22).Vetter W; Alder L; Kallenborn R; Schlabach M Determination of Q1, an unknown organochlorine contaminant, in human milk, Antarctic air, and further environmental samples. Environ. Pollut 2000, 110, 401–409. [DOI] [PubMed] [Google Scholar]
- (23).Tittlemier SA; Simon M; Jarman WM; Elliott JE; Norstrom RJ Identification of a novel C10H6N2Br4Cl2 heterocyclic compound in seabird eggs. A bioaccumulating marine natural product? Environ. Sci. Technol 1999, 33, 26–33. [Google Scholar]
- (24).Reddy CM; Xu L; O’Neil GW; Nelson RK; Eglinton TI ; Faulkner DJ; Norstrom R; Ross PS; Tittlemier SA Radiocarbon evidence for a naturally produced, bioaccumulating halogenated organic compound. Environ. Sci. Technol 2004, 38, 1992–1997. [DOI] [PubMed] [Google Scholar]
- (25).Thapa HR; Agarwal V Obligate brominating enzymes underlie bromoform production by marine cyanobacteria. J. Phycol 2021, 57, 1131–1139. [DOI] [PubMed] [Google Scholar]
- (26).Tebben J; Tapiolas DM; Motti CA; Abrego D; Negri AP; Blackall LL; Steinberg PD; Harder T Induction of larval metamorphosis of the coral Acropora millepora by tetrabromopyrrole isolated from a Pseudoalteromonas bacterium. PLoS One 2011, 6, No. e19082. [DOI] [PMC free article] [PubMed] [Google Scholar]
- (27).Tebben J; Motti CA; Siboni N; Tapiolas DM; Negri AP; Schupp PJ; Kitamura M; Hatta M; Steinberg PD; Harder T Chemical mediation of coral larval settlement by crustose coralline algae. Sci. Rep 2015, 5, 10803. [DOI] [PMC free article] [PubMed] [Google Scholar]
- (28).Sneed JM; Sharp KH; Ritchie KB; Paul VJ The chemical cue tetrabromopyrrole from a biofilm bacterium induces settlement of multiple Caribbean corals. Proc. Biol. Sci 2014, 281, 20133086. [DOI] [PMC free article] [PubMed] [Google Scholar]
- (29).Cai W; Liu J; Zhang X; Ng WJ; Liu Y Generation of dissolved organic matter and byproducts from activated sludge during contact with sodium hypochlorite and its implications to on-line chemical cleaning in MBR. Water Res 2016, 104, 44–52. [DOI] [PubMed] [Google Scholar]
- (30).Akkipeddi SMK; Xu M; Chan KYK Halogenated compound secreted by marine bacteria halts larval urchin development. J. Exp. Mar. Biol. Ecol 2021, 538, 151540. [Google Scholar]
- (31).Yang M; Liu J; Zhang X; Richardson SD Comparative Toxicity of Chlorinated Saline and Freshwater Wastewater Effluents to Marine Organisms. Environ. Sci. Technol 2015, 49, 14475–14483. [DOI] [PubMed] [Google Scholar]
- (32).Pessah IN; Lehmler H-J; Robertson LW; Perez CF; Cabrales E; Bose DD; Feng W Enantiomeric Specificity of (–)-2,2′,3,3′,6,6′-Hexachlorobiphenyl toward Ryanodine Receptor Types 1 and 2. Chem. Res. Toxicol 2009, 22, 201–207. [DOI] [PMC free article] [PubMed] [Google Scholar]
- (33).Truong KM; Cherednichenko G; Pessah IN Interactions of dichlorodiphenyltrichloroethane (DDT) and dichlorodiphenyldichloroethylene (DDE) with skeletal muscle ryanodine receptor type 1. Toxicol. Sci 2019, 170, 509–524. [DOI] [PMC free article] [PubMed] [Google Scholar]
- (34).Zheng J; Chen J; Zou X; Zhao F; Guo M; Wang H; Zhang T; Zhang C; Feng W; Pessah IN; Cao Z Saikosaponin d causes apoptotic death of cultured neocortical neurons by increasing membrane permeability and elevating intracellular Ca2+ concentration. Neurotoxicology 2019, 70, 112–121. [DOI] [PMC free article] [PubMed] [Google Scholar]
- (35).Cao Z; Xu J; Hulsizer S; Cui Y; Dong Y; Pessah IN Influence of tetramethylenedisulfotetramine on synchronous calcium oscillations at distinct developmental stages of hippocampal neuronal cultures. Neurotoxicology 2017, 58, 11–22. [DOI] [PMC free article] [PubMed] [Google Scholar]
- (36).Zheng J; Yu Y; Feng W; Li J; Liu J; Zhang C; Dong Y; Pessah IN; Cao Z Influence of nanomolar deltamethrin on the hallmarks of primary cultured cortical neuronal network and the role of ryanodine receptors. Environ. Health Perspect 2019, 127, 67003. [DOI] [PMC free article] [PubMed] [Google Scholar]
- (37).Feng W; Zheng J; Robin G; Dong Y; Ichikawa M; Inoue Y; Mori T; Nakano T; Pessah IN Enantioselectivity of 2,2′,3,5′,6-Pentachlorobiphenyl (PCB 95) Atropisomers toward Ryanodine Receptors (RyRs) and Their Influences on Hippocampal Neuronal Networks. Environ. Sci. Technol 2017, 51, 14406–14416. [DOI] [PMC free article] [PubMed] [Google Scholar]
- (38).Murayama T; Kurebayashi N; Yamazawa T; Oyamada H; Suzuki J; Kanemaru K; Oguchi K; Iino M; Sakurai T Divergent activity profiles of type 1 ryanodine receptor channels carrying malignant hyperthermia and central core disease mutations in the amino-terminal region. PLoS One 2015, 10, No. e0130606. [DOI] [PMC free article] [PubMed] [Google Scholar]
- (39).Pessah IN; Stambuk RA; Casida JE Ca2+-activated ryanodine binding: Mechanisms of sensitivity and intensity modulation by Mg2+, caffeine, and adenine nucleotides. Mol. Pharmacol 1987, 31, 232. [PubMed] [Google Scholar]
- (40).Cao Z; Zou X; Cui Y; Hulsizer S; Lein PJ; Wulff H; Pessah IN Rapid Throughput Analysis Demonstrates that Chemicals with Distinct Seizurogenic Mechanisms Differentially Alter Ca2+ Dynamics in Networks Formed by Hippocampal Neurons in Culture. Mol. Pharmacol 2015, 87, 595–605. [DOI] [PMC free article] [PubMed] [Google Scholar]
- (41).Panesar HK; Kennedy CL; Keil Stietz KP; Lein PJ Polychlorinated biphenyls (PCBs): risk factors for autism spectrum disorder? Toxics 2020, 8, 70. [DOI] [PMC free article] [PubMed] [Google Scholar]
- (42).Klocke C; Sethi S; Lein PJ The developmental neurotoxicity of legacy vs. contemporary polychlorinated biphenyls (PCBs): Similarities and differences. Environ. Sci. Pollut. Res. Int 2020, 27, 8885–8896. [DOI] [PMC free article] [PubMed] [Google Scholar]
- (43).Holland EB; Pessah IN Non-dioxin-like polychlorinated biphenyl neurotoxic equivalents found in environmental and human samples. Regul. Toxicol. Pharmacol 2021, 120, 104842. [DOI] [PMC free article] [PubMed] [Google Scholar]
- (44).Holland EB; Feng W; Zheng J; Dong Y; Li X; Lehmler H-J; Pessah IN An extended structure-activity relationship of nondioxin-like PCBs evaluates and supports modeling predictions and identifies picomolar potency of PCB 202 towards ryanodine receptors. Toxicol. Sci 2017, 155, 170–181. [DOI] [PMC free article] [PubMed] [Google Scholar]
- (45).Welch W; Sutko JL; Mitchell KE; Airey J; Ruest L The pyrrole locus is the major orienting factor in ryanodine binding. Biochemistry 1996, 35, 7165–7173. [DOI] [PubMed] [Google Scholar]
- (46).Waterhouse AL; Pessah IN; Francini AO; Casida JE Structural aspects of ryanodine action and selectivity. J. Med. Chem 1987, 30, 710–716. [DOI] [PubMed] [Google Scholar]
- (47).Polunin NVC Aquatic Ecosystems: Trends and Global Prospects; Cambridge University Press: New York, 2008; pp 1–18. [Google Scholar]
- (48).Zhang Z; Zhu Q; Huang C; Yang M; Li J; Chen Y; Yang B; Zhao X Comparative cytotoxicity of halogenated aromatic DBPs and implications of the corresponding developed QSAR model to toxicity mechanisms of those DBPs: Binding interactions between aromatic DBPs and catalase play an important role. Water Res. 2020, 170, 115283. [DOI] [PubMed] [Google Scholar]
- (49).Cordova D; Benner EA; Clark DA; Bolgunas SP; Lahm GP; Gutteridge S; Rhoades DF; Wu L; Sopa JS; Rauh JJ; Barry JD Pyrrole-2 carboxamides - A novel class of insect ryanodine receptor activators. Pestic. Biochem. Physiol 2021, 174, 104798. [DOI] [PubMed] [Google Scholar]
- (50).Truong KM; Pessah IN Comparison of chlorantraniliprole and flubendiamide activity toward wild-type and malignant hyperthermia-susceptible ryanodine receptors and heat stress intolerance. Toxicol. Sci 2019, 167, 509–523. [DOI] [PMC free article] [PubMed] [Google Scholar]
- (51).Ma R; Haji-Ghassemi O; Ma D; Jiang H; Lin L; Yao L; Samurkas A; Li Y; Wang Y; Cao P; Wu S; Zhang Y; Murayama T; Moussian B; Van Petegem F; Yuchi Z Structural basis for diamide modulation of ryanodine receptor. Nat. Chem. Biol 2020, 16, 1246–1254. [DOI] [PubMed] [Google Scholar]
- (52).McDaid J; Mustaly-Kalimi S; Stutzmann GE Ca2+ Dyshomeostasis disrupts neuronal and synaptic function in Alzheimer’s disease. Cells 2020, 9, 2655. [DOI] [PMC free article] [PubMed] [Google Scholar]
- (53).Chami M; Checler F Alterations of the endoplasmic reticulum (ER) calcium signaling molecular components in Alzheimer’s disease. Cells 2020, 9, 2577. [DOI] [PMC free article] [PubMed] [Google Scholar]
- (54).O’Day DH Calmodulin binding proteins and Alzheimer’s disease: Biomarkers, regulatory enzymes and receptors that are regulated by calmodulin. Int. J. Mol. Sci 2020, 21, 7344. [DOI] [PMC free article] [PubMed] [Google Scholar]
- (55).Sun L; Wei H Ryanodine receptors: A potential treatment target in various neurodegenerative disease. Cell. Mol. Neurobiol 2020, 41, 1613–1624. [DOI] [PMC free article] [PubMed] [Google Scholar]
Associated Data
This section collects any data citations, data availability statements, or supplementary materials included in this article.