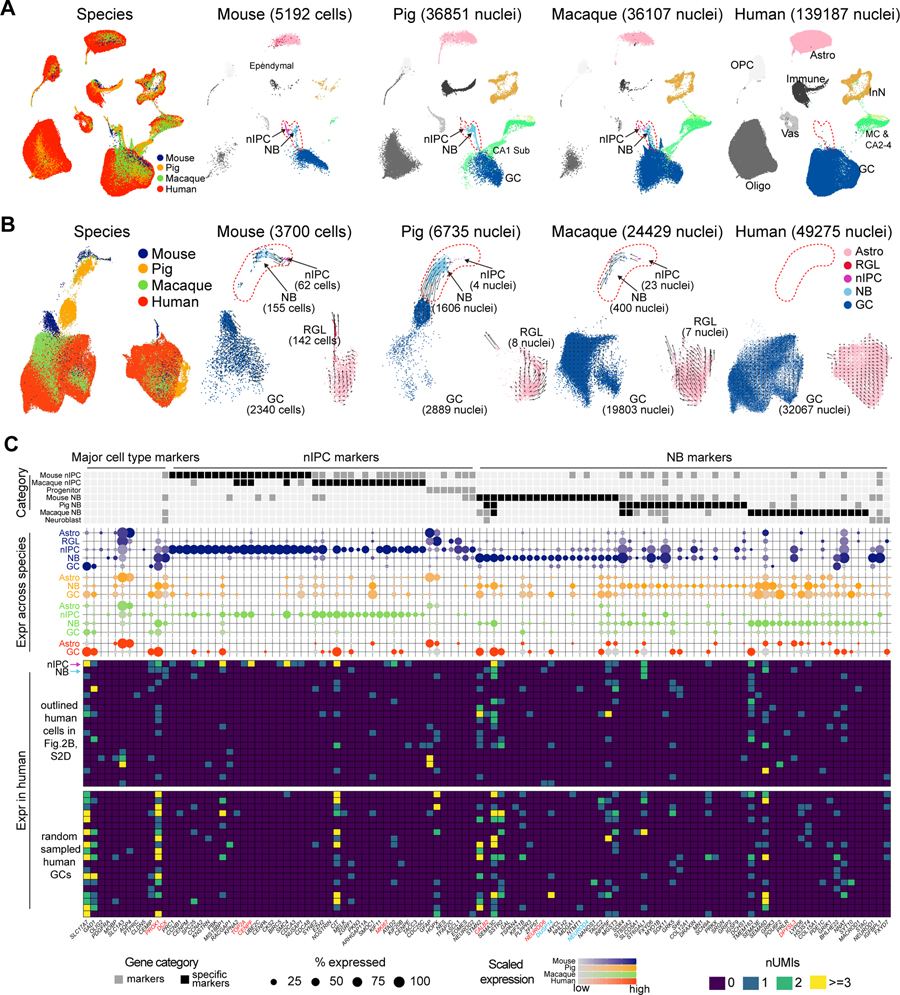
Figure 2. Cross-species analysis of transcriptomic signatures of adult neurogenic trajectories.
A-B, Seurat integration of all DG cells (A) or only astrocytes and the granule cell lineage (B) across species. In B, arrows indicate the direction and speed (arrow length) of the RNA velocity. C, Expression of cluster markers across species. The categories “progenitor” and “neuroblast” were manually annotated (Hochgerner et al., 2018; Berg et al., 2019). Middle: Dot plot depicting the expression of the markers with dots colored by species. Bottom: Marker expression in the 20 human cells residing in the nIPC and neuroblast domain as well as the randomly sampled human granule cells. The first two rows highlighted by arrows represent the two putative human neurogenic cells. RGL, radial-glia like cells; nIPC, neural intermediate progenitor cells; NB, neuroblasts. GC, granule cells; MC, mossy cells; CA2–4, CA2–4 ExN; CA1 Sub, CA1 and Sub ExN. See also Figure S2 and Tables S2.

