

Key Points
Question
Is pegcetacoplan associated with delayed progression of incomplete retinal pigment epithelium (RPE) and outer retina atrophy (iRORA) in eyes with geographic atrophy (GA) secondary to age-related macular degeneration (AMD)?
Findings
This post hoc analysis of a phase 2 randomized clinical trial of 167 patients with GA secondary to AMD who received pegcetacoplan monthly (n = 41) or every other month (n = 56) or a sham injection (n = 70) suggested that rates of progression from iRORA to complete RPE and outer retina atrophy were lower in eyes treated with intravitreal pegcetacoplan monthly or every other month vs sham, after excluding participants who developed exudative AMD or had missing data.
Meaning
These results suggest a potential role for pegcetacoplan treatment during the course of GA.
Abstract
Importance
Change in areas of incomplete retinal pigment epithelium (RPE) and outer retinal atrophy (iRORA) within eyes with geographic atrophy (GA) might reflect similar changes among eyes with drusen but no GA.
Objective
To evaluate the potential association of pegcetacoplan with progression of iRORA in eyes with GA secondary to AMD.
Design, Setting, and Participants
This post hoc analysis of the phase 2 multicenter, randomized, single-masked, sham-controlled FILLY trial of intravitreal pegcetacoplan for 12 months took place from February 2 to July 7, 2020. Participants comprised 167 patients with GA secondary to AMD who received pegcetacoplan monthly (n = 41) or every other month (n = 56) or a sham injection (n = 70) in the FILLY trial, completed the month 12 study visit, and did not develop exudative AMD.
Interventions
Intravitreal pegcetacoplan, 15 mg, or sham injection, monthly or every other month for 12 months.
Main Outcomes and Measures
Masked readers analyzed spectral-domain optical coherence tomography scans in regions beyond a perimeter of 500 μm from the GA border according to the Classification of Atrophy Meetings criteria. Primary outcome measures were progression from iRORA to complete RPE and outer retina atrophy (cRORA) from baseline to 6 and 12 months.
Results
Among the 167 patients in the study, at baseline, iRORA was present in 45.0% of study eyes (18 of 40) in the pegcetacoplan monthly group, 61.8% of study eyes (34 of 55) in the pegcetacoplan every other month group, and 50.7% of study eyes (34 of 67) in the sham group. At 12 months, progression from iRORA to cRORA occurred in 50.0% of study eyes (9 of 18) in the pegcetacoplan monthly group (P = .02 vs sham), 60.6% of study eyes (20 of 33) in the pegcetacoplan every other month group (P = .06 vs sham), and 81.8% of study eyes (27 of 33) in the sham group. Compared with sham treatment, the relative risk of progression at 12 months from iRORA to cRORA was 0.61 (95% CI, 0.37-1.00) for eyes in the pegcetacoplan monthly group and 0.74 (95% CI, 0.54-1.02) for eyes in the pegcetacoplan every other month group.
Conclusions and Relevance
Eyes receiving intravitreal pegcetacoplan had lower rates of progression from iRORA to cRORA compared with controls, suggesting a potential role for pegcetacoplan therapy earlier in the progression of AMD prior to the development of GA.
Trial Registration
ClinicalTrials.gov Identifier: NCT02503332
This post hoc analysis of the FILLY randomized clinical trial evaluates the potential association of pegcetacoplan with progression of incomplete retinal pigment epithelium and outer retina atrophy in eyes with geographic atrophy secondary to age-related macular degeneration.
Introduction
Geographic atrophy (GA) is the advanced stage of dry age-related macular degeneration (AMD) and is characterized by the loss of retinal photoreceptors, retinal pigment epithelium (RPE), and choriocapillaris. Geographic atrophy lesions may initially appear outside the fovea with relatively normal central vision, but vision loss inevitably progresses in eyes with GA; once the central fovea is affected, the rate of vision loss increases precipitously.1,2,3,4 The prevalence of GA increases exponentially with advancing age, affecting an estimated 5 million people worldwide and accounting for about one-fourth of individuals with legal blindness in the United Kingdom and the United States.5 A retrospective study in the UK found that 16% of patients with GA who were not legally blind at their initial visit eventually progressed to blindness, with a median time to progression of 6.2 years (IQR, 3.3-8.5 years).6
Although the cause of GA is multifactorial and not completely understood, several lines of evidence suggest that complement cascade dysfunction plays a role in the pathophysiology of GA.7 Geographic atrophy has been associated with specific genetic variants in complement-associated proteins, and elevated levels of complement proteins and activation products are found in plasma and drusen specimens from patients with GA.7,8,9,10,11 Several clinical trials have investigated the ability of complement inhibitors to reduce the expansion of existing GA lesions. Although 2 phase 3 studies (targeting factor D) failed to show the superiority of a complement inhibitor vs sham for GA lesion growth at 1 year,12 2 recent studies (targeting C3 or C5) have demonstrated the efficacy of complement inhibitors to reduce GA lesion growth.13,14 The FILLY trial assessed the effect of pegcetacoplan, a complement C3 inhibitor, on slowing the growth of existing GA lesions over a 12-month treatment interval. Intravitreal pegcetacoplan dosed monthly or every other month significantly reduced the rate of GA lesion growth by 29% (95% CI, 9%-49%; P = .008) and 20% (95% CI, 0%-40%; P = .07), respectively, compared with sham treatment.13
Despite their benefits, clinical trials of treatments that prevent or reduce progression from intermediate AMD to GA are scarce.15 One reason for this scarcity may be the limitations of structural and functional markers of progression. To facilitate the development of outcome measures that can be used in clinical trials of therapies with the potential to slow progression to GA, the Classification of Atrophy Meetings (CAM) program, comprising an international group of experts, was established.15,16 They have published a classification system and criteria for optical coherence tomography (OCT)–defined anatomic changes present in the earlier stages of AMD and subsequent progression to GA. Of particular interest to this analysis is the definition of a precursor to GA, classified as incomplete RPE and outer retinal atrophy (iRORA) without neovascularization. Geographic atrophy is classified as complete RPE and outer retinal atrophy (cRORA) without neovascularization.
In the FILLY trial, consistent with previous GA treatment trials and regulatory guidance, the primary outcome measure was change in GA lesion area measured by use of serial fundus autofluorescence images.12,13,14,17,18 In addition, spectral-domain OCT (SD-OCT) images were obtained, allowing GA progression to be evaluated using current CAM definitions of AMD staging. The purpose of this post hoc analysis was to assess the association of pegcetacoplan with the progression of iRORA to cRORA in regions of the retina outside of primary GA lesions.
Methods
Design and Intervention
This was a post hoc analysis of the FILLY trial, a phase 2, 18-month, prospective, multicenter, randomized, sham-controlled clinical trial that enrolled participants in the US, Australia, and New Zealand. All participants had AMD, and none received incentives or compensation for participating in the study. The trial is registered with ClinicalTrials.gov (NCT02503332), and the study design and results were published previously13 (trial protocol in Supplement 1 and statistical analysis plan in Supplement 2).
In brief, the FILLY trial evaluated the efficacy and safety of 2 regimens of pegcetacoplan, administered by intravitreal injection, in 246 participants aged 50 years or older with GA secondary to AMD who were randomized in a 2:2:1:1 ratio to receive 15 mg of pegcetacoplan monthly, 15 mg of pegcetacoplan every other month, or sham injection monthly or every other month for 12 months. Participants were randomized using a blocked schedule to ensure balanced treatment allocation within each site. All participants provided written informed consent, and the study protocol was approved before the study start by the New England institutional review board, University of Miami institutional review board, Mayo Clinic institutional review board, Cleveland Clinic Foundation institutional review board, Duke University Health System institutional review board, Stanford University Research Compliance Office, University of Utah institutional review board, Bellberry Ltd institutional review board, and the Northern A Health and Disability Ethics Committee, New Zealand Ministry of Health. If both eyes of a patient met study criteria, the eye with worse visual acuity at the time of screening was designated as the study eye; if both eyes met inclusion criteria and had identical visual acuity, the right eye was designated as the study eye. The study was conducted in accordance with the tenets of the Declaration of Helsinki,19 the International Conference on Harmonisation Good Clinical Practice guidelines, and all applicable regulations. This study followed the Consolidated Standards of Reporting Trials (CONSORT) reporting guideline. Participants included in this analysis met the following prespecified inclusion criteria: completed the month 12 study visit, received all study treatments, and did not develop exudative AMD (eAMD) (Figure 1).
Figure 1. Participant Flow Diagram.

eAMD indicates exudative age-related macular degeneration; iRORA, incomplete retinal pigment epithelium and outer retina atrophy.
CAM Criteria
iRORA and cRORA were defined in this analysis using the OCT criteria established by CAM. The iRORA criteria are as follows: (1) a region of signal hypertransmission into the choroid; (2) a corresponding zone of attenuation or disruption of the RPE, with or without persistence of presumed basal laminar deposits; and (3) evidence of overlying photoreceptor degeneration (ie, subsidence of the inner nuclear layer and outer plexiform layer, presence of a hyporeflective wedge in the Henle fiber layer, thinning of the outer nuclear layer, disruption of the external limiting membrane, disintegrity of the ellipsoid zone, or when these criteria do not meet the definition of cRORA).15 The cRORA criteria are as follows: (1) a region of hypertransmission 250 μm or more in diameter, (2) a zone of attenuation or disruption of the RPE 250 μm or more in diameter, and (3) evidence of overlying photoreceptor degeneration, all occurring in the absence of signs of an RPE tear.16
Grading and Outcome Measures
To stay clear of the already manifested RPE or photoreceptor degeneration, areas outside a 500-μm perimeter from the GA border were analyzed, and iRORA lesions were identified. Lesions were selected based on image quality and the ability to definitively identify iRORA (questionable iRORA lesions were excluded); when more than 5 lesions were present, the first 5 definite iRORA lesions identified by the grader were selected.
iRORA lesions identified at baseline were observed for progression to cRORA at subsequent time points. Spectral-domain OCT images obtained at baseline, month 6, and month 12 (using the Zeiss Cirrus or Heidelberg Spectralis OCT) using 7-line raster scans (30 × 5; 240-mm spacing, 7 sections, automatic real-time set to 25, 1536 A-scans) and volume scans (20 × 20; 120-mm spacing, 49 sections, automatic real-time set to 16, 512 A-scans) were graded following the CAM criteria independently by 2 masked readers at the Doheny Image Reading and Research Lab in Los Angeles, California. A total of 4 graders (including S.B.V., S.L., and A.K.) served as first graders, with a single senior second grader (either M.G.N. or S.B.V.) reviewing all cases in a masked fashion; any differences between the 2 graders were adjudicated by the department director (S.S.), who made the final determination. Interobserver and intraobserver reproducibility data were not collected for this analysis. Readers had access to both baseline and follow-up images, with baseline images graded first (independent of follow-up data). Grading for the primary FILLY trial outcomes was performed by another reading center.
iRORA was defined as a region with hypertransmission into the choroid, attenuation or disruption of the RPE (<250 μm) with or without basal laminar deposits, and evidence of overlying photoreceptor degeneration (Figure 2). cRORA or GA was defined as a region with loss of the RPE band 250 μm or more in diameter, with associated hypertransmission into the choroid 250 μm or more in diameter, and accompanied by features of photoreceptor degeneration consisting of subsidence of the inner nuclear layer and outer plexiform layer and disruption of the internal limiting membrane and the interdigitation zone, ellipsoid zone, and outer photoreceptor bands (Figure 3). The end points for each treatment group were the proportion of study eyes with at least 1 iRORA at baseline that progressed to cRORA at 6 and 12 months and the proportion of individual baseline iRORA lesions that progressed to cRORA lesions at 6 and 12 months.
Figure 2. Incomplete Retinal Pigment Epithelium (RPE) and Outer Retina Atrophy (iRORA) at Baseline in Eyes of 2 Participants.
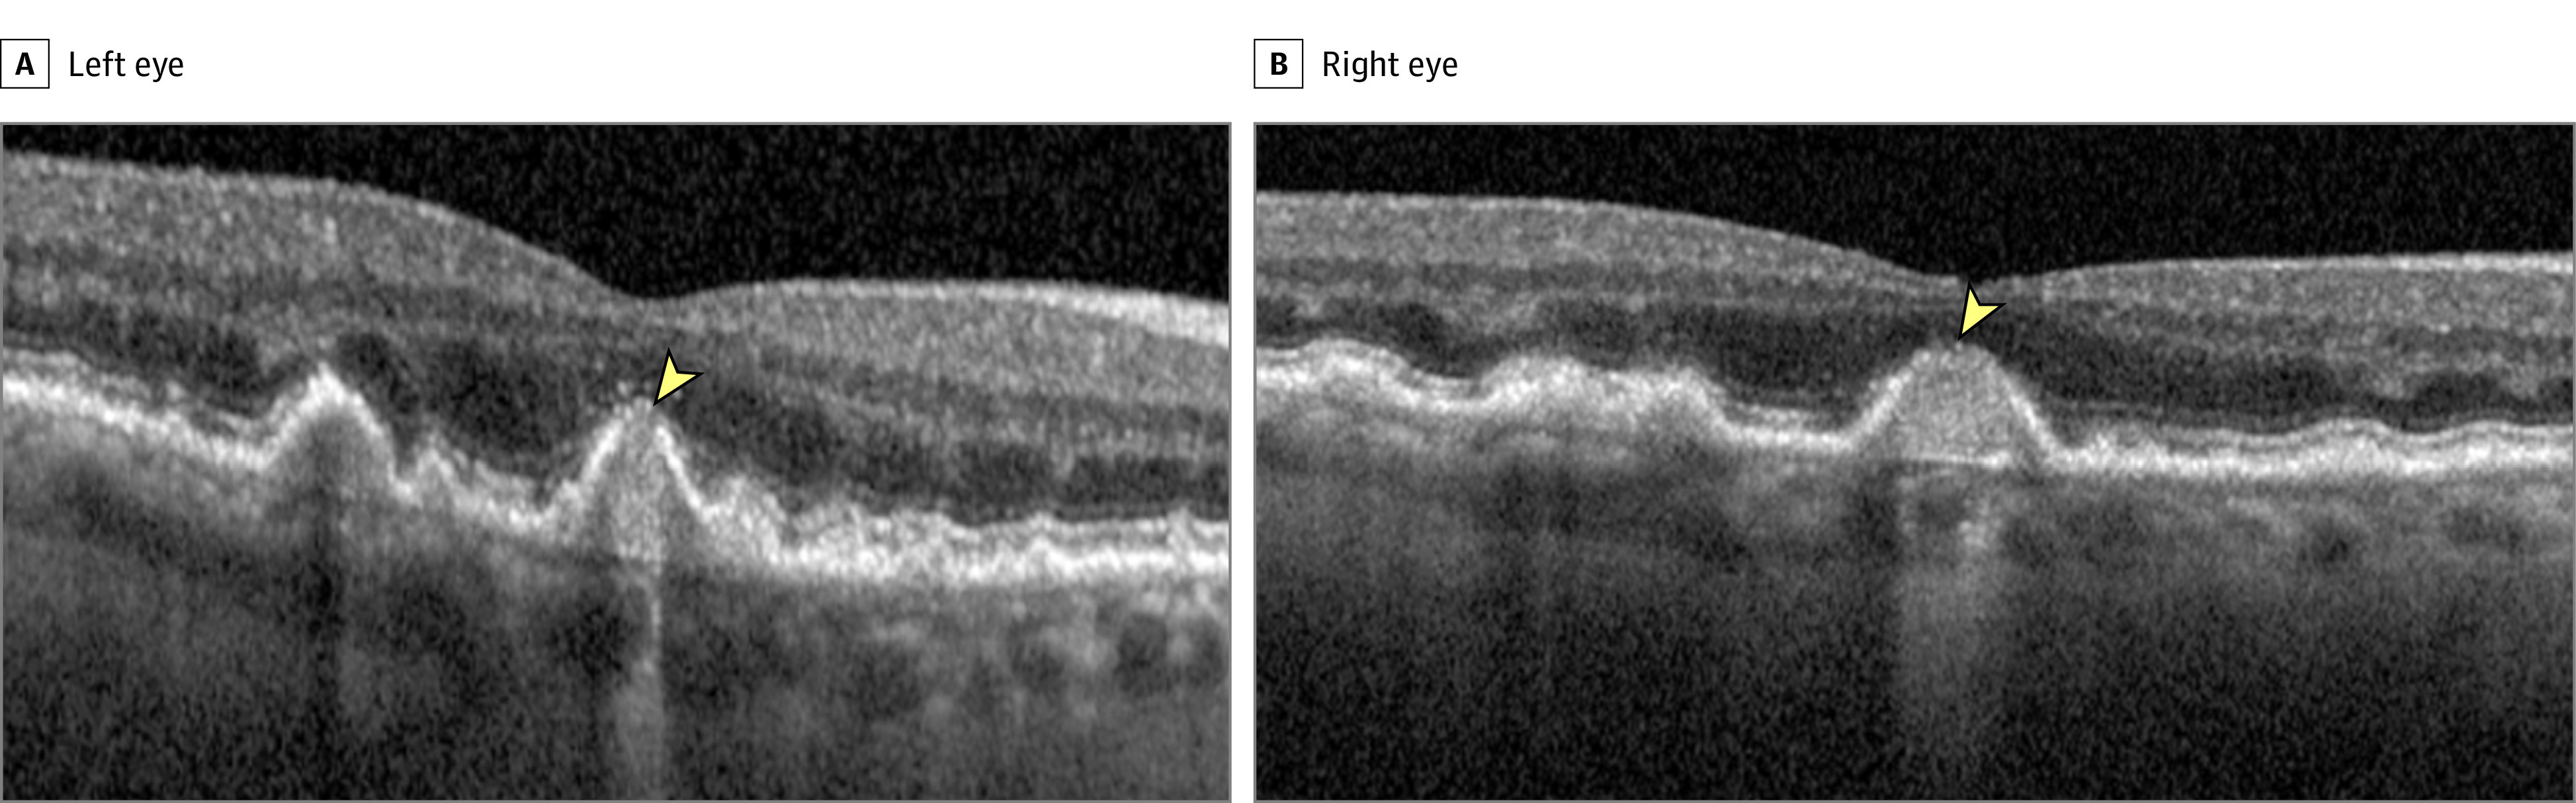
The arrowhead indicates presence of iRORA. RPE disruption and hypertransmission are evident, with some loss of the outer retinal bands at the apex of the lesion. The region of RPE disruption is less than 250 μm in both cases. The case in the left eye is a borderline example; the hypertransmission is 250 μm or more, but there appears to be some partial RPE preservation in the temporal section of the region of hypertransmission, and the zone of RPE disruption is less than 250 μm.
Figure 3. Complete Retinal Pigment Epithelium and Outer Retina Atrophy (cRORA) at Follow-up in Eyes of 2 Participants.
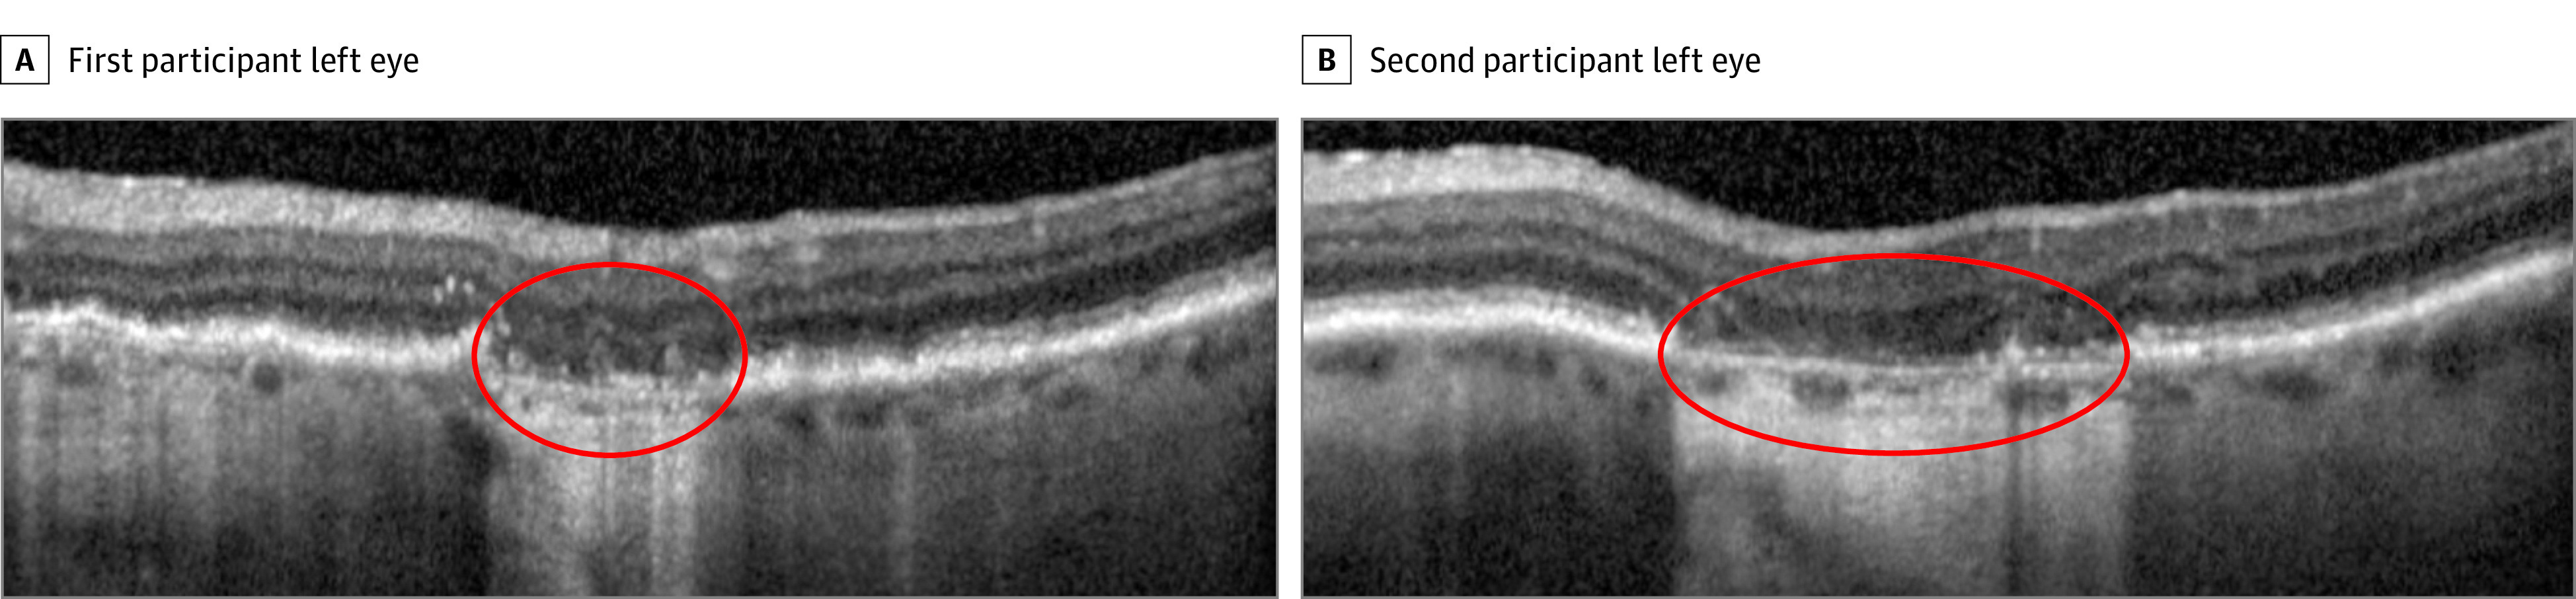
The area within the red oval indicates the presence of cRORA, characterized by loss of the retinal pigment epithelium band and associated hypertransmission into the choroid (≥250 μm in diameter) accompanied by subsidence of the outer plexiform layer and inner nuclear layer. The external limiting membrane, ellipsoid zone, and interdigitation zone are disrupted.
Statistical Analysis
Baseline characteristics were summarized using descriptive statistics. Continuous variables, such as GA lesion size, were summarized using the number of observations, mean, and SD values. Categorical variables, such as the presence of iRORA lesion(s) at baseline, were summarized using counts and percentages. The progression of iRORA to cRORA was summarized at months 6 and 12 at both the study eye and lesion levels. For the study eye–level summaries, the subset of eyes with at least 1 iRORA lesion at baseline was included. If at least 1 iRORA lesion that was present at baseline progressed to a cRORA lesion during follow-up, the eye was counted as having progressed. The proportion of study eyes that progressed to cRORA was compared between each pegcetacoplan group and the sham control group using a Pearson χ2 test. For each difference in proportions, the corresponding 95% CI and P value are given. As a post hoc analysis, P values were not adjusted for multiple analyses, but were 2-sided; results were deemed statistically significant at P < .05. Risk ratios and their corresponding 95% CIs were calculated as the proportion of eyes that progressed from iRORA to cRORA in the pegcetacoplan group divided by the proportion of eyes that progressed from iRORA to cRORA in the sham group. For the lesion-level summaries of progression, each iRORA lesion present at baseline was assessed separately for progression to a cRORA lesion; the proportions of lesions that progressed were compared between each pegcetacoplan group and the sham control group using descriptive statistics (counts and percentages).
Results
Baseline Characteristics
Participants in the FILLY trial (n = 246) were categorized into monthly pegcetacoplan (n = 86), every other month pegcetacoplan (n = 79), and sham (n = 81) groups. According to prespecified criteria for inclusion in this post hoc analysis, study eyes were selected for grading only if no pegcetacoplan treatment was missed, a full complement of gradable images was available, and eAMD had not developed during the study. Among the 86 participants in the monthly pegcetacoplan group, 79 participants in the every other month pegcetacoplan group, and 81 participants in the sham group, 16, 5, and 1 participants, respectively, were excluded from analysis owing to development of eAMD; 42, 16, and 0 participants, respectively, were excluded from analysis because of missing injections; and 19, 14, and 11 participants, respectively, were excluded from analysis because of missing image data (an individual participant could have been excluded for multiple reasons). A total of 167 participants met the criteria for this post hoc analysis: 41 received pegcetacoplan monthly, 56 received pegcetacoplan every other month, and 70 received sham (Figure 1).
At baseline, among those with evaluable data, iRORA was present in 45.0% of eyes (18 of 40) in the pegcetacoplan monthly group, 61.8% of eyes (34 of 55) in the pegcetacoplan every other month group, and 50.7% of eyes (34 of 67) in the sham group. There were no major differences between groups for GA lesion size, location, and focality (eTable in Supplement 3).
Progression From iRORA to cRORA
Progression from iRORA to cRORA was observed at month 6 in 27.8% of eyes (5 of 18) in the pegcetacoplan monthly group, 40.6% of eyes (13 of 32) in the pegcetacoplan every other month group, and 53.1% of eyes (17 of 32) in the sham group (Figure 4). The difference from sham for the pegcetacoplan monthly group at month 6 was 25.4% (95% CI, −1.6% to 52.3%; P = .08), and the difference from sham for the pegcetacoplan every other month group was 12.5% (95% CI, −11.8% to 36.8%; P = .32). The relative risk of progression from iRORA to cRORA at 6 months was 0.52 (95% CI, 0.23-1.18) for eyes in the pegcetacoplan monthly group and 0.76 (95% CI, 0.45-1.30) for eyes in the pegcetacoplan every other month group. Treatment with monthly pegcetacoplan resulted in a 48% reduction in the risk of progression to cRORA at 6 months compared with sham and a 24% reduction for treatment with pegcetacoplan every other month.
Figure 4. Progression From Incomplete Retinal Pigment Epithelium and Outer Retina Atrophy (iRORA) to Complete Retinal Pigment Epithelium and Outer Retina Atrophy (cRORA).

Pearson χ2 test: month 6, P = .08 for pegcetacoplan monthly and P = .32 for pegcetacoplan every other month (EOM); month 12, P = .02 for pegcetacoplan monthly and P = .06 for pegcetacoplan EOM.
aStatistically significant at P < .05.
Progression from iRORA to cRORA was observed at month 12 in 50.0% of study eyes (9 of 18) in the pegcetacoplan monthly group, 60.6% of study eyes (20 of 33) in the pegcetacoplan every other month group, and 81.8% of study eyes (27 of 33) in the sham group. The difference from sham for the pegcetacoplan monthly group at month 12 was 31.8% (95% CI, 5.2%-58.4%; P = .02), and the difference from sham for the pegcetacoplan every other month group was 21.2% (95% CI, −0.03% to 42.5%; P = .06). The relative risk of progression at 12 months was 0.61 (95% CI, 0.37-1.00) for eyes in the pegcetacoplan monthly group and 0.74 (95% CI, 0.54-1.02) for eyes in the pegcetacoplan every other month group. Treatment with monthly pegcetacoplan resulted in a 39% reduction in the risk of progression to cRORA at 12 months compared with sham and a 26% reduction for treatment with pegcetacoplan every other month.
At the lesion level, rates of progression to cRORA at month 6 were 20.7% (6 of 29 eyes) in the pegcetacoplan monthly group, 19.8% (16 of 81 eyes) in the pegcetacoplan every other month group, and 39.1% (27 of 69 eyes) in the sham group (Figure 5). The difference from sham for the pegcetacoplan monthly group at the lesion level at month 6 was 18.4% and the difference from sham for the pegcetacoplan every other month group was 19.4%. The relative risk of lesion progression from iRORA to cRORA at month 6 was 0.53 for the pegcetacoplan monthly group and 0.50 for the pegcetacoplan every other month group. Treatment with monthly pegcetacoplan, at the lesion level, resulted in a 47% reduction in the risk of progression to cRORA at 6 months compared with sham and a 50% reduction for treatment with pegcetacoplan every other month.
Figure 5. Proportions of Incomplete Retinal Pigment Epithelium and Outer Retina Atrophy (iRORA) Lesions at Baseline That Converted to Complete Retinal Pigment Epithelium and Outer Retina Atrophy (cRORA) Lesions by Month 6 or 12.

EOM indicates every other month.
At month 12, rates of progression at the lesion level were 37.9% (11 of 29 eyes) in the pegcetacoplan monthly group, 37.9% (33 of 87 eyes) in the pegcetacoplan every other month group, and 64.3% (45 of 70 eyes) in the sham group (Figure 5). The difference from sham for both the pegcetacoplan monthly and every other month groups was 26.4%. The relative risk of progression for iRORA lesions at month 12 at the lesion level was 0.59 in the pegcetacoplan monthly and every other month groups, resulting in a 41% reduction in the risk of progression to cRORA at 12 months compared with sham.
Discussion
The sham-controlled, phase 2 FILLY trial demonstrated that treatment with intravitreal pegcetacoplan significantly slowed the rate of GA lesion enlargement.13 In this post hoc analysis of the FILLY data set, areas of iRORA outside the GA area progressed to GA at a lower rate among those who received pegcetacoplan monthly or every other month compared with those treated with sham injections. Using the SD-OCT classification of atrophy framework established by the CAM group,15,16 this work highlights pegcetacoplan as the first intervention, to our knowledge, to significantly slow the growth of existing GA as well as the progression to GA within this post hoc analysis of a small proportion of eyes from each randomly assigned group.
Our findings support the role that the complement system may play in the complex pathogenesis of AMD.7,8,9,10,11,20 Through testing regions of the retina beyond the transition zones that usually extend approximately 500 μm from the GA border,20,21 we provide evidence for the biological basis for the therapeutic outcomes of pegcetacoplan in eyes with GA. Katschke et al20 found increased complement activation characterized by C3 and C4 immunostaining localized to the GA transition zone and in the retina approximately 500 μm peripheral to this region. As activated complement is found on photoreceptor outer segments in and adjacent to the transition zone, and GA advances into the transition zone, it has been suggested that complement activation is associated with cellular changes that precede the progression to atrophy. Because we hypothesized that pegcetacoplan would protect unaffected regions of the retina, we chose to exclude the transition zone in this analysis. Our data provide evidence that C3 inhibition may act to prevent the onset of atrophy by working at an earlier stage, and this post hoc analysis supports the need for further studies of this hypothesis.
In defining the sequence of progression from intermediate AMD to GA, 1 of the goals of the CAM group was to identify and validate biomarkers that could be applied to trials with the therapeutic goal of delaying progression from earlier stages of AMD to GA.15,16 This goal is in accord with efforts by the US Food and Drug Administration to identify robust and clinically relevant end points that can be used in GA prevention trials.17 To better understand the natural history of the disease and evaluate agents that might delay its development and progression, it may be beneficial to apply and further validate the CAM criteria in longitudinal studies of patients with iRORA and cRORA. A recent study found that 93.1% of incident iRORA lesions in eyes with intermediate AMD had progressed to cRORA lesions through 24 months (including 27.5% that progressed within 12 months and 65.5% that progressed from 12 to 24 months), with a median time to conversion of 14 months.22 In our study, 64.3% of lesions in the sham group progressed from iRORA to cRORA within 12 months, a higher rate possibly associated with differences in enrollment criteria between the 2 studies (eyes with intermediate AMD vs GA). The results of these studies, while suggestive, do not in themselves validate the use of the progression from iRORA to cRORA as a surrogate study end point.
Limitations and Strengths
Our study has some limitations, including the relatively small sample size, the imbalance in the proportion of eyes with iRORA at baseline among the 3 groups of the study, and the retrospective post hoc analysis. The selection resulted in a small proportion (35.0% [86 of 246]) of eyes from the original randomly assigned groups in the FILLY trial and thus in groups that may be imbalanced, with confounding factors that may account for the differences seen, independent of whether the eye received sham, pegcetacoplan every other month, or pegcetacoplan monthly.
We excluded eyes that developed new-onset eAMD because, once they received a diagnosis of eAMD, these participants discontinued study treatment. In the ongoing phase 3 studies of pegcetacoplan, new-onset eAMD is being monitored and treated, and participants continue to receive the study drug. As such, these studies will offer an opportunity to assess iRORA on the intention-to-treat population, which was beyond the scope of our hypothesis-generating study. Finally, intraobserver and interobserver reproducibility data were not collected for this analysis; however, substantial interreader agreement in the evaluation of iRORA, cRORA, and the features used to define them has been established by both the CAM group and the team involved in the present analysis.23,24 This study also has some strengths, including the quality of the data—from a randomized clinical phase 2 trial, with images graded by masked readers at an independent reading center—as well as the prespecified hypothesis and analysis plan.
Conclusions
This post hoc analysis of a randomized clinical interventional trial identifies and quantifies the progression from iRORA to cRORA and offers an additional line of evidence for the potential effectiveness of pegcetacoplan in the treatment of GA, demonstrating a possible association with outcomes earlier in the course of the disease.
Trial Protocol
Statistical Analysis Plan
Characteristics of Eyes With iRORA at Baseline
Data Sharing Statement
References
- 1.Holz FG, Strauss EC, Schmitz-Valckenberg S, van Lookeren Campagne M. Geographic atrophy: clinical features and potential therapeutic approaches. Ophthalmology. 2014;121(5):1079-1091. doi: 10.1016/j.ophtha.2013.11.023 [DOI] [PubMed] [Google Scholar]
- 2.Rahimy E, Khan MA, Chao W, Ribeiro R, Ho A, Holekamp N. Evaluation of geographic atrophy (GA) secondary to AMD in real-world clinical practice: analysis of the AAO IRIS registry. Presented at the American Academy of Ophthalmology Annual Meeting; November 13, 2020; virtual. [Google Scholar]
- 3.Schmitz-Valckenberg S, Sahel JA, Danis R, et al. Natural history of geographic atrophy progression secondary to age-related macular degeneration (Geographic Atrophy Progression Study). Ophthalmology. 2016;123(2):361-368. doi: 10.1016/j.ophtha.2015.09.036 [DOI] [PubMed] [Google Scholar]
- 4.Shen LL, Sun M, Ahluwalia A, et al. Relationship of topographic distribution of geographic atrophy to visual acuity in nonexudative age-related macular degeneration. Ophthalmol Retina. 2021;5(8):761-774. doi: 10.1016/j.oret.2020.11.003 [DOI] [PubMed] [Google Scholar]
- 5.Rudnicka AR, Kapetanakis VV, Jarrar Z, et al. Incidence of late-stage age-related macular degeneration in American Whites: systematic review and meta-analysis. Am J Ophthalmol. 2015;160(1):85-93.e3. doi: 10.1016/j.ajo.2015.04.003 [DOI] [PubMed] [Google Scholar]
- 6.Chakravarthy U, Bailey CC, Johnston RL, et al. Characterizing disease burden and progression of geographic atrophy secondary to age-related macular degeneration. Ophthalmology. 2018;125(6):842-849. doi: 10.1016/j.ophtha.2017.11.036 [DOI] [PubMed] [Google Scholar]
- 7.Boyer DS, Schmidt-Erfurth U, van Lookeren Campagne M, Henry EC, Brittain C. The pathophysiology of geographic atrophy secondary to age-related macular degeneration and the complement pathway as a therapeutic target. Retina. 2017;37(5):819-835. doi: 10.1097/IAE.0000000000001392 [DOI] [PMC free article] [PubMed] [Google Scholar]
- 8.Fritsche LG, Fariss RN, Stambolian D, Abecasis GR, Curcio CA, Swaroop A. Age-related macular degeneration: genetics and biology coming together. Annu Rev Genomics Hum Genet. 2014;15:151-171. doi: 10.1146/annurev-genom-090413-025610 [DOI] [PMC free article] [PubMed] [Google Scholar]
- 9.Schaal KB, Rosenfeld PJ, Gregori G, Yehoshua Z, Feuer WJ. Anatomic clinical trial endpoints for nonexudative age-related macular degeneration. Ophthalmology. 2016;123(5):1060-1079. doi: 10.1016/j.ophtha.2016.01.034 [DOI] [PubMed] [Google Scholar]
- 10.Reynolds R, Hartnett ME, Atkinson JP, Giclas PC, Rosner B, Seddon JM. Plasma complement components and activation fragments: associations with age-related macular degeneration genotypes and phenotypes. Invest Ophthalmol Vis Sci. 2009;50(12):5818-5827. doi: 10.1167/iovs.09-3928 [DOI] [PMC free article] [PubMed] [Google Scholar]
- 11.Ardeljan D, Chan CC. Aging is not a disease: distinguishing age-related macular degeneration from aging. Prog Retin Eye Res. 2013;37:68-89. doi: 10.1016/j.preteyeres.2013.07.003 [DOI] [PMC free article] [PubMed] [Google Scholar]
- 12.Holz FG, Sadda SR, Busbee B, et al. ; Chroma and Spectri Study Investigators . Efficacy and safety of lampalizumab for geographic atrophy due to age-related macular degeneration: Chroma and Spectri phase 3 randomized clinical trials. JAMA Ophthalmol. 2018;136(6):666-677. doi: 10.1001/jamaophthalmol.2018.1544 [DOI] [PMC free article] [PubMed] [Google Scholar]
- 13.Jaffe GJ, Westby K, Csaky KG, et al. C5 inhibitor avacincaptad pegol for geographic atrophy due to age-related macular degeneration: a randomized pivotal phase 2/3 trial. Ophthalmology. 2021;128(4):576-586. doi: 10.1016/j.ophtha.2020.08.027 [DOI] [PubMed] [Google Scholar]
- 14.Liao DS, Grossi FV, El Mehdi D, et al. Complement C3 inhibitor pegcetacoplan for geographic atrophy secondary to age-related macular degeneration: a randomized phase 2 trial. Ophthalmology. 2020;127(2):186-195. doi: 10.1016/j.ophtha.2019.07.011 [DOI] [PubMed] [Google Scholar]
- 15.Guymer RH, Rosenfeld PJ, Curcio CA, et al. Incomplete retinal pigment epithelial and outer retinal atrophy in age-related macular degeneration: Classification of Atrophy Meeting Report 4. Ophthalmology. 2020;127(3):394-409. doi: 10.1016/j.ophtha.2019.09.035 [DOI] [PMC free article] [PubMed] [Google Scholar]
- 16.Sadda SR, Guymer R, Holz FG, et al. Consensus definition for atrophy associated with age-related macular degeneration on OCT: Classification of Atrophy Report 3. Ophthalmology. 2018;125(4):537-548. doi: 10.1016/j.ophtha.2017.09.028 [DOI] [PMC free article] [PubMed] [Google Scholar]
- 17.Csaky K, Ferris F III, Chew EY, Nair P, Cheetham JK, Duncan JL. Report from the NEI/FDA endpoints workshop on age-related macular degeneration and inherited retinal diseases. Invest Ophthalmol Vis Sci. 2017;58(9):3456-3463. doi: 10.1167/iovs.17-22339 [DOI] [PMC free article] [PubMed] [Google Scholar]
- 18.Schmitz-Valckenberg S, Brinkmann CK, Alten F, et al. Semiautomated image processing method for identification and quantification of geographic atrophy in age-related macular degeneration. Invest Ophthalmol Vis Sci. 2011;52(10):7640-7646. doi: 10.1167/iovs.11-7457 [DOI] [PubMed] [Google Scholar]
- 19.World Medical Association . World Medical Association Declaration of Helsinki: ethical principles for medical research involving human subjects. JAMA. 2013;310(20):2191-2194. doi: 10.1001/jama.2013.281053 [DOI] [PubMed] [Google Scholar]
- 20.Katschke KJ Jr, Xi H, Cox C, et al. Classical and alternative complement activation on photoreceptor outer segments drives monocyte-dependent retinal atrophy. Sci Rep. 2018;8(1):7348. doi: 10.1038/s41598-018-25557-8 [DOI] [PMC free article] [PubMed] [Google Scholar]
- 21.Zanzottera EC, Ach T, Huisingh C, Messinger JD, Spaide RF, Curcio CA. Visualizing retinal pigment epithelium phenotypes in the transition to geographic atrophy in age-related macular degeneration. Retina. 2016;36(suppl 1):S12-S25. doi: 10.1097/IAE.0000000000001276 [DOI] [PMC free article] [PubMed] [Google Scholar]
- 22.Corradetti G, Corvi F, Nittala MG, et al. Natural history of incomplete retinal pigment epithelial and outer retinal atrophy in age-related macular degeneration. Can J Ophthalmol. 2021;56(5):325-334. doi: 10.1016/j.jcjo.2021.01.005 [DOI] [PubMed] [Google Scholar]
- 23.Wu Z, Pfau M, Blodi BA, et al. OCT signs of early atrophy in age-related macular degeneration: interreader agreement: Classification of Atrophy Meetings Report 6. Ophthalmol Retina. 2021;S2468-6530(21)00093-2. Published online March 23, 2021. doi: 10.1016/j.oret.2021.03.008 [DOI] [PubMed] [Google Scholar]
- 24.Corvi F, Corradetti G, Nittala MG, et al. Comparison of Spectralis and Cirrus optical coherence tomography for the detection of incomplete and complete retinal pigment epithelium and outer retinal atrophy. Retina. 2021;41(9):1851-1857. doi: 10.1097/IAE.0000000000003158 [DOI] [PubMed] [Google Scholar]
Associated Data
This section collects any data citations, data availability statements, or supplementary materials included in this article.
Supplementary Materials
Trial Protocol
Statistical Analysis Plan
Characteristics of Eyes With iRORA at Baseline
Data Sharing Statement