

Abstract
Microcephalies vary widely in clinical severity and in morphology. The purpose of this study is to determine the frequency of disproportion between the size of the cerebrum and the size of midbrain and hindbrain structures in infants and children with microcephaly, as analysis of such disproportions might aid understanding of these disorders and facilitate testing for specific genetic causes. The relative sizes of the forebrain, each component of the brain stem, and vermis and hemispheres of the cerebellum were analyzed visually on magnetic resonance (MR) images of 110 microcephalic patients. A disproportionally large cerebellum, compared with the cerebrum, was found in 50 cases (45.5%), a proportional cerebellum in 49 cases (44.5%), and a disproportionally small cerebellum in 11 cases (10%). Proportional cerebella were most common in mild (86%) and moderate (55%) microcephaly patients, whereas disproportionately large cerebella were most common in severe (57%) and moderate (32%) microcephaly. Disproportionately small cerebella were seen only in moderate (13%) and severe (9%) microcephaly. As genes are expressed at different times in cerebral and cerebellar development, it is postulated that analysis of relative cerebellar and brain stem size may be useful in the initial analysis of microcephaly by MR images both to categorize and to help determine likely genetic causes.
Keywords: primary microcephaly, cerebellar hypoplasia, pontocerebellar hypoplasia
Introduction
Primary microcephaly was originally described as a congenitally small but architecturally normal brain, with affected patients having nonprogressive mild intellectual disability.1,2 Recent studies have revealed that primary microcephaly has heterogeneous clinical, radiologic, and genetic features.3-5 Simplified gyral patterns are common in primary microcephaly; it is likely that simplified sulcation is a result of diminished cell proliferation in the outer subventricular zone6 and decreased white matter volume.3,7 The cause of primary microcephaly has been presumed to be genetic in most cases and, with recent progresses in genetics, several genes have been described in primary microcephaly patients.3 Although primary microcephalic patients show variable imaging phenotypes, few have obvious brain anomalies other than simplification of the gyral pattern and hypoplasia of the corpus callosum—mutation of WDR62 is associated with cortical malformations,8 ARFGEF2 mutations have associated periventricular heterotopias3—that are specific enough to allow suggestion of a specific genotype based on imaging findings. Some reports have described a disproportionately small cerebellum and/or brain stem in primary microcephalic patients.7-15 However, most of these reports described a small numbers of patients, and specific mutations were not described. Although occasional reports have described patients with primary microcephaly associated with a cerebellum that is small in proportion to the cerebrum,16-20 details about relative size proportionality between the forebrain (cerebrum) and hindbrain (cerebellum and brain stem) have not been critically examined. Studies of large numbers of patients are often useful to gain a better understanding of the range and incidence of findings in specific disorders and the frequency/significance of associated findings. In this study, magnetic resonance (MR) scans of 110 patients with clinically diagnosed primary microcephaly were retrospectively reviewed to analyze variations in the relative size proportion between the cerebrum and the mid-hindbrain structures. The goal was to determine whether an initial segregation of affected patients on the basis of these proportions might facilitate the classification of primary microcephalies. In addition, because timing of gene expression differs at any one time in the cerebrum as compared with the cerebellum, these imaging differences may be useful for guiding genetic analyses.
Materials and Methods
Subjects
A list of MR imaging studies of patients with primary microcephaly was acquired from a study of patients ascertained in a study of the genetics of epilepsy and from the personal teaching file of the senior author (J.B.; acquired over 25 years). This review of MR images was approved by our Institutional Review Board. Clinical data were limited on many of the scans retrieved from the teaching file. All patients were referred for imaging after being clinically diagnosed with primary microcephaly by head circumference measurements during the first 6 months of life. In this study, primary microcephaly is defined as the head size of more than two standard deviations below the mean head circumference for age during the first 6 months in order to distinguish it from postnatal microcephaly, which is defined as having normal to slightly small head size at birth and developing severe microcephaly during the first 1 to 2 years. A total of 110 patients with primary microcephaly were identified. The sex and age at the time of imaging were as follows: 51 males and 54 females, ranging in age from 1-day to 34-year-olds (Table 1; no information about sex or age was available for the remaining five patients). Of the 110 patients, 13 patients were related to other patients in the study, coming from a total of 6 pedigrees. Four patients were born to consanguineous parents (consanguineous: intermarriage among relatives within the third degree). Evidence of brain damage, resulting from an ischemic or infectious event, metabolic disease, or generalized cerebral malformation (such as diffuse polymicrogyria, lissencephaly, or holoprosencephaly) was a cause to exclude patients from this series. Normal cortex may sometimes appear abnormally thick in very small brains. As thick cortex (lissencephaly) was a cause for exclusion from the study, the cortices were measured to determine whether there was a case of increased cortical thickness, that is, cortices measuring 4 mm or more in thickness were eliminated that patient from the study. The MR scans were obtained in many locations over many years, resulting in variable imaging protocols; all examinations in this study included at least one sagittal imaging sequence with section thickness of 5 mm or less and one axial imaging sequence with sections of 5 mm or less. All patients were studied with both T1-weighted and T2-weighted sequences, and 89.1% had sequences performed in three orthogonal planes (coronal section were available in 98 examinations); therefore, the imaging data were considered adequate. In many cases, extremely limited or even nonexistent clinical information was available on the subjects of the study. This paucity precluded any analysis of genetics, presentation, or outcome; as a result, this study focuses exclusively on imaging findings, and in particular, on relative sizes of supratentorial and infratentorial structures.
Table 1.
Age distribution of patients with primary microcephaly
| Age | Female | Male | Unknown | Total |
|---|---|---|---|---|
| 0–1 mo | 12 | 14 | 26 | |
| 1–2 mo | 4 | 4 | ||
| 3–6 mo | 9 | 3 | 12 | |
| 7–12 mo | 8 | 9 | 17 | |
| 13–24 mo | 4 | 3 | 7 | |
| 2–3 y | 5 | 3 | 8 | |
| 3–6 y | 6 | 10 | 16 | |
| 6 y or more | 9 | 6 | 1 | 16 |
| Unknown | 0 | 0 | 4 | 4 |
| Total | 53 | 52 | 5 | 110 |
Note: The table summarizes the sex and age at the time of imaging. No information about sex or age was available for the five patients.
Normal comparison data of cerebral and cerebellar size for this study were obtained by assessing craniofacial ratios and posterior fossa contents in age-matched normocephalic infants and children imaged by MR for indications that should not affect head or brain size (Fig. 1A, B). These included headaches, ophthalmologic disorders, febrile seizures, and suspected infections, or trauma. The ages of patients ranged from 3 months to 5 years at the time of their MR scan. The presence of any brain abnormality on the MR images excluded those patients as a control. Normal neonatal images for comparison were obtained from the medical literature.21-23
Fig. 1.
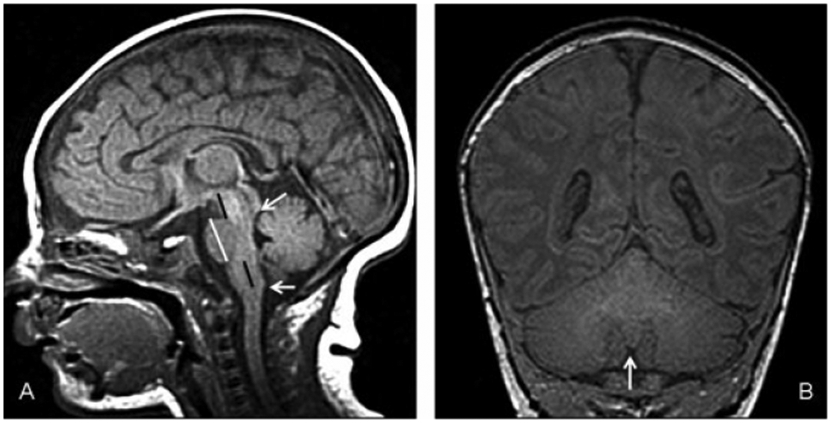
(A) Cerebro–cerebellar ratios in a normal 1-month-old. Sagittal T1-weighted image shows cerebellar vermis extending from inferior colliculus (upper white arrow) to the level of the obex (lower white arrow). The A–P diameter of the pons (vertical white line) is significantly larger than that of the midbrain and medulla. The rostrocaudal length of the midbrain (upper black line) is roughly the same as the rostrocaudal length of the medulla (inferior pons to obex, lower black line). The length of the pons is nearly twice that of the medulla and midbrain at birth, but increases to double the rostrocaudal lengths of the midbrain and medulla by age of 2 years (adapted to the system of Doherty et al24). (B) Cerebro–cerebellar ratios in a normal 1-month-old. Coronal T1-weighted image at the level of the nodulus of the vermis (arrow), which is the best point to see the cerebellar hemispheres and fissures. The area of the cerebrum is slightly more than double the area of the cerebellum.
MR Analysis
As the majority of the studies were performed before color-coded fractional anisotropy (FA) maps or diffusion tractography was available, and because the pathways in the brain stem are very difficult to analyze in microcephalic patients, diffusion imaging was not a part of this study. Imaging assessment in the patient group was based on agreement between two neuroradiologists (Y.A. and J.B.) who reviewed the images. Each neuroradiologist made initial evaluations independently, and disagreements regarding the final conclusion were resolved by consensus. The absence of volumetric data sets in the majority of studies precluded quantification of brain volumes. In addition, linear measurements were felt to be unreliable because of the small sizes of the structures, the variation in ages of the patients, and the inability to ensure that images were acquired in exactly the same plane. Therefore, only significant, grossly evident deviations from normal that could be detected by visual analysis were considered as abnormal.
Posterior Fossa Structures
Cerebellum.
Cerebellar size was visually compared with that of the cerebrum in each patient, using images in both coronal and sagittal planes. The size of the cerebellar vermis was visually assessed on the midline sagittal image and compared with the cerebrum on that same image. The size of the cerebellar hemisphere was assessed on both parasagittal and coronal images in the same manner. If the cerebellar vermis and hemisphere sizes were not of similar proportions to each another as on normal controls, each structure was evaluated in detail and individually compared with the cerebrum. We divided the cerebellar size of each patient into one of three categories as compared with the cerebrum: proportional (in which the size of the cerebellum compared with cerebral size with not distinguishable from that of a normal, age-matched brain by visual inspection), disproportionally large (the size of the cerebellum compared with the cerebrum was obviously larger than in age-matched controls by visual inspection), and disproportionally small (the size of the cerebellum compared with the cerebrum was obviously smaller than in age-matched controls by visual inspection). If the proportional sizes of structures were judged to be only slightly larger or slightly smaller than normal, they were considered normal; therefore, the number of cases with disproportionality of size among the structures was almost certainly underestimated.
Brain stem.
We evaluated the brain stem components individually; the morphologic features of each portion of the brain stem (midbrain, pons, and medulla) were assessed on sagittal and axial images, as was the relative size of each portion, as compared with adjacent segments of brain stem and cerebellum according to the system of Doherty et al24 (Fig. 1). The anteroposterior length of the overall brain stem was compared with that of the cerebellar vermis24—proportional to cerebellum, disproportionately large compared with the cerebellum, or disproportionately small compared with the cerebellum—and compared with age-matched controls. The relative rostrocaudal lengths of the midline midbrain, pons, and medulla were compared with each other and age-matched controls, and judged as proportionate, disproportionally large, or disproportionally small. If images were adequate, the medullary pyramids were assessed on axial images to see if they were symmetrical and appropriately sized compared with age-matched controls.
Microcephaly
Degree of microcephaly was analyzed by analysis of the craniofacial ratio on midsagittal images, using the method of Adachi et al.7 Using this method, each patient was classified into one of three categories: mild, moderate, or extreme microcephaly.
Statistical Analysis
Correlations of the degree of microcephaly with the size of cerebellum were assessed by computing the Spearman correlation coefficient test; p values below 0.05 were considerate significant. Because callosal anomalies have been described in some microcephalies,7 the Fisher exact test was used to assess whether there was a significant difference in the frequency of callosal agenesis among patients with proportionate cerebellum, as compared with those with disproportionally large or small cerebellum.
Results
Posterior Fossa Contents
In 110 primary microcephaly patients, we identified a disproportionally large cerebellum, compared with the cerebrum, in 50 cases (45.5%, Fig. 2A), a proportional cerebellum in 49 cases (44.5%, Fig. 3A), and a disproportionally small cerebellum in 11 cases(10%, Fig. 4A). Results of the cases are summarized in Tables 2 and 3.
Fig. 2.
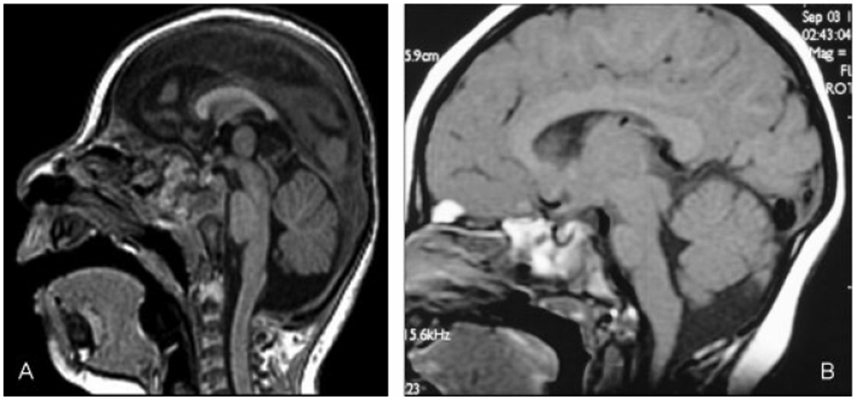
(A) Disproportionately large cerebella. Sagittal T1-weighted image (of a 9-month-old child) shows extreme microcephaly with disproportionally large posterior fossa contents. Ventral pons is slightly small. Midbrain and medulla are proportional to cerebellum. (B) Disproportionately large cerebella. Sagittal T1-weighted image (8-month-old) shows moderate microcephaly with disproportionally large cerebellum. The ventral pons is proportional to the cerebrum, whereas the midbrain, dorsal pons, and medulla are proportional to cerebellum.
Fig. 3.
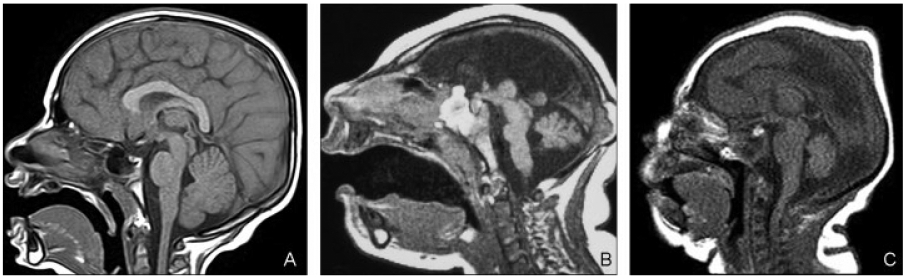
(A) Proportional cerebella. Sagittal T1-weighted image shows moderate microcephaly with proportional posterior fossa contents. (B) Proportional cerebella. A 5-day-old infant with profound microcephaly. Midsagittal T1-weighted image shows extremely small brain. Pons is short, thin, and disproportionally small compared with the cerebrum and cerebellum. Midbrain and medulla were disproportionally large compared with both cerebrum and cerebellum. (C) Proportional cerebella. Midsagittal T1-weighted image (a 1-day-old infant) shows cerebellum, midbrain, and medulla proportional to cerebrum. Pons is disproportionally large.
Fig. 4.
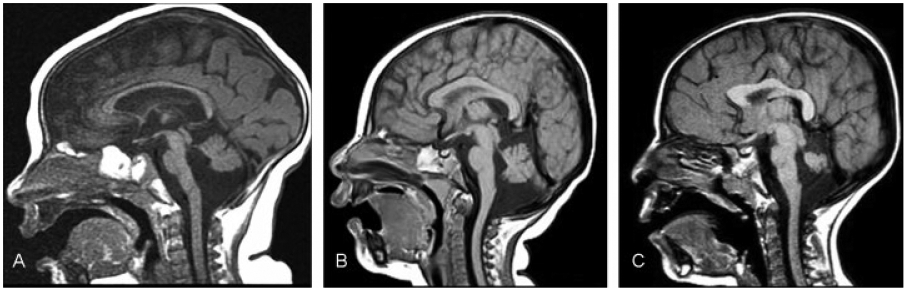
(A) Disproportionately small cerebellum. Sagittal T1-weighted image (a 7-month-old child) shows severe microcephaly with disproportionally small posterior fossa contents. Brain stem is morphologically normal and proportional to cerebellum. (B) Disproportionately small cerebellum. Midsagittal T1-weighted image (6-month-old) shows severe microcephaly with disproportionally small cerebellum. The midbrain and medulla were proportional to the cerebrum. The pons was proportional to the cerebellum (small compared with midbrain and medulla). (C) Disproportionately small cerebellum. Sagittal T1-weighted image (a 3-year-old child) shows moderate microcephaly with disproportionally small cerebellum. The midbrain and medulla are proportional to the cerebrum. The pons was small compared with the midbrain and medulla, but disproportionally large compared with the cerebellum.
Table 2.
Size proportionality of cerebellum and brain stem
| Cerebellum (compared with cerebrum) | Brain stem | |
|---|---|---|
| Microcephaly 110 patients | Disproportionally large, n = 50 | (i) Proportional to cerebellum, n = 47 |
| (ii) Proportional to cerebrum, n = 3; Brain stem structure: morphologically normal in all patient | ||
| Proportionally small, n = 49 | (i) Proportionally small, n = 47 | |
| (ii) Disproportionally small pons, n = 3a | ||
| (iii) Disproportionally large pons, n = 1 | ||
| (iv) Disproportionally small midbrain, n = 1 | ||
| (v) Disproportionally large midbrain and medulla, n = 1 | ||
| Disproportionally small, n = 11 | see Table 3 |
Note: The table summarizes the breakdown of microcephalic patients with disproportionally large and proportionally small cerebellum.
ACC and interhemispheric cyst in one patient.
Table 3.
Size proportionality of the brain stem in patients with disproportionally small cerebellum
| Each structure of brain stem (midbrain, pons, and medulla) was proportionate |
|
|---|---|
| Proportional to cerebellum | 1 |
| Proportional to cerebrum | 1 |
| Intermediate sizea | 1 |
| Pons was disproportionally small compared with midbrain and medulla |
|
| Midbrain and medulla: proportional to cerebrum; pons: proportional to cerebellum | 5 |
| Midbrain and medulla: proportional to cerebrum; pons: intermediate size | 2a |
| Midbrain and medulla: intermediate sizeb; pons: proportional to cerebellum | 1 |
Note: The table summarizes the breakdown of patients with microcephaly with disproportionally small cerebellum.
Siblings.
intermediate size: disproportionally small compared with cerebrum, disproportionally large compared with cerebellum.
Of the 50 patients with a disproportionally large cerebellum, 47 patients had all portions of the brain stem (midbrain, pons, and medulla) proportional to cerebellum (Fig. 2A). In three patients, the ventral pons was proportional to the cerebrum (Fig. 2B) whereas the midbrain, dorsal pons, and medulla were proportional to cerebellum; the individual brain stem structures appeared morphologically normal.
Of the 49 patients with a cerebellum proportional to the small cerebrum, all structures (brain stem, cerebellum, and cerebrum) were proportional in 43 patients (88%, Fig. 3A). Three patients had a disproportionally small pons compared with the cerebrum and cerebellum (Fig. 3B); all were profoundly microcephalic. The pons was short and thin in one patient, with the ventral portion being particularly small. Agenesis of the corpus callosum with interhemispheric cyst was found in this patient (Fig. 3B). In two patients with a disproportionally small pons, the ventral portion was much smaller than the dorsal portion, which appeared relatively spared. One patient with microcephaly and proportionally small cerebellum had a small midbrain, but the size of the pons and medulla were proportional to the cerebellum. A disproportionally large pons, with proportional ventral and dorsal portions, was identified in one patient (Fig. 3C). One extremely microcephalic patient had a relatively large midbrain and medulla; however, the pons, especially the dorsal portion, was small.
In the 11 patients with a disproportionally small cerebellum (Fig. 4A, Table 3), 3 patients had brain stem components that were proportional to one another in size and morphologically normal. The brain stem was proportional to the cerebrum in one patient, proportional to cerebellum in one patient (Fig. 4A), and intermediate in size (disproportionally small compared with cerebrum and disproportionally large compared with cerebellum) in one patient. Eight patients of this group had a disproportionally small pons compared with the midbrain and medulla. The midbrain and medulla were proportional to the cerebrum, while the pons was proportional to the cerebellum, in 5 patients (Fig. 4B). In two patients (who were siblings), the midbrain and medulla were proportional to the cerebrum, whereas the pons was small with respect to the midbrain and medulla but disproportionately large compared with the cerebellum (Fig. 4C). The ventral pons was particularly small in both cases. In one patient, the midbrain and medulla were disproportionally small compared with the cerebrum, whereas being disproportionally large compared with the cerebellum. The pons of this patient was small but roughly proportionate to the cerebellum.
Relationship between the Degree of Microcephaly and the Relative Size of the Cerebellum
Our cohort consisted of 7 mild, 38 moderate, and 65 extreme microcephaly cases. In the seven cases of mild microcephaly, one patient (14%) had a disproportionally large cerebellum and six (86%) had cerebellum proportional to the cerebrum, but none had a disproportionally small cerebellum. In 38 moderate microcephaly patients, 12 patients (32%) had a disproportionally large cerebellum, 21 patients (55%) had a proportional cerebellum, and 5 patients (13%) had a disproportionally small cerebellum. Of the 65 extremely microcephalic patients, 37 patients (57%) had a disproportionally large cerebellum, 22 patients (34%) had a proportional cerebellum, and 6 patients (9%) had a disproportionally small cerebellum. Assessment with the Spearman rank correlation test showed no significant correlation between the degree of microcephaly and relative size of the cerebellum to the cerebrum (r = −0.47, p < 0.0001). The Fisher exact test showed no significant difference in frequency of callosal agenesis in comparisons among the three groups (disproportionally large, proportionally small, and disproportionally small cerebellum) (p = 0.12).
Of the 11 patients with a disproportionally small cerebellum, 5 patients had moderate microcephaly and 6 patients had extreme microcephaly. Two of these patients were siblings without consanguinity. Neither obvious family history nor consanguinity was found in the other nine patients. Corpus callosum was absent in two patients: one was moderately microcephalic, whereas the other patient was extremely microcephalic.
Discussion
The most interesting result in this study is that the relative size of posterior fossa structures, as compared with the cerebrum, varies considerably in primary microcephalic brains and is, overall, independent of cerebral size; the relative size of posterior fossa structures did not vary with degree of microcephaly. This result is not surprising for the following two reasons: (1) although some gene protein products important for cerebral development also function in brain stem and cerebellar development, others do not; and (2) those gene products involved in both forebrain and hindbrain development are often expressed at different times.3,25,26 The development of the cerebellum extends over a longer period, from the early embryonic period through the first postnatal years. Indeed, at birth, cerebellar granular neurons are still proliferating in the external granular layer of the cerebellar cortex. They subsequently migrate inward through the marginal and Purkinje cortical layers to form the granular cell layer of the cerebellar cortex.24-26 MAL expression of genes that are involved in hindbrain growth during late fetal or early postnatal development could, therefore, cause primary microcephaly with disproportionate hindbrain involvement. Indeed, such a situation was recently described in primary microcephaly with pontocerebellar hypoplasia due to CHMP1A mutations.27 As a result of these relationships and timings, it is likely that some degree of specificity will be found between relative supratentorial and infratentorial involvement in primary microcephaly and their genetic causes. The relative proportion of cerebral and cerebellar size may, therefore, become a good criterion to use to classify the primary microcephalies and help guide which genes to test.
Although a great deal of progress has been made in the understanding of genetic causes of primary microcephaly, it has not yet been sufficient to justify a purely genetic classification. As understanding of genetics has progressed, it has become clear that mutations of different genes can cause the same syndrome, and that different mutations of the same gene can result in different syndromes. Indeed, it was recently demonstrated that duplication of the gene AKT3 results in megalencephaly,28 while deletion of the same gene results in postnatal microcephaly.29 In addition, because molecular pathways function by the sequential, coordinated activity of multiple molecules encoded by different genes, mutations of different genes in the pathway can result in the malfunction of a critical intermediate protein and, therefore, in the same phenotype (e.g., mutations of both hamartin and tuberin cause the tuberous sclerosis complex and somatic mosaic mutations of both PI3K and AKT3 can cause hemimegalencephaly30). Thus, in the future, the optimal classification will not be based on genes but on metabolic pathways and molecular mechanisms of protein action. Such classifications will open new areas of research, as knowledge of molecular pathways will open up opportunities for intervention. Table 4 shows brief breakdown regarding correlations between the genotype and characteristic imaging findings known in microcephalies at the present point.28-35
Table 4.
Hereditary primary microcephaly characterized by specific associated imaging findings
| Imaging Features associated with microcephaly | Causing gene | Inheritance |
|---|---|---|
| Disproportionate cerebellar hypoplasia | Unknown | Probable AR |
| Diffuse periventricular nodular heterotopia | Unknown | Probable AR |
| Periventricular nodular heterotopia (few) | ARFGEF2 at 20q13.13 | AR |
| Diffuse/asymmetric PMG with/without ACC | WDR62 at 19q13.12 | AR |
| Diffuse PMG and a band-like calcification | OCLN at 5q13.2 | AR |
| Bilateral perisylvian PMG | RAB3GAP1 at 2q21.3 | AR |
| Other cortical malformation with/without ACC | NDE1 at 16p13.11 | AR |
| ACC with diffuse/asymmetric PMG | TBR2 (EOMES) at 3p24.1 | AR |
| Amish lethal microcephaly | SLC25A19 at 17q25.1 | AR |
Abbreviations: ACC, agenesis of corpus callosum; AR, autosomal recessive inheritance; PMG, polymicrogyria.
Note: The table shows brief breakdown regarding correlations between the genotype and characteristic imaging findings known at the present point. Microcephaly without obvious brain anomalies other than simplified gyral pattern caused by following genes: ASPM at 1q31.3, MCPH1 at 8p23.1, STIL at 1p33, CENPJ at 13q12.12, and CEP152 at 15q21.1.
Some authors distinguish patients born with normal to slightly small head size and developing severe microcephaly in the first 1 to 2 years after birth (called “postnatal microcephaly” and including microcephalies because of TSEN54, TESN2, TSEN34, FOXG1, CASK, and CHMP1A27-32) from microcephaly caused by abnormal proliferation or apoptosis (primary microcephaly).3 The focus of our project was on patients who had head circumferences smaller than two standard deviations below the mean before the age of 6 months; we did not attempt to segregate primary from postnatal microcephalies because of lack of sufficient clinical information in so many of our patients. However, most of the patients in our study were noted to have microcephaly by more than two standard deviations at birth or in the early neonatal period, and therefore would be classified as having primary microcephaly3; this observation may explain the relatively small number of patients with disproportionately small cerebella in our cohort, as the postmigratory period of the cerebrum is a time of granular neuron proliferation and migration in the cerebellum. In support of this concept, it is interesting to note that microcephaly with disproportionally small cerebellum is frequently found in postnatal microcephaly patients.3 Although the processes that interfere with normal brain development in late gestation or the early postnatal period remain poorly understood, this observation likely reflects the fact that a disproportionate amount of cerebellar growth occurs in postnatal period, so that the cerebellum is disproportionately affected when growth is disrupted in that period. In contrast, the disproportionately small cerebellum found in several primary microcephaly patients in our study might reflect impaired expression of genes that have stronger effect on cerebellum than cerebrum in earlier developmental periods.
The differentiation of the different types of primary microcephaly by size proportionality between cerebrum and posterior fossa structures is of clinical value, not only to guide genetic analyses but also for the prognostic information. Primary microcephaly has, until recently, been thought to have a benign prognosis, with patients usually exhibiting only mild developmental retardation.1,2 However, along with the increase in reports of primary microcephaly, an increasing number of microcephalic patients with disproportionally small posterior fossa structures have been reported,9-15 manifesting varying severity of clinical outcome, as well as variable inheritance patterns. Posterior fossa contents in primary microcephaly patients should be carefully analyzed, along with the degree of microcephaly, gyration, and presence of other associated malformations, to consider the prognosis and potential genetic causes.
Studies of larger numbers of patients are often useful to gain a better understanding of the disorder including the prognosis. In our study, the cerebellar size was disproportional to that of the cerebrum in more than half of the patients. The cerebellum was disproportionally large compared with the cerebrum in 45%, suggesting involvement of genes that affect cerebral growth more than that of the cerebellum. A disproportionally small cerebellum was identified in 11 microcephalic patients (10%) with variable sizes and malformations of the cerebral hemispheres. Although clinical information was limited, no lethal forms were identified in this group. Of the 11 patients, 2 patients had corpus callosum agenesis. However, this associated malformation was detected in four patients with a disproportionally large or a proportional cerebellum. Previous reports have described corpus callosum anomalies with a few types of primary microcephaly, including those with NDE1, TBR1, and EOMES mutations and in MOPD (microcephaly with osteodysplastic primordial dwarfism) patients with or without small posterior fossa contents.30-33,36,37 Although these reports described cerebellar size briefly, the relative size proportion compared with cerebrum was not evaluated in detail. We found no significant association between the frequency of callosal agenesis and relative cerebellar size in any of our three groups (disproportionally large, proportionally small, and disproportionally small cerebellum).
It has been reported that most patients with pontine hypoplasia as an isolated brain stem malformation had microcephaly with proportionate or disproportionate cerebellar hypoplasia.38 In our study, pontine hypoplasia was frequently associated with abnormalities of the cerebellum, both with and without other brain stem malformations. In three patients having a disproportionally small pons, the other posterior fossa structures (cerebellum, midbrain and medulla) were proportional to cerebrum. In five patients, the pons was proportional to a hypoplastic cerebellum. As crossing pontine axons and decussating middle cerebellar peduncle axons make up a substantial volume of the pons, this observation is not unexpected. However, the pons was disproportionally small compared with the cerebrum, while less severely involved than the cerebellum, in two patients. These strikingly different patterns suggest that pontine abnormalities can result from more than one process and should be reported independently from those of the cerebellum. One might speculate that different structures in the pons are affected, implying that different genes or different pathways are involved in these different patterns of involvement. These different patterns might be sorted out through the use of MR diffusion tractography, which has helped better understand other brain stem disorders, such as pontine tegmental cap dysplasia.39,40
Although we have little clinical data concerning most of the patients analyzed in this study, a few general comments can be made. Patients with disproportionately large or proportionate cerebella were less severely affected than those with disproportionately small cerebella, and patients with larger brain stems had better outcomes than those with smaller brain stems. Patients with postnatal microcephaly (e.g., from CHMP1A, CASK, or FOXG1 mutations27,41,42) often have poor neurodevelopmental outcomes after normal early postnatal development. More substantial information awaits new studies focused upon specific genetic disorders.
One limitation of this study is that the size proportionality between forebrain and mid-hindbrain structures was assessed visually rather than by quantitative measurements. Although the volumetric studies would be definitive, volumetric data were not available in the majority of our studies, and a large number of studies were essential to assess the patterns. Linear measurements would have been inadequate because of the complex, three-dimensional shapes of the structures involved, the small sizes of the structures, the obliquity of imaging planes, and variable slice thickness of these multi-institution studies of extremely small heads. Both volumetric and linear measurements would suffer from the small size of the structures, the variable severity of the microcephaly, and the absence of established norms for age. Finally, visual assessment was adequate for the analysis of relative sizes of structures to determine the category they belong to, which was the purpose of this study. With this study establishing the significance of relative sizes of structures in the microcephalic brain, it may be useful to add volumetric analysis to future cases as part of the imaging work-up of these infants. Another limitation was the variable and limited clinical and genetic data available on the subjects in the study (other than the diagnosis of primary microcephaly, which was the reason for examination), resulting from the MR images being obtained from numerous sources in various locations during many years. For this reason, our evaluations focused on imaging findings. Finally, because many of the patients examined were ascertained from a study of epilepsy, our study may suffer from some degree of selection bias. Despite this potential bias, the information gained from this study is new and valid.
Conclusions
We retrospectively reviewed MR images of 110 patients with clinically diagnosed primary microcephaly and analyzed variations in the size proportion between the forebrain and the mid-hindbrain structures. The relative size of posterior fossa structures varies considerably in microcephalic brains; the degree of hypoplasia of posterior fossa structures did not vary with degree of microcephaly. The relationship between size of the cerebrum and mid-hindbrain structures could be a useful criterion to use to classify microcephalic patients.
Acknowledgment
We thank the Microcephaly Collaborative for contributing patient data, which made this study possible.
Disclosures
This work was supported by National Institutes of health grant R01 NS35129.
References
- 1.Warkany J, Lemire RJ, Cohen MM Jr. Mental Retardation and Congenital Malformations of the Central Nervous System. Chicago, IL: Yearbook; 1981:28–30 [Google Scholar]
- 2.Berg BO. Developmental disorders of the nervous system. In: Berg BO, ed. Principles of Child Neurology. New York, NY: McGraw-Hill; 1996:665–90 [Google Scholar]
- 3.Barkovich AJ, Guerrini R, Kuzniecky RI, Jackson GD, Dobyns WB. A developmental and genetic classification for malformations of cortical development: update 2012. Brain 2012;135(Pt 5):1348–1369 [DOI] [PMC free article] [PubMed] [Google Scholar]
- 4.Mochida GH, Walsh CA. Molecular genetics of human microcephaly. Curr Opin Neurol 2001;14(2):151–156 [DOI] [PubMed] [Google Scholar]
- 5.Mahmood S, Ahmad W, Hassan MJ. Autosomal Recessive Primary Microcephaly (MCPH): clinical manifestations, genetic heterogeneity and mutation continuum. Orphanet J Rare Dis 2011;6:39. [DOI] [PMC free article] [PubMed] [Google Scholar]
- 6.Hansen DV, Lui JH, Parker PR, Kriegstein AR. Neurogenic radial glia in the outer subventricular zone of human neocortex. Nature 2010;464(7288):554–561 [DOI] [PubMed] [Google Scholar]
- 7.Adachi Y, Poduri A, Kawaguch A, et al. Congenital microcephaly with a simplified gyral pattern: associated findings and their significance. AJNR Am J Neuroradiol 2011;32(6):1123–1129 [DOI] [PMC free article] [PubMed] [Google Scholar]
- 8.Bilgüvar K, Oztürk AK, Louvi A, et al. Whole-exome sequencing identifies recessive WDR62 mutations in severe brain malformations. Nature 2010;467(7312):207–210 [DOI] [PMC free article] [PubMed] [Google Scholar]
- 9.Barth PG, Blennow G, Lenard HG, et al. The syndrome of autosomal recessive pontocerebellar hypoplasia, microcephaly, and extrapyramidal dyskinesia (pontocerebellar hypoplasia type 2): compiled data from 10 pedigrees. Neurology 1995;45(2):311–317 [DOI] [PubMed] [Google Scholar]
- 10.Hashimoto K, Takeuchi Y, Kida Y, et al. Three siblings of fatal infantile encephalopathy with olivopontocerebellar hypoplasia and microcephaly. Brain Dev 1998;20(3):169–174 [DOI] [PubMed] [Google Scholar]
- 11.Albrecht S, Schneider MC, Belmont J, Armstrong DL. Fatal infantile encephalopathy with olivopontocerebellar hypoplasia and micrencephaly. Report of three siblings. Acta Neuropathol 1993;85(4):394–399 [DOI] [PubMed] [Google Scholar]
- 12.Peiffer J, Pfeiffer RA. Hypoplasia ponto-neocerebellaris (author’s transl). J Neurol 1977;215(4):241–251 [DOI] [PubMed] [Google Scholar]
- 13.Vuia O Congenital spongy degeneration of the brain (van Bogaert Bertrand) associated with micrencephaly and ponto-cerebellar atrophy (contributions to the pathology of glial dystrophy of intrauterin origin). Neuropadiatrie 1977;8(1):73–87 [DOI] [PubMed] [Google Scholar]
- 14.Sztriha L, Johansen JG, Al-Gazali LI. Extreme microcephaly with agyria-pachygyria, partial agenesis of the corpus callosum, and pontocerebellar dysplasia. J Child Neurol 2005;20(2):170–172 [DOI] [PubMed] [Google Scholar]
- 15.Rajab A, Mochida GH, Hill A, et al. A novel form of pontocerebellar hypoplasia maps to chromosome 7q11-21. Neurology 2003;60(10):1664–1667 [DOI] [PubMed] [Google Scholar]
- 16.Barkovich AJ, Ferriero DM, Barr RM, et al. Microlissencephaly: a heterogeneous malformation of cortical development. Neuropediatrics 1998;29(3):113–119 [DOI] [PubMed] [Google Scholar]
- 17.Bellini C, Mazzella M, Arioni C, Fondelli MP, Serra G. “Apple-peel” intestinal atresia, ocular anomalies, and microcephaly syndrome: brain magnetic resonance imaging study. Am J Med Genet 2002;110(2):176–178 [DOI] [PubMed] [Google Scholar]
- 18.Kelley RI, Robinson D, Puffenberger EG, Strauss KA, Morton DH. Amish lethal microcephaly: a new metabolic disorder with severe congenital microcephaly and 2-ketoglutaric aciduria. Am J Med Genet 2002;112(4):318–326 [DOI] [PubMed] [Google Scholar]
- 19.Sheen VL, Ganesh VS, Topcu M, et al. Mutations in ARFGEF2 implicate vesicle trafficking in neural progenitor proliferation and migration in the human cerebral cortex. Nat Genet 2004;36(1):69–76 [DOI] [PubMed] [Google Scholar]
- 20.Chandler KE, Del Rio A, Rakshi K, et al. Leucodysplasia, microcephaly, cerebral malformation (LMC): a novel recessive disorder linked to 2p16. Brain 2006;129(Pt 1):272–277 [DOI] [PubMed] [Google Scholar]
- 21.Barkovich AJ. Normal development of the neonatal and infant brain, skull, and spine. In: Barkovich AJ, ed. Pediatric Neuroimaging, 5th ed. Philadelphia, PA: Lippincott, Williams & Wilkins; 2012:20–52 [Google Scholar]
- 22.Barkovich AJ. MR imaging of the neonatal brain. Neuroimaging Clin N Am 2006;16(1):117–135, viii–ix [DOI] [PubMed] [Google Scholar]
- 23.Barkovich AJ, Kjos BO. Normal postnatal development of the corpus callosum as demonstrated by MR imaging. AJNR Am J Neuroradiol 1988;9(3):487–491 [PMC free article] [PubMed] [Google Scholar]
- 24.Doherty D, Millen KJ, Barkovich AJ. Midbrain and hindbrain malformations: advances in clinical diagnosis, imaging, and genetics. Lancet Neurol 2013;12(4):381–393 [DOI] [PMC free article] [PubMed] [Google Scholar]
- 25.Hevner RF, Hodge RD, Daza RA, Englund C. Transcription factors in glutamatergic neurogenesis: conserved programs in neocortex, cerebellum, and adult hippocampus. Neurosci Res 2006;55(3):223–233 [DOI] [PubMed] [Google Scholar]
- 26.Donkelaar HJ, Lammens M, Wesseling P, et al. Development and developmental disorders of the human cerebellum. In: Donkelaar HJ, Lammens M, Hori A. eds. Clinical Neuroembryology: Development and Developmental Disorders of the Human Central Nervous System. Springer, Berlin–Heidelberg; 2006:309–314 [Google Scholar]
- 27.Mochida GH, Ganesh VS, de Michelena MI, et al. CHMP1A encodes an essential regulator of BMI1-INK4A in cerebellar development. Nat Genet 2012;44(11):1260–1264 [DOI] [PMC free article] [PubMed] [Google Scholar]
- 28.Poduri A, Evrony GD, Cai X, et al. Somatic activation of AKT3 causes hemispheric developmental brain malformations. Neuron 2012;74(1):41–48 [DOI] [PMC free article] [PubMed] [Google Scholar]
- 29.Boland E, Clayton-Smith J, Woo VG, et al. Mapping of deletion and translocation breakpoints in 1q44 implicates the serine/threonine kinase AKT3 in postnatal microcephaly and agenesis of the corpus callosum. Am J Hum Genet 2007;81(2):292–303 [DOI] [PMC free article] [PubMed] [Google Scholar]
- 30.Lee JH, Huynh M, Silhavy JL, et al. De novo somatic mutations in components of the PI3K-AKT3-mTOR pathway cause hemimegalencephaly. Nat Genet 2012;44(8):941–945 [DOI] [PMC free article] [PubMed] [Google Scholar]
- 31.Bakircioglu M, Carvalho OP, Khurshid M, et al. The essential role of centrosomal NDE1 in human cerebral cortex neurogenesis. Am J Hum Genet 2011;88(5):523–535 [DOI] [PMC free article] [PubMed] [Google Scholar]
- 32.Alkuraya FS, Cai X, Emery C, et al. Human mutations in NDE1 cause extreme microcephaly with lissencephaly [corrected]. Am J Hum Genet 2011;88(5):536–547 [DOI] [PMC free article] [PubMed] [Google Scholar]
- 33.Baala L, Briault S, Etchevers HC, et al. Homozygous silencing of T-box transcription factor EOMES leads to microcephaly with polymicrogyria and corpus callosum agenesis. Nat Genet 2007;39(4):454–456 [DOI] [PubMed] [Google Scholar]
- 34.O’Driscoll MC, Daly SB, Urquhart JE, et al. Recessive mutations in the gene encoding the tight junction protein occludin cause band-like calcification with simplified gyration and polymicrogyria. Am J Hum Genet 2010;87(3):354–364 [DOI] [PMC free article] [PubMed] [Google Scholar]
- 35.Borck G, Wunram H, Steiert A, et al. A homozygous RAB3GAP2 mutation causes Warburg Micro syndrome. Hum Genet 2011;129(1):45–50 [DOI] [PubMed] [Google Scholar]
- 36.Juric-Sekhar G, Kapur RP, Glass IA, Murray ML, Parnell SE, Hevner RF. Neuronal migration disorders in microcephalic osteodysplastic primordial dwarfism type I/III. Acta Neuropathol 2011;121(4):545–554 [DOI] [PMC free article] [PubMed] [Google Scholar]
- 37.Bicknell LS, Walker S, Klingseisen A, et al. Mutations in ORC1, encoding the largest subunit of the origin recognition complex, cause microcephalic primordial dwarfism resembling Meier-Gorlin syndrome. Nat Genet 2011;43(4):350–355 [DOI] [PubMed] [Google Scholar]
- 38.Barkovich AJ, Millen KJ, Dobyns WB. A developmental classification of malformations of the brainstem. Ann Neurol 2007;62(6):625–639 [DOI] [PubMed] [Google Scholar]
- 39.Barth PG, Majoie CB, Caan MW, et al. Pontine tegmental cap dysplasia: a novel brain malformation with a defect in axonal guidance. Brain 2007;130(Pt 9):2258–2266 [DOI] [PubMed] [Google Scholar]
- 40.Jissendi-Tchofo P, Doherty D, McGillivray G, et al. Pontine tegmental cap dysplasia: MR imaging and diffusion tensor imaging features of impaired axonal navigation. AJNR Am J Neuroradiol 2009;30(1):113–119 [DOI] [PMC free article] [PubMed] [Google Scholar]
- 41.Najm J, Horn D, Wimplinger I, et al. Mutations of CASK cause an X-linked brain malformation phenotype with microcephaly and hypoplasia of the brainstem and cerebellum. Nat Genet 2008;40(9):1065–1067 [DOI] [PubMed] [Google Scholar]
- 42.Kortüm F, Das S, Flindt M, et al. The core FOXG1 syndrome phenotype consists of postnatal microcephaly, severe mental retardation, absent language, dyskinesia, and corpus callosum hypogenesis. J Med Genet 2011;48(6):396–406 [DOI] [PMC free article] [PubMed] [Google Scholar]