

Abstract
Background and Aims
This study evaluates a specialist weight management service and compares outcomes in participants referred to the service undergoing either surgery or non‐surgical routes to support weight loss.
Methods
Four hundred and forty eight participants were assessed on various weight‐related outcomes (body mass index [BMI], psychological distress, quality of life, nutrition, weight‐related symptoms, physical activity) on referral to the service and on discharge. The effect of group (surgery or non‐surgery) and time in the service were facilitated by doubly multivariate analyses of variance models.
Results
Between referral and discharge, participants improved significantly on a combination of outcomes (P < .001) and on each outcome assessed individually. The magnitude of overall improvement was moderate (partial‐η2 = 0.141). Individual improvement components varied; including a moderate reduction of 3.2% in the BMI outcome measure and a substantive gain of 64.6% in quality of life. Participants on non‐surgical routes performed significantly better than participants on surgical routes on a linear combination of outcomes (P < .001) and on all outcomes except nutrition; with an effect of route small‐to‐moderate in magnitude (partial‐η2 = 0.090).
Conclusions
Weight management services are successful in achieving weight management‐related outcomes in the short‐ and long‐term, with large overall improvements between referral and discharge averaged over all participants observed. Non‐surgical routes appear to confer benefits between referral and discharge compared to surgical routes.
Keywords: cohort analysis, morbid obesity, surgery, weight reduction
1. INTRODUCTION
Obesity is a multi‐factorial (genetic, metabolic, social, behavioral, and cultural) complex condition with significant implications for health and wellbeing. 1 It has become a major public health issue in the United Kingdom (UK) and other areas of the world. To tackle the issue in the UK, four levels of intervention have been adopted nationally 2 :
Tier 1 universal interventions: environmental and population‐wide initiatives;
Tier 2 lifestyle interventions, delivered primarily through group education models;
Tier 3 specialist services through clinical multi‐disciplinary teams, offering comprehensive individual assessment and follow‐up;
Tier 4 surgery, with pre‐operative assessments and up to 2‐year post‐surgery follow‐up.
Current research and evidence‐based practice guidelines offer various treatments and care pathways for reducing obesity, 3 and Tier 3 services generally offer both surgical and non‐surgical (lifestyle) approach to weight loss; although Petty et al 2 reports that provision of Tier 3 services is inconsistent, with none provided in some areas. Most patients registered with these services using either approach do lose weight, though some later regain it. An evaluation by Ross et al 4 of the Counterweight Programme for obesity management in primary care, involving 1419 participants who attended the programme for 12 months or more, and 825 participants who attended for 24 months or more, observed mean weight decreases of 3.0 kg (95% confidence interval [CI] = 2.4 to 3.5 kg) in those who attended and had data at 12 months (n = 642), and 2.3 kg (95% CI = 1.4 to 3.2 kg) in those who attended and had data at 24 months (n = 357). Jennings et al 5 reported a weight loss of at least 5% of baseline weight after 12 months recorded on patients registered with a multi‐disciplinary Tier 3 service in primary care.
Reductions in body mass index (BMI) and weight in participants enrolled in specialist weight management services can be substantial, but are not universally reported. A review of 14 studies (including 4 controlled and 10 observation studies) of the characteristics, impact and practice implications of specialist weight management services for adults in the UK by Brown et al 6 found statistically significant reductions in mean BMI, ranging from 1.4 to 3.1 kg/m2 in 6 out of the 14 included studies; and statistically significant mean weight reductions, ranging from 2.2 to 12.4 kg, in 12 out of the 14 included studies. Similar results were reported in a review by Alkharaiji et al 7 ; who found in a review of 19 studies (including 1 randomized controlled trial) that 11 reported reductions in BMI 6 months after baseline, with reductions ranging from 0.8 to 3.3 kg/m2. However, the lack of a comparator group in the majority of studies included in both of these reviews makes it impossible to know in these cases what would have happened without the intervention of weight management services. Furthermore, an unacknowledged, contemporary critique of behavior change in clinical weight management services is its over‐reliance on self‐regulation‐based approaches. 8
Sarwer and Polonsky 9 identified multiple facets constituting the psychosocial burden of obesity; finding a positive association between obesity and poor mental health, possibly mediated by stigma and experience of discrimination, body image, and low self‐esteem among other factors. The study also promoted the value of psychological assessment and follow‐up for weight reduction programmes including bariatric surgery.
The Covid‐19 pandemic is known to have affected the extent of the prevalence of obesity, with consequent implications for incidence rates of type 2 diabetes and other conditions. A study of 46 000 adults 10 at high risk of type 2 diabetes revealed the existence of small but clinically significant increases in mean body weight in people as a result of the pandemic. Differential effects were also observed, with those younger than 65 years, female, and in the two quintiles of greatest deprivation experiencing increases in baseline weight compared with pre‐pandemic levels which were more than twice as large as differences observed in the total sample.
1.1. Bariatric surgery options
Surgical interventions (eg, Roux‐en‐Y gastric bypass or sleeve gastrectomy) with people with obesity have demonstrated consistent effects in initiating and maintaining weight loss. These effects are generally found to be greater than weight losses achieved by participants on non‐surgical routes. Booth et al 11 studied long‐term effects of enrolment on a Tier 4 service, finding a reduction in incidence of Type 2 diabetes in 80% in participants who had surgery, compared to controls. Gloy et al 12 reported results of a systematic review of 11 studies comparing outcomes in participants with obesity receiving either bariatric surgery or non‐surgical routes; finding that surgical participants experienced significantly greater weight loss than non‐surgical participants. However, the authors acknowledge that results are limited to 2 years of follow‐up and based on a small number of studies with substantial heterogeneity. Douglas et al 13 reviewed weight‐related outcomes in a cohort study of 3882 participants registered in the Clinical Practice Research Datalink database undergoing bariatric surgery matched to 3882 participants with obesity without surgery. They found higher mean rates of postoperative weight loss in bariatric surgery participants (4.98 kg/mo) than in non‐surgical participants (0.11 kg/mo). Slower weight loss in bariatric participants was sustained throughout the 4‐year follow‐up period; accompanied by substantial improvements in various clinical outcomes.
However, bariatric surgery is not suitable for all, and is usually only considered when other treatments have failed. It is generally considered for those with a BMI greater than 40 kg/m2, or for those obesity‐related diseases such as Type 2 diabetes. 14 Updated NICE guidance 3 for clinical assessment and management of obesity stated that bariatric surgery is the option of choice (instead of lifestyle interventions or drug treatment) for adults with a BMI ≥50 kg/m2, when other interventions have not been effective.
Weight loss in surgical routes can occur through physically restricting amounts and types of food eaten, and can result in the occurrence or exacerbation of disordered eating habits. Dixon et al 15 report physiological factors relating to early satiation and prolonged satiety following a meal which reduce energy intake and lead to sustained changes in energy balance. Long‐term outcome data remains equivocal. Furthermore, additional medical costs arising from surgical intervention and follow‐up care appointments may exceed the costs of long‐term behavioral change support. However, it is difficult to determine an exact comparison of long‐term monetary costs, which would need to account for costs of co‐morbidities arising from weight, weight loss, and the interventions and treatment received. Wise 16 studied data from 18 283 procedures conducted by the National Bariatric Surgery Registry, concluding that the procedure is cost‐effective, without providing specific costing information.
1.2. Non‐surgical (lifestyle change) options
Educational and psychosocial interventions have received less attention than surgical‐based routes, but may evaluate relatively well, especially when used to initiate and persevere with lifestyle changes, including computer‐based online interventions. 17 , 18 , 19 Current advice proposes that first‐line interventions should focus on lifestyle measures, with diet and exercise change at the core. 20
1.3. Tier 3 services in REDACTED
The Tier 3 service in REDACTED is a specialist multi‐disciplinary service (including weight management advisers, a psychologist, and dietician) provided by REDACTED NHS Foundation Trust. It provides intensive individualized assessment and intervention for those with severe and complex obesity. The aim of the programme is weight loss and participants can be supported to make lifestyle changes to lose weight for up to 2 years. Participants must have tried other weight‐reduction services and support at lower tiers of intervention, and meet BMI and health criteria, to be referred. A weight management adviser works intensively with the participant and provides support to adopt and implement lifestyle behavior change. Weight management support is provided for up to 2 years, within NHS England requirements, and participants undergoing non‐surgical routes will typically spend up to 2 years with the service.
Surgical and non‐surgical routes are available for participants registered with the service. All participants enter the service in the same way and the route is selected depending on the outcome at an initial psychological assessment in which management of psychological factors related to obesity, engagement, eating and activity behaviors are evaluated. Based on this, and discussion with the multidisciplinary team, an individually tailored weight management plan is developed with the patient. A weight management adviser will then use this plan to work intensively (usually fortnightly for the first 3 months and monthly thereafter) with the patient to support him/her to make lifestyle changes to initiate weight loss. The frequency and nature of contact with other members of the team varies dependent upon patient need. Some patients may only see the psychologist and dietitian once, whereas others may have a series of specialist appointments. Participants eligible for, and wishing to pursue, bariatric surgery must successfully complete commissioner‐specified time with a Tier 3 service, providing detailed information about bariatric surgery, and allowing the introduction and embedding of lifestyle behavior change prior to surgical intervention.
Discharge measures are given and recorded at point of discharge from the service for participants on both the lifestyle change and bariatric surgery routes. For those having surgery, discharge is at the point when the participant is referred through to Tier 4 surgical team by their GP to wait for an outpatient appointment with the surgical team: that is, they are not yet “accepted for surgery” but are en route to the next stage having completed the required amount of time within the Tier 3 service to meet commissioning guidance. There is no certainty that surgery actually takes place at this stage. Participants are able to swap from the surgical to non‐surgical route at any stage during the programme.
After discharge back to their GP, participants are signposted to appropriate community facilities/offers along the way in order for them to maintain weight loss.
This service was originally commissioned by Public Health, and maintains close links with system approaches to obesity across health and social care in their integrated care system. The clinical multi‐disciplinary team are part of shaping core approaches and messages to support interventions across a pathways of services in conjunction with commissioners who are investing in other approaches; for example, to improve access to green spaces and affordable healthy food options, support for debt and housing and the development of cooking skills and working with local employers, hospitality sector, and schools to shape environmental influences.
1.4. Aims
Although existing literature is concerned with comparative assessments of surgical and non‐surgical routes, the current study advances available knowledge by concurrently analyzing, and adjusting for, a time‐related effect over a wider raft of health measures. The aim of this research was to compare outcomes in a retrospective, non‐randomized quasi‐experimental study in participants referred to a specialist Tier 3 weight management service who receive treatment through one of two routes:
Support for long‐term lifestyle change to maintain weight loss (non‐surgical route);
Referral for assessment, support to make lifestyle changes and preparation for surgery (surgical route).
These comparisons are facilitated by hypotheses tests of flatness (ie, whether, independent of route, participants have the same average responses to a collection of outcomes measured at different time points), equality of levels (ie, whether participants following different routes score differently from each other on average) and parallelism (ie, the existence of a differential effect over time).
This research pertains to the model of delivery at the time of the conduct of the research. The service is currently working to a slightly different set of criteria and operational delivery.
2. METHODS AND MATERIALS
2.1. Data collection
Records of all participants who had engaged with the Tier 3 service from May 2012 onwards were identified, and from this group those who last had contact with the service more than 2 years previously and were still living, were selected for inclusion. The end cut‐off was set as the original intention was to report follow‐up self‐reported data from people had left the service at least 2 years previously, to understand the long‐term effects of their involvement when compared to the questionnaire we sent out. In fact, due to low response rates, a decision was subsequently made to exclude follow‐up data from the reporting.
Each participant had a bespoke programme designed for them with different components of multi‐disciplinary team input according to need and choice as well as support from other services; for example, Citizen's Advice Bureau, Social Care, Mental Health team etc. Participant route was categorized as surgical or lifestyle change (non‐surgical). Study analysts were not blinded to route allocation. Demographic information (age, sex, deprivation score as measured by the Index of Multiple Deprivation [IMD]) was also recorded. The following outcome variables were recorded at referral (timepoint 1) and discharge (timepoint 2): BMI in kg/m2 (with lower scores indicating reduced weight for given height); psychological distress (measured by the Clinical Outcomes Routine Evaluation Outcome Measure [CORE‐OM]) scale, 21 with lower scores over a possible range from 0 to 4 indicating reduced levels of distress); quality of life (measured by the obesity and weight‐loss quality of life [OWLQOL] scale, 22 with higher scores over a possible range from 0 to 100 indicating better quality of life); a nutrition score (derived from a locally developed nutrition questionnaire with input from dietitians working in the local setting designed to measure changes in eating and drinking behaviors associated with weight loss and knowledge and confidence about making changes to eating and drinking behaviors; higher scores indicating better nutrition); symptoms (measured by the Weight‐Related Symptoms Measure [WRSM] a 20‐item self‐report measure focusing on the presence and impact of symptoms commonly associated with obesity and obesity treatment; lower scores over a possible range from 0 to 120 indicating reduced levels of symptoms); and physical activity (a 4‐item measure ‐ categorized as Inactive, Lightly active, Moderately active or Active ‐ a locally produced questionnaire based on the Chief Medical Officer's recommendations for exercise which compares progress to baseline assessment of level of exercise). The measures yielding numerical outcomes (BMI, CORE‐OM, OWLQOL, nutrition score and WRSM) were considered to be primary outcomes on an equal footing; the physical activity survey, which yielded categorical outcomes, was analyzed separately as a secondary measure.
Self‐reported outcomes were always assessed face‐to‐face; either in clinic or at home for assessment and key review points. Protocols were put in place to reduce measurement error. Measurements from GP records were provided at baseline and re‐checked at assessment on calibrated measuring scales and height measures, so each referral measures were taken and checked at least twice at assessment. Measures of change in weight over time were taken at least every 3 weeks during the programme and trends tracked in online patient records, with any anomalies checked and re‐checked as needed. All measures were recorded by the Tier 3 Service multi‐disciplinary team, with consent for use of data for research purposes obtained as part of the consent procedure on patient referral.
Blocks of 12 weeks were selected as the timeframe for the length of programme components. This timeframe is standard for behavior change programmes: NICE 23 advises that programmes (which should be multicomponent, addressing diet, activity, and behavior change) should last for at least 12 weeks, with sessions at least weekly or fortnightly to be of sufficient length and intensity to support behavior change that will lead to weight loss for a proportion of participants.
All outcomes were selected on the basis of their clinical importance. Bushnell and Rothman 24 found the performance of both the OWLQOL and WRSM measures to be valid reproducible and responsive as self‐reported outcome measures for evaluating obesity and weight loss.
Patient reported outcomes measures (PROMs) including for Quality of Life are increasingly recognized as valid measures of the quality and impact of healthcare provision, but are yet to be routinely adopted by the NHS. In this study, the Tier 3 service chose to measure quality of life outcomes whereas it is standard for Tier 4 bariatric service provision to only record weight loss and change in BMI as patient outcome.
A formal sample size calculation was not conducted for this study; the study involved the analysis of retrospective data without the need to involve patients directly. Hence the study, which obtained ethical approval, would not be expected to be subject to potential ethical concerns regarding recruitment of patients to a potentially underpowered study. The pragmatic approach of inclusion of all eligible patient records was taken as there were no discernible analytical disbenefit in the omission of records of eligible patients.
Data were collected prior to the onset of the Covid‐19 pandemic in the United Kingdom.
2.2. Statistical methods
The sample was summarized descriptively. To address the wider aspiration of assessment of indicators for service improvement, an analysis plan was conducted in which the effect of key factors on a combination of outcomes; followed by more detailed analysis of specific outcomes. This procedure acknowledges that obesity is activated and sustained by multi‐dimensional influences with programme effectiveness correspondingly measured by multiple outcomes. To this end, a series of doubly multivariate repeated measures analyses of variance (RM‐ANOVA) were conducted on the data, using referral and discharge scores reported by participants relating to all numerical outcomes, controlling for age, gender and IMD decile; and following preliminary assessment of correlations of outcome measures, to verify the suitability of data to a multivariate treatment. Significance levels of main effects and interactions were used to test hypotheses of parallelism, flatness, and equality of levels, as defined in the aims. A significance level of 0.05 was set for all hypothesis tests. Marginal means of each outcome measure were determined pre‐ and post‐intervention, with pairwise comparisons assessed for significance using Bonferroni‐corrected P‐values. Physical activity levels between adjacent timepoints were assessed descriptively and compared using Somers' d test for asymmetric ordinal measures.
Without a priori specification of primary outcome and associated timepoints, corrections for multiple comparisons were applied (eg, in the comparison of marginal means) where appropriate.
All statistical analyses were conducted using IBM SPSS statistical software (Version 26). 25
2.3. Ethical approval
Ethical approval for this study were obtained from the REDACTED Research Ethics Committee in December 2017 (REC reference 17/SW/0084). No amendments were subsequently sought to the project.
2.4. Participant and public involvement
No participants were directly involved in the study.
3. RESULTS
3.1. Descriptive and exploratory analysis
Referral and discharge data was obtained from 448 participants: 133 males (29.7%) and 315 females (70.3%). There was no missing data on any case or variable. Sample referral, discharge, and change (discharge ‐ referral) scores are summarized in Table 1 below, partitioned by route. Statistics are given in terms of mean (SD) for numerical variables, and frequency (valid %) for categorical variables.
TABLE 1.
descriptive summary of sample on referral and discharge
| Variable | Mean (SD)/frequency (valid %) | ||
|---|---|---|---|
| Surgical route (n = 245) | Non‐surgical route (n = 203) | All participants (n = 448) | |
| Gender | |||
| Male | 59 (24%) | 74 (36%) | 133 (30%) |
| Female | 186 (76%) | 129 (64%) | 315 (70%) |
| Index of multiple deprivation (IMD) | 12 963 (7612) | 15 039 (8226) | 13 907 (7984) |
| IMD decile | 4.45 (2.35) | 5.12 (2.50) | 4.75 (2.44) |
| Age on referral (y) | 44.2 (11.3) | 47.6 (12.2) | 45.7 (11.8) |
| BMI on referral (kg/m b ) a | 51.9 (7.17) | 49.1 (8.01) | 50.6 (7.69) |
| CORE‐OM score on referral b | 1.56 (0.783) | 1.41 (0.747) | 1.49 (0.770) |
| OWLQOL score on referral c | 20.7 (19.3) | 28.8 (22.8) | 24.3 (21.3) |
| Nutrition score on referral d | 43.1 (7.99) | 44.1 (7.10) | 43.6 (7.61) |
| WRSM score on referral e | 58.0 (24.6) | 50.0 (24.0) | 54.4 (24.7) |
| Physical activity on referral | |||
| Inactive | 231 (94%) | 186 (92%) | 417 (93%) |
| Lightly active | 11 (5%) | 14 (7%) | 25 (6%) |
| Moderately active | 3 (1%) | 3 (1%) | 6 (1%) |
| Active | 0 (0%) | 0 (0%) | 0 (0%) |
| BMI on discharge (kg/m b ) a | 50.5 (6.92) | 47.3 (7.81) | 49.0 (7.50) |
| CORE‐OM score on discharge b | 0.970 (0.673) | 0.862 (0.613) | 0.921 (0.648) |
| OWLQOL score on discharge c | 34.0 (22.8) | 47.3 (25.1) | 40.0 (24.8) |
| Nutrition score on discharge d | 52.7 (5.72) | 51.4 (6.63) | 52.2 (6.22) |
| WRSM score on discharge e | 40.5 (24.3) | 33.3 (19.5) | 37.2 (22.5) |
| Physical activity on discharge | |||
| Inactive | 48 (20%) | 61 (30%) | 109 (24%) |
| Lightly active | 146 (60%) | 104 (51%) | 250 (56%) |
| Moderately active | 37 (15%) | 35 (17%) | 72 (16%) |
| Active | 14 (6%) | 3 (1%) | 17 (4%) |
| BMI change (discharge‐referral) (kg/m b ) a | −1.47 (1.38) | −1.78 (1.43) | −1.61 (1.41) |
| CORE‐OM change (discharge‐referral) b | −0.590 (0.686) | −0.544 (0.660) | −0.569 (0.674) |
| OWLQOL change (discharge‐referral) c | 13.3 (19.5) | 18.6 (21.1) | 15.7 (20.4) |
| Nutrition change (discharge‐referral) d | 9.64 (8.06) | 7.26 (8.15) | 8.56 (8.18) |
| WRSM change (discharge‐referral) e | −17.5 (22.7) | −16.7 (21.3) | −17.1 (22.0) |
Note: Totals of percentages may not sum to 100% due to rounding.
Body mass index.
Clinical Outcomes Routine Evaluation Outcome Measure: range 0‐4 (lower scores representing better outcomes).
Obesity and weight‐related quality of life: range 0‐100 (higher scores representing better outcomes).
Locally‐produced instrument: range 13‐65 (higher scores representing better outcomes).
Weight‐related symptom measure: range 0‐120 (lower scores representing better outcomes).
3.2. Analysis of referral and discharge data
A doubly multivariate RM‐ANOVA revealed that in a model with route as the between‐participants variable, the main effects of both timepoint and route, and the interaction between them, were significantly related at the 5% significance level to a linear combination of outcome measures (P < .001 for timepoint; P < .001 for route; P < .001 for the interaction); controlling for age, gender, and IMD decile. The hypotheses of flatness of profiles, equal profile levels, and parallelism of profiles were hence all rejected. Therefore, outcomes at discharge, considered jointly, were significantly different from those at referral; outcomes for participants on surgical and non‐surgical routes were significantly different; and there was a significant differential effect (ie, the effect of route was not the same at different point in time).
The substantive effect of timepoint was moderate (partial‐η2 = 0.141). The substantive effect of route was moderate (partial‐η2 = 0.090). The substantive effect of the interaction between them was small (partial‐η2 = 0.056). Hence main effects are interpreted in addition to the interaction.
Follow‐up univariate ANOVAs revealed timepoint to be significantly associated at the 5% significance level with all outcome measures, with substantive effects observed with respect to all outcomes. The follow‐up ANOVAs also revealed route to be significantly associated at the 5% significance level with all outcome measures except CORE‐OM and nutrition, and the interaction to be significantly associated at the 5% significance level with BMI, OWLQOL scores and nutrition.
Hence the change between referral and discharge was strongly significant with respect to all outcomes, with significant reductions in BMI, CORE‐OM and WRSM; and significant gains in OWLQOL and nutrition scores. All these effects represent positive benefits over the period of enrolment with the Tier 3 service between referral and discharge.
Route comparisons revealed significant differences with respect to all outcomes except CORE‐OM and nutrition; with lower BMI values and WRSM scores, and higher OWLQOL scores reported in the non‐surgical group. All these effects represent better performance in the non‐surgical group. Differential effects observed with respect to the outcomes of OWLQOL, nutrition, and BMI limit the level of interpretation that can be placed on main effects considered in isolation. However, the presence of a substantive differential effect was observed only with respect to nutrition scores; in which the better‐performing lifestyle group at referral is overtaken by the surgery group by the point of discharge.
Model parameters are summarized in Table 2.
TABLE 2.
model parameters (referral and discharge data): controlling for age, gender and IMD decile
| Variable | Measure | F‐ratio | Degrees of freedom | P‐value | Partial‐η2 |
|---|---|---|---|---|---|
| Timepoint | All a | 14.4 | 5, 438 | <.001 | 0.141 |
| BMI b | 19.6 | 1, 442 | <.001 | 0.042 | |
| CORE‐OM c | 20.8 | 1, 442 | <.001 | 0.045 | |
| OWLQOL d | 26.8 | 1, 442 | <.001 | 0.057 | |
| Nutrition e | 43.5 | 1, 442 | <.001 | 0.090 | |
| WRSM f | 31.2 | 1, 442 | <.001 | 0.066 | |
| Route | All a | 8.70 | 5, 438 | <.001 | 0.090 |
| BMI b | 15.7 | 1, 442 | <.001 | 0.034 | |
| CORE‐OM c | 2.83 | 1, 442 | .094 | 0.006 | |
| OWLQOL d | 22.5 | 1, 442 | <.001 | 0.049 | |
| Nutrition e | 0.575 | 1, 442 | .575 | <0.001 | |
| WRSM f | 12.7 | 1, 442 | <.001 | 0.028 | |
| Timepoint·route | All a | 14.4 | 5, 438 | <.001 | 0.056 |
| BMI b | 4.08 | 1, 442 | .044 | 0.009 | |
| CORE‐OM c | 0.028 | 1, 442 | .867 | <0.001 | |
| OWLQOL d | 8.13 | 1, 442 | .005 | 0.018 | |
| Nutrition e | 7.09 | 1, 442 | .008 | 0.016 | |
| WRSM f | 0.004 | 1, 442 | .953 | <0.001 |
From multivariate models.
Body mass index.
Clinical Outcomes Routine Evaluation Outcome Measure: range 0‐4 (lower scores representing better outcomes).
Obesity and weight‐related quality of life: range 0‐100 (higher scores representing better outcomes).
Locally‐produced instrument: range 13‐65 (higher scores representing better outcomes).
Weight‐related symptom measure: range 0‐120 (lower scores representing better outcomes).
Figures 1, 2, 3, 4, 5 below display marginal mean scores in all measures (evaluated at covariate mean values).
FIGURE 1.

Marginal means of body mass index (BMI) values
FIGURE 2.

Marginal means of Clinical Outcomes Routine Evaluation Outcome Measure (CORE‐OM) scores
FIGURE 3.

Marginal means of obesity and weight‐loss quality of life (OWLQOL) scores
FIGURE 4.

Marginal means of nutrition scores
FIGURE 5.
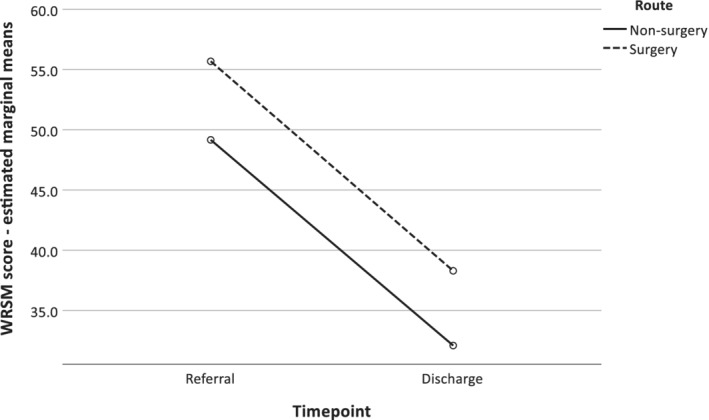
Marginal means of Weight‐Related Symptoms Measure (WRSM) scores
Comparing physical activity on referral and discharge indicated a change from a predominantly inactive sample to a sample which was predominantly lightly active. Of the 417 participants (93.1% of all participants) who were classified as inactive on referral, 241 (57.8% of participants inactive on referral) were classed as lightly active on discharge. 68 participants (15.3% of participants inactive on referral) were classed as moderately active or active on discharge.
The pattern of activity between discharge and referral differed across the two routes, with neither showing obviously higher levels: participants on the surgical route were more likely to be lightly active on discharge than non‐surgery participants; whereas participants on the non‐surgical route were more likely to be either inactive, or moderately active. Somers' d statistic for asymmetric ordinal measures was calculated to be 0.107, which was statistically significant at the 5% significance level (P = .029).
4. DISCUSSION
The principal finding of this study is that programme route is significantly associated with several weight‐related outcomes in a large cohort of people with obesity and morbid obesity; with the primary outcomes of QoL, BMI and WRSM revealed to be better for participants on non‐surgical routes than for participants on surgical routes. A secondary finding is that between referral and discharge, participants improved significantly on all measures, regardless of specific route.
The findings of improvements in BMI were consistent with those of reviews of largely single sample studies. 6 , 7 The finding of overall improvement is consistent with the findings of studies reviewed by Gloy et al 12 which also showed uniform improvement in both groups over a raft of measures. Consistency of association across multiple outcome measures was achieved despite correlations between individual measures (at both referral and discharge) being no stronger than moderate, and the majority below 0.2.
The outcome profiles in the surgical and non‐surgical groups summarized in Table 1 reveals better outcomes on the BMI, quality of life, WRSM and CORE‐OM measures in the non‐surgical than surgical groups. A comparison of group scores reveals the non‐surgical group to out‐perform the surgical group at discharge by 6.3% with respect to BMI; by 11.1% with respect to CORE‐OM; and by 39.1% with respect to OWLQOL; by 17.8% with respect to WRSM. A small, non‐significant difference in favor of the surgical group (2.5%) was recorded with respect to nutrition score. The finding of generally better outcomes for participants on non‐surgical routes contrasts with the studies reviewed by Gloy et al 12 and Douglas et al, 13 who reported better performance in surgical participants. However, the findings reported by these authors are not directly comparable with those of the current study, as outcomes from participants on surgical routes in studies reviewed by Gloy et al 12 and Douglas et al 13 were generally reported post‐procedure. Furthermore, many non‐surgical participants in the Douglas study did not receive a comparable weight management programme to that discussed in the current study. Also, in the current study, differences between the groups are small compared with overall differences between referral and discharge averaged over all participants.
Improvements in participant quality of life were more substantive than those recorded on other measures, with marginal mean scores of 24.7 on referral rising to 40.7 on discharge on the OWLQOL scale; an improvement of 64.8% over baseline. In a study of 144 adults who suffered from either obesity or weight issues, Blissmer et al 26 also found substantive improvements in quality of life over a 6‐month programme, but that improvements in quality of life did not appear to be dependent solely on weight loss, although some additional causes may be indirectly related to weight loss, such as physical health and vitality.
Our analysis finding that outcomes for participants on non‐surgical routes at least match or exceed those of participants on surgical routes, at least in the short term, are consistent with those of the evaluation by Ross et al 4 of the Counterweight Programme for obesity management in primary care. This study revealed that a non‐surgical intervention achieved and maintained clinically valuable weight loss within routine primary care. The finding that BMI continues to decrease during the follow‐up period is also consistent with Jennings et al, 5 who also observed statistically significant weight losses continued within this period.
While the weight loss values observe in the current study are comparatively small on average, they are sustained; which for some will be a significant change from an upward trajectory. Improvements in how bothersome overall weight related symptoms are (measured by WRSM) and mental health (CORE‐OM) are significant because of the consideration of the role of self‐esteem and mental health in supporting positive and sustained behavior change and improved quality of life. 23
Motivation and confidence are key determinants of behavior change, 27 and our study measures both changes in behaviors as well as mental health, quality of life, and how someone perceives their ability to manage their symptoms‐ all mediating variables for how current and future behavior change will be influenced and sustained.
Controlling variables were revealed to have limited effect on discharge scores. No significant effect of IMD decile was revealed with respect to any outcome. Gender was revealed to be significantly associated with QoL at discharge (P < .001), WRSM at discharge (P = .001) and nutrition score at discharge (P < .005), with females scoring better than males on nutrition and worse on QoL and WRSM. Age was revealed to be significantly associated with WRSM at discharge (P = .005) and nutrition score at discharge (P < .001), with older patients scoring better than younger patients on nutrition and worse on WRSM.
It is acknowledged that not all the measures were fully validated or tested for test‐retest reliability: the nutrition score and the physical activity category were unvalidated locally produced measures. However, both were constructed using expert advice and recommendations. Furthermore, the physical activity questionnaire, which did not yield numerical results was considered to be a secondary outcome. Another possible limitation of this work is that it does not inform about the relative importance of these variables in Service adoption. This is important, as poor “reach” is a major issue affecting most weight management services.
Cost‐utility analyses and other economic evaluations were not included in the parameters of this study. However, such evaluations are clearly of importance in today's, resource‐restricted healthcare systems. NICE guidelines 3 cite research which shows a health benefit to bariatric surgery, in terms of weight reduction and reduced co‐morbidities.
It is concluded that the enrolment on the programme has clear health benefits, with significant and substantive improvements observed between referral and discharge from the service. Limited additional benefit between referral and discharge is conferred by enrolment on a non‐surgical, rather than a surgical route. While further research is required to establish whether this edge is maintained post‐discharge, a successful non‐surgical route in terms of costs, dietary issues and procedural implications of bariatric surgery may represent an attractive alternative to surgery with implications for the wider commissioning of services.
FUNDING
This research was part‐funded by NIHR CLAHRC (Collaboration for Leadership in Applied Health Research and Care) Yorkshire and Humber, www.clahrc-yh.nihr.ac.uk.
CONFLICT OF INTEREST
None declared.
AUTHOR CONTRIBUTIONS
Conceptualization: Michael Bond, Paul Bissell, Rachel Holt
Data Curation: Michael Bond
Formal Analysis: John Stephenson
Investigation: Michael Bond
Methodology: John Stephenson, Michael Bond
Project Administration: Michael Bond
Writing – Original Draft Preparation: John Stephenson, Warren Gillibrand
Writing – Review & Editing: John Stephenson, Annette Haywood, Michael Bond, Warren Gillibrand, Paul Bissell, Eleanor Holding, Rachel Holt
All Authors have read and approved the final version of the manuscript. Any additional data can be requested from the main author. John Stephenson accepts full responsibility for the accuracy and integrity of the data provided.
TRANSPARENCY STATEMENT
This manuscript is an honest, accurate, and transparent account of the study being reported; that no important aspects of the study have been omitted; and that any discrepancies from the study as planned (and, if relevant, registered) have been explained.
Stephenson J, Haywood A, Bond M, et al. Health‐related outcomes in patients enrolled on surgical and non‐surgical routes in a weight management service. Health Sci Rep. 2022;5:e501. doi: 10.1002/hsr2.501
Funding information NIHR CLAHRC (Collaboration for Leadership in Applied Health Research and Care) Yorkshire and Humber
DATA AVAILABILITY STATEMENT
The data that support the findings of this study are available from the corresponding author upon reasonable request.
REFERENCES
- 1. National Institutes of Health . Clinical Guidelines on the Identification, Evaluation, and Treatment of Overweight and Obesity in Adults: The Evidence Report [NIH Publication No. 98‐9043]. Bethesda, MD: National Institutes of Health; 1998. https://www.ncbi.nlm.nih.gov/books/NBK2003/ [Google Scholar]
- 2. Petty N. Impact of commissioning weight‐loss surgery for bariatric participants. Br J Nurs. 2015;24(15):776‐780. [DOI] [PubMed] [Google Scholar]
- 3. National Institute for Health and Care Excellence. Obesity: identification, assessment and management. Clinical guidance (CG189); 2014a. [PubMed]
- 4. Ross HM, Laws R, Lean M. Evaluation of the Counterweight Programme for obesity management in primary care: a starting point for continuous improvement. Br J Gen Pract. 2008;58(553):548‐554. [DOI] [PMC free article] [PubMed] [Google Scholar]
- 5. Jennings A, Hughes C, Kumaravel B, et al. Evaluation of a multidisciplinary Tier 3 weight management service for adults with morbid obesity, or obesity and co morbidities, based in primary care. Clin Obes. 2014;4:254‐266. [DOI] [PMC free article] [PubMed] [Google Scholar]
- 6. Brown TJ, O'Malley C, Blackshaw J, et al. Exploring the evidence base for Tier 3 weight management interventions in adults: a systematic review. Clin Obes. 2017;7:260‐272. [DOI] [PubMed] [Google Scholar]
- 7. Alkharaiji M, Anyanwagu U, Donnelly R, Idris I. Tier 3 specialist weight management service and pre‐bariatric multicomponent weight management programmes for adults with obesity living in the UK: a systematic review. Endocrinol Diabetes Metab. 2018;2:e00042. [DOI] [PMC free article] [PubMed] [Google Scholar]
- 8. Hawkes RE, Cameron E, Miles LM, French DP. The fidelity of training in behaviour change techniques to intervention design in a National Diabetes Prevention Programme. Int J Behav Med. 2021;28:671‐682. doi: 10.1007/s12529-021-09961-5 [DOI] [PMC free article] [PubMed] [Google Scholar]
- 9. Sarwer DB, Polonsky HM. The psychosocial burden of obesity. Endocrinol Metab Clin North Am. 2016;45(3):677‐688. doi: 10.1016/j.ecl.2016.04.016 [DOI] [PMC free article] [PubMed] [Google Scholar]
- 10. Valabhji J, Barron E, Bradley D, Bakhai C, Khunti K, Jebb S. Effect of the COVID‐19 pandemic on body weight in people at high risk of type 2 diabetes referred to the English NHS Diabetes Prevention Programme. Lancet Diabetes Endocrinol. 2021;9:649‐651. doi: 10.1016/S2213-8587(21)00218-7 [DOI] [PMC free article] [PubMed] [Google Scholar]
- 11. Booth H, Khan O, Prevost T, et al. Incidence of type 2 diabetes after bariatric surgery: population‐based matched cohort study. Lancet. 2014;2(12):963‐968. [DOI] [PubMed] [Google Scholar]
- 12. Gloy VL, Briel M, Bhatt DL, et al. Bariatric surgery versus non‐surgical treatment for obesity: a systematic review and meta‐analysis of randomised controlled trials. BMJ. 2013;2013(347):f5934. [DOI] [PMC free article] [PubMed] [Google Scholar]
- 13. Douglas IJ, Bhaskaran K, Batterham RL, Smeeth L. Bariatric surgery in the United Kingdom: a cohort study of weight loss and clinical outcomes in routine clinical care. PLoS Med. 2015;12(12):e1001925. doi: 10.1371/journal.pmed.1001925 [DOI] [PMC free article] [PubMed] [Google Scholar]
- 14. Colquitt JL, Pickett K, Loveman E, Frampton GK. Surgery for weight loss in adults. Cochrane Database Syst Rev. 2014;(8):CD003641. doi: 10.1002/14651858.CD003641.pub4 [DOI] [PMC free article] [PubMed] [Google Scholar]
- 15. Dixon JB, Laurie CP, Anderson ML, Hayden MJ, Dixon ME, O'Brien PE. Motivation, readiness to change and weight loss following adjustable gastric band surgery. Obesity. 2009;17(4):698‐705. [DOI] [PubMed] [Google Scholar]
- 16. Wise J. Audit shows that bariatric surgery is cost‐effective. BMJ. 2014;349:g6735. [DOI] [PubMed] [Google Scholar]
- 17. Mastellos N, Gunn LH, Felix LM, Car J, Majeed A. Transtheoretical model stages of change for dietary and physical exercise modification in weight loss management for overweight and obese adults. Cochrane Database Syst Rev. 2014;5(2). https://pubmed.ncbi.nlm.nih.gov/24500864/ [DOI] [PMC free article] [PubMed] [Google Scholar]
- 18. Norris SL, Lau J, Smith SJ, Schmid CH, Engelgau MM. Self‐management education for adults with type 2 diabetes: a meta‐analysis of the effect on glycaemic control. Diabetes Care. 2002;25(7):1159‐1171. [DOI] [PubMed] [Google Scholar]
- 19. Wieland LS, Falzon L, Sciamanna CN, et al. Interactive computer‐based interventions for weight loss or weight maintenance in overweight or obese people. Cochrane Database Syst Rev. 2012;8(8):CD007675. doi: 10.1002/14651858.CD007675 [DOI] [PMC free article] [PubMed] [Google Scholar]
- 20. Public Health England . Adult obesity: applying all our health. 2018. https://www.gov.uk/government/publications/adult-obesity-applying-all-our-health/adult-obesity-applying-all-our-health
- 21. Evans C, Connell J, Barkham M, et al. CORE: clinical outcomes in routine evaluation. J Ment Health. 2000;9(3):247‐255. doi: 10.1080/jmh.9.3.247.255 [DOI] [Google Scholar]
- 22. Patrick DL, Bushnell DM, Rothman M. Performance of two self‐report measures for evaluating obesity and weight loss. Obes Res. 2004;12(1):48‐57. [DOI] [PubMed] [Google Scholar]
- 23. National Institute for Health and Care Excellence. Weight Management: lifestyle services for overweight or obese adults. Clinical guidance (PH53); 2014b.
- 24. Bushnell PD, Rothman M. Performance of two self‐report measures of evaluating obesity and weight loss. Obes Res. 2004;12(1):48‐57. [DOI] [PubMed] [Google Scholar]
- 25. IBM Corp . Released 2019. IBM SPSS Statistics for Windows, Version 26.0. Armonk, NY: IBM Corp. 2019. [Google Scholar]
- 26. Blissmer B, Riebe D, Dye G, Ruggiero L, Greene G, Caldwell M. Health‐related quality of life following a clinical weight loss intervention among overweight and obese adults: intervention and 24 month follow‐up effects. Health Qual Life Outcomes. 2006;4:43. [DOI] [PMC free article] [PubMed] [Google Scholar]
- 27. Michie S, Johnston M, Abraham C, et al. Making psychological theory useful for implementing evidence‐based practice: a consensus approach. Qual Saf Health Care. 2005;14:26‐33. [DOI] [PMC free article] [PubMed] [Google Scholar]
Associated Data
This section collects any data citations, data availability statements, or supplementary materials included in this article.
Data Availability Statement
The data that support the findings of this study are available from the corresponding author upon reasonable request.