Abstract
Recurrent medulloblastoma and ependymoma are universally lethal, with no approved targeted therapies, and few candidates presently under clinical evaluation. Nearly all recurrent medulloblastomas and PFA ependymomas are located adjacent to and bathed by the cerebrospinal fluid (CSF), presenting an opportunity for locoregional therapy, bypassing the blood brain barrier. We identify 3 cell-surface targets, EPHA2, HER2 and IL13Rα2, expressed on medulloblastomas and ependymomas, but not expressed in the normal developing brain. We validate intra-thecal delivery of EPHA2, HER2 and IL13Rα2 CAR-T-cells as an effective treatment for primary, metastatic, and recurrent Group 3 medulloblastoma and PFA ependymomas in mouse models. Finally, we demonstrate that administration of these CAR-T-cells into the CSF, alone or in combination with azacytidine, is a highly effective therapy for multiple metastatic mouse models of Group 3 medulloblastoma and PFA ependymoma, thereby providing a rationale for clinical trials of these approaches in humans.
Life Sciences Reporting Summary.
Experimental summaries can also be found within the Life Sciences Reporting Summary.
Introduction
Brain tumours are the most predominant cause of paediatric cancer deaths1. Medulloblastomas are the most common malignant childhood brain tumour2 while ependymomas are the third most common3; both lead to morbidity and mortality in affected patients, and are essentially incurable at the time of recurrence4,5. Targeted therapies for medulloblastoma and ependymoma have been slow to emerge, due in part to the lack of targetable somatic single nucleotide variants in these low mutational burden cancers3,6. In addition, most brain tumours are located behind the blood brain barrier, limiting therapeutic access to the tumour when treatments are given orally or IV. Inter-patient heterogeneity has also limited the development of effective targeted therapies, as there are four molecular subgroups of medulloblastoma7,8 (consisting of twelve subtypes)9. A further nine molecular subgroups of ependymoma also exist10. Other treatment barriers include intra-patient heterogeneity, the biological divergence between the primary tumour and metastases, and tumour recurrence following treatment11. The vast majority of novel agent clinical trials are carried out on children with recurrent disease12, and target maintenance at recurrence is therefore a critical benchmark for therapeutic success. Unlike other primary tumours that recur within the substance of the brain (i.e., glioblastoma)13, both medulloblastoma and ependymoma tend to recur on the surface of the central nervous system, or metastasize to the leptomeninges, which are adjacent to, and in both cases bathed by the cerebrospinal fluid (CSF)5,14. The location of recurrences adjacent to CSF containing spaces could be capitalized on as an opportunity for locoregional therapy of recurrent medulloblastoma and ependymoma.
Preliminary pre-clinical15,16 and clinical17,18 results with B7-H3 and GD2-targeting Chimeric Antigen Receptor (CAR) T-cells suggest potential therapeutic benefits for the treatment of central nervous system malignancies19–21 with this form of therapy. Of our candidate cell surface targets, durable regression of HER2-positive medulloblastoma cell lines following intra-tumoural and IV injection of HER2 CAR-T-cells has been previously observed22,23. We hypothesized that we may be able to circumvent inter-patient and intra-patient heterogeneity, while also bypassing the blood brain barrier, through the identification of epitopes consistently present across medulloblastoma and ependymoma subgroups (primary, metastatic and recurrent tumour compartments), and subsequent administration of CAR-T-cells targeting those epitopes directly into the CSF. Here we evaluate locoregional CSF delivery of CAR-T-cell therapy as a novel treatment approach in xenograft mouse models of Group 3 metastatic medulloblastoma, and posterior fossa ependymoma group A, the patient subgroups with the highest recurrence rates, and for which there are currently limited therapeutic options.
Results
Identification of candidate targets for CAR-T-cell therapy of Group 3 medulloblastoma.
To identify candidate targets for CAR-T-cell therapy of Group 3 medulloblastoma, we analyzed micro-array data from 763 human medulloblastomas with known subgroup affiliation (n = 70 WNT; 223 SHH; 144 Group 3; 326 Group 4)9 and 9 normal brain control samples (n = 5 adult cerebellum; 4 fetal cerebellum). Protein targets of CAR-T-cells enrolled in clinical trials (Supplementary Table 1) were cross referenced with genes highly expressed in primary and recurrent Group 3 medulloblastomas. We identified high expression of EPHA2, HER2 and IL13Rα2, known CAR-T-cell targets for glioblastoma, in Group 3 medulloblastomas in comparison to normal brain controls19–21,24,25 (Extended Figure 1A – 1C), and further defined the Group 3 subtype-specific expression (Group 3α, 3β, 3γ) of these target genes in comparison to normal brain controls (adjusted p < 0.01) (Extended Figures 1D – 1I). We also observed high protein expression for EPHA2, HER2 and IL13Rα2, across Group 3 primary medulloblastoma (Extended Figures 1J – 1M) tissue microarrays (TMAs) and matched primary-metastatic/recurrent pairs (Extended Figures 2A – 2C), as compared to normal controls, (Extended Figure 1M) and normal compartments of the paediatric developing brain.
As medulloblastoma metastases are known to be biologically divergent from their matched primary tumour11,26, we compared the expression of EPHA2, HER2 and IL13Rα2 in human patient samples of Group 3 medulloblastoma primary metastatic/recurrent pairs (Extended Figures 2D – 2J) and found protein expression levels to be maintained within the metastases. These data suggested that EPHA2, HER2 and IL13Rα2 are potential therapeutic targets for upfront primary tumour, metastatic disease and recurrent Group 3 medulloblastoma. We subsequently focused on testing EPHA2 monovalent CAR-T-cells24, due to EPHA2 having the highest and most conserved protein expression across medulloblastoma samples, and trivalent CAR-T-cells27 as co-targeting HER2, IL13Rα2, and EPHA2 because trivalent these CAR-T-cells have shown success in overcoming inter-patient variability in glioblastoma mouse models25,27.
EPHA2 mono-specific and trivalent CAR-T-cells can target primary, metastatic and recurrent Group 3 medulloblastoma.
Intraventricular delivery of antibody conjugates via the CSF have been well-tolerated by patients in clinical trials for the treatment of CNS malignancies28,29. Cell delivery approaches, specifically intracavity administration to bypass the blood-brain barrier have been tested in patients with metastatic melanoma30 and with glioblastoma, with success in the latter documented in 3 patients17. Therefore, we sought to determine whether a single dose of intraventricularly delivered CAR-T-cells administered via the lateral ventricle (LV) could have a potent anti-tumour affect, we used orthotopic patient derived cerebellar xenograft models (PDX) of Group 3 medulloblastoma (Med114FH, Med411FH and MDT-MMB) transduced with an eGFP-firefly luciferase fusion gene, xenografted into the cerebellum of NOD scid gamma (NSG) mice (Figure 1A).
Figure 1. CAR T-cell therapy improves survival in Group 3 medulloblastoma orthotopic xenograft models.
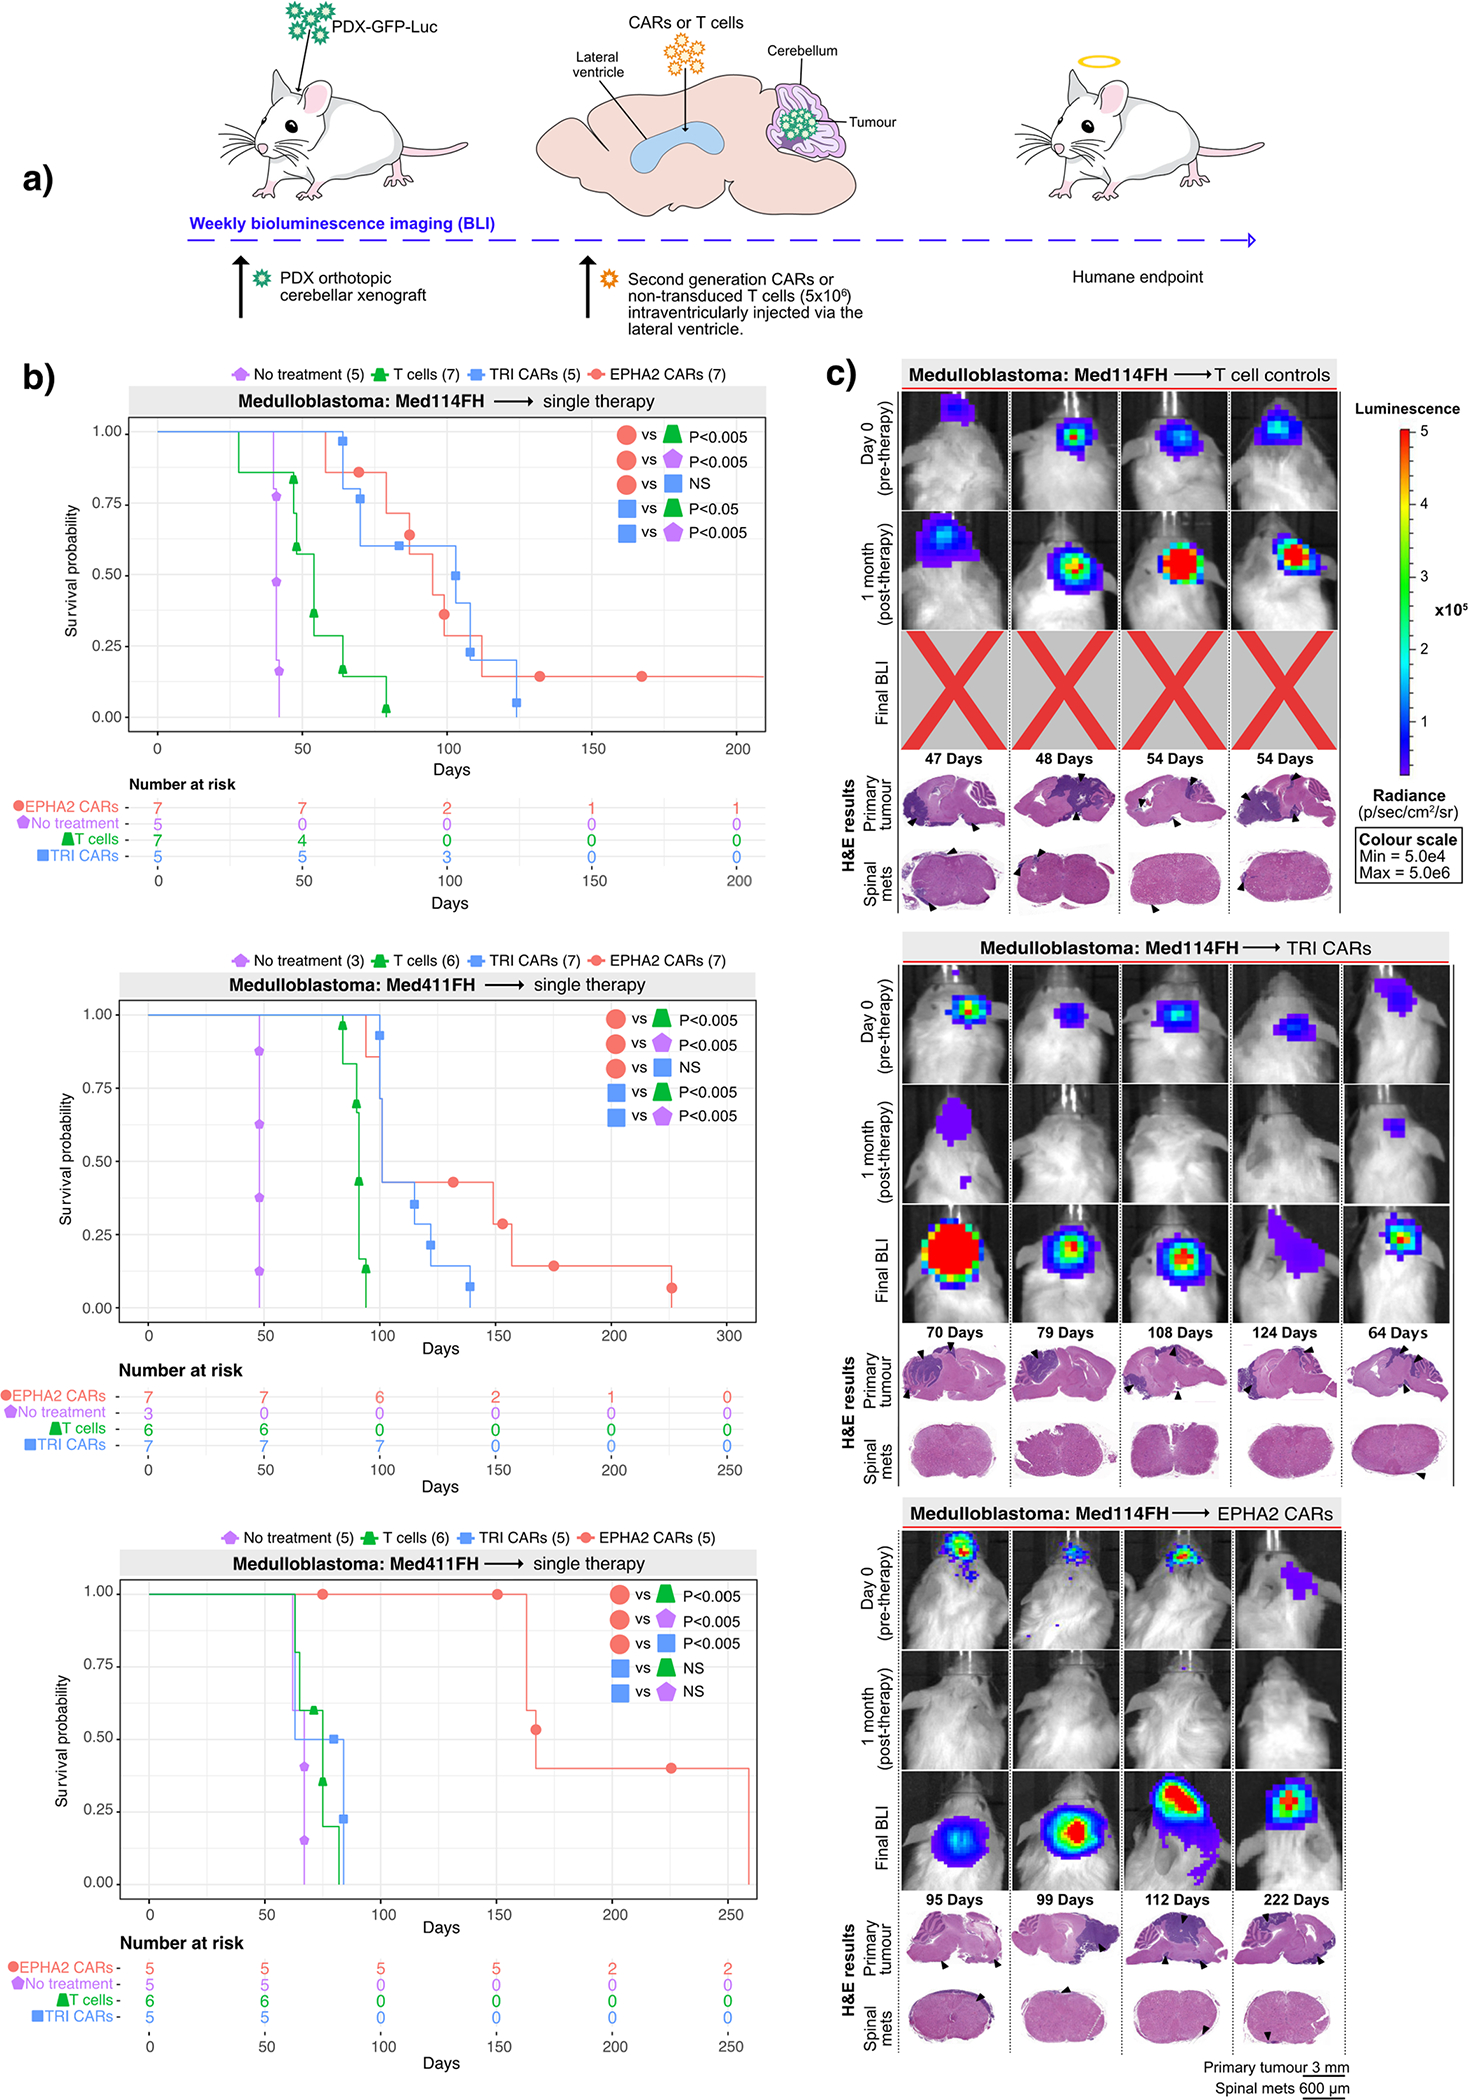
(a) Experimental scheme - Patient-derived Group 3 medulloblastoma cells expressing eGFP-firefly luciferase (PDX-GFP-Luc) were xenografted into NSG mice. Bioluminescence imaging (BLI) was performed to determine orthotopic engraftment, at which point a single dose of 5×10⁶ (equivalent to a 20:1 ratio tumour cells:CAR-T-cells) monovalent EPHA2 CAR-T-cells, trivalent CAR-T (EPHA2, HER2 and IL13Rα2) cells, or non-transduced T-cell controls were injected into intraventricularly via the lateral ventricle. Tumour burden was monitored weekly by BLI until humane endpoint. (b) Survival analysis of T-cell treated xenografts of Med-114FH, Med411FH and MDT-MMB. Two-sided log-rank test Benjamini-Hochberg (BH), n = 19 EPHA2 CAR T-cells, 19 TRI CARs-T-cells, 19 non-transduced T-cells and 13 no treatment (NT) controls across 3 independent PDX models. Med114FH: EPHA2 vs T-cells P=0.004, EPHA2 vs NT P=0.0025, EPHA2 vs TRI P=0.9223, TRI vs T-cells P=0.0134, TRI vs NT P=0.0040; Med411FH: EPHA2 vs T-cells P=0.002, EPHA2 vs NT P=0.004, EPHA2 vs TRI P=0.2439, TRI vs T-cells P=0.0017, TRI vs NT P=0.0040; MDT-MMB: EPHA2 vs T-cells P=0.0062, EPHA2 vs NT P=0.0063, EPHA2 vs TRI P=0.0062, TRI vs T-cells P=0.2138, TRI vs NT P=0.2709 (c) BLI and final Hematoxylin-eosin (H&E) staining analysis of NSG mice xenografted with Med114FH, intraventricularly infused via the lateral ventricle with non-transduced T-cells, TRI CAR T-cells or EPHA2 CAR T-cells (colour map for all images indicates radiance), n = 7 EPHA2 CAR T-cells, 5 TRI CARs-T-cells, 7 non-transduced T-cells and 5 no treatment (NT) biologically independent PDX models. Each column represents one mouse, each row represents a time point, with mouse endpoint (days post therapy) noted in ‘Days’.
A single dose of trivalent CAR-T-cells significantly increased survival versus non-transduced T-cells in 2 out of the 3 medulloblastoma models (Med114FH=P<0.05, Med411FH=P<0.05) and a robust survival improvement was seen with a single dose of EPHA2 CAR-T-cells across all 3 PDXs (versus no treatment P<0.005, versus non-transduced T-cells P<0.005) (Figure 1B). There was no significant difference observed in survival between EPHA2 CAR and TRI CAR-T-cell therapy in Med114FH and Med411FH. Non-transduced T-cell treated mice displayed large residual primary tumours post-mortem. In contrast, we observed minimal tumour recurrence in the trivalent CAR-T-cell treated mice (Figure 1C; Supplementary Figures 1A, 1B, and Supplementary Figure 2). Mice treated with either EPHA2 CAR-T-cells or trivalent CAR-T-cells showed an anti-tumour response at 1-month post-therapy; however, tumour recurrences were seen with both treatments. Spinal metastases were only noted following EPHA2 CAR Therapy. As the primary tumour regressed following a single round of EPHA2 CAR-T-cells we believe this allowed time for the tumour to metastasize, hence the eventual recurrence. In comparison, mice treated with non-transduced T-cells, or trivalent CAR-T-cells showed limited tumour regression following therapy, therefore, mice succumbed to their primary tumour burden before the seeding of associated metastases, and time to endpoint was accelerated.
We next evaluated whether a repeat therapy with non-transduced T-cells, trivalent CAR-T-cells, or EPHA2 CAR-T-cells could extend survival following tumour recurrence (Figure 2A). Upon comparison with our single dose therapy experiments, a second round of non-transduced T-cells showed no survival advantage versus a single dose across all three medulloblastoma models. Repeat therapy of trivalent CAR-T-cells, versus a single dose of trivalent CAR-T-cells, showed a significant increase in time to endpoint in 1/3 of the medulloblastoma models More strikingly, repeat therapy using EPHA2 CAR-T-cells resulted in a significant overall survival benefit versus a single EPHA2 CAR-T-cell treatment in medulloblastoma models Med114FH (P<0.05) and Med411FH (P<0.05), and progression-free survival in model MDT-MMB (P<0.05) (Figure 2B). Endpoint H&E staining analysis showed that mice treated with non-transduced T-cells or trivalent CAR-T-cells continued to exhibit tumour burden at endpoint (Figure 2C, Supplementary Figures 3 and 4). In comparison, following tumour recurrence, a second infusion of intraventricular EPHA2 CAR-T-cells into the CSF effectively cleared both the primary and metastatic tumour as demonstrated by BLI and endpoint H&E analysis (Figure 2C; Extended Figure 3B). Immunohistochemical analysis of tumours that recurred identified stable EPHA2 protein expression, suggesting a lack of antigen escape after one or two doses of CAR-T-cell therapy in this model system (Extended Figure 3A and 3B). We conclude that intraventricular delivery of CAR-T-cell therapy is a promising approach for the treatment of both primary and metastatic Group 3 medulloblastoma, and that repeat administration may provide additional clinical benefit.
Figure 2. Repeat dosing of EPHA2-CAR T-cells improves antitumour response in Group 3 medulloblastoma orthotopic xenograft models.
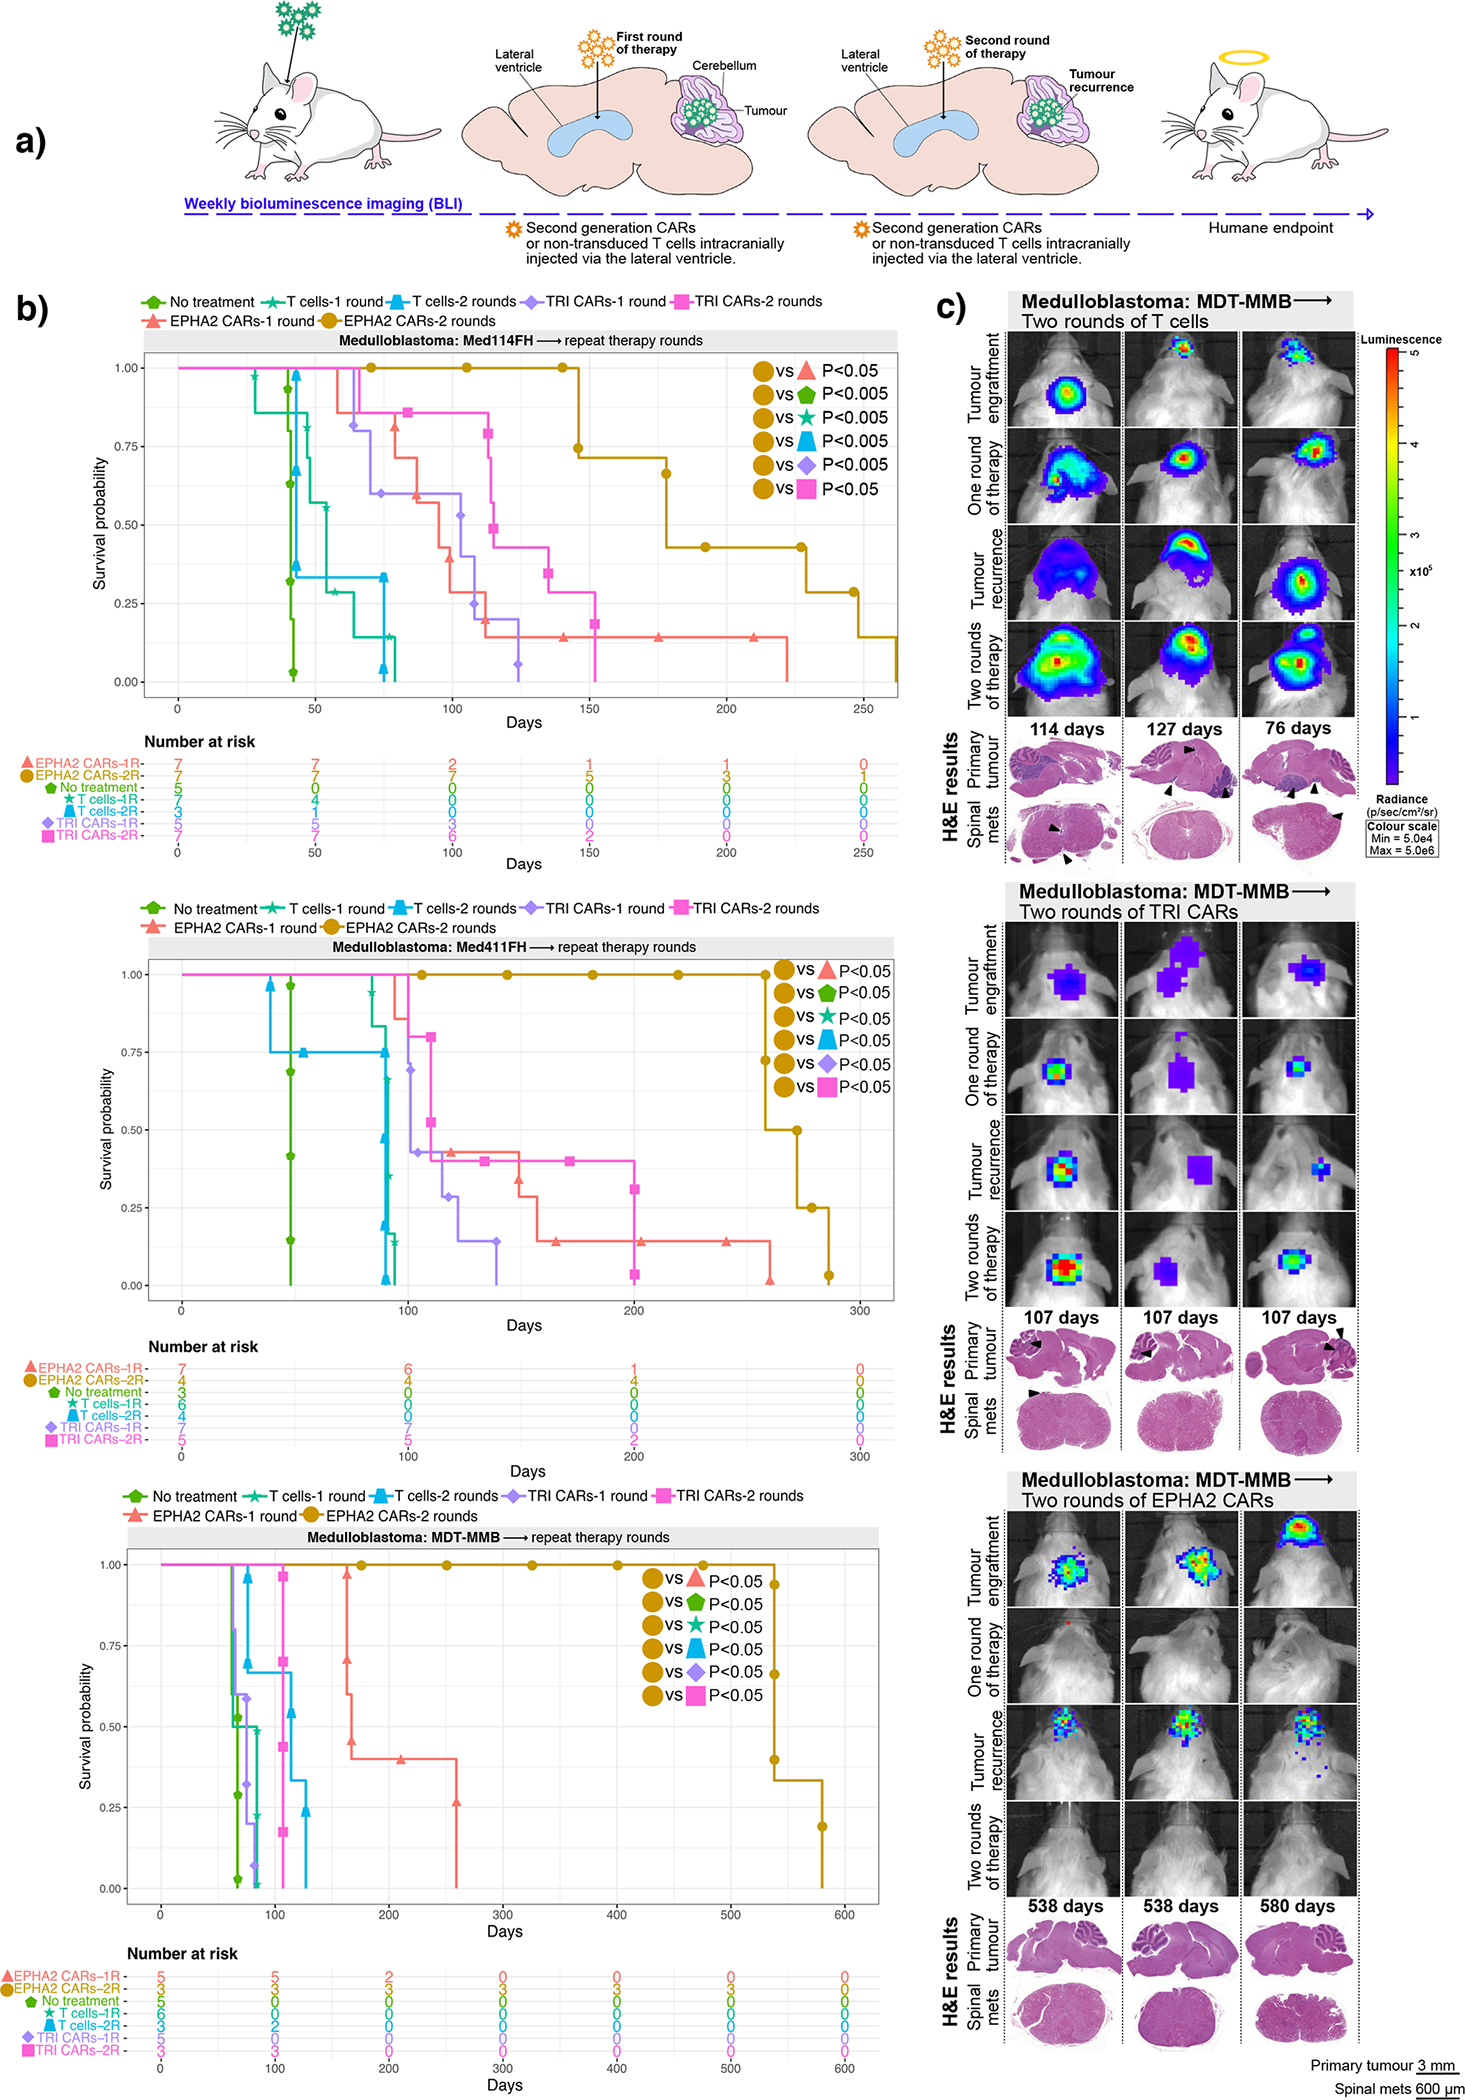
(a) Experimental scheme - Patient-derived Group 3 medulloblastoma cells expressing eGFP-firefly luciferase (PDX-GFP-Luc) were xenografted into NSG mice. BLI performed weekly to determine orthotopic engraftment, at which point a first round of EPHA2 CAR T-cells, TRI CAR T-cells or non-transduced T-cells were administered via the lateral ventricle. Tumour burden was monitored weekly by BLI until tumour progression or recurrence observed, wherein a second round of CARs or non-transduced T-cells were administered (b) Survival analysis of repeat therapy treated xenografts of Med-114FH, Med411FH, and MDT-MMB. Two-sided log-rank test Benjamini-Hochberg (BH), n = 14 EPHA2 CAR repeat therapy, 15 TRI CAR repeat therapy and 10 non-transduced T-cells repeat therapy across 3 independent PDX models. Med114FH: EPHA2-one round (1R) vs EPHA2-two rounds (2R) P=0.0099, EPHA2–2R vs NT P=0.0015, EPHA2–2R vs T-cells-1R P=0.0015, EPHA2–2R vs T-cells-2R P=0.0032, EPHA2–2R vs TRI-1R P=0.0015, EPHA2–2R vs TRI-2R P=0.0074; Med411FH: EPHA2–1R vs EPHA2–2R P=0.0258, EPHA2–2R vs NT P=0.0200, EPHA2–2R vs T-cells-1R P=0.0089, EPHA2–2R vs T-cells-2R P=0.00151, EPHA2–2R vs TRI-1R P=0.0071, EPHA2–2R vs TRI-2R P=0.0109. MDT-MMB: EPHA2–1R vs EPHA2–2R P=0.024, EPHA2–2R vs NT P=0.022, EPHA2–2R vs T-cells-1R P=0.022, EPHA2–2R vs T-cells-2R P=0.022, EPHA2–2R vs TRI-1R P=0.022, EPHA2–2R vs TRI-2R P=0.024. (c) BLI and final H&E staining analysis of mice xenografted with MDT-MMB, intraventricularly infused via the lateral ventricle with two rounds of non-transduced T-cells, TRI CAR T-cells, or EPHA2 CAR T-cells (colour map indicates radiance), n = 3 EPHA2–2R CAR T-cells, 3 TRI-2R CARs-T-cells, 3 non-transduced-2R T-cells biologically independent PDX models. Each column represents one mouse, each row represents a time point, with mouse endpoint (days post therapy) noted in ‘Days’. An ‘X’ indicates censored mice with no tumour at endpoint.
Identification of candidate targets for CAR-T-cell therapy of PFA ependymoma
To identify candidate CAR-T-cell targets for PFA ependymoma, we analysed RNA expression profiles from 100 subgroup specific human ependymoma samples (PFA (n=54); Spinal cord (n=15); Supratentorial (RELA) (n=31))31. Highly expressed genes were cross referenced with CAR-T-cells currently available for clinical trials32 identifying the same 3 differentially expressed genes EPHA2, HER2 and IL13Rα2 observed in medulloblastoma (Extended Figures 4A, 4B, 4C). We verified that EPHA2, HER2 and IL13Rα2 were highly expressed at the protein level across ependymoma subgroups using a Canadian multicentre ependymoma TMA (PFA (n=58); Supratentorial ependymoma (RELA) (n = 35); Spinal ependymoma (n = 11) (Extended Figures 4D – 4J and 5A – 5E) with EPHA2 protein expression present in 83/84 of patients, HER2 protein expression present in 77/84 of patients, and IL13Rα2 protein expression present in 72/84 of patients. Protein expression was also verified as stable between paediatric ependymoma primaries and their matched recurrences (Extended Figures 6A, 6B, 6C, versus normal tissue controls Extended Figures 6D, 6E, 6F). In vitro functional co-culture assays used to determine the minimal CAR-T-cell ratio required to elicit optimal cytotoxic response, corroborated our earlier in vivo functional testing (Supplementary Figure 5A and 5B). We conclude that EPHA2, HER2 and IL13Rα2 are potential candidate targets for CAR-T-cell therapy of PFA ependymoma.
Consequently, we investigated the use of trivalent CAR-T-cells against PFA ependymoma, and in parallel we also tested the HER2 monovalent CAR-T-cell because HER2 protein expression remained consistent across PFA ependymomas. The anti-tumour activity of a single LV infusion was determined using PFA ependymoma PDX models (MDT-PFA4, MDT-PFA5, PFA-Ep612) transduced with an eGFP-firefly luciferase fusion gene, xenografted into the cerebellum of NSG mice (Figure 3A). HER2 CAR-T-cell treated mice showed a significant increase in survival versus non-transduced T-cell-treated mice (MDT-PFA4=P<0.05, MDT-PFA5=P<0.05, Ep612=P<0.005), with a parallel therapeutic response observed for the trivalent CAR-T-cells versus non-transduced T-cell controls (MDT-PFA4=P<0.05, MDT-PFA5=P<0.05, Ep612=P<0.05). No significant difference (NS) was observed between the monovalent HER2 CAR-T-cell therapy and trivalent CAR-T-cell therapy in all 3 PFA ependymoma models (Figure 3B). All mice treated with non-transduced T-cells displayed residual tumour at endpoint. Mice treated with monovalent HER2 CAR-T-cells showed tumour regression and substantial decrease in tumour burden at end point, with 1 mouse exhibiting no residual tumour at autopsy. Trivalent CAR-T-cells showed an anti-tumour response at 1-month post-therapy, with 2/5 mice tumour free at endpoint (Figure 3C; Supplementary Figure 6). We conclude that intraventricular CAR-T-cell therapy is a promising therapy for PFA ependymoma.
Figure 3. HER2 and TRI-CAR T-cell therapy are effective therapy for PFA ependymoma xenografts.
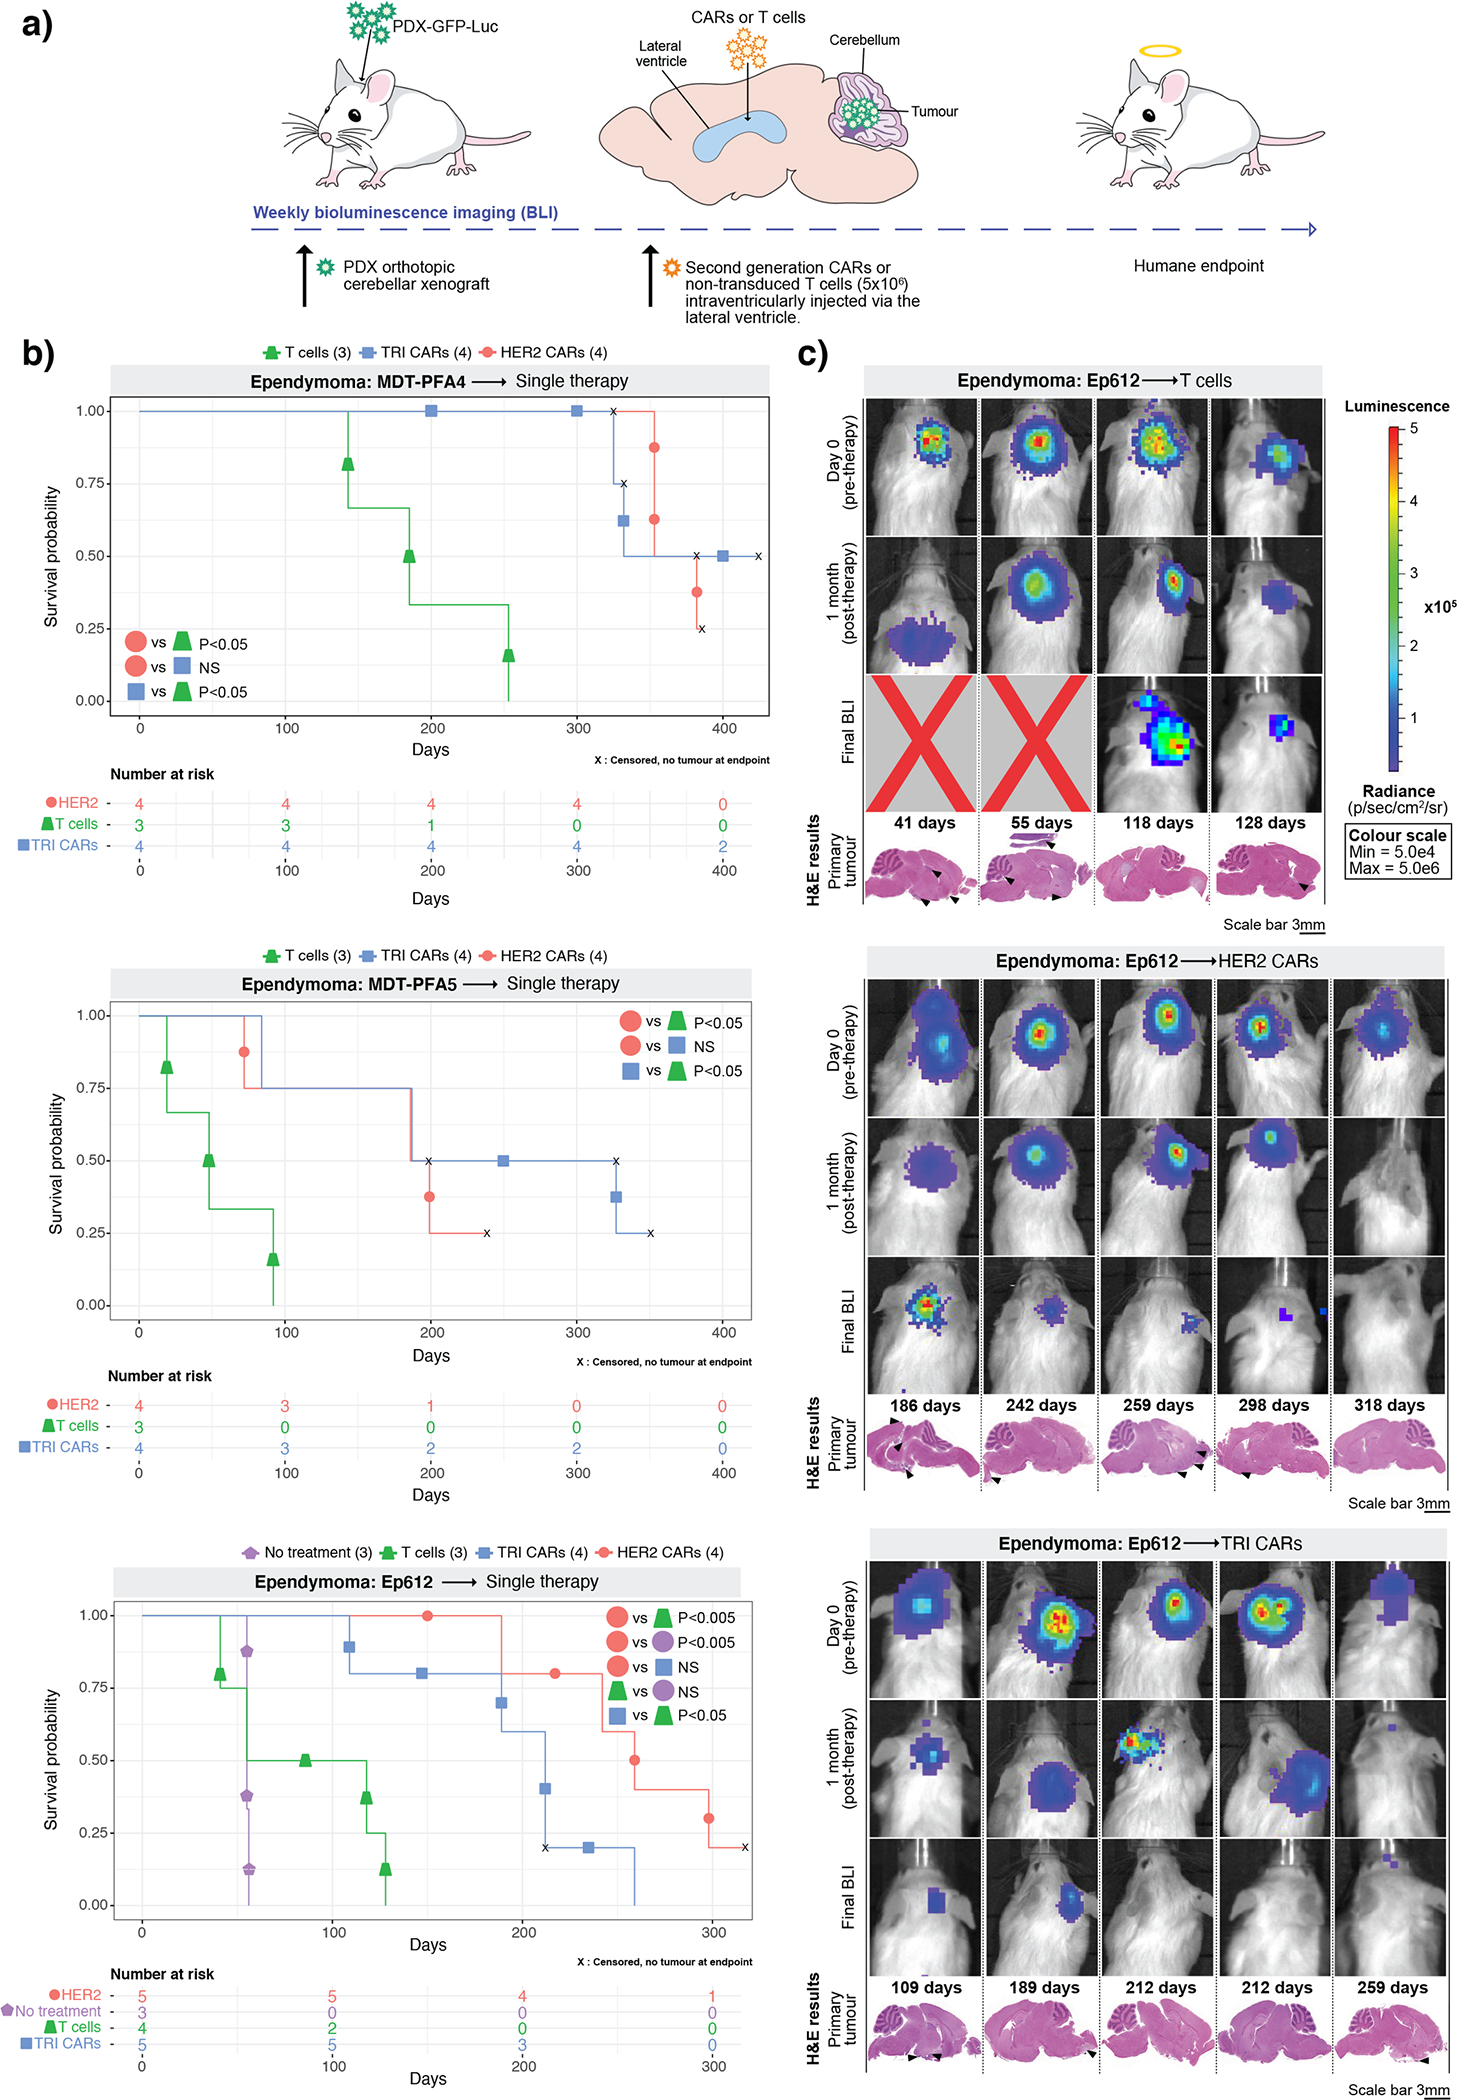
(a) Experimental scheme - PFA ependymoma cells expressing eGFP-firefly luciferase (PDX-GFP-Luc) were xenografted into NSG mice. BLI was performed to determine engraftment, at which point a single dose of HER2 CAR T-cells, TRI CAR T-cells or non-transduced T-cells were intraventricularly infused via the lateral ventricle. Tumour burden was monitored weekly by BLI until endpoint. (b) Survival analysis of CAR T-cell treated xenografts of MDT-PFA4, MDT-PFA5 and Ep612. Two-sided log-rank test (BH), n = 13 HER2 CAR T-cells, 13 TRI CAR T-cells and 11 non-transduced T-cells across 3 independent PDX models. MDT-PFA4: HER2 vs T-cells P=0.0015, HER2 vs TRI P=0.508, TRI vs T-cells P=0.015; MDT-PFA5: HER2 vs T-cells P=0.05, HER2 vs TRI P=0.268, TRI vs T-cells P=0.05; Ep612: HER2 vs T-cells P=0.0092, HER2 vs TRI P=0.1123, HER2 vs NT P= 0.0092, TRI vs T-cells P=0.0334, T-cells vs NT P=0.4409. (c) BLI and H&E staining analysis of NSG mice xenografted with Ep612, intraventricularly infused with non-transduced T-cells, HER2 CAR T-cells, TRI CAR T-cells (colour map indicates radiance), n = 5 HER CAR T-cells, 5 TRI CARs-T-cells, 4 non-transduced T-cells, and 3 no treatment controls biologically independent PDX models. Each column represents one mouse, each row represents a time point, with mouse endpoint (days post therapy) noted in ‘Days’.
Comparison of intravenous versus locoregional CSF delivery of CAR-T-cells.
A fundamental factor for the advancement of CAR T cell therapy for brain tumours is the choice of delivery route and whether intravenous (IV) or locoregional delivery is more favourable. Studies assessing delivery routes of glioblastoma and breast cancer brain metastases showed that local delivery significantly outperforms IV delivery of CAR-T-cells in orthotopic mouse models33,34. To identify the optimal approach for delivery of our candidate CAR-T-cells, we compared a single dose of IV (IV) CAR-T-cell infusions via the tail vein versus LV infusion in 3 PDX Group 3 medulloblastoma models (Med114FH, Med411FH, and MDT-MMB) (Figure 4A). IV delivery of monovalent EPHA2 CAR-T-cells showed a significant increase in survival versus no treatment (Med114FH=P<0.05, Med411FH=P<0.05, MDT-MMB=P<0.05), and a survival advantage versus non-transduced T-cells in 2/3 of the medulloblastoma models (Med114FH=NS, Med411FH=P<0.05, MDT-MMB=P<0.05). Importantly, intraventricular delivery via the LV of monovalent EPHA2 CAR-T-cells resulted in significant overall survival for all 3 PDX medulloblastoma models versus IV EPHA2 CAR-T-cells (Med114FH=P<0.005, Med411FH=P<0.05, MDT-MMB=P<0.05) (Figure 4B). Non-transduced T-cell treated mice, trivalent CAR-T-cell and monovalent EPHA2 CAR-T-cell treated mice showed no regression in tumour size following IV infusion; the mice had large primary cerebellar tumours with extensive infiltration (Figure 4C; Supplementary Figures 7, 8). 1/5 and 3/5 mice exhibited spinal metastases following IV trivalent CAR-T-cell and monovalent EPHA2 CAR-T-cell therapy, respectively. Effective tumour clearance and/or delayed progression were not observed after IV infusion (Extended Figure 3C).
Figure 4. Lateral ventricle administration of CAR T-cells is superior to IV administration for Group 3 medulloblastoma orthotopic xenograft models.
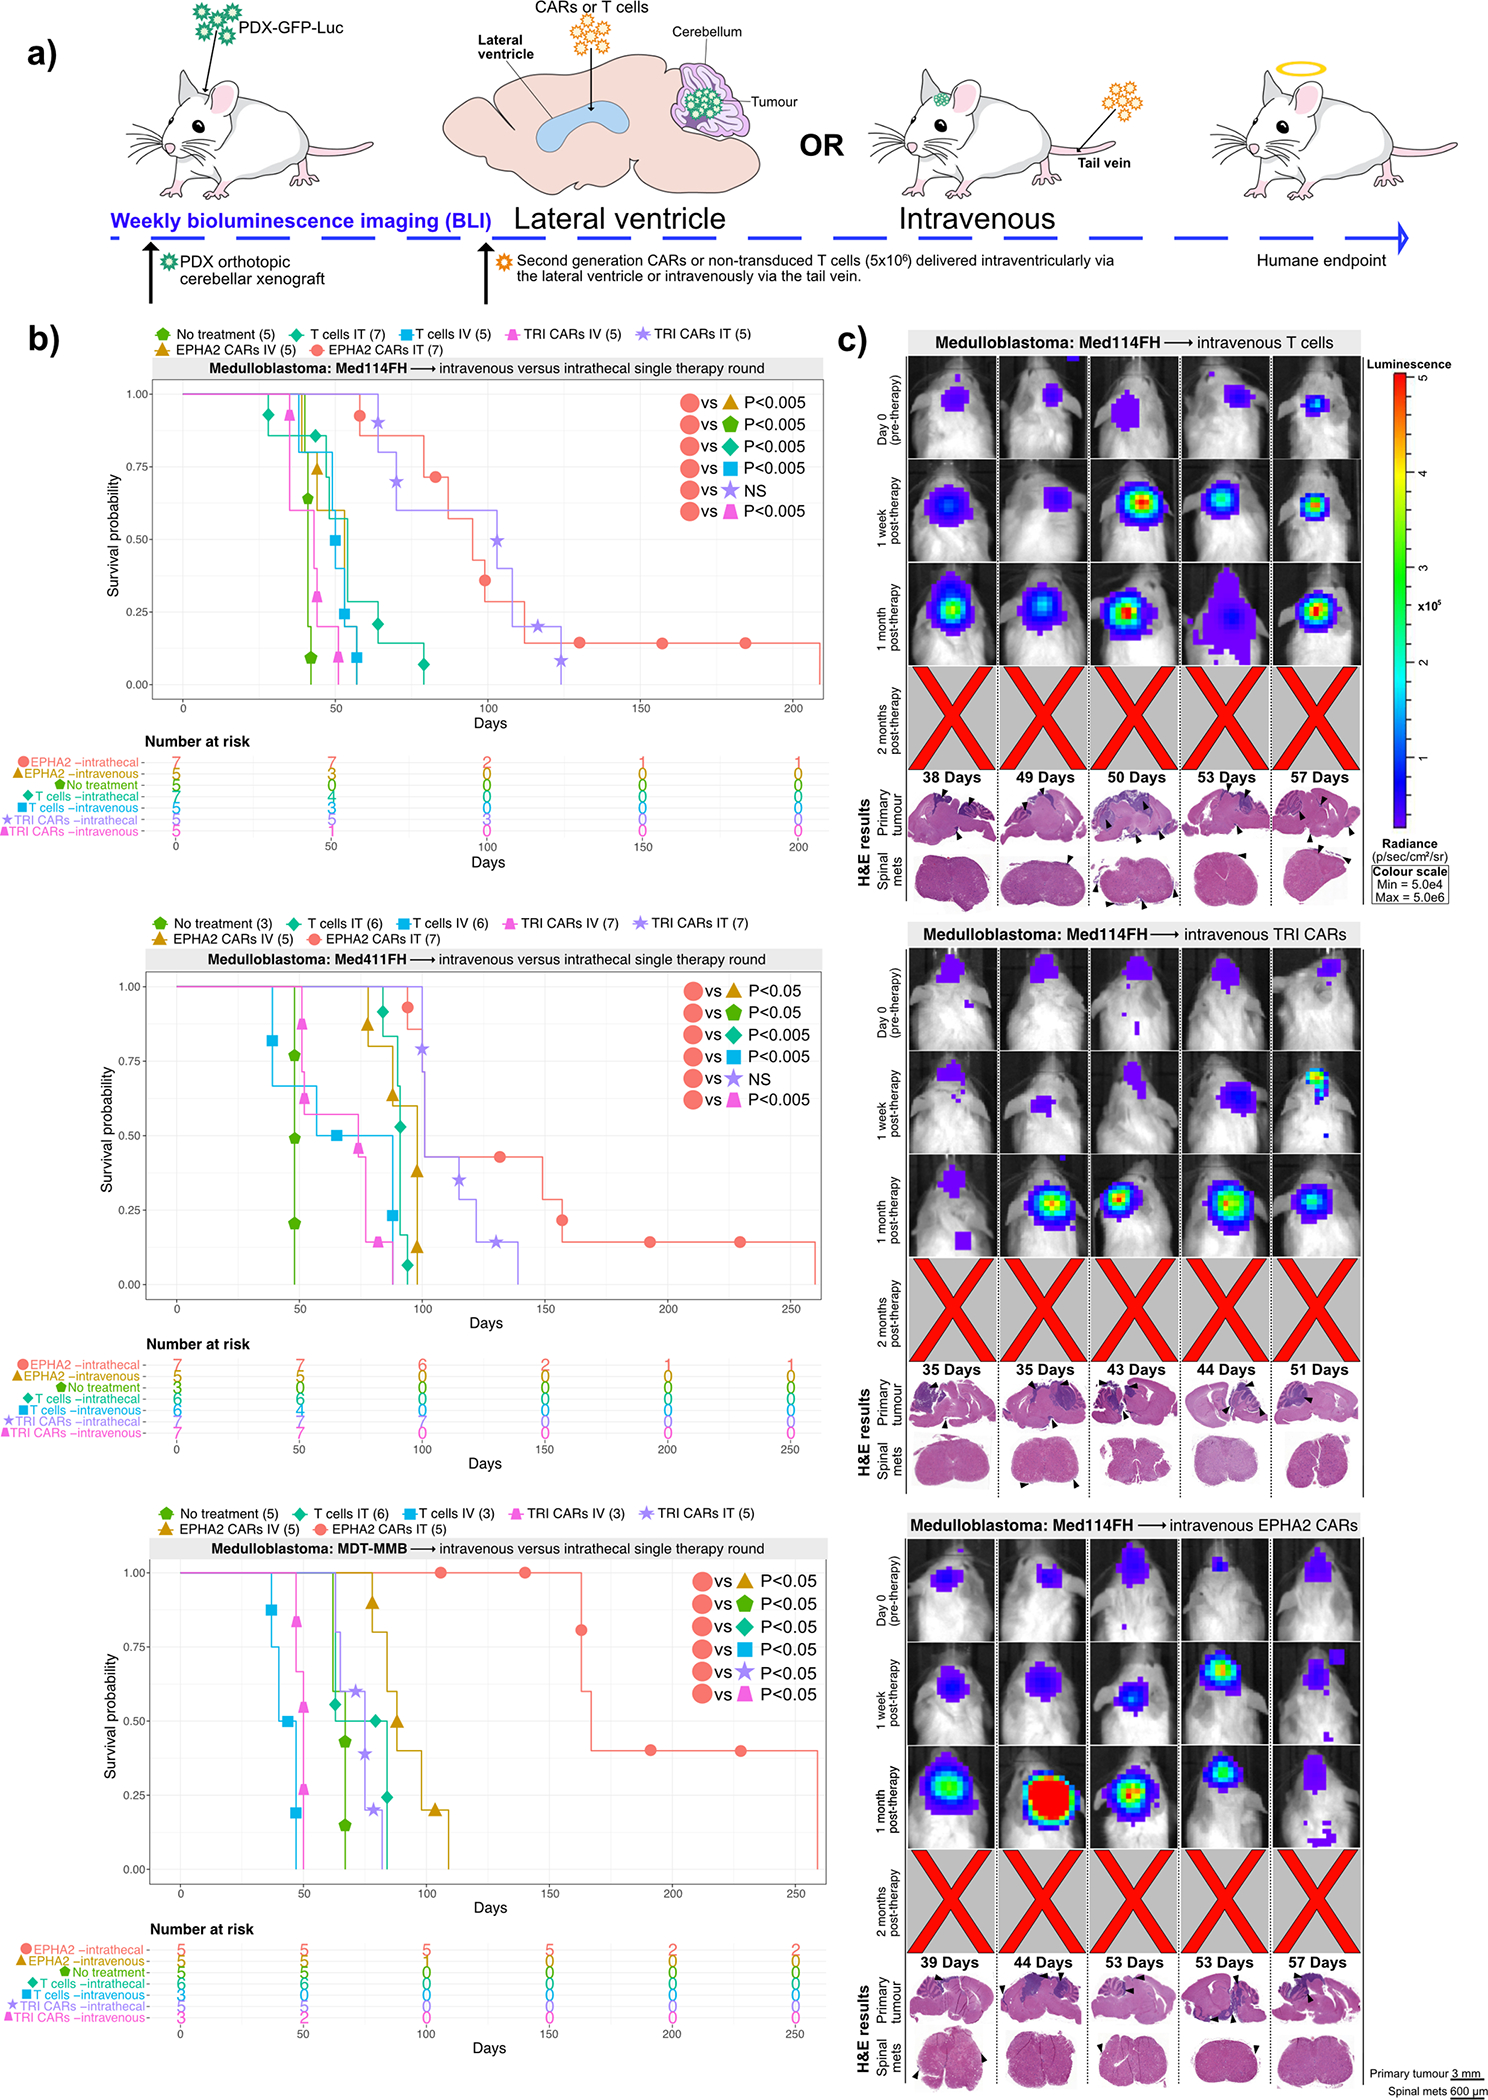
(a) Experimental scheme - Patient-derived Group 3 medulloblastoma cells expressing eGFP-firefly luciferase (PDX-GFP-Luc) were xenografted into NSG mice. BLI was performed to determine engraftment, wherein a single dose of EPHA2 CAR T-cells, TRI CAR T-cells, or non-transduced T-cells were intraventricularly or IV administered. Tumour burden was monitored weekly by BLI until endpoint. (b) Survival analysis of orthotopic mouse models of Med-114FH, Med411FH, and MDT-MMB. Two-sided log-rank test (BH), n = 15 IV EPHA2 CAR T-cells, 15 IV TRI CAR T-cells, and 14 IV non-transduced T-cells across 3 independent medulloblastoma PDX models. Med114FH: EPHA2 lateral ventricle (LV) vs EPHA2 IV P=0.0021, EPHA2 LV vs NT P=0.0021, EPHA2 LV vs T-cells LV P=0.0048, EPHA2 LV vs T-cells IV P=0.0021, EPHA2 LV vs TRI CAR LV P=0.09223, EPHA2 LV vs TRI CAR IV P=0.0021; Med411FH: EPHA2 lateral ventricle (LV) vs EPHA2 IV P=0.01, EPHA2 LV vs NT P=0.0052, EPHA2 LV vs T-cells LV P=0.0022, EPHA2 LV vs T-cells IV P=0.0018, EPHA2 LV vs TRI LV P=0.2695, EPHA2 LV vs TRI IV P=0.0017; MDT-MMB: EPHA2 lateral ventricle (LV) vs EPHA2 IV P=0.0076, EPHA2 LV vs NT P=0.0076, EPHA2 LV vs T-cells LV P=0.0076, EPHA2 LV vs T-cells IV P=0.0076, EPHA2 LV vs TRI LV P=0.0076, EPHA2 LV vs TRI IV P=0.0094. (c) BLI and H&E staining analysis of medulloblastoma PDX model Med114FH, IV transfused with non-transduced, TRI CAR T-cells, or EPHA2 CAR T-cells (colour map indicates radiance), n = 5 EPHA2 CAR T-cells intravenous, 5 TRI CARs-T-cells intravenous, and 5 non-transduced T-cells intravenous biologically independent PDX models. Each column represents one mouse, each row represents a time point, with mouse endpoint (days post therapy) noted in ‘Days’.
As the effects of locoregional delivery of CAR-T-cells via the CSF appeared more potent than IV infused CAR-T-cells, we conducted a dose potency study in two medulloblastoma PDXs to determine the minimal dose required to exert tumour clearance via the two different routes of administration (Extended Figure 7A and 7B). No differences in survival or tumour burden was observed between the two delivery routes from 5×10⁶ to 10×106 non-transduced (Supplementary Figures 8 and 9) or trivalent CAR-T-cells (Supplementary Figures 10 and 11) between the two delivery routes. However, tumour burden significantly decreased when treated with EPHA2 CAR-T-cells LV (Extended Figures 8A and 9A) versus IV delivery (Extended Figures 8B and 9B) at doses of 5×10⁶ or 10×106 (Med114FH=P<0.0005, P<0.0005; Med411FH=P<0.0005, P<0.05, respectively). Because the lower dose of 2.5×10⁶ EPHA2 CAR-T-cells was not seen to effectively clear the tumour burden, and we determined the lowest optimal dose to therefore be 5×10⁶ CAR-T-cells (Extended Figures 8C and 9C). Longitudinal analysis of CSF and blood collected at humane or defined endpoint showed an increase in IL23 release, a cytokine which plays a critical role in establishing inflammatory immunity and enhanced T-cell activation state35, in intraventricularly infused mice, regardless of the CAR- or non-transduced T-cells being delivered, suggesting an enhanced state of T-cell activation due to the increased proximity of the T-cells to the tumour site (Extended Figure 10A) (IV versus intraventricular CSF delivery=P<0.05). Granulocyte-macrophage colony-stimulating factor (GM-CSF) cytokine, an essential regulator of T cell activation36, was consistently secreted across all treatment groups. Except for IL15 (a serum cytokine)37, which was seen within all blood serum samples, no other distinct patterns of cytokine activity were observed between delivery routes and dose escalations. T-cell accumulation was seen only in mice infused LV with EPHA2 CAR-T-cells (Extended Figures 10B and 10C). Therefore, while IV delivery of CAR-T-cells demonstrates some activity, intraventricular administration of EPHA2 -targeting CAR-T-cells (not trivalent CAR-T-cells) delivers superior therapeutic outcomes in our Group 3 medulloblastoma in vivo models. Intraventricular CSF delivery allows direct CAR-T-cell access to the tumour site and concomitant increased maintenance of CAR-T-cell activation as a result.
A monovalent CAR-T-cell conformation is superior in an EPHA2-rich environment
In previous work, T-cells with multiple CARs have typically proved more efficacious than their monovalent CAR-T-cell counterparts. Computational modeling and docking of the HER2 (Supplementary Figure 12A), IL13Rα2 (Supplementary Figure 12B), and EPHA2 (Supplementary Figure 12C and D) CARs to their receptors was performed to better understand the efficacy differences observed between the monovalent and trivalent CAR-T-cells. Two models for EPHA2 CAR were generated from SWISSMODEL, a monomer and a homodimer. The dimeric EPHA2 CAR allows for docking of two EPHA2 receptors (Supplementary Figure 12E, 12F) which may result in overall decreased activity of the trivalent CAR-T-cell versus the monomeric EPHA2 CAR-T-cell due to steric constraints at the immune synapse (Supplementary Figure 12G, 12H).
To address the significant differences in CAR-T-cell efficacy between the monovalent EPHA2 CAR-T-cells and trivalent CAR-T-cells, we conducted in vivo composite mix analysis (Supplementary Figure 13A). We found a composite mixture of CAR-T-cells to be inferior to the monovalent EPHA2 CAR-T-cells (P=0.0003, Cox Proportional Hazard). Interestingly, we also saw a marked decrease in survival in comparison to the trivalent CAR-T-cells (P=0.03, Log- rank test Benjamini-Hochberg (BH)). We believe this decrease in survival is due to the overall decrease in candidate CARs numbers administered via composite mixture; for example, the EPHA2 : HER2 : IL13Rα2 mixture contained candidate CAR ratios of 1.6×10⁶ : 1.6×10⁶ : 1.6×10⁶ to give a total final number of 5×10⁶. We conclude that, trivalent CAR T-cells, while inferior to the monovalent EPHA2 CAR T- cells, remains superior to a composite mixture of CAR T-cells.
EPHA2 monovalent CAR-T-cells synergize with azacytidine to significantly improve overall survival for Group 3 medulloblastoma.
Whilst EPHA2 CAR-T-cells are efficacious to a certain degree, tumour recurrences were observed, therefore we sought to improve this therapy with a combination therapy approach. One mechanism of failure, or suboptimal response to CAR-T-cell therapy is antigenic escape secondary to epigenetic silencing of the gene targeted by the CAR-T-cells38. Azacytidine is a well-documented hypomethylating agent and effective chemotherapeutic agent for acute myelogenous leukaemia39,40. Through covalent trapping of DNA methyltransferase in genomic DNA, and subsequent hypomethylation, azacytidine acts to induce cell death in cancer cells reliant on epigenetic silencing14,41 and transiently increases expression of tumour associated antigens42,43. Furthermore, various immunomodulatory effects of azacytidine have been well documented, including sensitization of tumour cells to cytotoxic CD8+ T cells43,44 and stimulated expansion of regulatory CD4+ T cells and CD8+ cytotoxic T cells45. To determine if epigenetic silencing was playing a role in treatment failure, we tested the synergistic role of the DNA demethylating agent azacytidine in combination with CAR-T-cells46–49.
Medulloblastoma cells (Med114FH and Med411FH) tagged with eGFP-firefly luciferase were xenografted into the cerebellum of NSG mice; 1-week post xenograft mice began subcutaneous azacytidine treatment (Figure 5A). CAR-T-cells were administered when orthotopic engraftment was confirmed by BLI. Monovalent EPHA2 CAR-T-cells in combination with azacytidine revealed a striking and significant survival advantage versus monovalent EPHA2 CAR-T-cells alone (Med114FH=P<0.005, Med411FH=P<0.005). In comparison to EPHA2 combination CAR-T-cell therapy, azacytidine in combination with trivalent CAR-T-cells (Med114FH=P<0.005, Med411FH=P<0.05) and or azacytidine plus non-transduced T-cells (Med114FH=P<0.005, Med411FH=P<0.005) (Figure 5B). Azacytidine treatment alone provided no survival advantage versus non-transduced T-cells alone for two Group 3 medulloblastomas (Med114FH=NS, Med411FH=0.005), but was significant in Med411FH. The combination of EPHA2 monovalent CAR-T-cells with azacytidine resulted in a significant decrease in tumour burden (Figure 5C), with complete tumour clearance and progression-free survival observed in 2/5 mice, reaching endpoint due to old age at 245 and 249 days respectively (Figure 2D, Supplementary Figure 13B). A significant increase in EPHA2 antigen expression following in vitro azacytidine treatment was observed in all 3 of the medulloblastoma PDXs (Med-114FH=P<0.001, Med-411FH=P<0.01, MDT-MMB=P<0.001) (Supplementary Figure 14), potentially accounting for this overall survival advantage. All mice showed significant tumour regression at 7-months post therapy, with 3 displaying small primary tumours at final endpoint. Mice receiving combined trivalent CAR-T-cells, or non-transduced T-cell therapy showed large primary cerebellar tumours and no regression in overall tumour size at 1-month post therapy by BLI. We conclude that the combination of azacytidine with locoregional LV CAR-T-cell therapy may offer additional benefits to patients with Group 3 medulloblastoma.
Figure 5. Azacytidine improves the response to EPHA2-CAR therapy for Group 3 medulloblastoma xenografts.
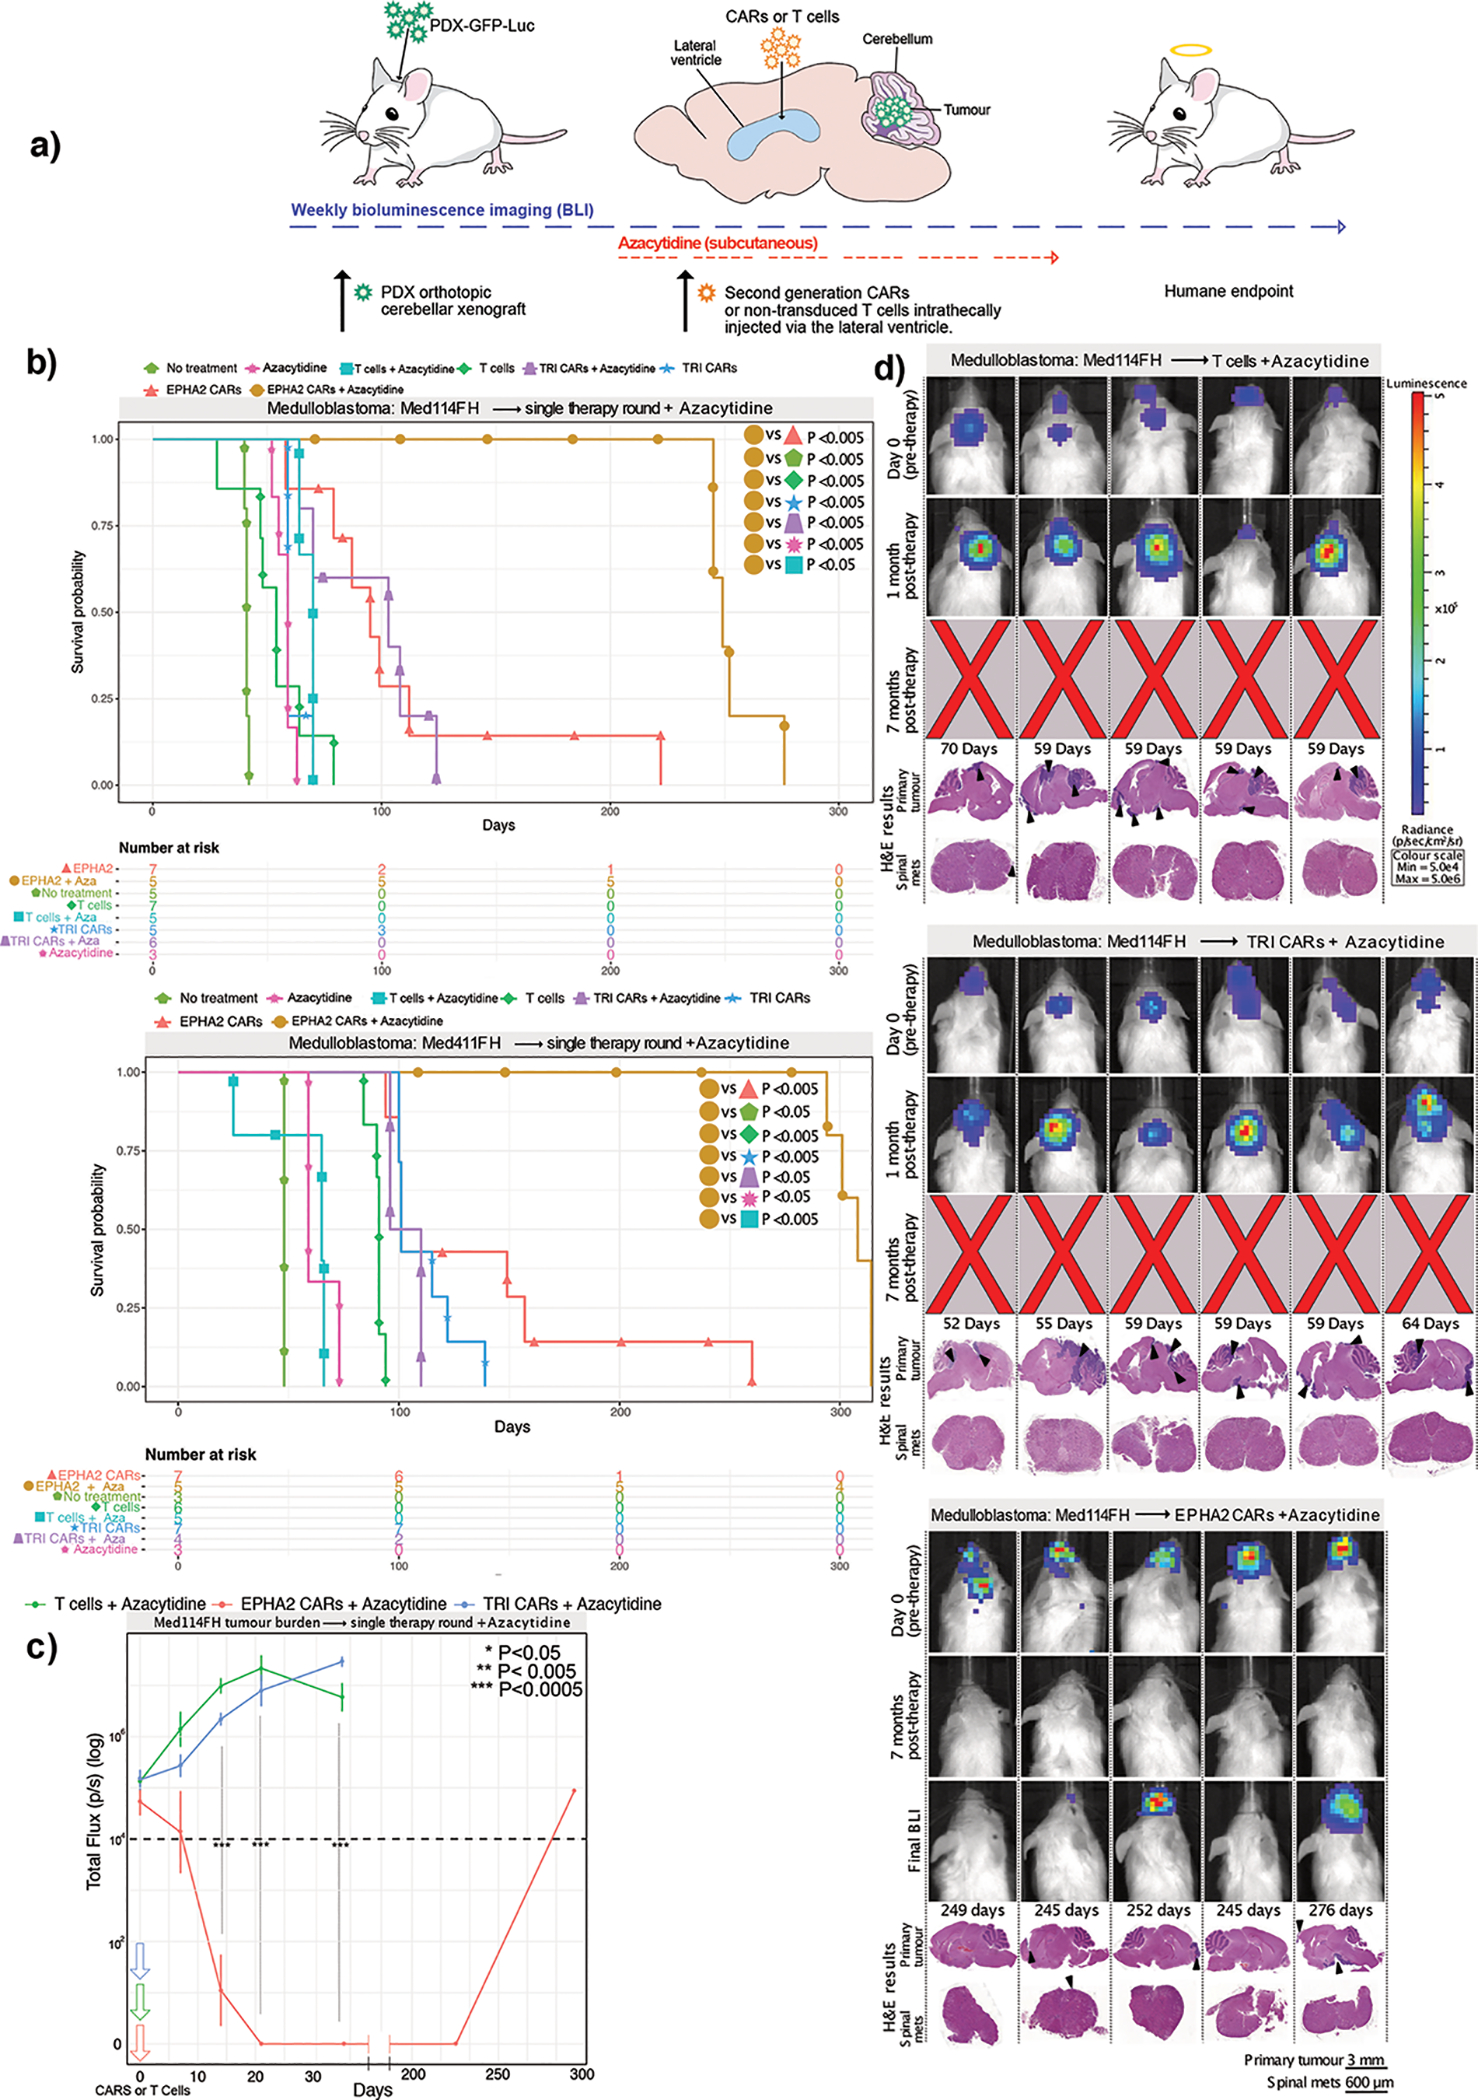
(a) Experimental scheme - Patient-derived Group 3 medulloblastoma cells expressing eGFP-firefly luciferase (PDX-GFP-Luc) were xenografted into NSG mice; 1-week post xenograft mice began subcutaneous treatment with azacytidine. BLI was performed to determine engraftment, at which point a single dose of EPHA2 CAR-T-cells, TRI CAR-T-cells, or non-transduced T-cells were administered in the lateral ventricle. Tumour burden was monitored by BLI until endpoint. (b) Survival analysis of orthotopic mouse models Med114FH and Med411FH treated with azacytidine and intraventricular lateral ventricle T-cell therapy. Two-sided log-rank test (BH), n = 10 EPHA2 CAR-T-cells + azacytidine, 10 TRI CAR-T-cells + azacytidine, and 10 non-transduced T-cells + azacytidine, within 2 independent medulloblastoma PDX models. Med114FH: EPHA2-azacytidine vs EPHA2 P=0.0047, EPHA2-azacytidine vs NT P=0.0047, EPHA2-azacytidine vs T-cells P=0.0047, EPHA2-azacytidine vs T-cells-azacytidine P=0.0047, EPHA2-azacytidine vs TRI P=0.0047, EPHA2-azacytidine vs TRI-azacytidine P=0.0047, EPHA2-azacytidine vs azacytidine only P=0.0135; Med411FH: EPHA2-azacytidine vs EPHA2 P=0.0036, EPHA2-azacytidine vs NT P=0.0114, EPHA2-azacytidine vs T-cells P=0.004, EPHA2-azacytidine vs T-cells-azacytidine P=0.005, EPHA2-azacytidine vs TRI P=0.0036, EPHA2-azacytidine vs TRI-azacytidine P=0.0067, EPHA2-azacytidine vs azacytidine only P=0.0073. (c) Tumour burden over time expressed as Total Flux (p/s) from BLI. ***P<0.0005, **P<0.005, *P<0.05 by two-sided One way ANOVA followed by Tukey post hoc test, n = 5 non-transduced T-cells-azacytidine, 6 TRI CAR T-cells-azacytidine, and 5 EPHA2 CAR T-cells-azacytidine biologically independent animals. Day 11: EPHA2 vs T-cells/TRI P=0.0000, Day 21: EPHA2 vs T-cells/TRI P=0.0000, Day 35: EPHA2 vs T-cells/TRI P=0.0000 (d) BLI and H&E analysis of PDX Med114FH, treated with azacytidine and LV infusion with non-transduced T-cells, TRI CAR-T-cells, or EPHA2 CAR-T-cells (colour map indicates radiance), n = 5 EPHA2-azacytidine, 6 TRI CARs-azacytidine, and 5 non-transduced T-cells-azacytidine biologically independent PDX models. Each column represents one mouse, each row represents a time point, mouse endpoint (days post therapy) noted in ‘Days’.
Combination CAR-T-cell and azacytidine for therapy of PFA ependymomas
To determine if azacytidine demonstrates synergy with HER2 monovalent or trivalent CAR-T-cell therapy for PFA ependymoma, patient derived xenografts (MDT-PFA4, MDT-PFA5, PFA-Ep612) tagged with eGFP-firefly luciferase were xenografted into the cerebellum of NSG mice and 1-week post xenograft, mice began subcutaneous azacytidine treatment (Figure 6A). CAR-T-cells were administered when orthotopic engraftment was confirmed by BLI. Mice receiving combined HER2 monovalent CAR-T-cells and azacytidine therapy exhibited a significant survival improvement versus mice receiving non-transduced T-cells plus azacytidine in all 3 ependymoma PDX models (MDT-PFA4=P<0.05, MDT-PFA5=P<0.05, Ep612=P<0.005). Trivalent CAR-T-cells combined with azacytidine therapy revealed a similar significant therapeutic response versus non-transduced T-cells and azacytidine (MDT-PFA4=P<0.05, MDT-PFA5=P<0.05, Ep612=P<0.005). Only the Ep612 PFA line displayed a significant survival benefit between HER2 CAR-T-cells compared to trivalent CAR-T-cells with azacytidine (P<0.05) (Figure 6B). The combined epigenetic modifier and immunotherapeutic approach showed the highest anti-tumour efficacy in all 3 PFA ependymoma models, with progression-free survival and effective tumour clearance observed in every mouse enrolled (Figure 6C, Supplementary Figure 15). As observed with medulloblastoma, the addition of Azacytidine to CAR-T-cell therapy improves survival and synergy, representing a promising therapy for PFA ependymoma.
Figure 6. Combined azacytidine and CAR T-cell therapy improves progression-free survival in PFA ependymoma orthotopic xenograft models.
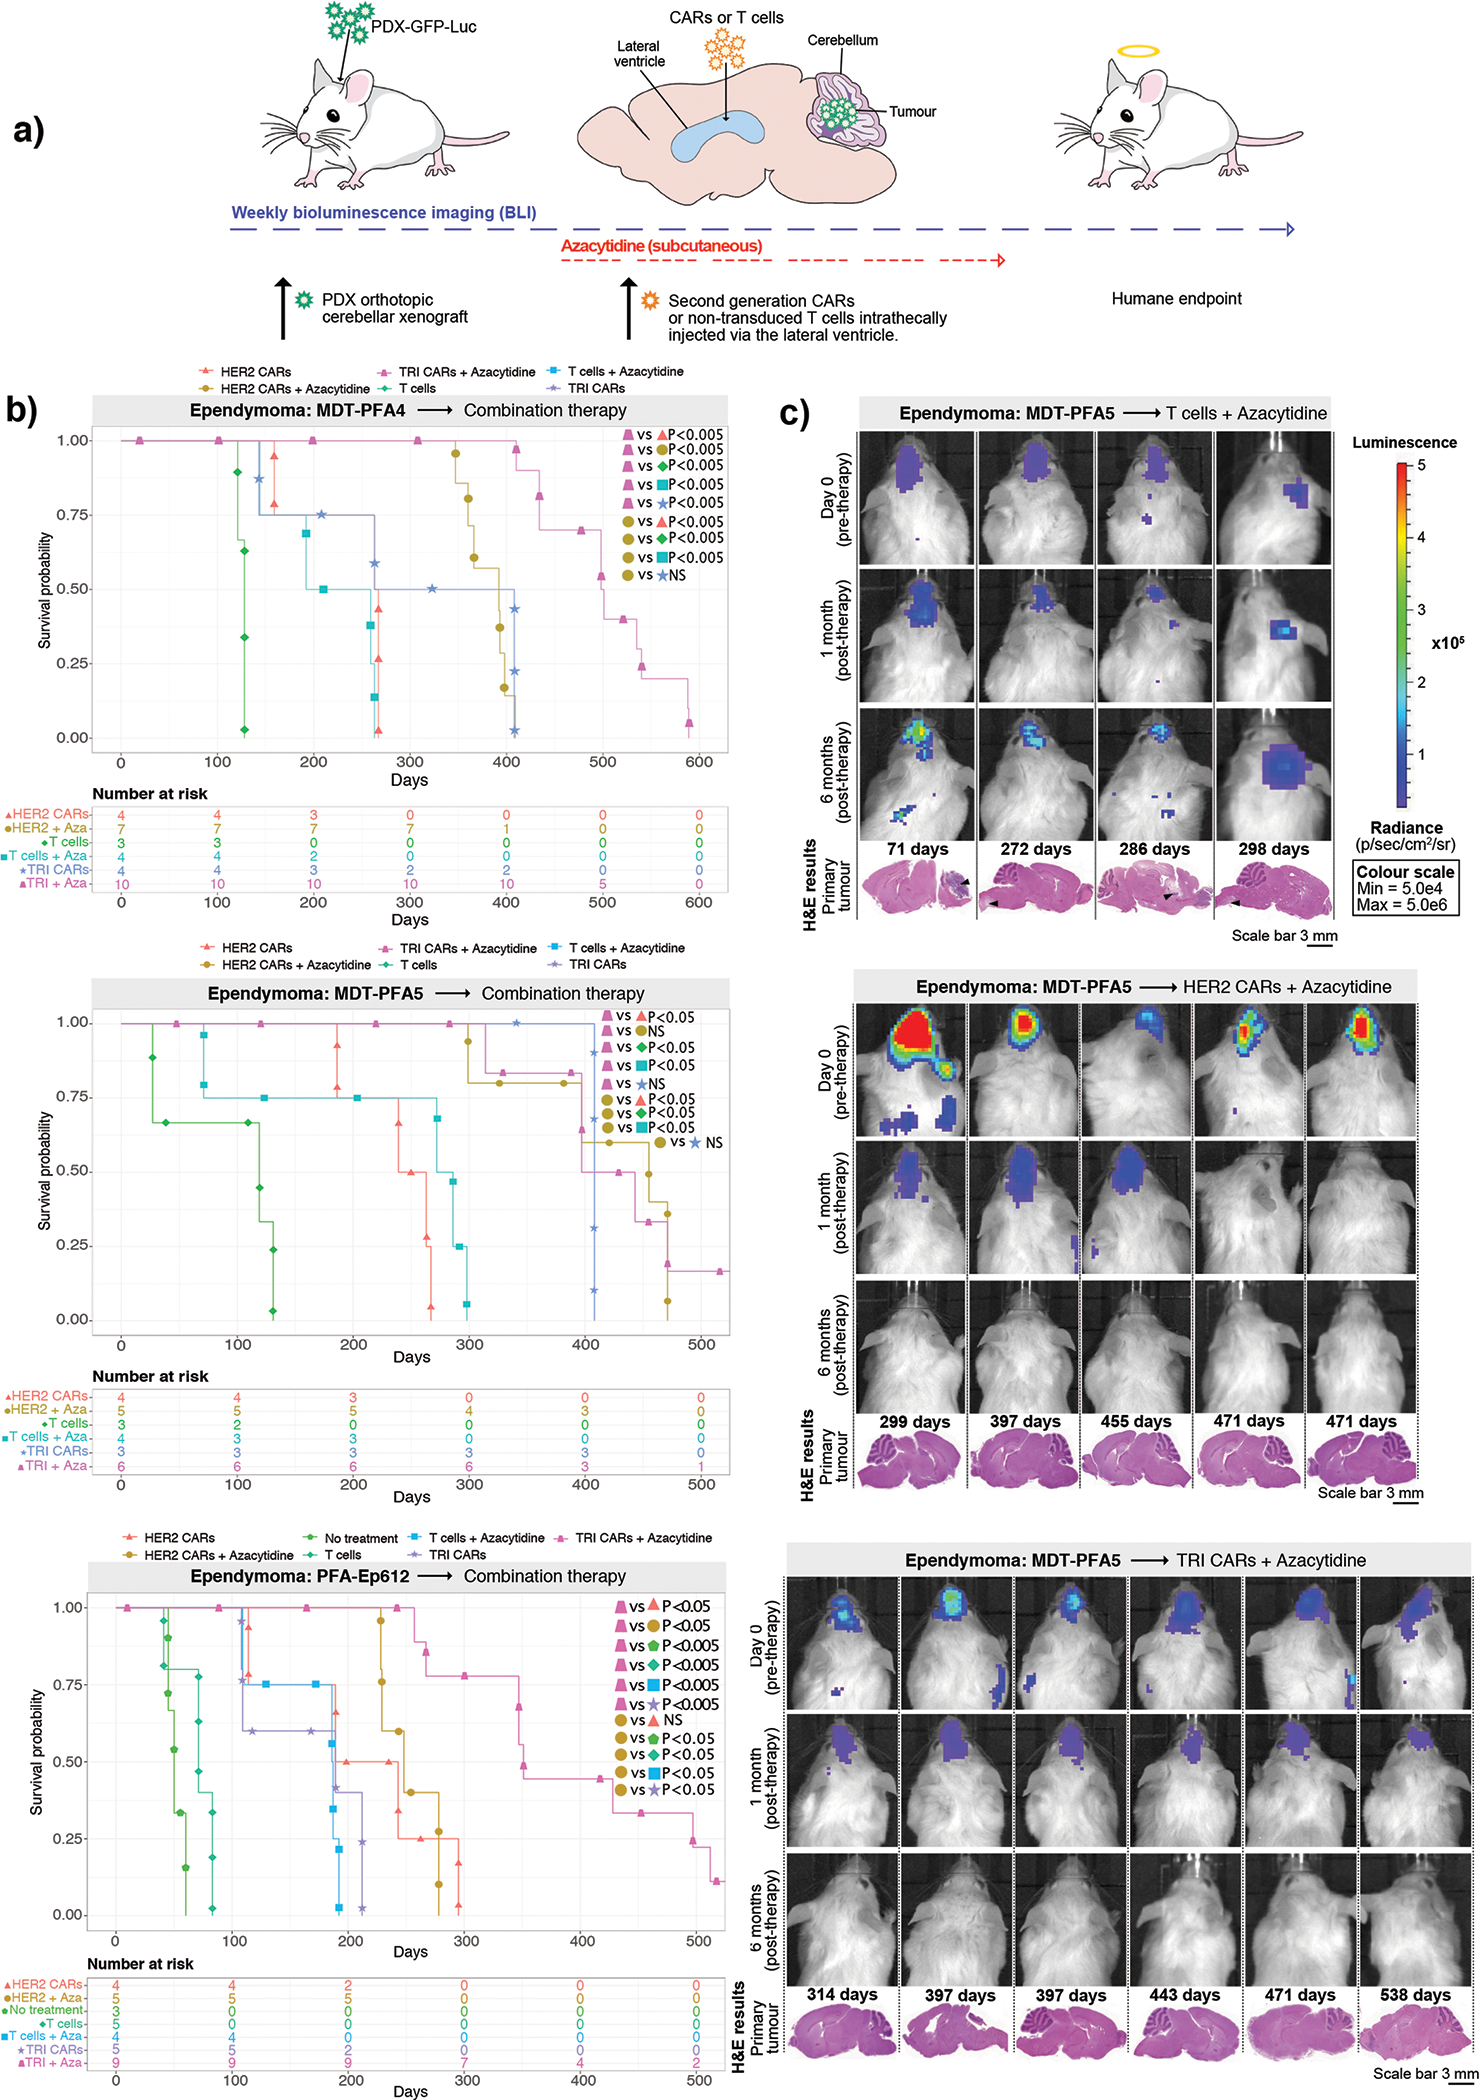
(a) Experimental scheme - PFA ependymoma cells expressing eGFP-firefly luciferase (PDX-GFP-Luc) were xenografted into NSG mice; 1-week post xenograft mice began subcutaneous treatment of azacytidine. Following BLI to determine engraftment, HER2 CAR-T-cells, TRI CAR-T-cells or non-transduced T-cells were intraventricularly administered by the lateral ventricle. Tumour burden was monitored weekly by BLI until endpoint. (b) Survival analysis of combined azacytidine and T-cell treated orthotopic xenografts of MDT-PFA4, MDT-PFA5 and Ep612. Two-sided log rank test (BH), n = 12 non-transduced T-cells plus azacytidine, 23 TRI CAR-T-cells + azacytidine, and 18 HER2 CAR-T-cells + azacytidine across 3 independent PDX models. MDT-PFA4: HER2-azacytidine vs HER2 P=0.0017, HER2-azacytidine vs T-cells P=0.00305, HER2-azacytidine vs T-cells-azacytidine P=0.00110, HER2-azacytidine vs TRI P=0.99, HER2-azacytidine vs TRI-azacytidine P=0.00011, TRI-azacytidine vs HER2 P=0.00029, TRI-azacytidine vs T-cells P=0.00061, TRI-azacytidine vs T-cells-azacytidine P=0.00025, TRI-azacytidine vs TRI P=0.00029. MDT-PFA5: HER2-azacytidine vs HER2 P=0.008, HER2-azacytidine vs T-cells P=0.011, HER2-azacytidine vs T-cells-azacytidine P=0.008, HER2-azacytidine vs TRI P=0.542, HER2-azacytidine vs TRI-azacytidine P=0.874, TRI-azacytidine vs HER2 P=0.008, TRI-azacytidine vs T-cells P=0.008, TRI-azacytidine vs T-cells-azacytidine P=0.008, TRI-azacytidine vs TRI P=0.737. Ep612: HER2-azacytidine vs HER2 P=0.84, HER2-azacytidine vs NT P=0.007, HER2-azacytidine vs T-cells P=0.00622, HER2-azacytidine vs T-cells-azacytidine P=0.00622, HER2-azacytidine vs TRI P=0.00622, HER2-azacytidine vs TRI-azacytidine P=0.00723, TRI-azacytidine vs HER2 P=0.00622, TRI-azacytidine vs NT P=0.0082, TRI-azacytidine vs T-cells P=0.00071, TRI-azacytidine vs T-cells-azacytidine P=0.00071, TRI-azacytidine vs TRI P=0.00071. (c) BLI and H&E staining analysis of NSG mice xenografted with Ep612, treated with azacytidine and intraventricularly infused with non-transduced T-cells, HER2 CAR-T-cells, or TRI CAR-T-cells (colour map indicates radiance), n = 5 HER2-azacytidine, 6 TRI-azacytidine, and 4 T-cells-azacytidine biologically independent PDX models. Each column represents one mouse, each row represents a time point, mouse endpoint (days post therapy) noted in ‘Days’.
Discussion
We found that a plurality of Group 3 medulloblastomas have elevated protein expression of EPHA2, IL13Rα2 and, to a lesser extent, HER2 suggesting that these proteins may serve as good targets for CAR-T-cell therapies. The limited positive expression of HER2 in the medulloblastoma PDX models used within our study, replicates the limited expression levels we observed within the TMAs and paired primary-metastases/recurrent tumour samples of Group 3 medulloblastoma. We have demonstrated the efficacy of locoregional CSF delivery of EPHA2 monovalent, HER2 monovalent, and trivalent (EPHA2 – HER2 – IL13Rα2) CAR-T-cell therapy in multiple patient derived xenograft models of medulloblastoma and ependymoma. Group 3 medulloblastoma primary and recurrent samples have an environment rich in EPHA2 receptors. Conversely, in ependymomas, the EPHA2, HER2 and IL13Rα2 receptors appear to have similar protein expression levels in the primary and recurrent tumour compartments, in this case, there is equal opportunity for the EPHA2, HER2 and IL13Rα2 CARs to bind. As the monovalent EPHA2 CAR-T-cell significantly outperforms the trivalent CAR-T-cell in an EPHA2 environment, the use of the EPHA2 monovalent CAR-T-cells would be deemed the most appropriate for use in future Group 3 medulloblastoma clinical trials. In comparison, we believe the use of trivalent CAR-T-cells would be deemed most appropriate for effective treatment of PFA ependymomas in future clinical trials.
Our data suggest that repeat administration of CAR-T-cells, perhaps through an Ommaya reservoir (an intraventricular catheter used for aspiration of CSF and for delivery of drugs into the CSF), could increase the efficacy of therapy as compared to either IV administration, or single dose intraventricular administration via the LV. Delivery of CAR-T-cell therapy directly into the CSF likely increases the exposure of the CAR-T-cells to cancer cells, and might decrease the systemic toxicity and attenuate on target, off-tumour effects. EPHA2, HER2 and IL13Rα2 display little to no protein expression in our normal developing brain samples, however the targets do show protein expression in our normal tissues samples, namely the spleen, thymus and pancreas. Although systemic toxicity was not assessed in our study (and is a line of future experimental inquiry), clinical and safety data for HER2 and IL13Rα2 CAR-T-cells already exists and no dose limiting toxicity has been observed17,20. Furthermore, EPHA2 CAR-T-cell analysis is an ongoing assessment50 in the locoregional delivery of CAR-T-cells for EPHA2-positive malignant gliomas. Locoregional delivery of CAR-T-cells directly into the CSF may reduce the risk of systemic toxicities associated with the CAR-T-cells, in comparison to the more commonly used intravenous delivery approach. In clinical trials of HER2- and EGFRvIII51,52 CAR-T-cells, intravenous infusion of CAR-T-cells increased the risk of pulmonary toxicities and in some cases were fatal51,52. Thus, locoregional delivery is anticipated to reduce systemic toxicities and be broadly relevant for treatment of CNS neoplaams53.
Our data from both the Group 3 medulloblastoma and PFA ependymoma models clearly show a synergy between intraventricular CSF CAR-T-cell therapy and the DNA demethylating agent azacytidine. It is unclear whether the effects of azacytidine are tumour cell autonomous and immunotherapy-independent, tumour cell autonomous and potentiating the immunotherapy (i.e., avoidance or reversal of tumour epitope silencing), and /or immune cell-related. Exploring the mechanism underpinning azacytidine efficacy will represent the focus of future experiments. Epigenetic priming with azacytidine may represent an effective neoadjuvant therapeutic approach when complemented with CAR-T-cell therapy.
The anatomic location of the vast majority of Group 3 medulloblastoma and PFA ependymoma recurrences, adjacent to and bathed by the CSF, and the almost complete lack of targeted agents currently being tested in clinical trials represent an opportunity for the effective, direct and full delivery of EPHA2 monovalent or trivalent CAR-T-cells in combination with azacytidine as effective therapeutic modalities for Group 3 medulloblastoma and PFA ependymoma primary and recurrences, respectively.
Online Materials and methods
Immunohistochemistry analysis and H-scores
i). IHC on human tissue microarrays.
Formalin-fixed, paraffin-embedded Tissue Microarray (TMA) sections were analyzed for IL13RA2, HER2/CB11 and EPHA2 protein expression. All immunohistochemistry (IHC) was performed using the Ventana Discovery platform. IHC was optimized and performed with IL13RA2 (Abcam GR270853), HER2/CB11 (BioGenex MU134C) and EPHA2 (Abnova MAB1769) with dilutions of 1:200, 1:400 and 1:500 respectively. In brief, tissue sections were incubated in Tris EDTA buffer (cell conditioning 1; CC1 standard) at 95°C for 1 hour to retrieve antigenicity, followed by incubation with the respective primary antibody for 1 hour. Bound primary antibodies were incubated with the respective secondary antibodies (Jackson Laboratories) 1:500 dilution, followed by Ultramap HRP and Chromomap DAB detection (Roche). For staining optimization and to control for staining specificity, normal organs were used as negative and positive controls (see Extended Figures 3J and 7). Intensity scoring was performed on a common four-point scale. Descriptively, 0 represents no staining, 1 represents low but detectable degree of staining, 2 represents clearly positive staining, and 3 represents strong expression. Expression was quantified as H-Score: the product of staining intensity multiplied by % of stained cells. Imaging analysis was performed using Aperio ImageScope software (Leica Biosystems).
ii). IHC on mouse tissue.
Mice showing late stage neurological brain tumour symptoms were sacrificed and central nervous system tissue harvested for histological examination. After 48–72 hours in 10% formalin, the brain was cut along the sagittal plane, the spinal cord was transversally cut into 4 – 6 pieces, and then embedded in paraffin and sectioned accordingly for histological evaluation. The location and extent of primary tumour and associated metastases (for medulloblastoma samples only) was analysed by standard haematoxylin and eosin (H&E) stain. For IHC on mouse tissue sections, the same protocol for TMA analysis was used, but the following primary antibodies and concentrations were utilized: IL13Ra2 (R&D Systems AF146, 1:400), HER2 (Sigma HPA001383, 1:500), EPHA2 (Abcam ab150304, 1:75ss), CD3 (Abcam ab16669, 1:100). Imaging analysis was performed using Aperio ImageScope software (Leica Biosystems).
Construction, delivery and expression of the CAR transgenes
i). CAR design, synthesis and cloning.
The HER2-specific scFv FRP5, EPHA2-specific scFv 4H5 and the IL13Rα2 binding IL-13 mutein used for the CAR transgenes were described previously1–6. The mono-specific CAR transgene design consisted of a target binding domain (FRP5 scFv or 4H5 scFv or IL13 mutein) connected to a CD28 transmembrane domain followed by the CD28 intracellular signaling domain and a ζ (zeta) signaling domain of the T-cell receptor. The trivalent transgene consisted of the three mono-specific CAR transgenes targeting IL13Rα2, HER2 and EPHA2 in tandem separated by 2A viral sequences with restriction enzyme sites at the ends for cloning. All designs were assembled on Clone Manager® (Sci-Ed Software, Cary, NC) and expression optimized vectors were synthesized by GeneArt® Gene Synthesis service (Thermo Fisher Scientific, Waltham, MA). The synthetic genes were cloned into the Gateway® entry vector pDONR™221, sequence-verified, sub-cloned in frame into an SFG retroviral vector and the construct confirmed using pyro-sequencing (SeqWright DNA-Technology, Houston, TX).
ii). Production of retroviral supernatant.
To produce retroviral supernatant, human embryonic kidney (HEK) 293T-cells were co-transfected with the CAR transgene-encoding retroviral transfer plasmid, Peg-Pam-e plasmid encoding MoMLV gag-pol, and plasmid containing the sequence for RD114 envelope, using GeneJuice (EMD Biosciences, San Diego, CA). The supernatants containing retroviral vector were collected 48 and 72 hours after transfection.
iii). CAR transgene transduction and T-cell expansion.
Transduction using retroviral supernatant was performed on Anti-CD3 (OKT3)/anti-CD28-activated T-cells for genetic modification with the CAR transgene. Briefly, donor PBMCs were isolated by Lymphoprep (Bio-One, Monroe, NC) and activated overnight with OKT3 (Thermo Fisher Scientific, Waltham, MA) and CD28 monoclonal antibodies (BD Biosciences, Palo Alto, CA) at a final concentration of 1 μg/mL. On day 2, recombinant human IL-7 and IL-15 (PeproTech, Rocky Hill, NJ) were added at a final concentration of 10 ng/mL and 5 ng/mL, respectively. On Day 3, cells were harvested for retroviral transduction over recombinant fibronectin fragment (Takara-Bio-USA, Madison, WI) pre-coated plates. Subsequently, 2.5 × 10⁵ T-cells per well were transduced with retrovirus and expanded after 48–72 hours in the presence of 10 ng/mL IL-7 and 5 ng/mL IL-15 for 10–15 days prior to use.
iv). CAR transgene expression on T-cells.
CAR transgene expression on T-cells was detected separately for each molecule using flow cytometry. Cell surface expression of FRP5 (HER2 CAR) and IL13 mutein were detected using conjugated Her2.Fc chimeric protein or IL13Rα2.Fc chimeric protein respectively (R&D Systems, Minneapolis, MN) followed by a PE-conjugated goat anti-human Fc (Thermo Fisher scientific, Waltham, MA). EPHA2 was detected using EPHA2 tagged with GST (Thermo Fisher Scientific, Waltham, MA) followed by anti-GST-PE (Abcam, Cambridge, MA). Additionally, FRP5 expression was also detected using AF647 anti-Mouse IgG, F(ab’)2 Fragment specific antibody (Jackson ImmunoResearch Laboratories, West Grove, PA) as required. Flow capture was performed on an Accuri C6 (Becton Dickinson, Franklin Lakes, NJ). FlowJo data analysis software (FLOWJO, LLC, Ashland, OR) was used for analyses.
Human specimen approval
All human tumour samples were used in accordance with the Research Ethics Board at the Hospital for Sick Children (Toronto, Canada), protocol REB1000024587.
The donor peripheral blood mononuclear cells (PBMCs) were derived using the Institutional Review Board approved protocol H-15280 at Baylor College of Medicine, Texas, United States.
Production of lentiviral Green Fluorescent Protein and Firefly-Luciferase supernatant
To produce lentiviral supernatant, human embryonic kidney (HEK) 293T-cells were co-transfected with the pBMN(CMV-copGFP-Luc2-Puro) plasmid, pMD2.G VSVG envelope expressing plasmid and psPAX2 second generation lentiviral packaging plasmid. The supernatants containing the lentiviral particles were collected at 72 hours after transfection, centrifuged, filtered, with Lenti-X concentrator added at 1:4 dilution (Clontech, 631231) and titrated for each PDX or cell line for a Multiplicity of Infection (MOI) at 0.3 (25%). The plasmid pBMN(CMV-copGFP-Luc2-Puro)7 was a gift from Magnus Essand (Addgene plasmid # 80389; http://n2t.net/addgene:80389; RRID:Addgene_80389); pMD2.G and psPAX2 were gifts from Didier Trono (Addgene plasmid #12259; http://n2t.net/addgene:12259; RRID:Addgene_12259; and Addgene plasmid #12260; http://n2t/addgene:12260; RRID:Addgene_12260.
Patient derived xenografts and cell lines
i). Medulloblastoma.
Med-114FH and Med-411FH were purchased from the Brain Tumour Resource Laboratory (Olson Lab, Fred Hutchinson Cancer Research Centre). Med-114FH derives from a 6-year-old female with an anaplastic large cell medulloblastoma; Med-411FH developed from a 3-year-old male with an anaplastic medulloblastoma; MDT-MMB descends from an autoptic specimen from a young male with a Group 3 high Myc medulloblastoma. Med-114FH, Med-411FH and MDT-MMB display immunohistochemical and genomic characteristics of Group 3 medulloblastoma.
ii). Ependymoma.
MDT-PFA4 derives from a 2-year-old female with a PF-A ependymoma; MDT-PFA5 was developed from a 1-year-old male presenting with a PF-A ependymoma; PFA-Ep612 ependymoma cell line8 (established from a 13-month-old female) was a gift from Professor Stephen Keir, Duke Cancer Institute, Durham, NC.
To generate stable fluorescent and luminescent lines, PDXs and cell lines were transduced with eGFP-firefly lentiviral particles at a multiplicity of infection (MOI) of 0.3 (25%). In brief, cells were kept in culture to infect them with protein coding lentiviruses (12 hours) in Neurocult NS-A Basal medium (Human) (STEMCELL Technologies, 05750), supplemented with 10 ng/ml EGF (Sigma-Aldrich, E9644), 10 ng/ml bFGF (STEMCELL Technologies, 02634), 1X B27 (ThermoFisher, 17504044), 1X N2 (A1370701), 75 μg/ml BSA (Gibco, 15260–037), 2 mM L-Glutamine (Multicell, 609–065-EL), and 2 μg/ml Heparin (Sigma-Aldrich, H3393). Cellular identities were intermittently confirmed by STR genotyping (Geneprint, Promega, B9510) to ensure it matched the identity of the original patient profile or deposited data.
Orthotopic injection of tumour cells and bioluminescent imaging
Medulloblastoma PDXs (50,000 cells) or ependymoma PDXs (250,000 cells) were stereotactically xenografted in 3 ul total volume, into the cerebellum of 6 – 8 week old NOD-scid gamma immunodeficient mice (NSG, Jackson Lab) using the following co-ordinates: 2 mm posterior from Lambda, 1 mm lateral, 3 mm deep and 1 mm retraction to inject at a depth of 2 mm. Xenografted mice were subjected to weekly bioluminescence imaging; mice were given intraperitoneal injections of 150 ng/g D-Luciferin (PerkinElmer, 122796) and anaesthetized with 2.5% Isoflurane in an induction chamber. Five minutes after injections, mice were imaged using a Xenogen Spectrum (IVIS-200) imaging system and analyzed using Living Image Software (PerkinElmer). Mice received either candidate CAR T-cells or non-transduced T-cell injection when a baseline bioluminescent tumour signal of 1 × 10⁴ photons/second was reached. Tumours were monitored for regression or progression with BLI imaging and left until neurological symptoms appeared or humane endpoint was reached. Clinical endpoints were assessed and determined by veterinary technicians blinded to experimental groups. Survival of mice was determined using Kaplan-Meyer curves and differences evaluated using a Log-rank test (Benjamini-Hochberg (BH)). Any mice without a brain tumour at endpoint were censored, represented with an ‘X’ on all associated Kaplan-Meyer survival curves, indicating a brain tumour was not the cause of death, correlating with BLI and final H&E analysis. All mouse studies were approved by The Centre for Phenogenomics (TCP) Animal Care Committee (ACC), AUP#21‐0100H; our study complies with all relevant ethical regulations.
Mice enrolled as part of the combined pre-clinical trial therapy began subcutaneous treatment of azacytidine (azacytidine, Celgene) (7 mg/m2, every 3 days × 5 doses, maximum of 6 cycles) 1 week after tumour cell engraftment, as described by Kimura et al., 20129 and as used in the ongoing clinical trial NCT0320602110.
Administering CAR T-cells
i). lateral ventricle.
Candidate CAR T-cells or non-transduced T-cells at 5 million cells in 5 ul total volume, were stereotactically injected into the lateral ventricle of mice, using the following co-ordinates: 0.5 mm posterior from Bregma, 1 mm lateral, 3 mm deep. For the second rounds of therapy, the same co-ordinates and original site of T-cell delivery was used.
ii). IV.
Mice were heated in their home cage with a heating pad until the dorsal tail vein dilated, to reduce stress a restraining device was used with the tail passed through and held firmly at the tail base, candidate CAR T-cells or non-transduced T-cells at 5 million cells in 50 ul total volume, were injected into the dorsal tail vein.
Flow cytometry and preparation
PDXs and cell lines were analyzed for EPHA2, HER2 and IL13Rα2 specific expression pre- and post-azacytidine treatment. azacytidine was administered at 12 μg/ml in supplemented Neurocult media. Cells were analyzed after receiving treatment for 5 days, with a media change every 2 days. Control cells received complete Neurocult media only. Samples were resuspended in PBS-1% BSA for flow cytometry stainings. The following antibodies were used for antigen analysis: antibodies IL13Rα2 (Abcam, ab55275, 1 μg/μl), Anti-HER-2/neu (Becton Dickinson, 340554), EPHA2 (R&D Systems, MAB3035, 0.25 μg/μl). Respective control cells were used to set voltages for FSC and SSC and fluorescence, dead cells were excluded using PI, Sytox Blue or Dapi. Flow cytometry data collection was performed using a BD Biosciences LSRII CFI VBYR, analysis was performed using FlowJo, Supplementary Figure 11.
Statistical analysis
All statistical parameters including the exact value of n, type of replicates, the statistical test and significance are reported in all associated Figure Legends. Data was considered statistically significant when p<0.01. A two-sided log-rank test Benjamini-Hochberg (BH) was used to calculate survival statistics in 3 independent PDX models (Figures 1b, 2b, 3b, 4b, and 6b) and 2 independent PDX models or replicates (Figure 5b, Supplementary Figure 13a), with all data represented as minimum of n=3 independent animal replicates (exact number defined in all associated figures and legends). A two-sided one-way ANOVA followed by Tukey post hoc test was used to calculate all total flux statistical analysis (Figure 5c, Extended Figures 3b, 3c, 8c, 9c, Supplementary Figures 8c, 9c, 10c, 11c). A two-sided Mann-Whitney U-test was used to perform statistical analysis of differentially expressed candidate gene expression across publicly available microarray datasets, and candidate target protein expression H-score analysis across tissue microarrays (Extended Figures 1a–l, 2a–c, 2g–I, 3a–c, 3h–j. A two-sided, unpaired t-test was used to calculate all flow cytometry statistics (Supplementary Figure 14).
Statistics and Reproducibility
Extended Figure 1A, B, C: n=144 Group 3 medulloblastomas, 9 fetal and 6 adult cerebellum independent biological samples. EPHA2: group 3 medulloblastoma vs adult normal cerebellum P=0.00018, group 3 medulloblastoma vs fetal normal cerebellum P=0.018; HER2: group 3 medulloblastoma vs adult normal cerebellum P=0.01, group 3 medulloblastoma vs fetal normal cerebellum P=0.01, IL13Rα2: group 3 medulloblastoma vs adult normal cerebellum P=0.7, group 3 medulloblastoma vs fetal normal cerebellum P=0.00001.
Extended Figure 1D, E, F: n=67 group 3α medulloblastomas, 37 group 3β medulloblastomas, 40 group 3γ medulloblastomas, 9 fetal and 6 adult cerebellum, independent biological samples. EPHA2: group 3α vs adult normal cerebellum P=0.0001, group 3α vs normal fetal cerebellum P=0.0001, group 3β vs adult normal cerebellum P=0.0003, group 3β vs normal fetal cerebellum P=0.0003, group 3γ vs adult normal cerebellum P=0.0003, group 3γ vs normal fetal cerebellum P=0.0003; HER2: group 3α vs adult normal cerebellum P=0.000042, group 3α vs normal fetal cerebellum P=0.06, group 3β vs adult normal cerebellum P=0.03, group 3β vs normal fetal cerebellum P=0.0001, group 3γ vs adult normal cerebellum P=0.007, group 3γ vs normal fetal cerebellum P=0.01; IL13Rα2: group 3α vs adult normal cerebellum P=0.096, group 3α vs normal fetal cerebellum P=0.0001, group 3β vs adult normal cerebellum P=0.21, group 3β vs normal fetal cerebellum P=0.17, group 3γ vs adult normal cerebellum P=0.134, group 3γ vs normal fetal cerebellum P=0.0001.
Extended Figure 1G, H, I: n=70 WNT medulloblastomas, 223 SHH medulloblastomas, 326 group 4 medulloblastomas, 9 normal fetal and 6 normal adult cerebellum, independent biological samples. EPHA2: WNT medulloblastoma vs adult normal cerebellum P=0.0001, WNT medulloblastoma vs fetal normal cerebellum P=0.0283, SHH medulloblastoma vs adult normal cerebellum P=0.0191, SHH medulloblastoma vs fetal normal cerebellum P=0.2; group 4 medulloblastoma vs adult normal cerebellum P=0.0191, group 4 medulloblastoma vs fetal normal cerebellum P=0.2; HER2: WNT medulloblastoma vs adult normal cerebellum P=0.0001, WNT medulloblastoma vs fetal normal cerebellum P=0.5, SHH medulloblastoma vs adult normal cerebellum P=0.5, SHH medulloblastoma vs fetal normal cerebellum P=0.0003; group 4 medulloblastoma vs adult normal cerebellum P=0.0001, group 4 medulloblastoma vs fetal normal cerebellum P=0.0063; IL13Rα2: WNT medulloblastoma vs adult normal cerebellum P=0.5, WNT medulloblastoma vs fetal normal cerebellum P=0.0001, SHH medulloblastoma vs adult normal cerebellum P=0.65, SHH medulloblastoma vs fetal normal cerebellum P=0.0001; group 4 medulloblastoma vs adult normal cerebellum P=0.06, group 4 medulloblastoma vs fetal normal cerebellum P=0.2.
Extended Figure 1J, K, L: n=11 EPHA2, 11 HER2, 12 1L13Rα2 group 3 biological samples, representing 1 technical replicate.
Supplementary Figure 5a: MDT-PFA4 with 2.5×10⁶ CARs or T-cells : 24 hour: TRI vs T-cells P=0.006, TRI vs HER2 P=0.007, T-cells vs HER2 P=0.9867; 48 hour: TRI vs T-cells P=0.0005, TRI vs HER2 P=0.0024, T-cells vs HER2 P=0.3302; 72 hour: TRI vs T-cells P=0.0011, TRI vs HER2 P=0.0121, T-cells vs HER2 P=0.0985; 96 hour: TRI vs T-cells P=0.0004, TRI vs HER2 P=0.0111, T-cells vs HER2 P=0.0301; 120 hour: TRI vs T-cells P=0.0027, TRI vs HER2 P=0.0771, T-cells vs HER2 P=0.0469. MDT-PFA4 with 5.0×10⁶ CARs or T-cells : 24 hour: TRI vs T-cells P=0.00001, TRI vs HER2 P=0.0006, T-cells vs HER2 P=0.0852; 48 hour: TRI vs T-cells P=0.00001, TRI vs HER2 P=0.0059, T-cells vs HER2 P=0.0069; 72 hour: TRI vs T-cells P=0.001, TRI vs HER2 P=0.1831, T-cells vs HER2 P=0.0071; 96 hour: TRI vs T-cells P=0.008, TRI vs HER2 P=0.553, T-cells vs HER2 P=0.0265; 120 hour: TRI vs T-cells P=0.0244, TRI vs HER2 P=0.7381, T-cells vs HER2 P=0.0612. MDT-PFA4 with 10×106 CARs or T-cells : 24 hour: TRI vs T-cells P=0.0007, TRI vs HER2 P=0.0009, T-cells vs HER2 P=0.9874; 48 hour: TRI vs T-cells P=0.00001, TRI vs HER2 P=0.0017, T-cells vs HER2 P=0.0262; 72 hour: TRI vs T-cells P=0.00001, TRI vs HER2 P=0.0012, T-cells vs HER2 P=0.0005; 96 hour: TRI vs T-cells P=0.00001, TRI vs HER2 P=0.0066, T-cells vs HER2 P=0.00001; 120 hour: TRI vs T-cells P=0.00001, TRI vs HER2 P=0.0266, T-cells vs HER2 P=0.0001. MDT-PFA5 with 2.5×10⁶ CARs or T-cells : 24 hour: T-cells vs HER2 P=0.05; 48 hour: TRI vs T-cells P=0.891, TRI vs HER2 P=0.1602, T-cells vs HER2 P=0.088; 72 hour: TRI vs T-cells P=0.1262, TRI vs HER2 P=0.0623, T-cells vs HER2 P=0.847; 96 hour: TRI vs T-cells P=0.0184, TRI vs HER2 P=0.0543, T-cells vs HER2 P=0.6507; 120 hour: TRI vs T-cells P=0.0083, TRI vs HER2 P=0.0332, T-cells vs HER2 P=0.4703. MDT-PFA5 with 5.0×10⁶ CARs or T-cells : 24 hour: TRI vs T-cells P=0.0267, TRI vs HER2 P=0.9923, T-cells vs HER2 P=0.0309; 48 hour: TRI vs T-cells P=0.0024, TRI vs HER2 P=0.9921, T-cells vs HER2 P=0.0027; 72 hour: TRI vs T-cells P=0.00001, TRI vs HER2 P=0.9932, T-cells vs HER2 P=0.00001; 96 hour: TRI vs T-cells P=0.00001, TRI vs HER2 P=0.9979, T-cells vs HER2 P=0.0001; 120 hour: TRI vs T-cells P=0.0001, TRI vs HER2 P=0.9134, T-cells vs HER2 P=0.0001. MDT-PFA5 with 10×106 CARs or T-cells : 24 hour: TRI vs T-cells P=0.2971, TRI vs HER2 P=0.2798, T-cells vs HER2 P=0.9987; 48 hour: TRI vs T-cells P=0.0383, TRI vs HER2 P=0.2741, T-cells vs HER2 P=0.3274; 72 hour: TRI vs T-cells P=0.029, TRI vs HER2 P=0.6489, T-cells vs HER2 P=0.0896; 96 hour: TRI vs T-cells P=0.0479, TRI vs HER2 P=0.9927, T-cells vs HER2 P=0.0557; 120 hour: TRI vs T-cells P=0.2777, TRI vs HER2 P=0.6098, T-cells vs HER2 P=0.0796.
Supplementary Figure 8c: Infusion of 2.5×10⁶ non-transduced T-cells: Day 0 IV vs LV P=0.115, Day 30 IV vs LV P=0.05; 5.0×10⁶ non-transduced T-cells: Day 0 IV vs LV P=0.814, Day 30 IV vs LV P=0.988; 10×106 non-transduced T-cells: Day 0 IV vs LV P=0.796, Day 30 IV vs LV P=0.114.
Supplementary Figure 9c: Infusion of 2.5×10⁶ non-transduced T-cells: Day 0 IV vs LV P=0.967, Day 30 IV vs LV P=0.006; 5.0×10⁶ non-transduced T-cells: Day 0 IV vs LV P=0.06, Day 30 IV vs LV P=0.05; 10×106 non-transduced T-cells: Day 0 IV vs LV P=0.67, Day 30 IV vs LV P=0.0387.
Supplementary Figure 10c: Infusion of 2.5×10⁶ TRI CAR-T-cells: Day 0 IV vs LV P=0.341, Day 30 IV vs LV P=0.0539; 5.0×10⁶ TRI CAR-T-cells: Day 0 IV vs LV P=0.324, Day 30 IV vs LV P=0.894; 10×106 TRI CAR-T-cells: Day 0 IV vs LV P=0.52, Day 30 IV vs LV P=0.934.
Supplementary Figure 11c: Infusion of 2.5×10⁶ TRI CAR-T-cells: Day 0 IV vs LV P=0.357, Day 30 IV vs LV P=0.153; 5.0×10⁶ TRI CAR-T-cells: Day 0 IV vs LV P=0.515, Day 30 IV vs LV P=0.177; 10×106 TRI CAR-T-cells: Day 0 IV vs LV P=0.94.
Micro-array data, analysis and availability
Differential gene expression analysis between the primary and metastatic medulloblastoma samples was performed on a cohort of 12 paired primary-metastatic tumours collected in the MAGIC consortium and profiled using DNA methylation analysis as previously described11. In brief, DNA methylation was generated using the Illumina Infinium HumanMethylation450 BeadChip array (450k array). Samples were normalized using the SWAN as part of the R/Bioconductor minfi package (v1.12.0). The accession number for the medulloblastoma primary-metastatic paired Affymetrix Array Data used in this paper, generated by Wang et al., 201511 is GEO: GSE63670.
Differential gene expression analysis of primary medulloblastoma samples as subgroups and associated subtypes was performed on a cohort of 763 primary medulloblastoma samples, compiled by the MAGIC consortium, and analyzed using genome-wide methylation and expression profiles, as previously described12. In brief, to generate gene expression profiling the Affymetrix Gene 1.1 ST array was used; all samples were analyzed on the Illumina Infinium HumanMethylation450 BeadChip. The accession number for the primary medulloblastoma methylation data used in this paper, generated by Cavalli et al., 201712 is GEO: GSE85218.
Differential gene expression analysis of primary ependymoma samples was performed using gene expression profiles from a cohort of 100 ependymomas generated using the Affymetrix Exon 1.0 ST Gene Chip array, as previously described13. In brief, arrays were quantile normalized (sketch) and summarized using PLIER and PM-GCBG background correction. Probe sets were annotated according to the human genome build HG19 (GRCh37). Gene expression and aCGH data for this dataset can be found at GEO: GSE27279.
Cell culture assays
For in vitro co-culture, dose response assays, ependymomas MDT-PFA4 and MDT-PFA5 were used at plate density of 1×10⁴ cells/well of a pre-coated Laminin and Poly-L-Lysine 96 well plate in a media mixture (1:1) of complete Neurocult media to Dulbecco’s Modified Eagle Media and Clicks media (1:1) plus 10% fetal calf serum. Triplicate wells were plated for each condition. 24 hours later, the appropriate controls or CAR T-cells were added in a ratio of 1:10, 1:20 or 1:40 T-cells to tumour cells. Phase confluency analysis was conducted using an Incucyte Zoom™ over a 120-hour time course. Analysis was performed following confluency normalization to hour = 0 for all replicates and conditions.
For cytokine production analysis, 3×10⁵ tumour cells were co-cultured for 24 hours at a 1:20 ratio with non-transduced T-cells or CAR T-cells. Duplicate wells were plated for each condition. Culture supernatants were collected and analyzed for IFNγ and IL2 by ELISA (R&D Systems).
Extended Data
Extended Figure 1. EPHA2, HER2 and IL13Rα2 are immunotherapy targets in Group 3 medulloblastoma.
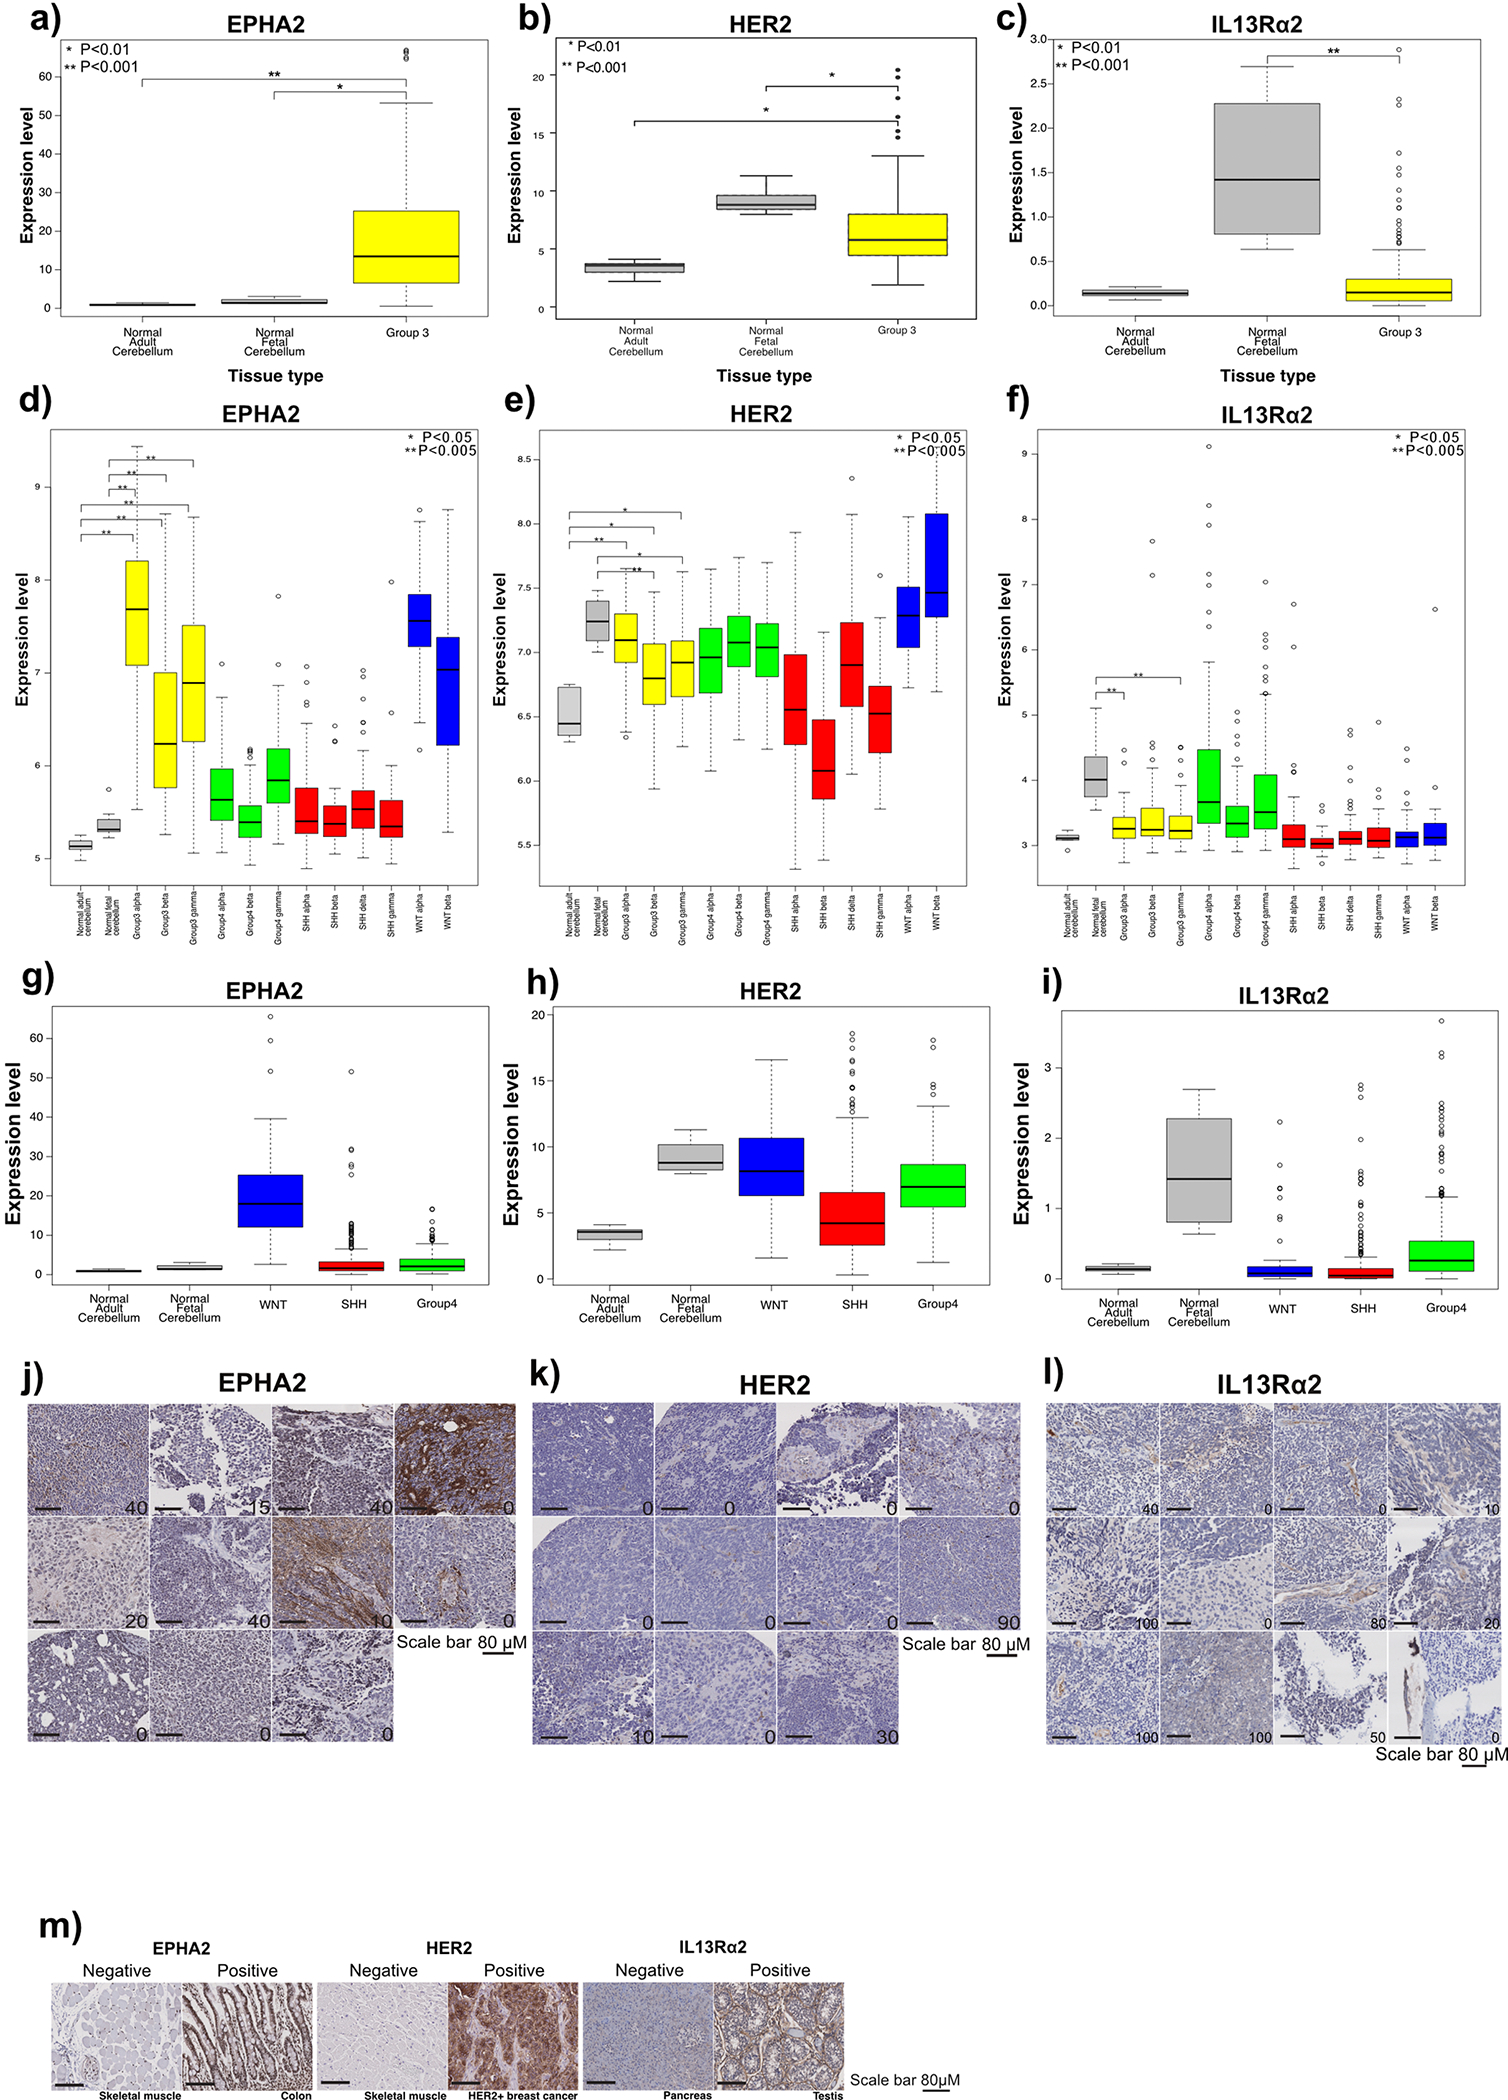
(a) EPHA2 mRNA expression in human Group 3 medulloblastoma versus normal human adult and fetal cerebellum; (b) HER2 expression in human Group 3 medulloblastoma versus normal human adult and fetal cerebellum; and (c) IL13Rα2 expression in human Group 3 medulloblastoma versus normal human fetal and adult cerebellum, by expression microarray, two-sided Mann-Whitney U test. mRNA differential expression across human medulloblastoma subtypes versus normal adult and fetal cerebellum control for (d) EPHA2; (e) HER2; and (f) IL13Rα2; as compared by expression microarray, * P<0.05; **P<0.005, two-sided Mann-Whitney U-test. (g) EPHA2 mRNA expression in human WNT, SHH and Group 4 medulloblastoma subgroups versus normal human adult and fetal cerebellum (h) HER2 mRNA expression in human WNT, SHH and Group 4 medulloblastoma subgroups versus normal human adult and fetal cerebellum; and (i) IL13Rα2 mRNA expression in human WNT, SHH and Group 4 medulloblastoma subgroups versus normal human adult and fetal cerebellum as compared by expression microarray, two-sided one-way ANOVA with post-hoc Tukey HSD. All boxplot centre lines show data median; box limits indicate the 25th and 75th percentiles; lower and upper whiskers extend 1.5 times the interquartile range (IQR) from the 25th and 75th percentiles, respectively. Outliers are represented by individual points. Error bars ± SEM (j) H score of EPHA2 IHC (P=0.6); (k) H score of HER2 IHC (P=0.6); (l) H score of IL13Rα2 IHC (P=0.9 two-sided Mann-Whitney U test) in human paediatric primary and metastases or recurrence for Group 3 medulloblastoma. (m) Normal skeletal muscle used for EPHA2 and HER2-negative controls; normal colon used for EPHA2-positive controls; HER2-positive breast cancer used as HER2-positive controls; normal pancreas and testis used for IL13Rα2-negative and positive controls, respectively. Scale bar represents 100 mM, data represents 3 Biological replicates.
Extended Figure 2. Defining EPHA2, HER2 and IL13Rα2 as immunotherapy targets in Group 3 primary and matched metastases or recurrence.
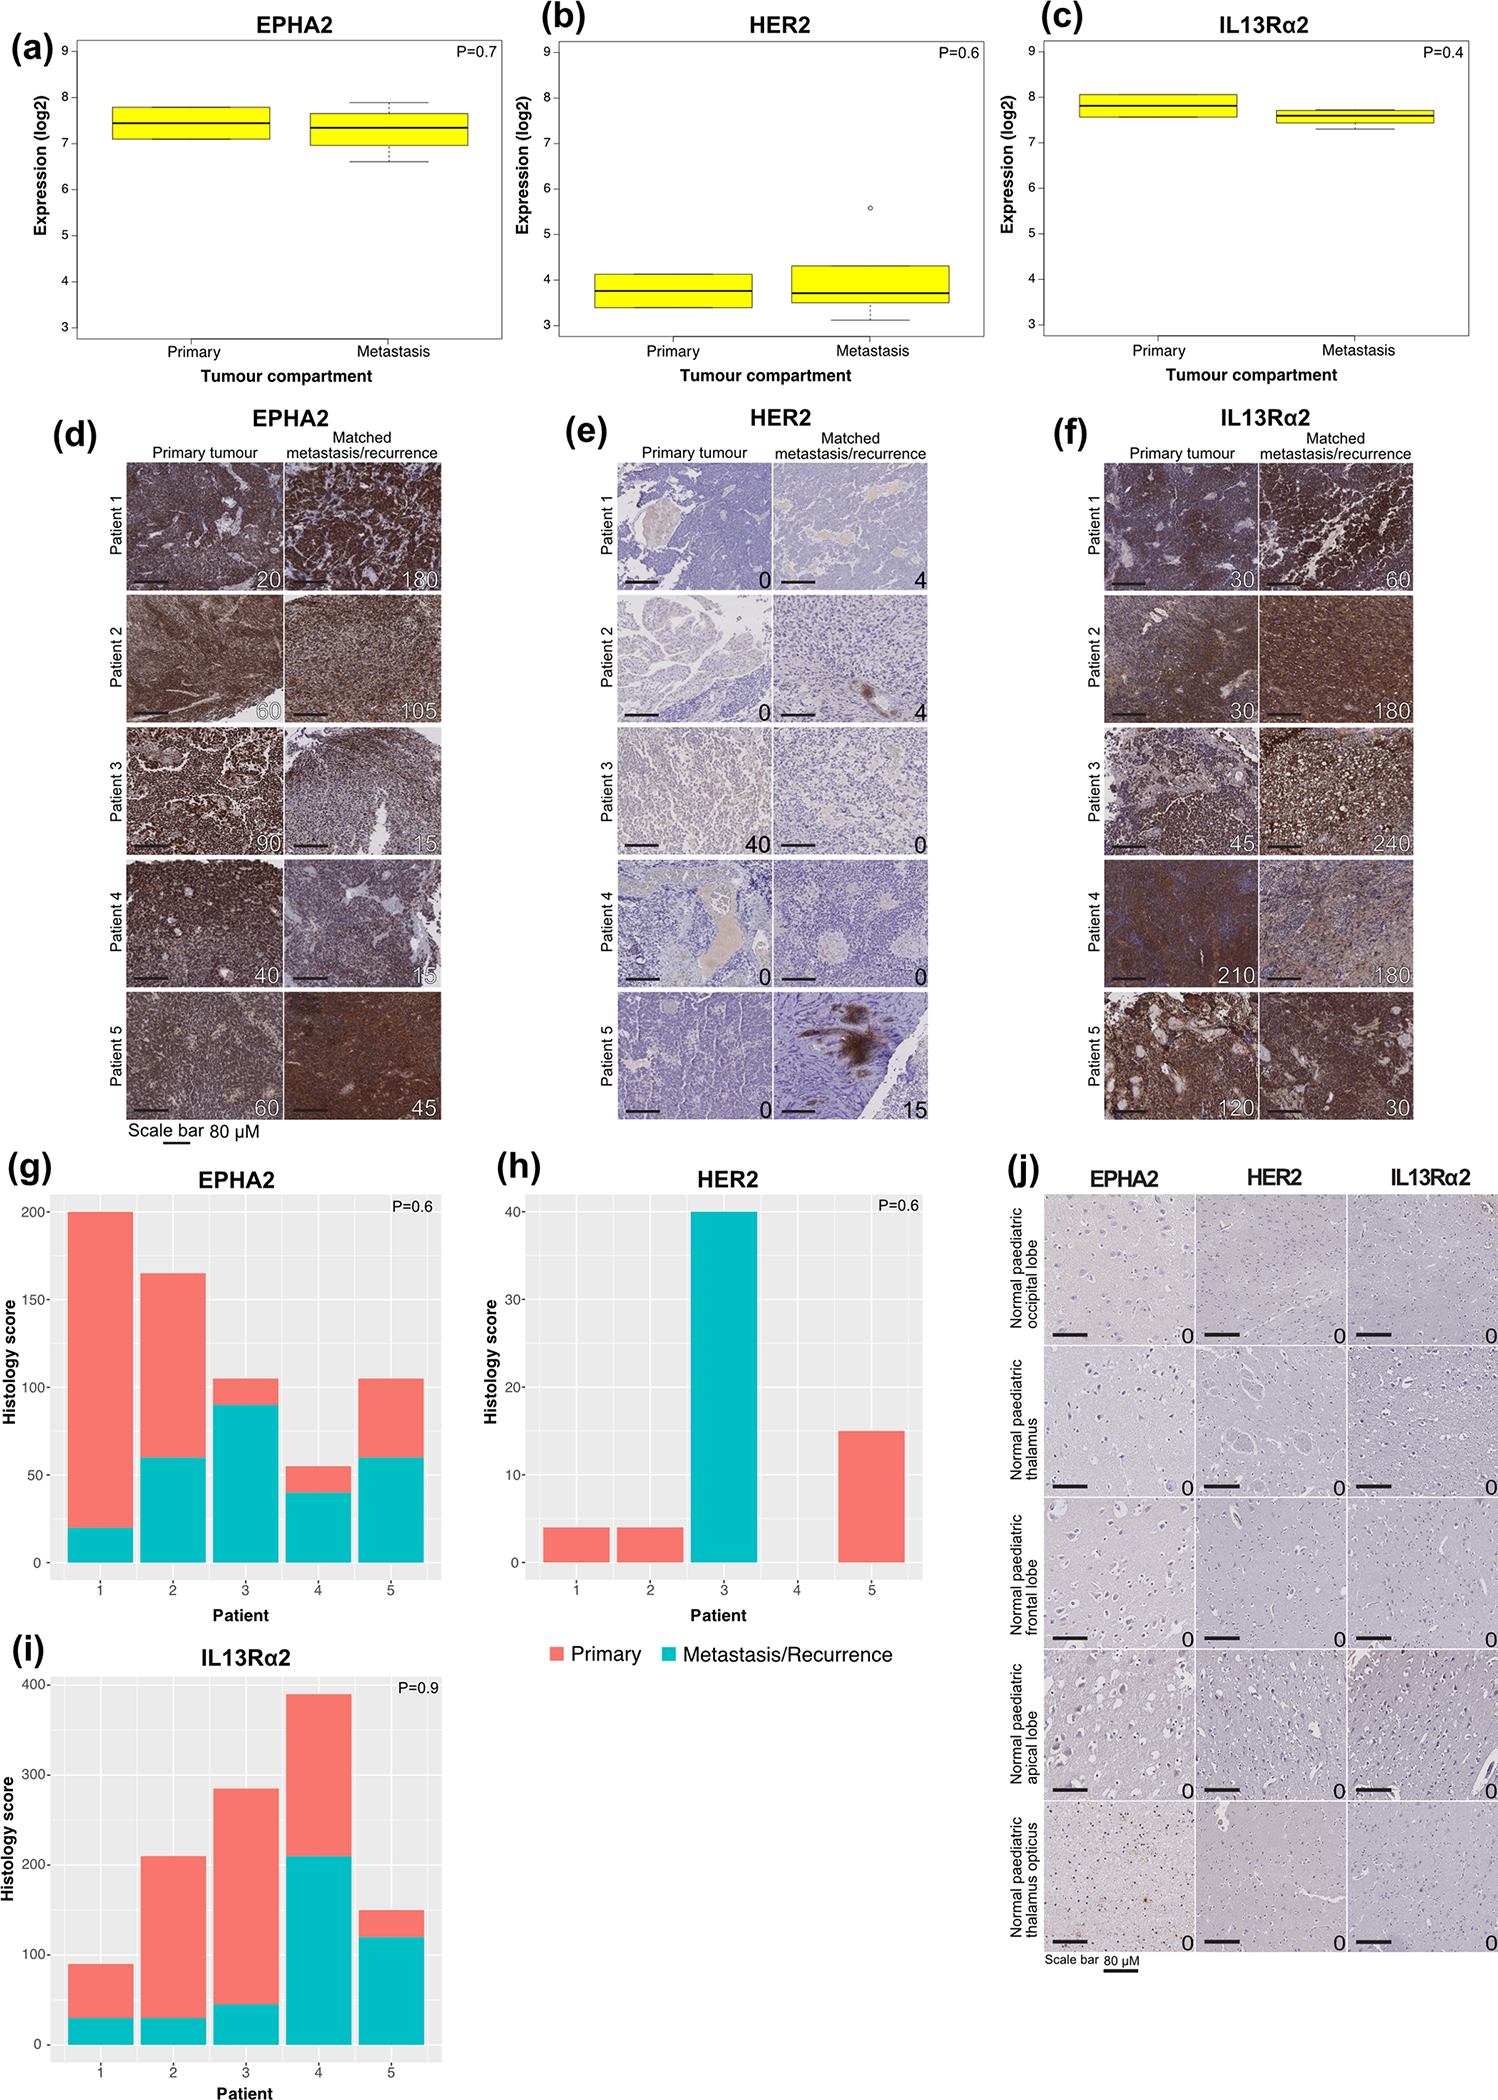
(a) EPHA2 expression in human primary and metastatic Group 3 medulloblastomas; (b) HER2 expression in human primary and metastatic Group 3 medulloblastoma; and (c) IL13Rα2 is expressed in both human primary and metastatic compartments of Group 3 medulloblastoma, by expression microarray, n=2 primary and 6 metastatic or recurrence group 3 medulloblastomas. All boxplot centre lines show data median; box limits indicate the 25th and 75th percentiles; lower and upper whiskers extend 1.5 times the interquartile range (IQR) from the 25th and 75th percentiles, respectively. Outliers are represented by individual points. (d) EPHA2 immunohistochemistry (IHC); (e) HER2 IHC; and (f) IL13Rα2 IHC staining analysis of paired human paediatric primary and metastases or recurrence in Group 3 medulloblastoma, representative membrane-staining H-scores displayed in lower corner. Scale bars represent 80 μM, data represents 3 biological replicates. (g) H score of EPHA2 IHC (P=0.6 two-sided Mann-Whitney U test); (h) H score of HER2 IHC (P=0.6 two-sided Mann-Whitney U test); (i) H score of IL13Rα2 IHC (P=0.9 two-sided Mann-Whitney U test) in n=6 independent human paediatric primary and metastases or recurrence for Group 3 medulloblastoma samples; (j) EPHA2, HER2 and IL13Rα2 protein expression in normal paediatric brain compartments. Scale bar represents 80 μM, numbers represent H-scores data represents 6 biological replicates.
Extended Figure 3. Two doses of EPHA2-CAR T-cells improves antitumour response in Group 3 medulloblastoma orthotopic xenograft models.
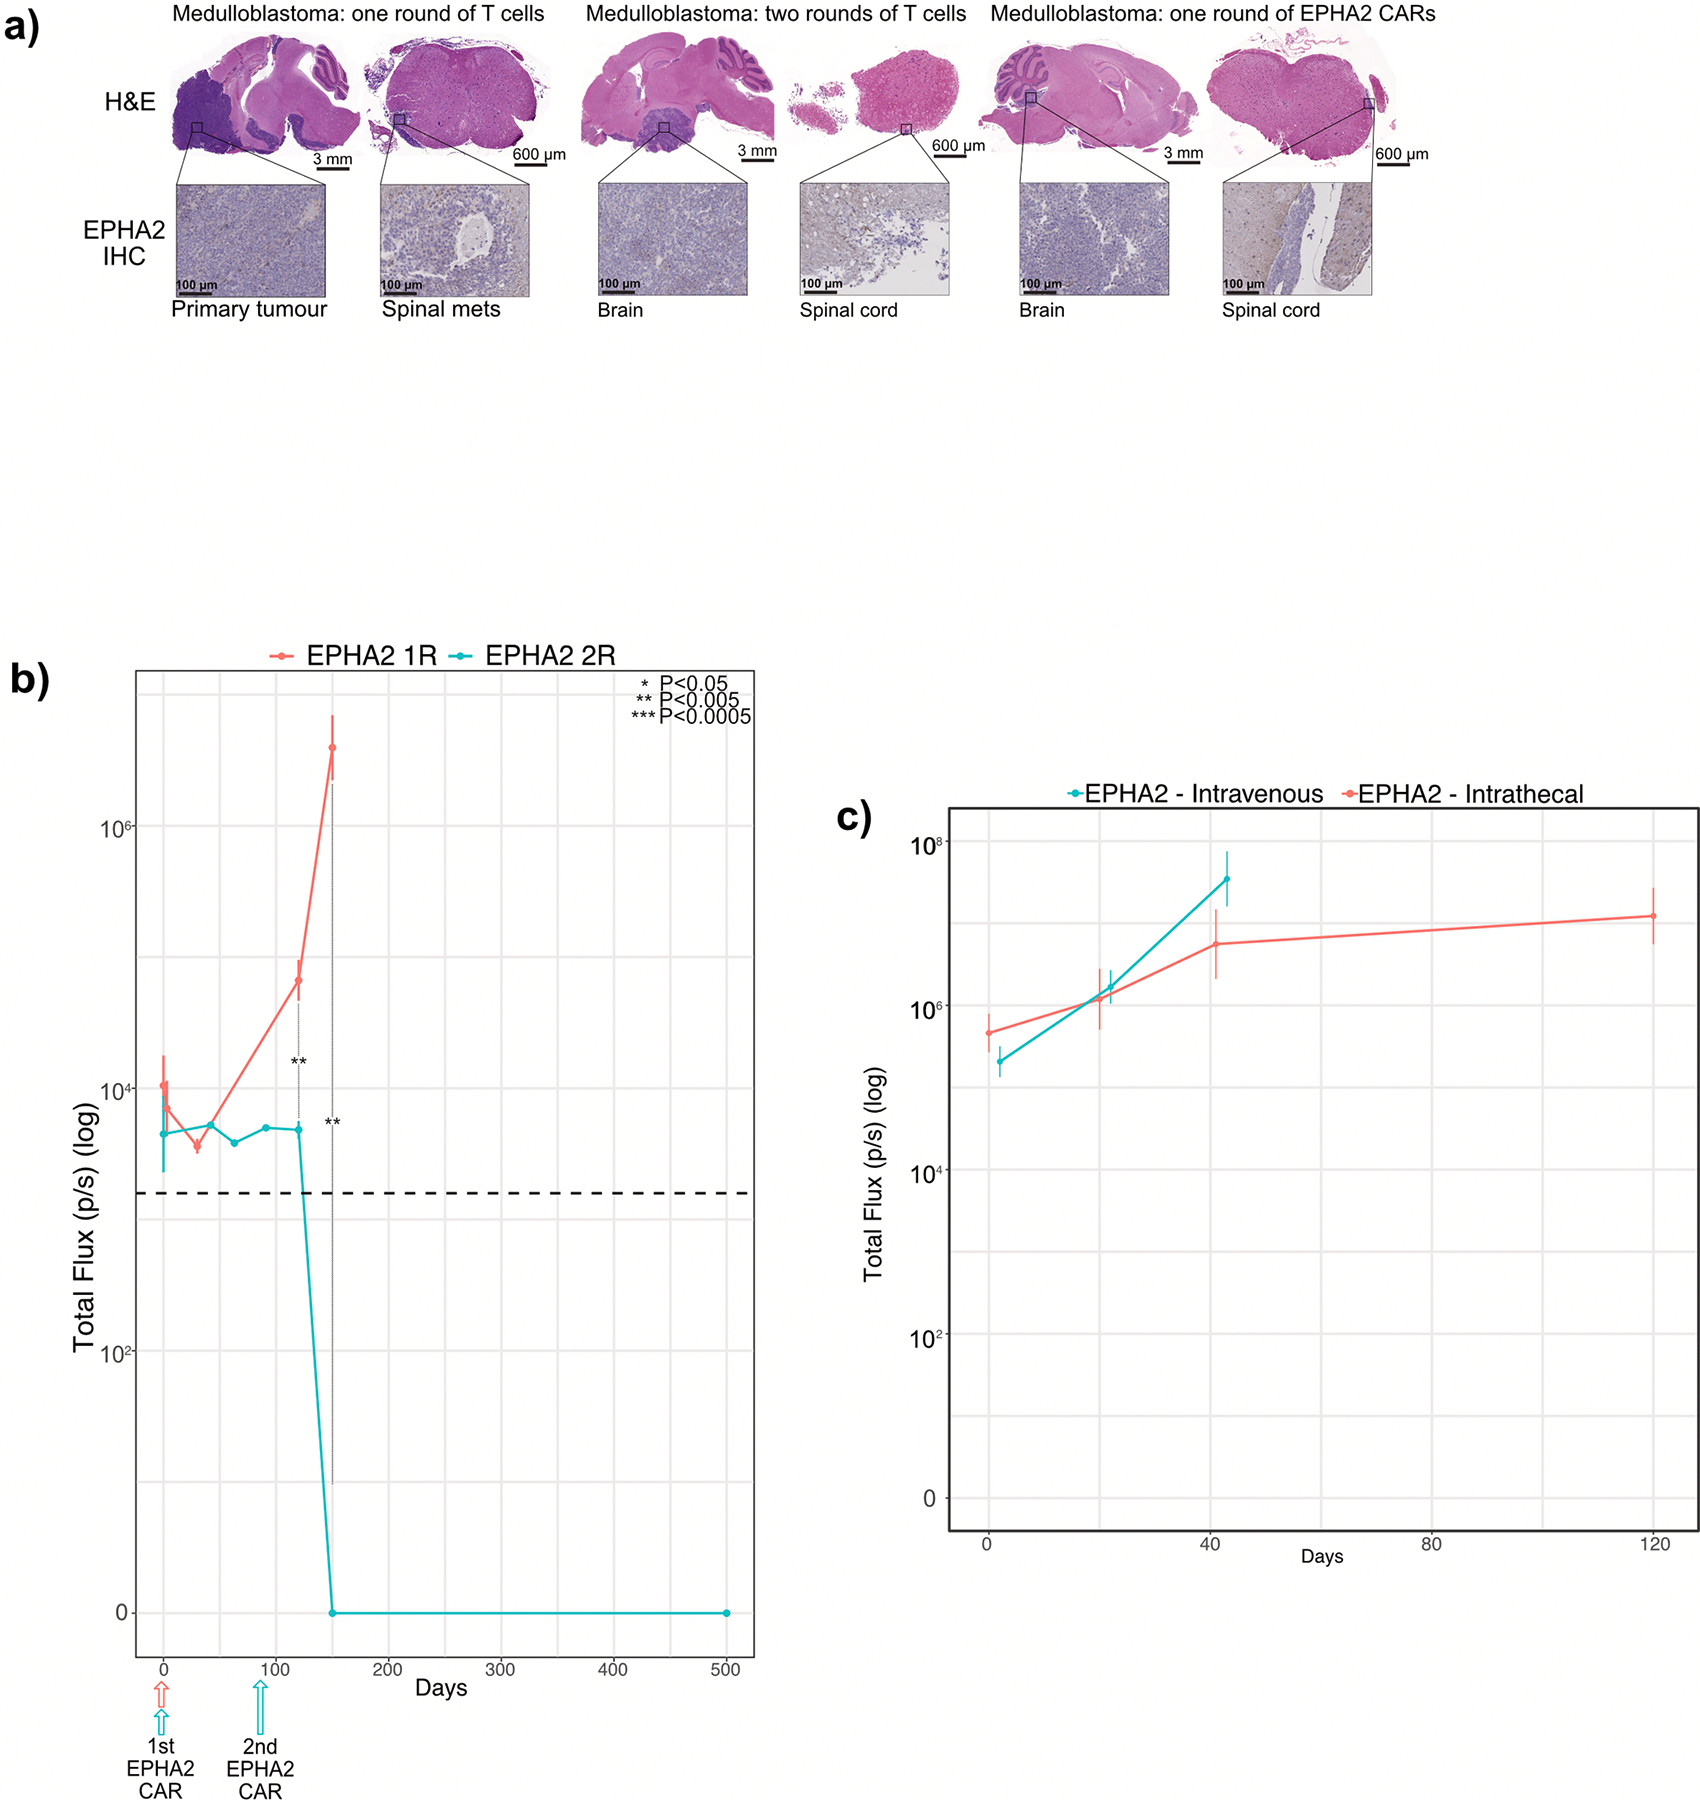
(a) Hematoxylin-eosin (H&E) staining analysis of NSG mice xenografted with luciferase-expressing MDT-MMB, following one round of EPHA2 CAR T-cells and one versus two rounds of non-transduced T-cells, with associated IHC analysis for EPHA2 protein expression for the cerebellar tumour and matched spinal metastases, data represents 3 independent replicates. (b) Measurement log Total Flux (photon/second) following one versus two rounds of intraventricular EPHA2 CAR T-cell therapy. ***P<0.0005, **P<0.005, *P<0.05 by two-sided ANOVA followed by Tukey post hoc test, n = 5 MDT-MMB treated with EPHA2 CAR T-cells 1 round of therapy, n = 3 MDT-MMB treated with EPHA2 CAR T-cells 2 rounds of therapy, error bars represent SEM, centre line represents the mean. EPHA2 one round versus EPHA2 two rounds: Day 1: P=0.3796; Day 120: P=0.0009112; Day 150 P=0.00141. (c) Measurement of log Total Flux (photon/second) following one round of intraventricular versus IV EPHA2 CAR T-cell therapy. ***P<0.0005, **P<0.005, *P<0.05, by two-sided ANOVA followed by Tukey post hoc test, n = 19 EPHA2 CAR T-cells delivered intraventricularly, n = 15 EPHA2 CAR T-cells delivered IV, error bars represent SEM, centre line represents mean. EPHA2 IV versus EPHA2 intraventricular: Day 1: P=0.2038; Day 21: P=0.2321; Day 42 P=0.2731.
Extended Figure 4. EPHA2, HER2 and IL13Rα2 are immunotherapy targets in PFA ependymoma.
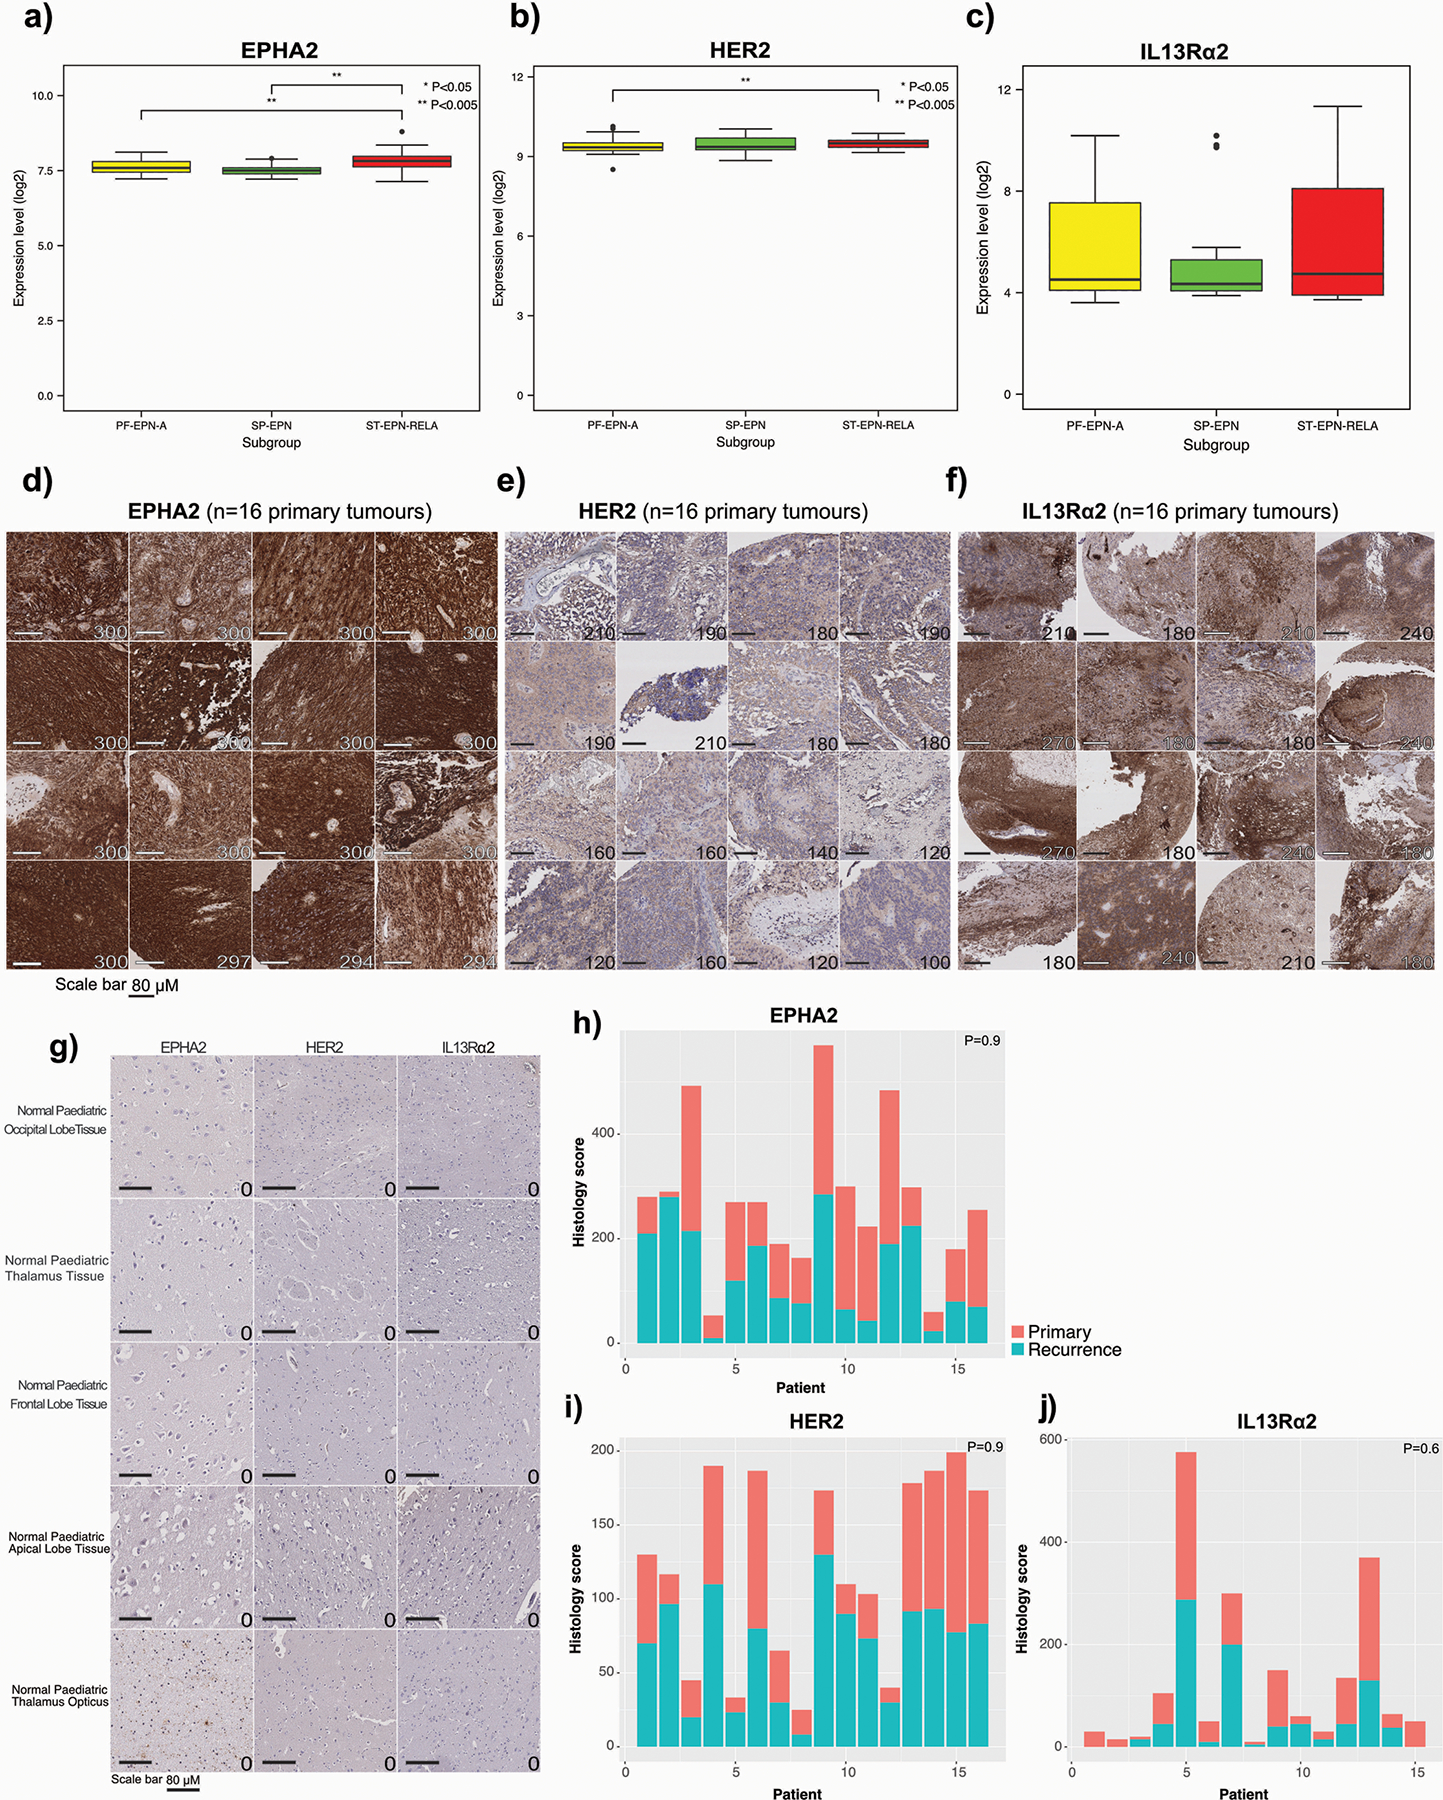
(a) EPHA2 differential expression across ependymoma subgroups (PF-EPN-A vs ST-EPN-RELA P=0.05; PF-EPN-A vs SP-EPN P=0.5207, two-sided Mann Whitney U test); (b) HER2 differential expression across ependymoma subgroups (PF-EPN-A vs ST-EPN-RELA P=0.0026; PF-EPN-A vs SP-EPN P=0.146; SP-EPN vs ST-EPN-RELA P=0.0027, two-sided Mann Whitney U test); and (c) IL13Rα2 differential expression across ependymoma subgroups (PF-EPN-A vs ST-EPN-RELA P=0.99; PF-EPN-A vs SP-EPN P=0.7024, two-sided Mann Whitney U test), as compared by expression microarray, n=54 PF-EPN-A, 15 SP-EPN, 31 ST-EPN-RELA. All boxplot centre lines show data median; box limits indicate the 25th and 75th percentiles; lower and upper whiskers extend 1.5 times the interquartile range (IQR) from the 25th and 75th percentiles, respectively. Outliers are represented by individual points. (d) IHC membrane staining of EPHA2 in ependymoma primary tumour TMAs; (e) IHC membrane staining of HER2 in ependymoma primary tumour TMAs; and (f) IHC membrane staining of IL13Rα2 in ependymoma primary tumour TMAs, representative membrane-staining H-scores displayed in lower corner. Scale bars represent 80 μM. (g) EPHA2, HER2 and IL13Rα2 protein expression in normal paediatric brain compartments, as comparative protein staining analysis in the normal brain. Scale bar represents 80 μM, numbers represent H-scores, data representative of 2 independent replicates. (h) Summary of membrane-staining H score of EPHA2 IHC of human paediatric paired primary and recurrence for PFA ependymoma (P=0.9 two-sided Mann-Whitney U test) (i) Summary of membrane-staining H score of HER2 IHC of human paediatric paired primary and recurrence for PFA ependymoma (P=0.9 two-sided Mann-Whitney U test) (j) Summary of membrane-staining H score of IL13Rα2 IHC of human paediatric paired primary and recurrence for PFA ependymoma (P=0.6 two-sided Mann-Whitney U test), n=16 primary and 16 matched recurrences of biologically independent paired samples.
Extended Figure 5. EPHA2 protein expression in primary paediatric ependymoma.
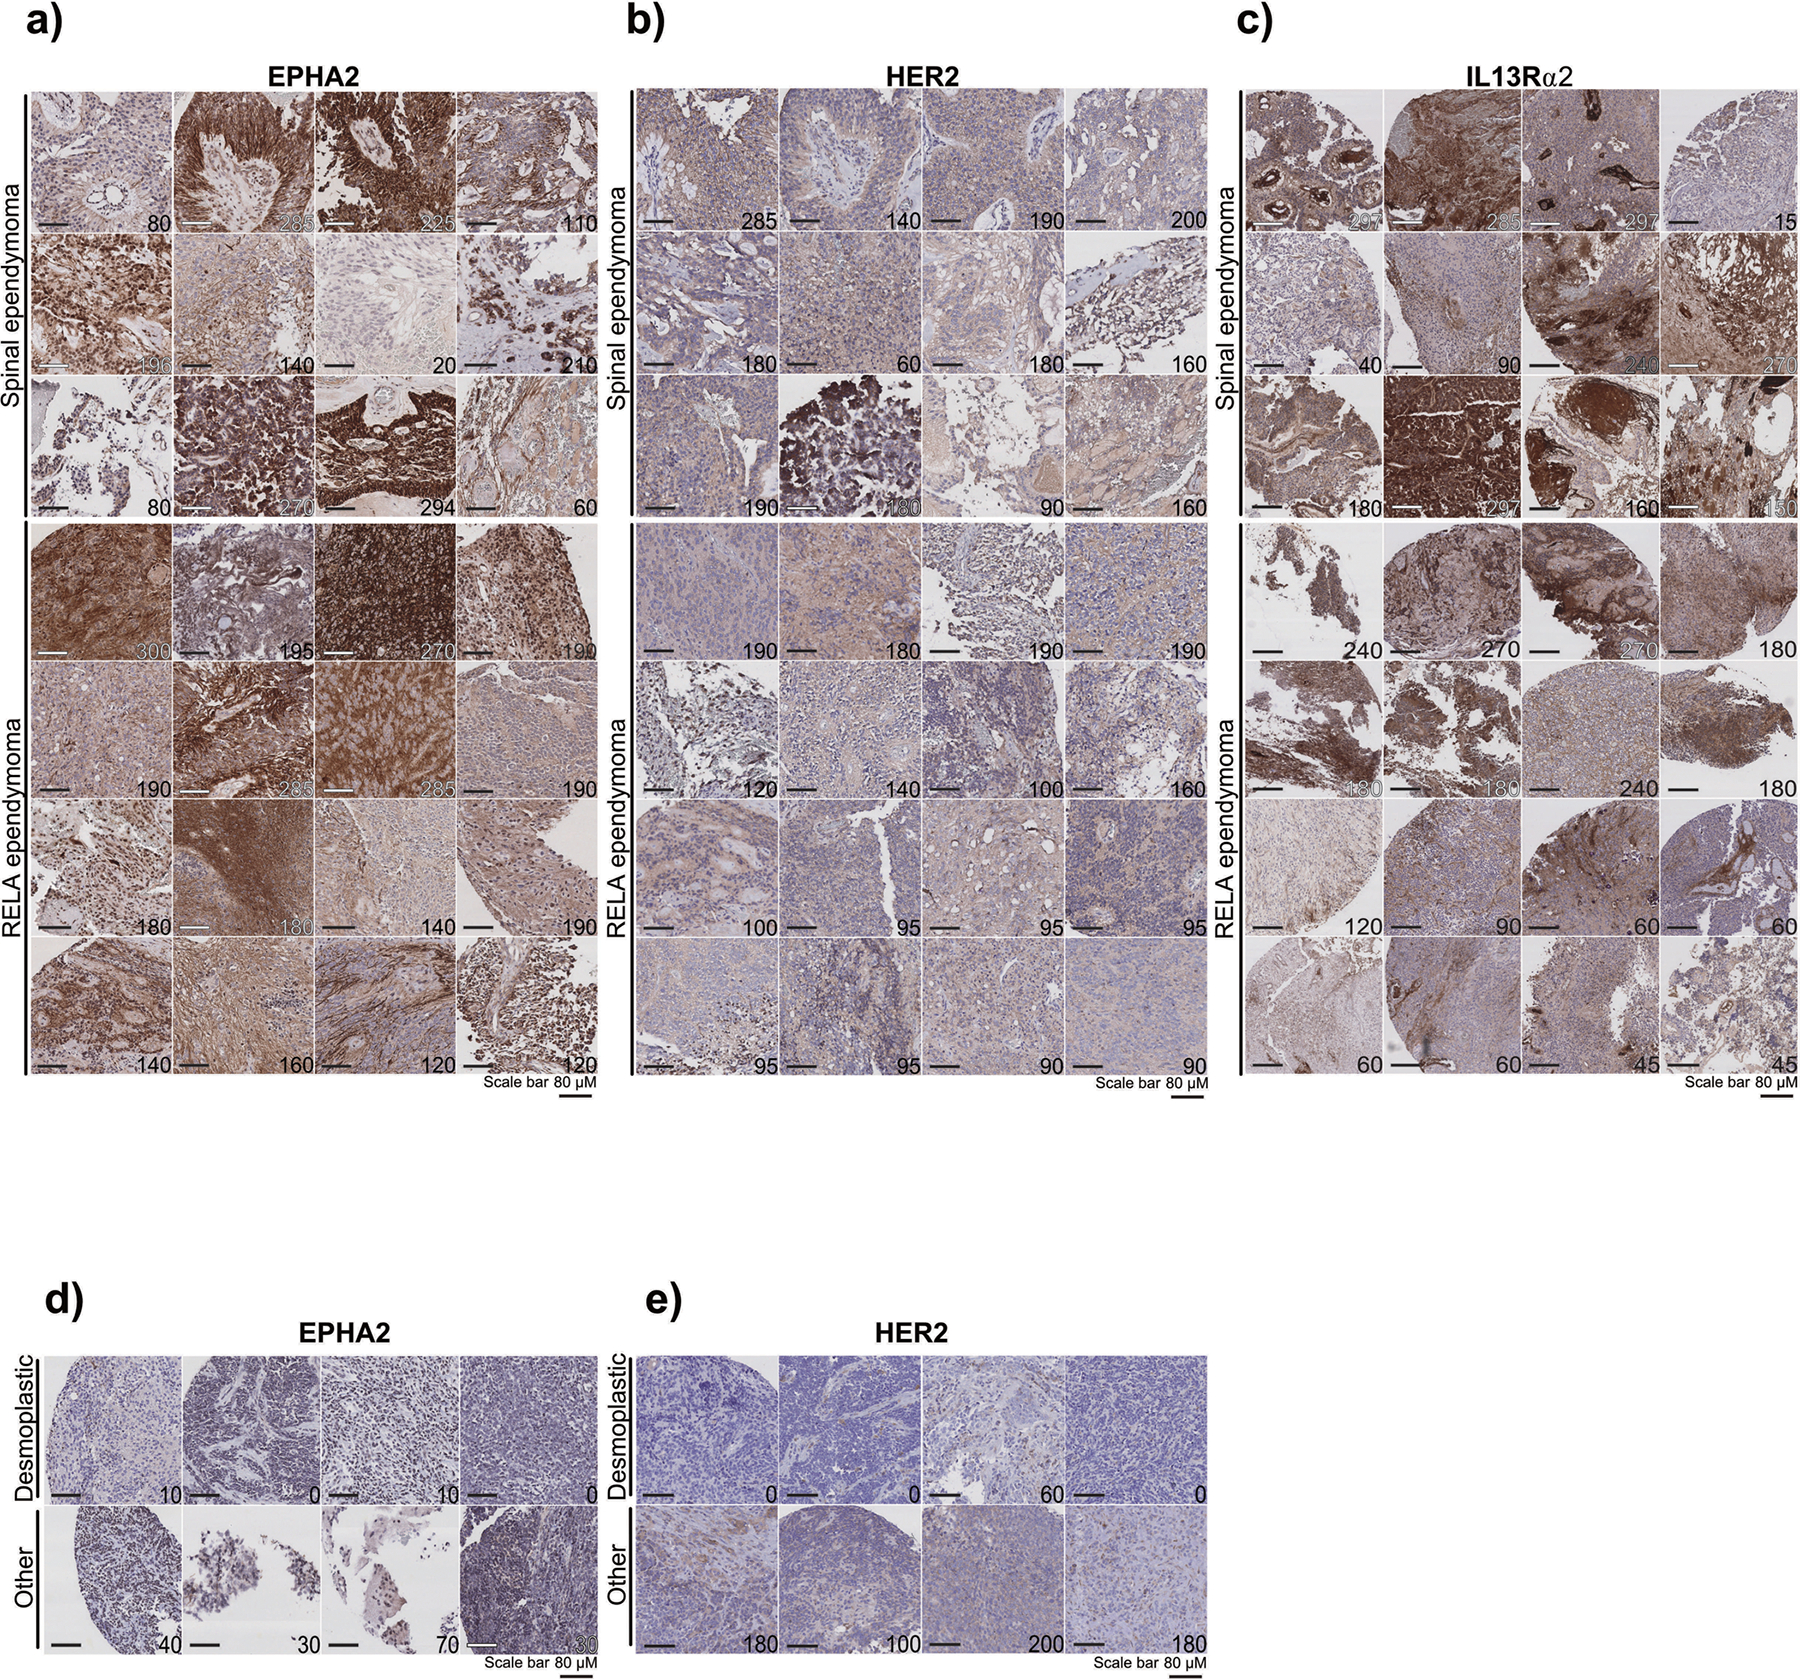
(a) EPHA2 protein expression in primary paediatric ependymoma. Top panel displays spinal ependymoma, bottom panel displays RELA ependymoma. (b) HER2 protein expression in primary paediatric ependymoma. Top panel displays spinal ependymoma, bottom panel displays RELA ependymoma. (c) IL13Rα2 protein expression in primary paediatric ependymoma. Top panel displays spinal ependymoma, bottom panel displays RELA ependymoma. (d) EPHA2 protein expression in primary paediatric, desmoplastic medulloblastoma by CHOP TMA. (e) HER2 protein expression in primary paediatric, desmoplastic medulloblastoma by CHOP TMA. Scale bar represents 80 μM. Data representative of 3 biological replicates.
Extended Figure 6. EPHA2 protein expression in primary paediatric ependymoma and matched recurrences.
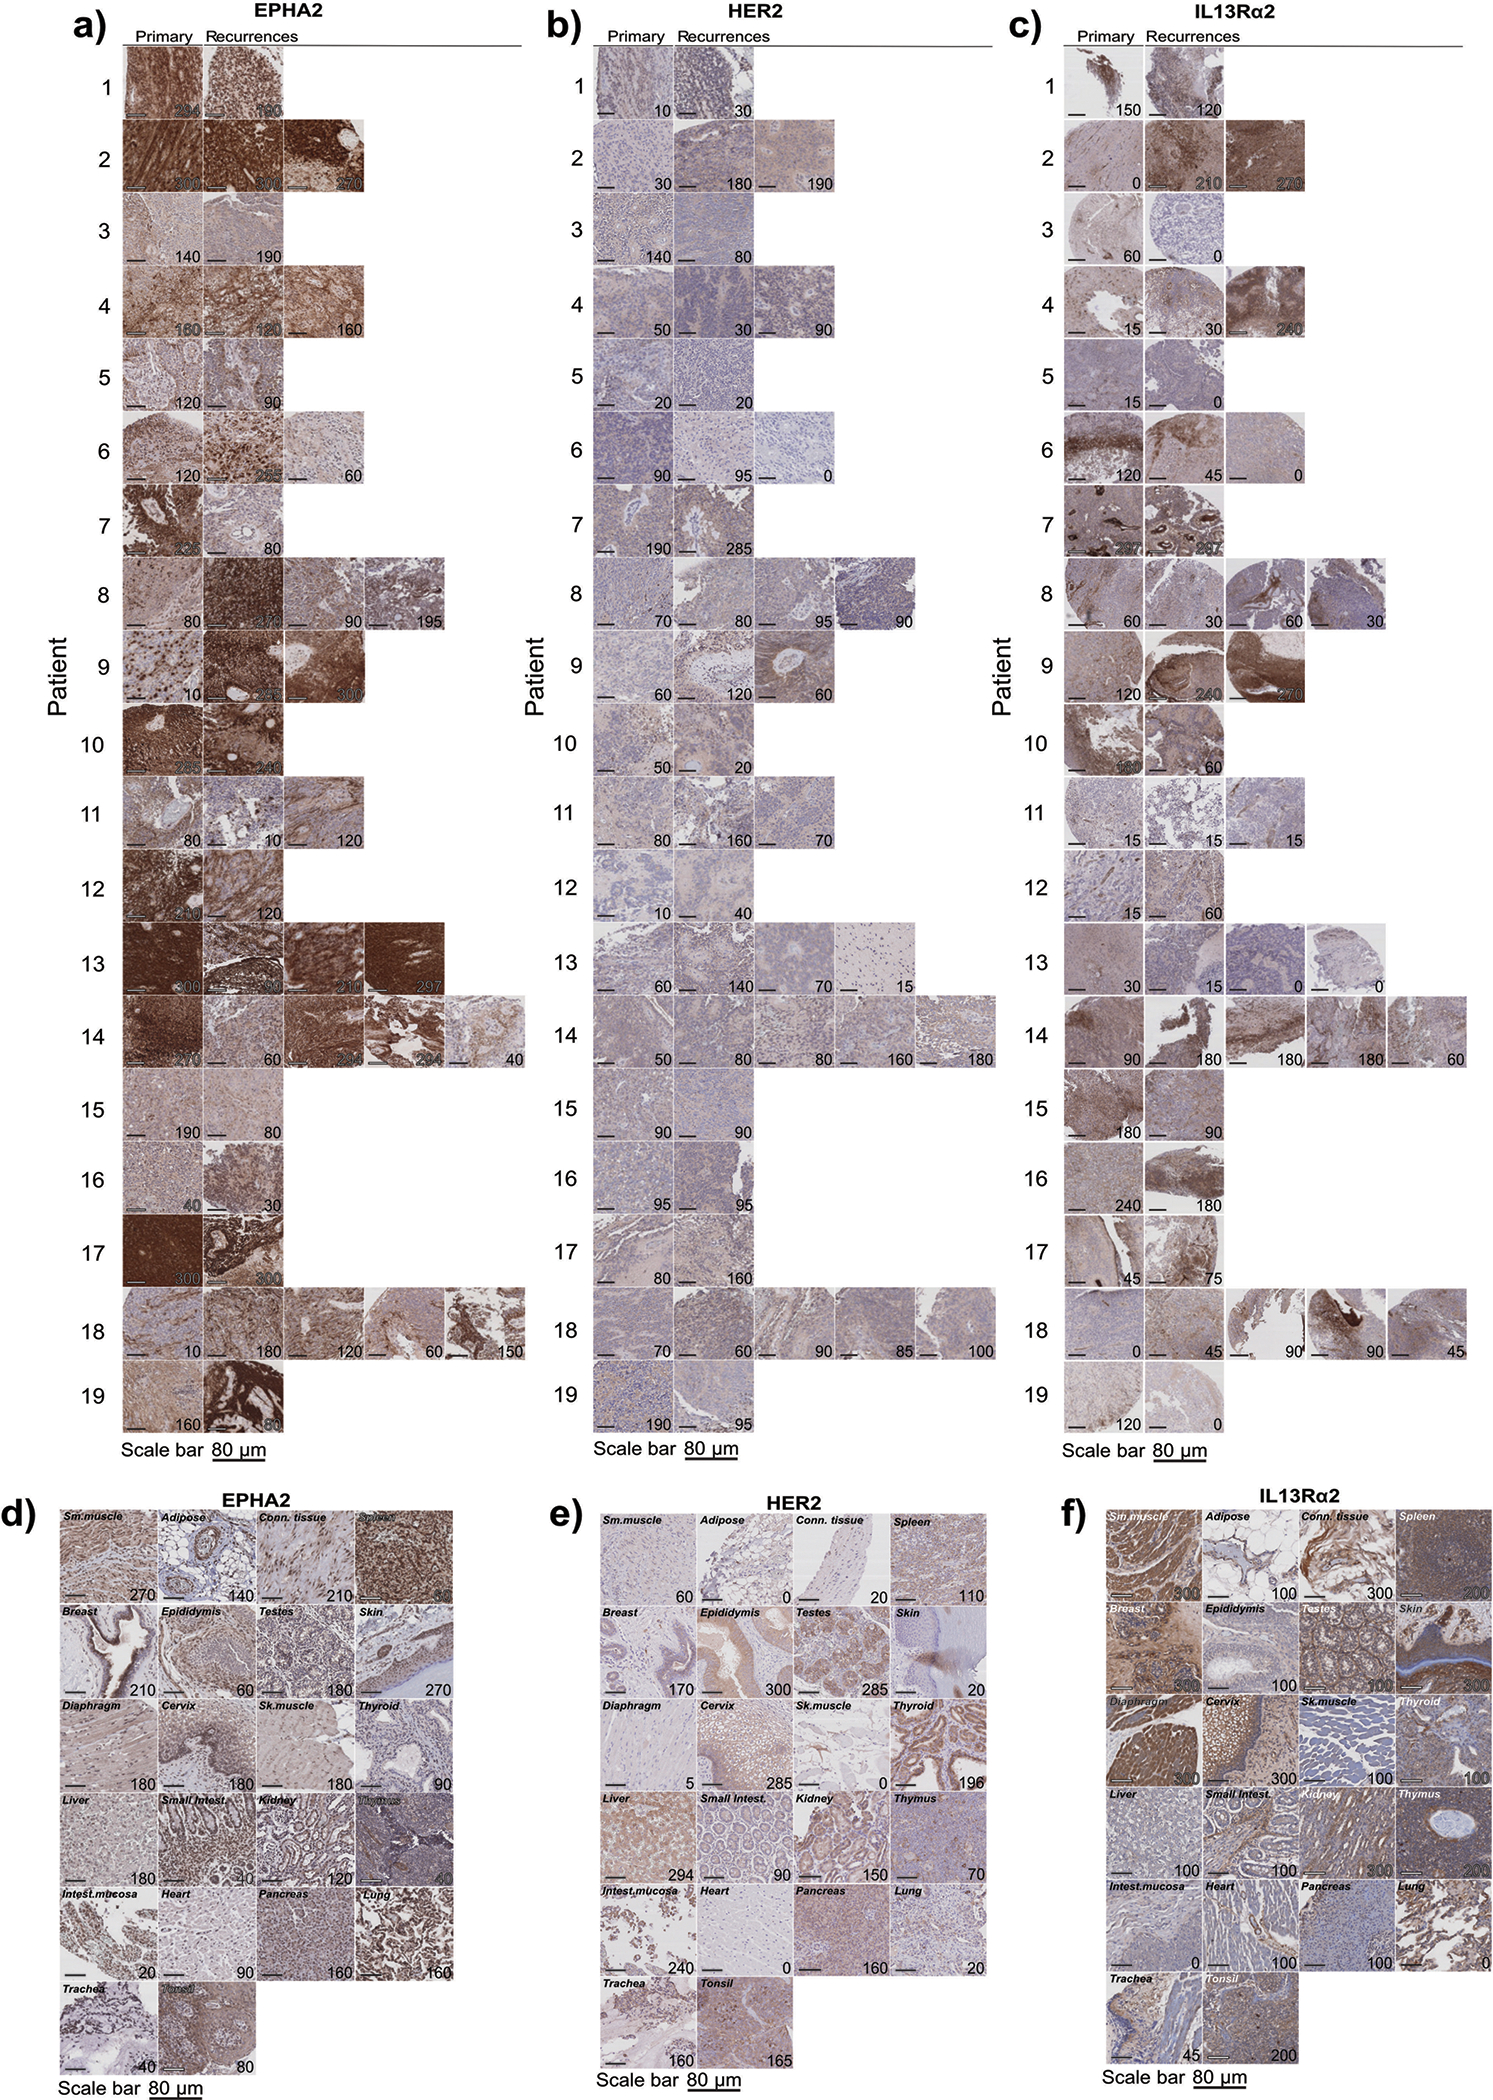
(a) EPHA2 protein expression in primary paediatric ependymoma and matched recurrences. (b) HER2 protein expression in primary paediatric ependymoma and matched recurrences. (c) IL13Rα2 protein expression in primary paediatric ependymoma and matched recurrences. (d) EPHA2 protein expression in primary paediatric medulloblastoma. Top panel displays SHH medulloblastoma, bottom panel displays Group 4 medulloblastoma. (e) HER2 protein expression in primary paediatric medulloblastoma. Top panel displays SHH medulloblastoma, bottom panel displays Group 4 medulloblastoma. (f) IL13Rα2 protein expression in primary paediatric medulloblastoma. Top panel displays SHH medulloblastoma, bottom panel displays Group 4 medulloblastoma. Scale bar represents 80 μM. Data represents 3 biological replicates.
Extended Figure 7. In vivo potency trial, experimental scheme.
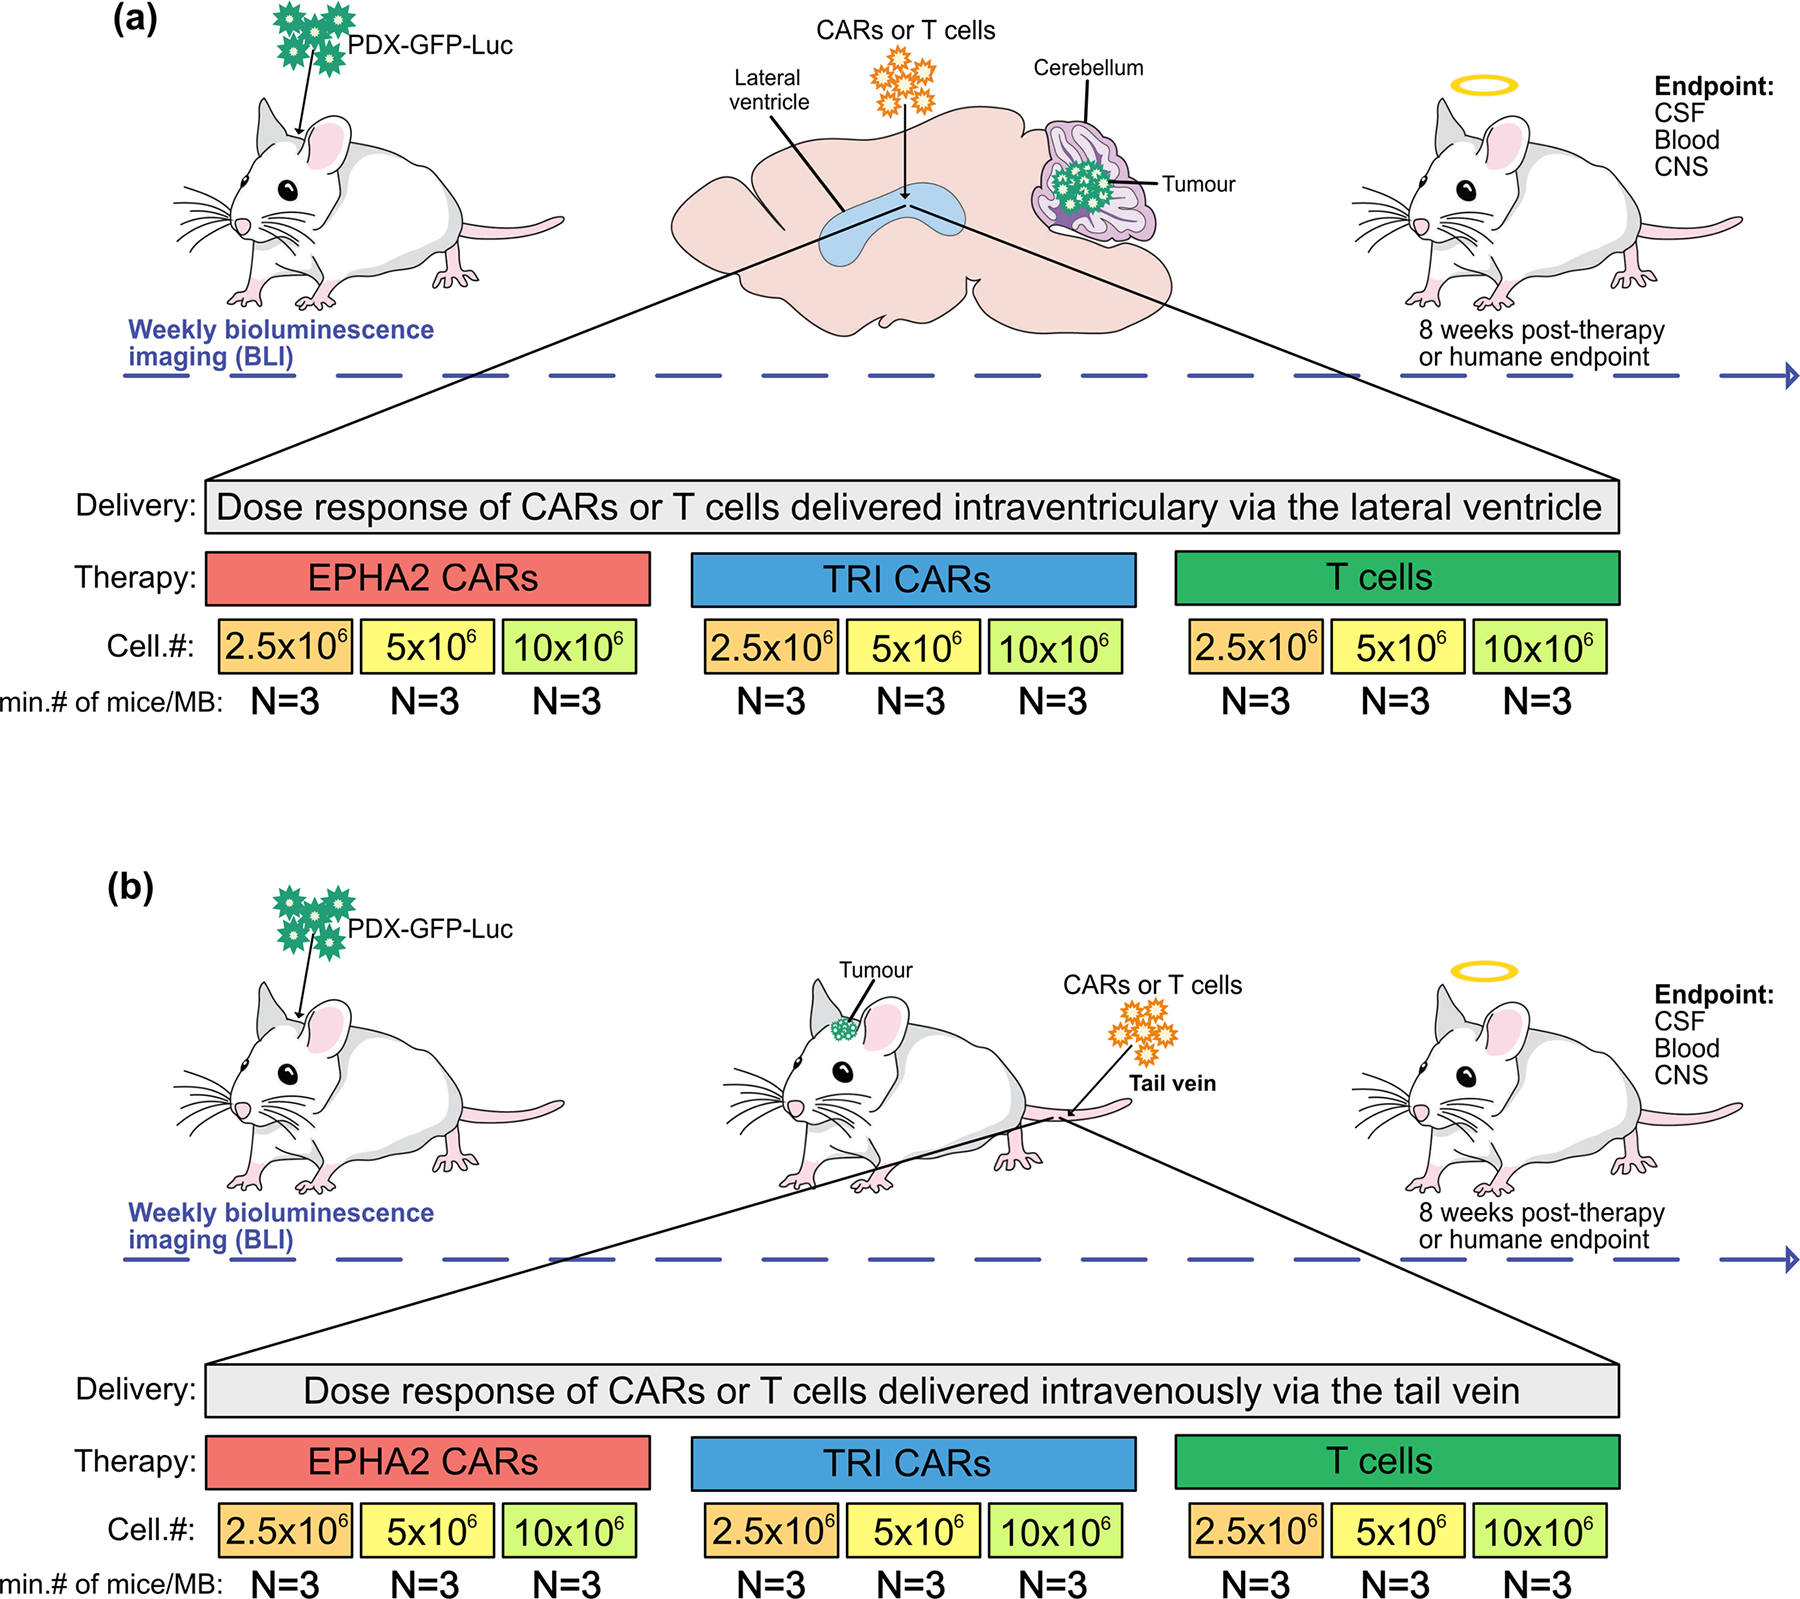
Medulloblastoma cells (Med114FH or Med411FH) expressing eGFP-firefly luciferase (PDX-GFP-Luc) were xenografted into the cerebellum of NSG mice. BLI was performed to determine tumour engraftment, at which point a single dose of EPHA2 CAR T cells, TRI CAR T cells or non-transduced T cells, were delivered at dose range of 2.5×10⁶, 5×10⁶ or 10×106 (a) intraventricularly by the lateral ventricle or (b) IV by the tail vein. Tumour burden was monitored weekly by bioluminescence (BLI) until 8 weeks post-therapy, or humane endpoint. At endpoint, a terminal cardiac puncture was performed for complete blood collection, CSF removed from the cisterna magna, and CNS harvested.
Extended Figure 8: In vivo potency trial endpoints of Med114FH PDXs treated with EPHA2 CAR T cells.
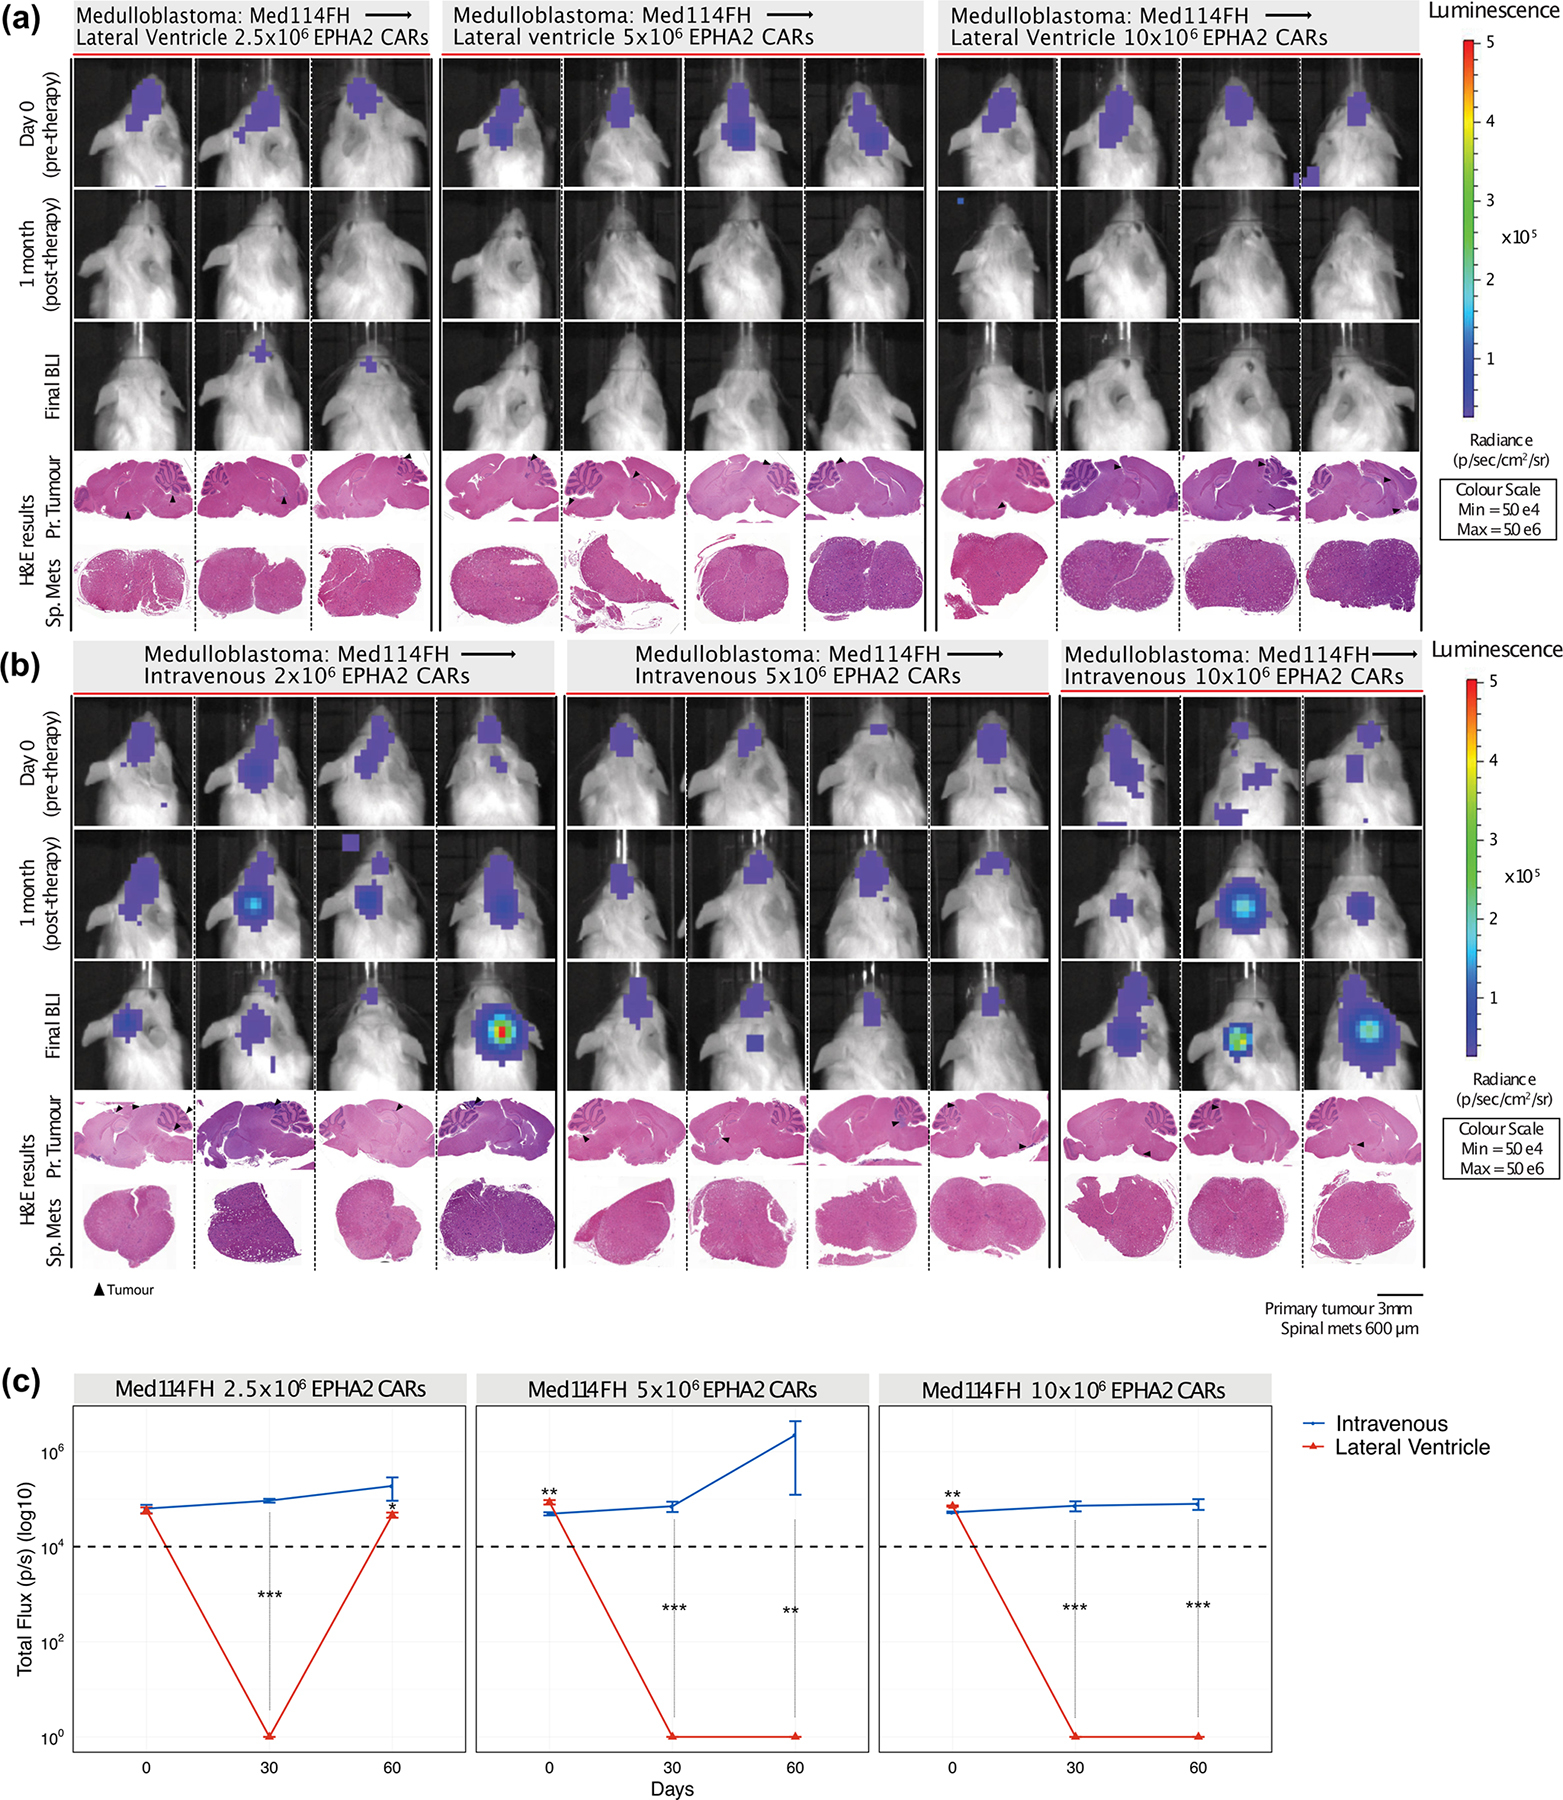
Bioluminescence (BLI) and endpoint Hematoxylin-eosin (H&E) staining analysis of NSG mice xenografted with luciferase-expressing Med114FH, infused (a) via the lateral ventricle or (b) IV with EPHA2 CAR T cells at dose range of 2.5×10⁶, 5.0×10⁶ and 10×106 as indicated (colour map for all images indicates radiance, min = 5×10⁴, max = 5×10⁶). Each column represents one mouse, each row represents the indicated time point and subsequent final BLI. Results representative of 2 independent replicates. (c) Measurement of tumour burden over time expressed as Total Flux (photons/s) following one round of lateral ventricle versus IV EPHA2 CAR T cell therapy. ***P<0.0005, **P<0.005, *P<0.05, by two-sided ANOVA followed by Tukey post hoc test, n = 3 EPHA2 CAR T cells delivered intrathecally, n = 3 EPHA2 CARs T cells delivered IV for each dose range, centre lines show the mean ± SEM performed in triplicate. Infusion of 2.5×10⁶ EPHA2: Day 0 IV vs LV P=0.807, Day 30 IV vs LV P=0.00009, Day 60 IV vs LV P=0.07; 5.0×10⁶ EPHA2: Day 0 IV vs LV P=0.03, Day 30 IV vs LV P=0.00007, Day 60 IV vs LV P=0.001; 10×106 EPHA2: Day 0 IV vs LV P=0.003, Day 30 IV vs LV P=0.00007, Day 60 IV vs LV P=0.000015.
Extended Figure 9: In vivo potency trial endpoints of Med411FH PDXs treated with EPHA2 CAR T cells.
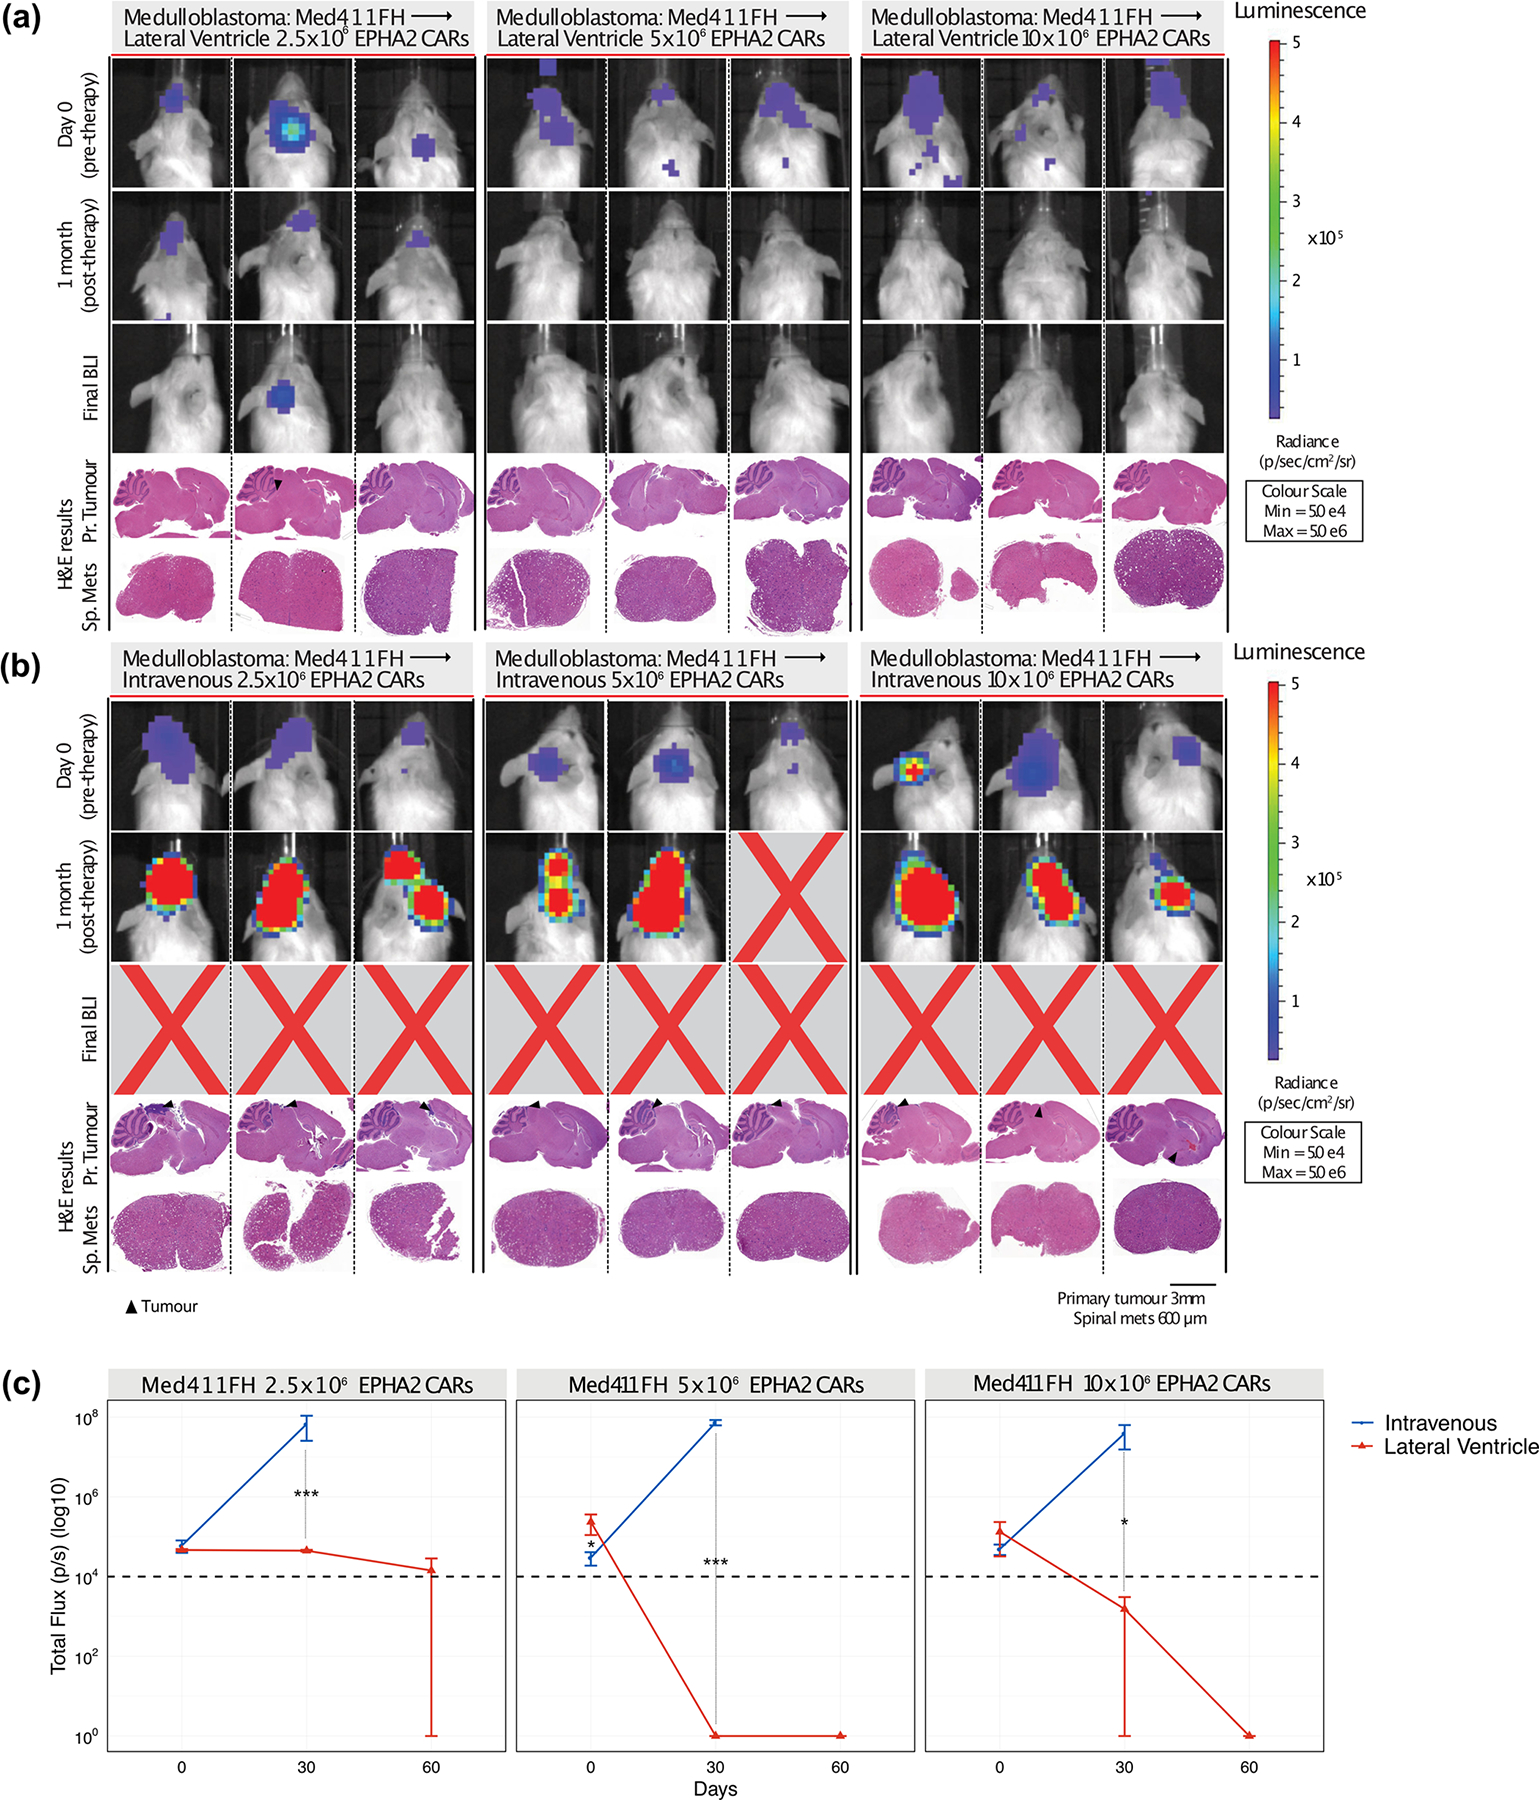
Bioluminescence (BLI) and endpoint Hematoxylin-eosin (H&E) staining analysis of NSG mice xenografted with luciferase-expressing Med411FH, infused (a) via the lateral ventricle or (b) IV with EPHA2 CAR T cells at dose range of 2.5×10⁶, 5.0×10⁶ and 10×106 as indicated (colour map for all images indicates radiance, min = 5×10⁴, max = 5×10⁶). Each column represents one mouse, each row represents the indicated time point and subsequent final BLI. Results representative of 2 independent replicates. (c) Measurement of tumour burden over time expressed as Total Flux (photons/s) following one round of lateral ventricle versus IV EPHA2 CAR T cell therapy. ***P<0.0005, **P<0.005, *P<0.05, by ANOVA followed by Tukey post hoc test, n = 3 EPHA2 CAR T cells delivered intrathecally, n = 3 EPHA2 CARs T cells delivered IV for each dose range, centre lines show the mean ± SEM performed in triplicate. Infusion of 2.5×10⁶ EPHA2: Day 0 IV vs LV P=0.7, Day 30 IV vs LV P=0.0004; 5.0×10⁶ EPHA2: Day 0 IV vs LV P=0.03, Day 30 IV vs LV P=0.00009; 10×106 EPHA2: Day 0 IV vs LV P=0.6, Day 30 IV vs LV P=0.029.
Extended Figure 10: Activation of CAR T cells - in vivo potency trial.
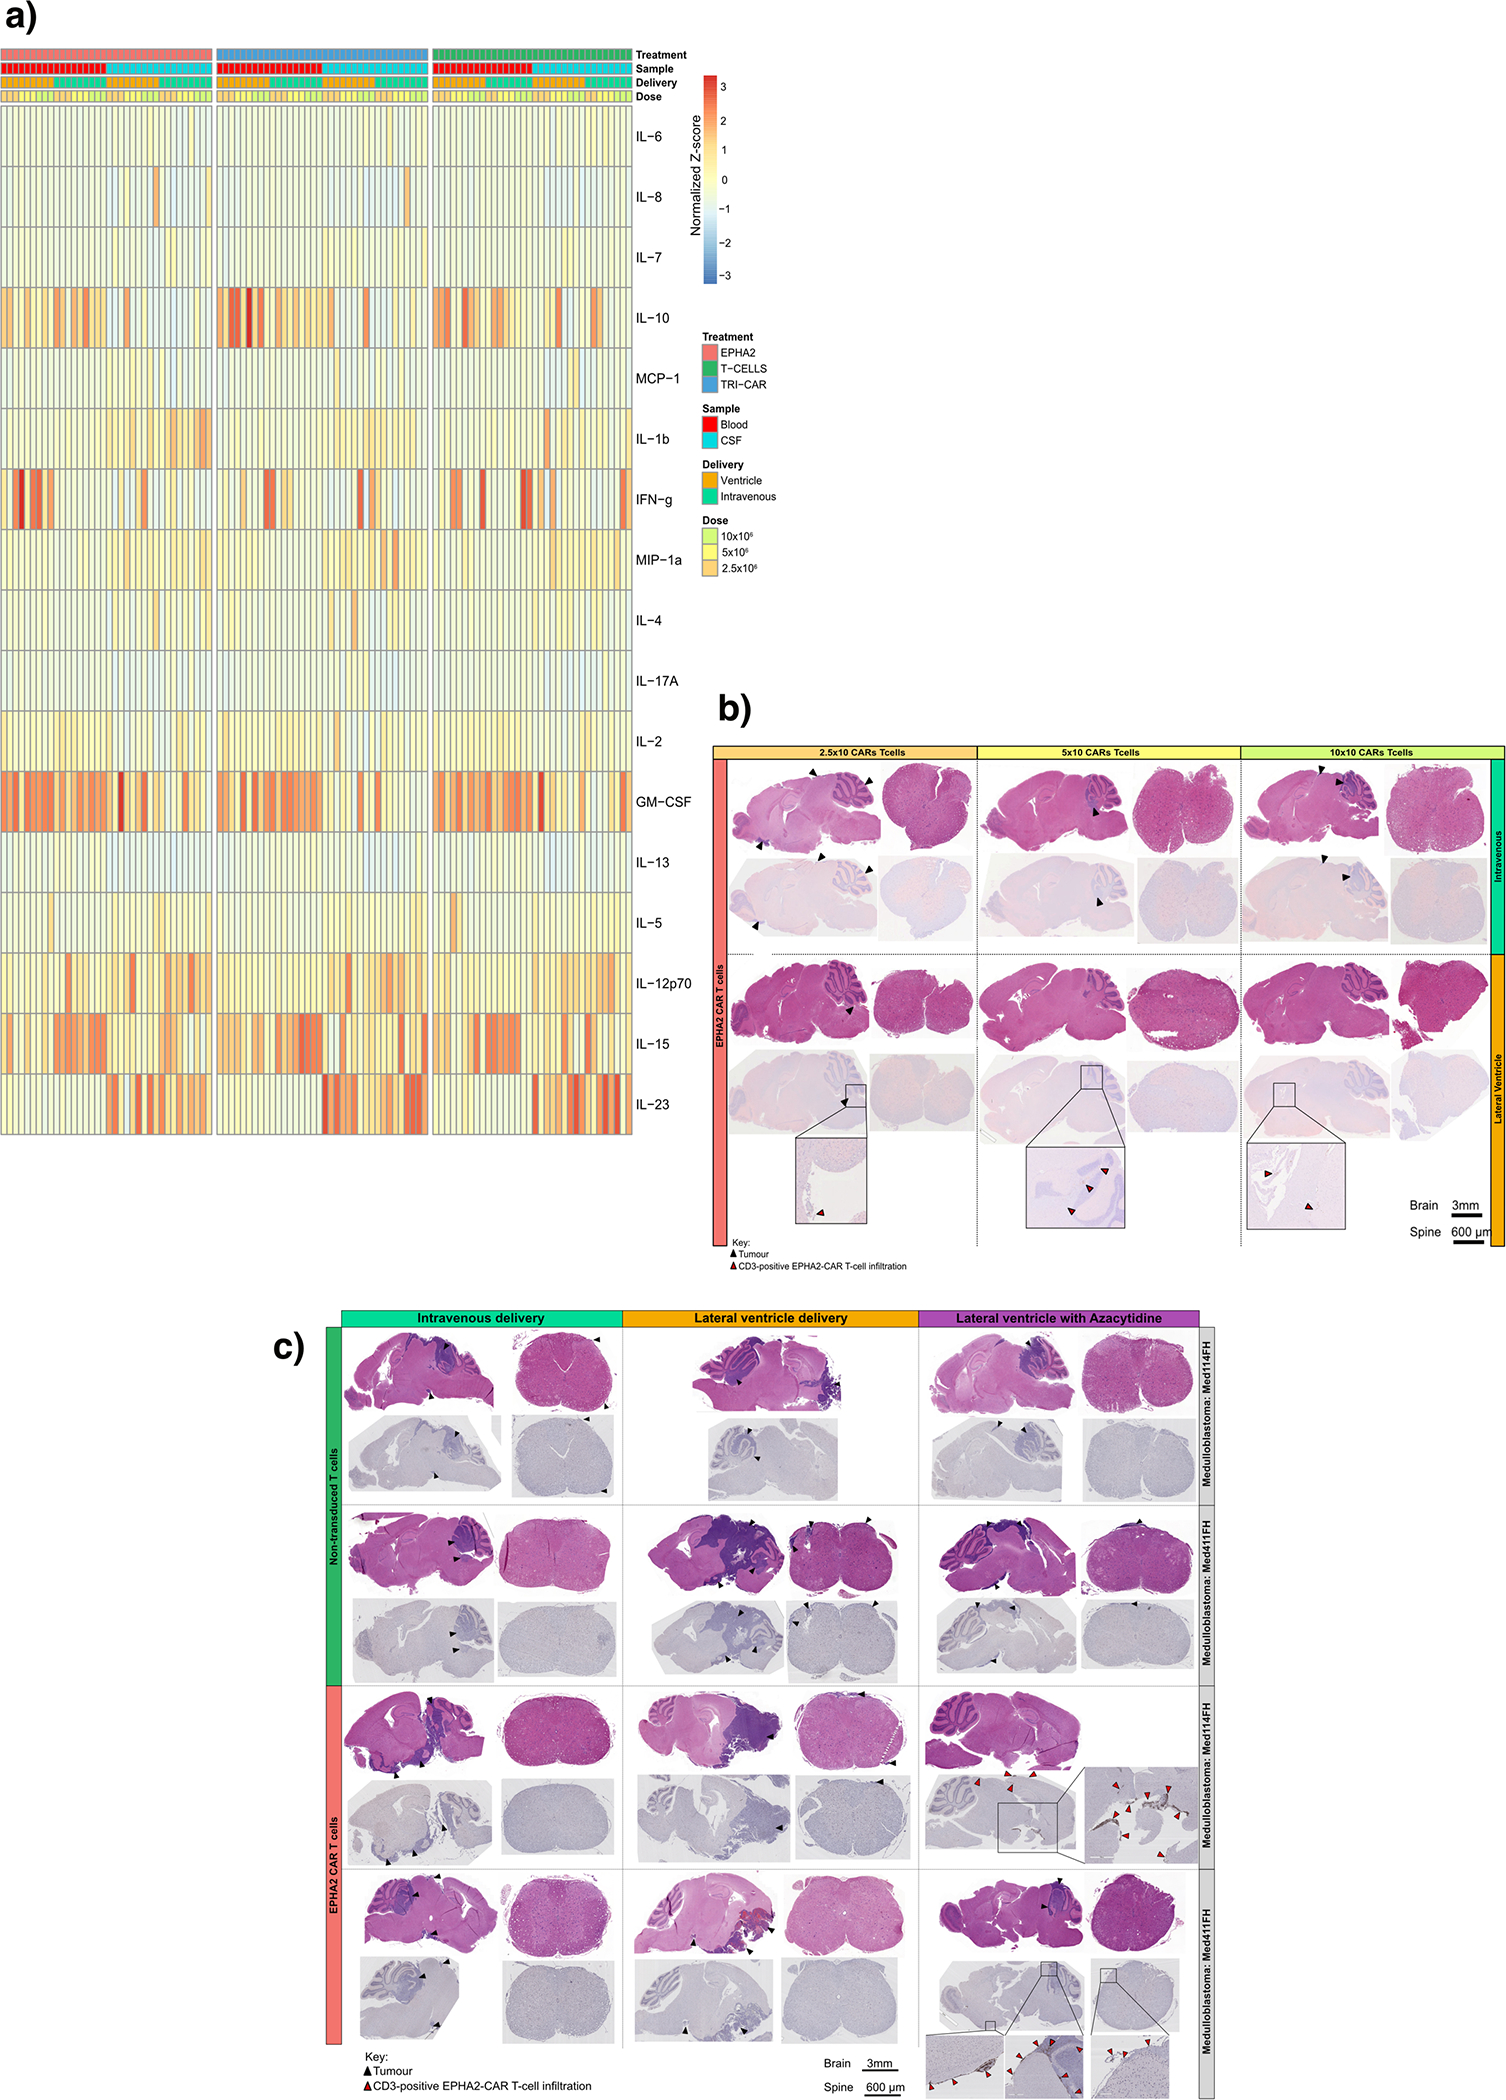
(a) Heatmap of the normalized Z-scores of Human cytokines associated with T cell activation and augmentation, present in the blood circulation and CSF of NSG mice, in response to 2.5×10⁶, 5.0×10⁶ and 10×106 EPHA2 CAR T cells, TRI CAR T cells, or non-transduced T cells; delivered intraventricularly via the lateral ventricle, or IV via the tail vein. N=36 EPHA2 (n=16 blood and 16 CSF independent animal samples; n=9 lateral ventricle and 9 intravenous CARs or T-cell infusions; n=3 2.5×10⁶, 3 5.0×10⁶ and 3 10×106 CAR-T-cell or non-transduced T-cell infusions., Samples were harvested 8 weeks post therapy, or at humane endpoint. (b) IHC analysis of EPHA2 CAR T cell accumulation in mice treated within the associated in vivo potency trial, as indicated by CD3-positive protein expression. Top panel denotes mice infused IV with a dose range of 2.5×10⁶, 5.0×10⁶ and 10×106 EPHA2 CAR T cells, the bottom panel denotes mice infused intraventricularly via the lateral ventricle with a dose range of 2.5×10⁶, 5.0×10⁶ and 10×106 EPHA2 CAR T cells. Red arrows indicate EPHA2 T cell infiltration. Results representative of 2 independent replicates. (c) IHC analysis of EPHA2 CAR T cell accumulation from archival FFPE samples of trial treated mice. The top panel denotes mice infused with non-transduced T cells, the bottom panel indicates mice treated with EPHA2 CAR T cells either intravenously (left), intraventricularly by the lateral ventricle (LV) (middle) or LV combined with Azacytidine (right) with a dose range of 5.0×10⁶. Results representative of 2 independent replicates, red arrows indicate EPHA2 T cell infiltration.
Supplementary Material
Acknowledgements
M.D.T. is supported by the NIH (R01CA148699 and R01CA159859), The Paediatric Brain Tumour Foundation, The Terry Fox Research Institute, The Canadian Institutes of Health Research, The Cure Search Foundation, b.r.a.i.n.child, Meagan’s Walk, SWIFTY Foundation, The Brain Tumour Charity, Genome Canada, Genome BC, Genome Quebec, the Ontario Research Fund, Worldwide Cancer Research, V-Foundation for Cancer Research, and the Ontario Institute for Cancer Research through funding provided by the Government of Ontario. M.D.T. is also supported by a Canadian Cancer Society Research Institute Impact grant, a Cancer Research UK Brain Tumour Award, and by a Stand Up To Cancer (SU2C) St. Baldrick’s Paediatric Dream Team Translational Research Grant (SU2C-AACR-DT1113) and SU2C Canada Cancer Stem Cell Dream Team Research Funding (SU2C-AACR-DT-19-15) provided by the Government of Canada through Genome Canada and the Canadian Institutes of Health Research, with supplementary support from the Ontario Institute for Cancer Research through funding provided by the Government of Ontario. Stand Up to Cancer is a program of the Entertainment Industry Foundation administered by the American Association for Cancer Research. M.D.T. is also supported by the Garron Family Chair in Childhood Cancer Research at the Hospital for Sick Children and the University of Toronto. N.A is supported by NIH (U54 CA232568-01) Stand Up To Cancer (SU2C) St. Baldrick’s Paediatric Dream Team Translational Research Grant (SU2C-AACR-DT1113). L.K.D was supported by funding from Brain Canada NeuroDevNet.
We thank P. Rose Matthew for her valuable help in making the CAR T-cells; Stephen Gottschalk for designing and constructing the EPHA2 CAR; Didier Trono for gifting the psPAX2 and pMD2.G plasmids; Stephen Keir and Darell Bigner for gifting the Ep612 cells; and Magnus Essand for gifting the pBMN(CMV-copGFP-Luc2-Puro) plasmid. The authors would like to thank Jim Loukides (Manager, Brain Tumour Biobank at SickKids) and recognize the Labatt Brain Tumour Research Centre and The Michael and Amira Dan Brain Tumour Bank Network. We gratefully thank the Pathology Research Program Laboratory, UHN, for their pathology assistance, and The Centre for Phenogenomics for their animal husbandry support and BLI assistance. We thank Susan Archer for technical writing assistance and editing, and Alastair Carlow for manuscript support.
Footnotes
Competing interests statement
The authors declare no competing interests.
Data Availability Statement
All requests for raw and analyzed data and materials are promptly reviewed by The Hospital for Sick Children to verify if the request is subject to any intellectual property or confidentiality obligations. Any materials that can be shared will be released via a Material Transfer Agreement.
All raw and analyzed sequencing datasets analysed during the current study are open source, referenced and available from the following repositories: primary-metastasis medulloblastoma pairs DNA methylation analysis GSE63670; primary medulloblastoma genome-wide methylation and expression profile analysis GSE85218; primary ependymoma Affymetrix chip array analysis GSE27279. All CAR-T-cell constructs used within the study are previously published.
References
- 1.Pui CH, Gajjar AJ, Kane JR, Qaddoumi IA & Pappo AS Challenging issues in pediatric oncology. Nat. Rev. Clin. Oncol. 8, 540–549 (2011). [DOI] [PMC free article] [PubMed] [Google Scholar]
- 2.Vladoiu MC et al. Childhood cerebellar tumors mirror conserved fetal transcriptional programs. Nature 350280 (2018). doi: 10.1101/350280 [DOI] [PMC free article] [PubMed] [Google Scholar]
- 3.Mack SC et al. Therapeutic targeting of ependymoma as informed by oncogenic enhancer profiling. Nature (2018). doi: 10.1038/nature25169 [DOI] [PMC free article] [PubMed] [Google Scholar]
- 4.Khatua S, Ramaswamy V & Bouffet E Current therapy and the evolving molecular landscape of paediatric ependymoma. European Journal of Cancer (2017). doi: 10.1016/j.ejca.2016.10.013 [DOI] [PubMed] [Google Scholar]
- 5.Ramaswamy V et al. Recurrence patterns across medulloblastoma subgroups: An integrated clinical and molecular analysis. Lancet Oncol. 14, 1200–1207 (2013). [DOI] [PMC free article] [PubMed] [Google Scholar]
- 6.Northcott PA et al. The whole-genome landscape of medulloblastoma subtypes. Nature 547, 311–317 (2017). [DOI] [PMC free article] [PubMed] [Google Scholar]
- 7.Taylor MD et al. Molecular subgroups of medulloblastoma: the current consensus. Acta Neuropathol. 123, 465–472 (2011). [DOI] [PMC free article] [PubMed] [Google Scholar]
- 8.Northcott PA et al. Medulloblastoma comprises four distinct molecular variants. J. Clin. Oncol. (2011). doi: 10.1200/JCO.2009.27.4324 [DOI] [PMC free article] [PubMed] [Google Scholar]
- 9.Cavalli FM et al. Intertumoral Heterogeneity within Medulloblastoma Subgroups. Cancer Cell 31, 737–754. e6 (2017). [DOI] [PMC free article] [PubMed] [Google Scholar]
- 10.Kulozik AE et al. Molecular Classification of Ependymal Tumors across All CNS Compartments, Histopathological Grades, and Age Groups. Cancer Cell 27, 728–743 (2015). [DOI] [PMC free article] [PubMed] [Google Scholar]
- 11.Morrissy AS et al. Divergent clonal selection dominates medulloblastoma at recurrence. Nature 529, 351–357 (2016). [DOI] [PMC free article] [PubMed] [Google Scholar]
- 12.Garzia L et al. A Hematogenous Route for Medulloblastoma Leptomeningeal Metastases. Cell 172, 1050–1062. e14 (2018). [DOI] [PMC free article] [PubMed] [Google Scholar]
- 13.Bette S et al. Retrospective Analysis of Radiological Recurrence Patterns in Glioblastoma, Their Prognostic Value and Association to Postoperative Infarct Volume. Sci. Rep. 8, 1–12 (2018). [DOI] [PMC free article] [PubMed] [Google Scholar]
- 14.Mack SC et al. Epigenomic alterations define lethal CIMP-positive ependymomas of infancy. Nature 506, 445–50 (2014). [DOI] [PMC free article] [PubMed] [Google Scholar]
- 15.Majzner RG et al. CAR T cells targeting B7-H3, a pan-cancer antigen, demonstrate potent preclinical activity against pediatric solid tumors and brain tumors. Clin. Cancer Res. (2019). doi: 10.1158/1078-0432.CCR-18-0432 [DOI] [PMC free article] [PubMed] [Google Scholar]
- 16.Mount CW et al. Potent antitumor efficacy of anti-GD2 CAR T cells in H3-K27M+ diffuse midline gliomas letter. Nat. Med. (2018). doi: 10.1038/s41591-018-0006-x [DOI] [PMC free article] [PubMed] [Google Scholar]
- 17.Brown CE et al. Bioactivity and safety of IL13Rα2-redirected chimeric antigen receptor CD8+ T cells in patients with recurrent glioblastoma. Clin. Cancer Res. (2015). doi: 10.1158/1078-0432.CCR-15-0428 [DOI] [PMC free article] [PubMed] [Google Scholar]
- 18.Keu KV et al. Reporter gene imaging of targeted T cell immunotherapy in recurrent glioma. Sci. Transl. Med. (2017). doi: 10.1126/scitranslmed.aag2196 [DOI] [PMC free article] [PubMed] [Google Scholar]
- 19.Brown CE et al. Regression of Glioblastoma after Chimeric Antigen Receptor T-Cell Therapy. N. Engl. J. Med. 375, 2561–2569 (2016). [DOI] [PMC free article] [PubMed] [Google Scholar]
- 20.Ahmed N et al. HER2-Specific Chimeric Antigen Receptor–Modified Virus-Specific T Cells for Progressive Glioblastoma. JAMA Oncol. 3, 1094 (2017). [DOI] [PMC free article] [PubMed] [Google Scholar]
- 21.O’Rourke DM et al. A single dose of peripherally infused EGFRvIII-directed CAR T cells mediates antigen loss and induces adaptive resistance in patients with recurrent glioblastoma. Sci. Transl. Med. (2017). doi: 10.1126/scitranslmed.aaa0984 [DOI] [PMC free article] [PubMed] [Google Scholar]
- 22.Ahmed N et al. Regression of experimental medulloblastoma following transfer of HER2-specific T cells. Cancer Res. (2007). doi: 10.1158/0008-5472.CAN-06-4309 [DOI] [PubMed] [Google Scholar]
- 23.Nellan A et al. Durable regression of Medulloblastoma after regional and intravenous delivery of anti-HER2 chimeric antigen receptor T cells. J. Immunother. Cancer (2018). doi: 10.1186/s40425-018-0340-z [DOI] [PMC free article] [PubMed] [Google Scholar]
- 24.Chow KK et al. T cells redirected to EphA2 for the immunotherapy of glioblastoma. Mol. Ther. 21, 629–637 (2013). [DOI] [PMC free article] [PubMed] [Google Scholar]
- 25.Krebs S et al. T cells redirected to interleukin-13Rα2 with interleukin-13 mutein-chimeric antigen receptors have anti-glioma activity but alsorecognize interleukin-13Rα1. Cytotherapy (2014). doi: 10.1016/j.jcyt.2014.02.012 [DOI] [PMC free article] [PubMed] [Google Scholar]
- 26.Wu X et al. Clonal selection drives genetic divergence of metastatic medulloblastoma. Nature 482, 529–533 (2012). [DOI] [PMC free article] [PubMed] [Google Scholar]
- 27.Bielamowicz K et al. Trivalent CAR T cells overcome interpatient antigenic variability in glioblastoma. Neuro. Oncol. (2018). doi: 10.1093/neuonc/nox182 [DOI] [PMC free article] [PubMed] [Google Scholar]
- 28.Schulz H et al. Intraventricular treatment of relapsed central nervous system lymphoma with the anti-CD20 antibody rituximab. Haematologica (2004). [PubMed] [Google Scholar]
- 29.Kramer K et al. A phase II study of radioimmunotherapy with intraventricular 131I-3F8 for medulloblastoma. Pediatr. Blood Cancer (2018). doi: 10.1002/pbc.26754 [DOI] [PMC free article] [PubMed] [Google Scholar]
- 30.Hwu P Lymphodepletion Plus Adoptive Cell Transfer With or Without Dendritic Cell Immunization in Patients With Metastatic Melanoma. ClinicalTrials.gov Identifier: NCT00338377 (2006).
- 31.Witt H et al. Delineation of Two Clinically and Molecularly Distinct Subgroups of Posterior Fossa Ependymoma. Cancer Cell 20, 143–157 (2011). [DOI] [PMC free article] [PubMed] [Google Scholar]
- 32.Morrissy AS et al. Spatial heterogeneity in medulloblastoma. Nat. Genet. 49, 780–788 (2017). [DOI] [PMC free article] [PubMed] [Google Scholar]
- 33.Priceman SJ et al. Regional delivery of chimeric antigen receptor-engineered T cells effectively targets HER2 + breast cancer metastasis to the brain. Clin. Cancer Res. (2018). doi: 10.1158/1078-0432.CCR-17-2041 [DOI] [PMC free article] [PubMed] [Google Scholar]
- 34.Brown CE et al. Optimization of IL13Rα2-Targeted Chimeric Antigen Receptor T Cells for Improved Anti-tumor Efficacy against Glioblastoma. Mol. Ther. (2018). doi: 10.1016/j.ymthe.2017.10.002 [DOI] [PMC free article] [PubMed] [Google Scholar]
- 35.Stritesky GL, Yeh N & Kaplan MH IL-23 Promotes Maintenance but Not Commitment to the Th17 Lineage. J. Immunol. (2008). doi: 10.4049/jimmunol.181.9.5948 [DOI] [PMC free article] [PubMed] [Google Scholar]
- 36.Rasouli J et al. Expression of GM-CSF in T Cells Is Increased in Multiple Sclerosis and Suppressed by IFN-β Therapy. J. Immunol. (2015). doi: 10.4049/jimmunol.1403243 [DOI] [PMC free article] [PubMed] [Google Scholar]
- 37.Bergamaschi C et al. Circulating IL-15 exists as heterodimeric complex with soluble IL-15Rα in human and mouse serum. Blood (2012). doi: 10.1182/blood-2011-10-384362 [DOI] [PMC free article] [PubMed] [Google Scholar]
- 38.Hegde M et al. Tandem CAR T cells targeting HER2 and IL13Rα2 mitigate tumor antigen escape. J. Clin. Invest. (2016). doi: 10.1172/JCI83416 [DOI] [PMC free article] [PubMed] [Google Scholar]
- 39.Momparler RL, Côté S, Momparler LF & Idaghdour Y Epigenetic therapy of acute myeloid leukemia using 5-aza-2’-deoxycytidine (decitabine) in combination with inhibitors of histone methylation and deacetylation. Clin. Epigenetics (2014). doi: 10.1186/1868-7083-6-19 [DOI] [PMC free article] [PubMed] [Google Scholar]
- 40.Montalban-Bravo G & Garcia-Manero G Myelodysplastic syndromes: 2018 update on diagnosis, risk-stratification and management. Am. J. Hematol. (2018). doi: 10.1002/ajh.24930 [DOI] [PubMed] [Google Scholar]
- 41.Stresemann C & Lyko F Modes of action of the DNA methyltransferase inhibitors azacytidine and decitabine. International Journal of Cancer (2008). doi: 10.1002/ijc.23607 [DOI] [PubMed] [Google Scholar]
- 42.Qiu X et al. Equitoxic doses of 5-Azacytidine and 5-Aza- 2’deoxycytidine induce diverse immediate and overlapping heritable changes in the transcriptome. PLoS One (2010). doi: 10.1371/journal.pone.0012994 [DOI] [PMC free article] [PubMed] [Google Scholar]
- 43.Gang AO et al. 5-azacytidine treatment sensitizes tumor cells to T-cell mediated cytotoxicity and modulates NK cells in patients with myeloid malignancies. Blood Cancer J. (2014). doi: 10.1038/bcj.2014.14 [DOI] [PMC free article] [PubMed] [Google Scholar]
- 44.Goodyear OC et al. Azacitidine augments expansion of regulatory T cells after allogeneic stem cell transplantation in patients with acute myeloid leukemia (AML). Blood 119, 3361–3369 (2012). [DOI] [PubMed] [Google Scholar]
- 45.Fozza C et al. Azacitidine improves the T-cell repertoire in patients with myelodysplastic syndromes and acute myeloid leukemia with multilineage dysplasia. Leuk. Res. (2015). doi: 10.1016/j.leukres.2015.06.007 [DOI] [PubMed] [Google Scholar]
- 46.Mokhtari RB et al. Combination therapy in combating cancer. Oncotarget (2017). doi: 10.18632/oncotarget.16723 [DOI] [PMC free article] [PubMed] [Google Scholar]
- 47.Rodríguez-Paredes M & Esteller M Cancer epigenetics reaches mainstream oncology. Nature Medicine (2011). doi: 10.1038/nm.2305 [DOI] [PubMed] [Google Scholar]
- 48.Terracina KP et al. DNA methyltransferase inhibition increases efficacy of adoptive cellular immunotherapy of murine breast cancer. Cancer Immunol. Immunother. (2016). doi: 10.1007/s00262-016-1868-8 [DOI] [PMC free article] [PubMed] [Google Scholar]
- 49.Quddus J et al. Treating activated CD4+ T cells with either of two distinct DNA methyltransferase inhibitors, 5-azacytidine or procainamide, is sufficient to cause a lupus-like disease in syngeneic mice. J. Clin. Invest. (1993). doi: 10.1172/JCI116576 [DOI] [PMC free article] [PubMed] [Google Scholar]
- 50.Niu L CAR-T Cell Immunotherapy for EphA2 Positive Malignant Glioma Patients. ClinicalTrials.gov Identifier: NCT02575261 (2017).
- 51.Goff SL et al. Pilot trial of adoptive transfer of chimeric antigen receptor-Transduced t cells targeting egfrviii in patients with glioblastoma. J. Immunother. (2019). doi: 10.1097/CJI.0000000000000260 [DOI] [PMC free article] [PubMed] [Google Scholar]
- 52.Morgan RA et al. Case report of a serious adverse event following the administration of t cells transduced with a chimeric antigen receptor recognizing ERBB2. Mol. Ther. (2010). doi: 10.1038/mt.2010.24 [DOI] [PMC free article] [PubMed] [Google Scholar]
- 53.Akhavan D et al. CAR T cells for brain tumors: Lessons learned and road ahead. Immunological Reviews (2019). doi: 10.1111/imr.12773. [DOI] [PMC free article] [PubMed] [Google Scholar]
Methods only references
- 1.Chow KK et al. T cells redirected to EphA2 for the immunotherapy of glioblastoma. Mol. Ther 21, 629–637 (2013). [DOI] [PMC free article] [PubMed] [Google Scholar]
- 2.Bielamowicz K et al. Trivalent CAR T cells overcome interpatient antigenic variability in glioblastoma. Neuro. Oncol 20, 506–518 (2017). [DOI] [PMC free article] [PubMed] [Google Scholar]
- 3.Hedge M et al. Tandem CAR T cells targeting HER2 and IL13Rα2 mitigate tumor antigen escape. J. Clin. Invest (2016). [DOI] [PMC free article] [PubMed] [Google Scholar]
- 4.Azemar M et al. Regression of Cutaneous Tumor Lesions in Patients Intratumorally Injected with Recombinant Single-chain Antibody-toxic Targted to ErbB2/HER2. Breats Cancer Res. Treat 82, 155–164 (2003). [DOI] [PubMed] [Google Scholar]
- 5.Ahmed N et al. Regression of experimental medulloblastoma following transfer of HER2-specific T cells. Cancer Res (2007). [DOI] [PubMed] [Google Scholar]
- 6.Krebs S et al. T cells redirected to interleukin-13Rα2 with interleukin-13 mutein-chimeric antigen receptors have anti-glioma activity but also recognize interleukin-13Rα1. Cytotherapy (2014). [DOI] [PMC free article] [PubMed] [Google Scholar]
- 7.Jin C et al. Safe engineering of CAR T cells for adoptive cell therapy of cancer using long-term episomal gene transfer. EMBO Mol. Med (2016), [DOI] [PMC free article] [PubMed] [Google Scholar]
- 8.McLendon RE et al. Production and Characterization of Two Ependymoma Xenografts. J. Neuropathol. Exp. Neurol. 55, 540–548 (1996). [DOI] [PubMed] [Google Scholar]
- 9.Kimura S et al. Antiproliferative and antitumor effects of azacytidine against the human myelodysplastic syndrome cell line SKM-1. Anticancer Res. [PubMed] [Google Scholar]
- 10.Ramaswamy V Treatment of Children with Refractory Brain/Solid Tumors and Recurrent Ependymoma. ClinicalTrials.gov Identifier:NCT03206021 (2017).
- 11.Wang X et al. Medulloblastoma subgroups remain stable across primary and metastatic compartments. 154, 2262–2265 (2014). [DOI] [PMC free article] [PubMed] [Google Scholar]
- 12.Cavalli FM et al. Intertumoral Heterogeneity within Medulloblastoma Subgroups. Cancer Cell 31, 737–754. e6 (2017). [DOI] [PMC free article] [PubMed] [Google Scholar]
- 13.Witt H et al. Delineation of Two Clinically and Molecularly Distinct Subgroups of Posterior Fossa Ependymoma. Cancer Cell 20, 143–157 (2011). [DOI] [PMC free article] [PubMed] [Google Scholar]
Associated Data
This section collects any data citations, data availability statements, or supplementary materials included in this article.
Supplementary Materials
Data Availability Statement
All requests for raw and analyzed data and materials are promptly reviewed by The Hospital for Sick Children to verify if the request is subject to any intellectual property or confidentiality obligations. Any materials that can be shared will be released via a Material Transfer Agreement.
All raw and analyzed sequencing datasets analysed during the current study are open source, referenced and available from the following repositories: primary-metastasis medulloblastoma pairs DNA methylation analysis GSE63670; primary medulloblastoma genome-wide methylation and expression profile analysis GSE85218; primary ependymoma Affymetrix chip array analysis GSE27279. All CAR-T-cell constructs used within the study are previously published.


