Abstract
Protein and peptide prenylation is an essential biological process involved in many signal transduction pathways. Hence, it plays a critical role in establishing many major human ailments. including Alzheimer’s disease, amyotrophic lateral sclerosis (ALS), malaria, and Ras related cancers. Yeast mating pheromone a-factor is a small dodecameric peptide that undergoes prenylation and subsequent processing in a manner identical to larger proteins. Due to its small size in addition to its well characterized behavior in yeast, a-factor is an attractive model system to study the prenylation pathway. Traditionally, chemical synthesis and characterization of a-factor has been challenging, which has limited its use in prenylation studies. In this chapter, a robust method for the synthesis of a-factor is presented along with a description of the characterization of the peptide using MALDI and NMR. Finally, complete assignments of resonances from the isoprenoid moiety from COSY, TOCSY, HSQC, and long-range HMBC NMR spectra are presented. This methodology should be useful for the synthesis and characterization of other mature prenylated peptides and proteins.
1. Introduction
Protein and peptide prenylation is an essential biological process involved in many signal transduction pathways (Kassai & Fukada, 2011). It involves the covalent attachment of an isoprenoid moiety to the cysteine residue of a C-terminal CaaX box sequence via a thioester linkage (Casey & Seabra, 1996). The attached isoprenoid unit can be either a 15-carbon farnesyl group or a 20-carbon geranylgeranyl group, and facilitates anchoring in the lipid membrane (Kassai & Fukada, 2011). Prenylated proteins and changes in the levels thereof are at the heart of many significant human ailments including malaria (Chakrabarti et al., 2002; Suazo, Schaber, Palsuledesai, Odom John, & Distefano, 2016), Alzheimer’s disease (Eckert et al., 2009), amyotrophic lateral sclerosis (ALS) (Li et al., 2016), as well as many different cancers (Ochocki & Distefano, 2013). One noteworthy lipidated protein is the oncogenic Ras protein, which is involved in more than 30% of all human cancers. As such, understanding and inhibiting the prenylation pathway has been a prime research target (Ochocki & Distefano, 2013). The prenylation of the Ras protein (as well as other prenylated proteins) with an isoprenoid group typically involves a three-step pathway and three distinct enzymatic activities. It begins in the cytosol where protein farnesyltransferase (PFTase) recognizes the CaaX sequence and attaches a farnesyl group to the cysteine’s thiol. This leads to anchoring in the lipid bilayer of the endoplasmic reticulum, where a membrane-attached protease proteolytically cleaves off the “aaX” sequence. Finally, the cysteine’s newly exposed C-terminal carboxylate becomes methylated by a membrane-bound carboxymethyl transferase to yield the final fully modified protein (Diaz-Rodriguez & Distefano, 2017)
Significant strides in understanding the prenylation pathway have emerged as a result of studying the S. cerevisiae mating pheromone a-factor (Sinensky, 2000). a-Factor is a hydrophobic dodecapeptide that is processed through the prenylation pathway (Caldwell, Naider, & Becker, 1995). The small size of a-factor makes it an attractive system to probe various aspects of the prenylation pathway. However, availability of a-factor has traditionally been limited due to its significant hydrophobicity as well as having an esterified C-terminus, which complicates its synthesis using standard Fmoc based solid phase peptide synthesis (SPPS). Earlier strategies for a-factor synthesis involved solution state fragment condensation or HF based SPPS methods (Diaz-Rodriguez & Distefano, 2017). Additionally, while in Vitro enzymatic farnesylation of CaaX substrates has been described previously (Hosokawa et al., 2007; Palsuledesai et al., 2016; Rowell, Kowalczyk, Lewis, & Garcia, 1997), we were not able to find evidence of such a reaction applied to a-factor, likely due to the hydrophobic nature of the peptides. Our group has develop more streamlined methods for the synthesis of a-factor, first using hydrazine-containing resin followed by oxidative resin cleavage (Mullen et al., 2011), and then more recently by side-chain anchoring to trityl chloride resin (Diaz-Rodriguez, Ganusova, Rappe, Becker, & Distefano, 2015; Diaz-Rodriguez, Mullen, Ganusova, Becker, & Distefano, 2012). The later method showed greater versatility and marked increases in yield with minimal epimerization observed after prolonged exposure to basic conditions mimicking extended rounds of SPPS coupling deprotection, and hence that procedure is described here. In brief, Fmoc-Cys-OMe is synthesized and coupled to a trityl-chloride resin via its thiol side-chain. The peptide is next extended via standard Fmoc chemistry and is then cleaved from resin and side-chain-deprotected using acidic conditions. The resulting peptide is subsequently purified and farnesylated in solution, followed by HPLC purification to homogeneity. This methodology has been employed to synthesize a-factor analogs and incorporate farnesylated peptides with C-terminal methyl esters into whole proteins using native chemical ligation (Zhang et al., 2017)
Once the final peptide is obtained and purified, it can be further analyzed using mass spectrometry and NMR. Here, MALDI was used for mass spectrometric analysis, as it resulted in better ionization of the peptide and simpler spectra relative to ESI. In fact, MALDI typically produces singly charged species and more predictable adducts (Nadler et al., 2017). Next, NMR was used to study the chemical structure of a-factor at the atomic level. Previous NMR studies showed that a-factor adopts a predominantly disordered conformation in DMSO, which is largely unaffected by farnesylation (Gounarides, Broido, Xue, Becker, & Naider, 1991). Therefore, the NMR experiments presented here focus on the characterization of the a-factor peptide using J coupling experiments to validate the chemical structure of a-factor and its analogues. (Diaz-Rodriguez & Distefano, 2017; Diaz-Rodriguez et al., 2012; Vervacke et al., 2014). The experiments and the methods described here can be used in structural studies of other prenylated peptides of biological importance.
2. Synthesis of a-factor
Fmoc-Cys-OMe synthesis:
The first step in the synthesis of a-factor is to obtain Fmoc protected cysteine with a free side-chain thiol and C-terminal methyl ester. This can be achieved through an acid catalyzed reaction of commercially available Fmoc-l-Cys hydrate with methanol, as outlined in scheme 1. This reaction has also been employed to produce other alkyl esters of a-factor (Diaz-Rodriguez et al., 2015).
Reaction Scheme 1.

Synthesis of Fmoc-L-CysOMe
2.2.1. Scheme 1. Synthesis of Fmoc-L-CysOMeEquipment
TLC plates
Shortwave UV light
Standard synthesis labware
Rotary evaporator
2.1.2. Reagents
Fmoc-l-cysteine hydrate
Reagent grade methanol
Concentrated hydrochloric acid
Acetone
50:50 Hexanes/Ethyl Acetate
2.1.3. Procedure
Dissolve 361 mg (1.00 mmol) Fmoc-l-cysteine hydrate in 10.0 mL of methanol. The solution should be clear and colorless. Add 6 – 10 drops of concentrated HCl and stir the solution overnight with a magnetic stir bar.
Within 24 hours, a white paste suspended in a slurry should be observed. Gently shake to homogenize the solution then draw one drop, dilute in acetone then spot on a TLC plate and develop using 50:50 Hexane/Ethyl Acetate. Check for complete conversion of the starting materials under shortwave UV light. The Rf of Fmoc-l-CysOMe is 0.9, while the corresponding value for Fmoc-l-Cys•H2O is 0.3.
Proceed to the next step regardless of the extent of completion of the reaction. Dilute the solution with acetone until a clear, colorless solution is observed. Transfer to a pre-weighed round-bottom flask, then remove solvent in vacuo using a rotary evaporator. The heating bath temperature should not exceed 30 °C, since at elevated temperatures the product can phase separate as an oil instead of a white precipitate powder. Once the solvent is evaporated, remove from the heat and put the precipitate under vacuum for several hours to remove any residual solvent.
If the initial reaction did not proceed to completion, repeat steps 1 and 2 to convert any remaining starting material; otherwise proceed to step 5.
Confirm the identity of the product by dissolving a small amount (~10 mg) in 0.7 mL CDCl3 and then a 1H 1D NMR spectrum. Full assignment of the molecule resonances is shown in Table 1. Additionally, completion of the reaction can be further monitored by comparing the 1H spectrum of the product to that of the starting material; no starting material should be observed. Furthermore, if any remaining solvent peaks are observed in the 1H NMR spectrum, the flask should be subjected to vacuum for a few more hours to completely remove it.
Weigh the flask after no solvent remains and calculate the final yield. A 99% yield is typical for this protocol.
Table 1.
1H NMR assignment of Fmoc-L-CysOMe in CDCl3 was carried out with TMS as an internal standard
| 1H Chemical Shift δ (ppm) | Integration | Multiplicity | JH-H (Hz) | Assignment (from scheme 1) |
|---|---|---|---|---|
| 1.39 | 1 | t | 8.65 | H4 |
| 3.03 | 2 | d | 7.87 | H3 |
| 3.83 | 3 | s | - | H1 |
| 4.26 | 1 | t | 6.85 | H6 |
| 4.44 | 2 | d | 6.30 | H5 |
| 4.67 | 1 | t | 3.71 | H2 |
| 5.71 | 1 | b | - | NH |
| 7.35 | 2 | t | 7.20 | H8 |
| 7.44 | 2 | t | 7.48 | H9 |
| 7.64 | 2 | d | 7.48 | H7 |
| 7.8 | 2 | d | 7.6 | H10 |
2.1.4. Notes
The final product should be stored at 2–8 °C under nitrogen prior to use.
The reaction can be scaled up or down as needed. It was successfully carried out under the same conditions on a 0.1, 0.2, 0.4, 4, and 10 mmol scales. 15 drops HCl were used when carried out on 4 and 10 mmol scales.
2.2. Loading of trityl chloride resin:
Once Fmoc-l-CysOMe is obtained, it can be side-chain anchored to trityl chloride resin as shown in scheme 2. Trityl chloride resin is chosen for two reasons; it offers high yields (Diaz-Rodriguez et al., 2015), and little cysteine epimerization is observed during loading (Barany, Han, Hargittai, Liu, & Varkey, 2003).
Scheme 2.
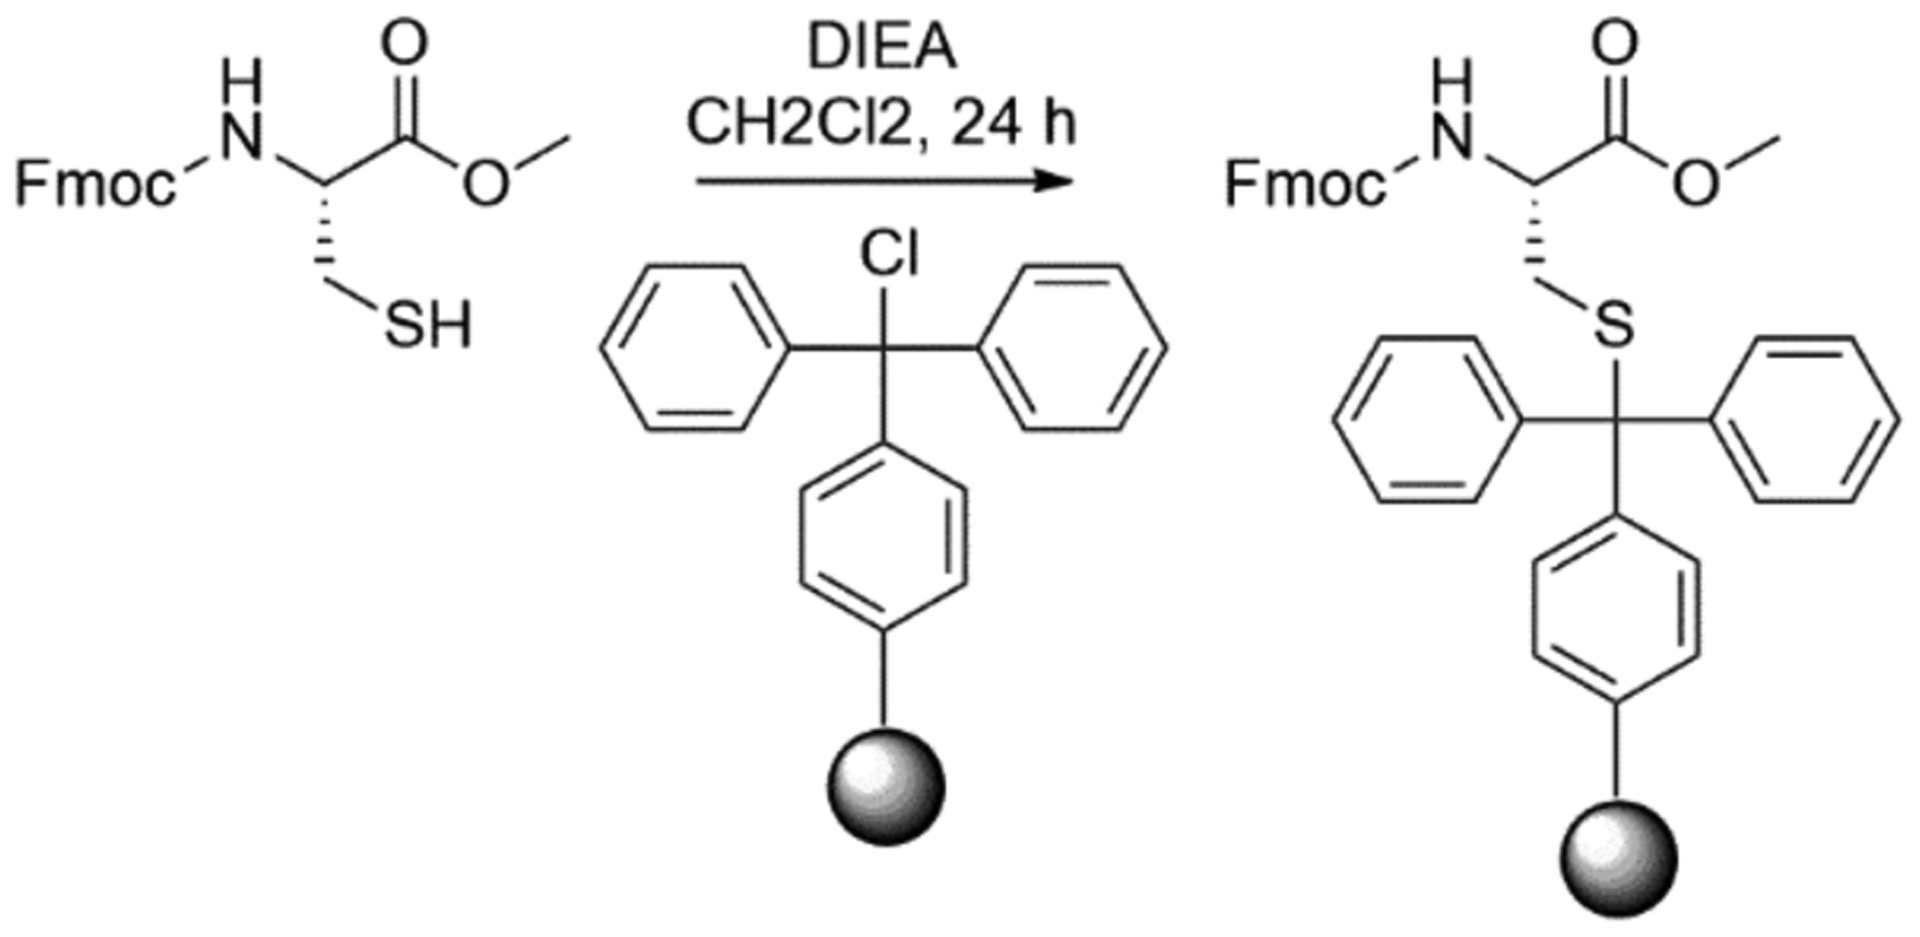
Loading of Fmoc-Cys-OCH3 onto trityl chloride resin
2.2.1. Equipment
Rotator
Fritted polypropylene syringe
Syringe stopcock
2.2.2. Reagents
Trityl chloride resin
Diisopropylethylamine
Synthesized Fmoc-l-CysOMe
2.2.3. Procedure
Load 0.2 mmol resin into fritted syringe, then wash with 5 mL DMF × 3 times, followed by a wash with 5 mL CH2Cl2 × 3 times. For the CH2Cl2 washes, place syringe on rotator for 5 min each time to swell it. Drain the resin after each wash.
Dissolve 286 mg (4.00 molar equivalents) of Fmoc-l-CysOMe in 3 mL CH2Cl2 and add 140 μL (4.00 molar equivalents) of diisopropylethylamine to the solution. Add this solution to the resin and leave overnight on rotating mixer.
The next day, add 200 μL methanol to the syringe containing the reaction, and place on the rotating mixer for 15 min. This will cap any unreacted sites, resulting in fewer side reactions. Do not leave the reaction mixture on the rotating mixer for extended periods as the methanol can displace the Fmoc-l-CysOMe.
Drain the solution and then wash with 5 mL DMF × 3 times followed by 5 mL CH2Cl2 × 3 times. Dry resin by pulling vacuum through the syringe for at least one hour. Store the resin at 2–8 °C under nitrogen.
2.2.4. Notes
Amount of resin used will vary from batch to batch depending on the resin substitution.
Unmodified trityl chloride resin should be stored at 2–8 °C under nitrogen. Failure to do so can lead to hydrolysis, which will lead to lower coupling efficiencies. If hydrolysis occurs, the resin can be regenerated using HCl, acetyl chloride, or SOCl2 (García-Martín, Bayo, Cruz, Bohling, & Albericio, 2006)
Loadings of Fmoc-l-CysOMe in the range of 0.7 – 1.2 mmol/g are common. While it is possible to obtain even higher loadings (up to 1.8 mmol/g) with extended coupling times, this procedure is undesired as it leads to decreased yields during subsequent peptide synthesis and side-product formation due to aggregation of the peptide on resin surface.
2.3. Quantification of loading using Fmoc-Assay:
Once the resin loaded with Fmoc-Cys-OMe is obtained, it is important to quantify the loading efficiency to be able to proceed with SPPS, as it is the basis for all subsequent calculations such as amount of resin to use as well as amount of amino acids and coupling reagent. The most prevalent method relies on a cuvette-based quantitative Fmoc assay where the Fmoc group on the loaded amino acid is deprotected using piperidine, and the resulting pyridine-Fmoc adduct is quantified using a known molar absorptivity constant (ε) value (Chan & White, 2000; Eissler et al., 2017). This method, however, was found to give inconsistent results. To address that issue, a more accurate standard-curve-based assay was developed and used here.
2.3.1. Equipment
UV/vis plate reader
Standard 96-well plate
Hamilton syringes
25 mL Volumetric flasks
20 mL Glass vials
Eppendorf tubes
2.3.2. Reagents
Fmoc-OSu
Absolute Ethanol
20% piperidine in DMF
2.3.3. Procedure
In triplicate, weigh ~10 mg resin aliquots in glass vials and record the exact weight.
Using a Hamilton syringe, add 0.5 mL 20% piperidine in DMF to each vial and incubate for 30 min to deprotect Fmoc groups from Fmoc-l-CysOMe on resin. Make sure most of the resin beads are at the bottom of the vial and in contact with the solution. In the meantime, prepare a stock of 1 mM Fmoc-OSu in ethanol, then dilute it in Eppendorf tubes or glass vials as described in Table 2 to make a series of standards and a standard blank. Also make a sample blank consisting of 0.5 mL 20% piperidine in DMF diluted to 25 mL in ethanol using a volumetric flask.
Use ethanol to dilute the deprotected samples and transfer them to 25 mL volumetric flasks. Adjust the volume to 25 mL with more ethanol.
In triplicate, transfer 150 μL of each sample, sample blank, and standard into a 96-well plate. Read absorbance at 301 nm.
Construct a standard curve by first subtracting standard H (standard blank) from all other standard absorbance values, then plotting average absorbance measurements against Fmoc-OSu concertation.
Subtract the average sample blank measurement from each average sample measurement and then calculate the Fmoc concertation using the best line fit to the standard.
- Calculate loading for each sample according the following equation before averaging:
Table 2.
Dilutions of Fmoc-OSu in ethanol used for Fmoc quantitative assay
| Standard | Amount of standard to add (μL) | Source | Amount of ethanol to add (μL) | Final Concentration (mM) | Absorbance range |
|---|---|---|---|---|---|
| A | 300 | 1 mM Stock | 0 | 1 | 1.820 – 1.875 |
| B | 200 | 1 mM Stock | 100 | 0.75 | 1.300 – 1.391 |
| C | 300 | 1 mM Stock | 300 | 0.5 | 0.999 – 1.029 |
| D | 300 | C | 300 | 0.25 | 0.626 – 0.689 |
| E | 300 | D | 300 | 0.125 | 0.443 – 0.468 |
| F | 300 | E | 300 | 0.063 | 0.344 – 0.353 |
| G | 300 | F | 300 | 0.031 | 0.276 – 0.295 |
| H | 0 | - | 300 | 0 | 0.204 – 0.220 |
2.3.4. Notes
While it is possible to make a larger amount of standard stock and store it for later use, more reproducible results are obtained if this standard is made freshly before use.
2.4. SPPS of a-factor precursor:
With the loaded trityl resin in hand, the rest of the peptide (YIIKGVFWDPAC-OMe) can be extended using standard Fmoc-chemistry as seen in scheme 3. A potential consideration in this process is epimerization of the C-terminal cysteine due to repeated exposure to piperidine during the synthesis (Han, Albericio, & Barany, 1997). However, using the side-chain anchoring methodology described here, negligible amount of epimerization was observed (Diaz-Rodriguez et al., 2015). The synthesis was carried out using an automated peptide synthesizer (PS3, Protein Technologies Inc., Memphis, TN). Sufficiently high yields were obtained using the conditions described (>95% for crude peptide). Based on these results, different types of automated synthesizers or manual synthesis should also give similar results.
Scheme 3.
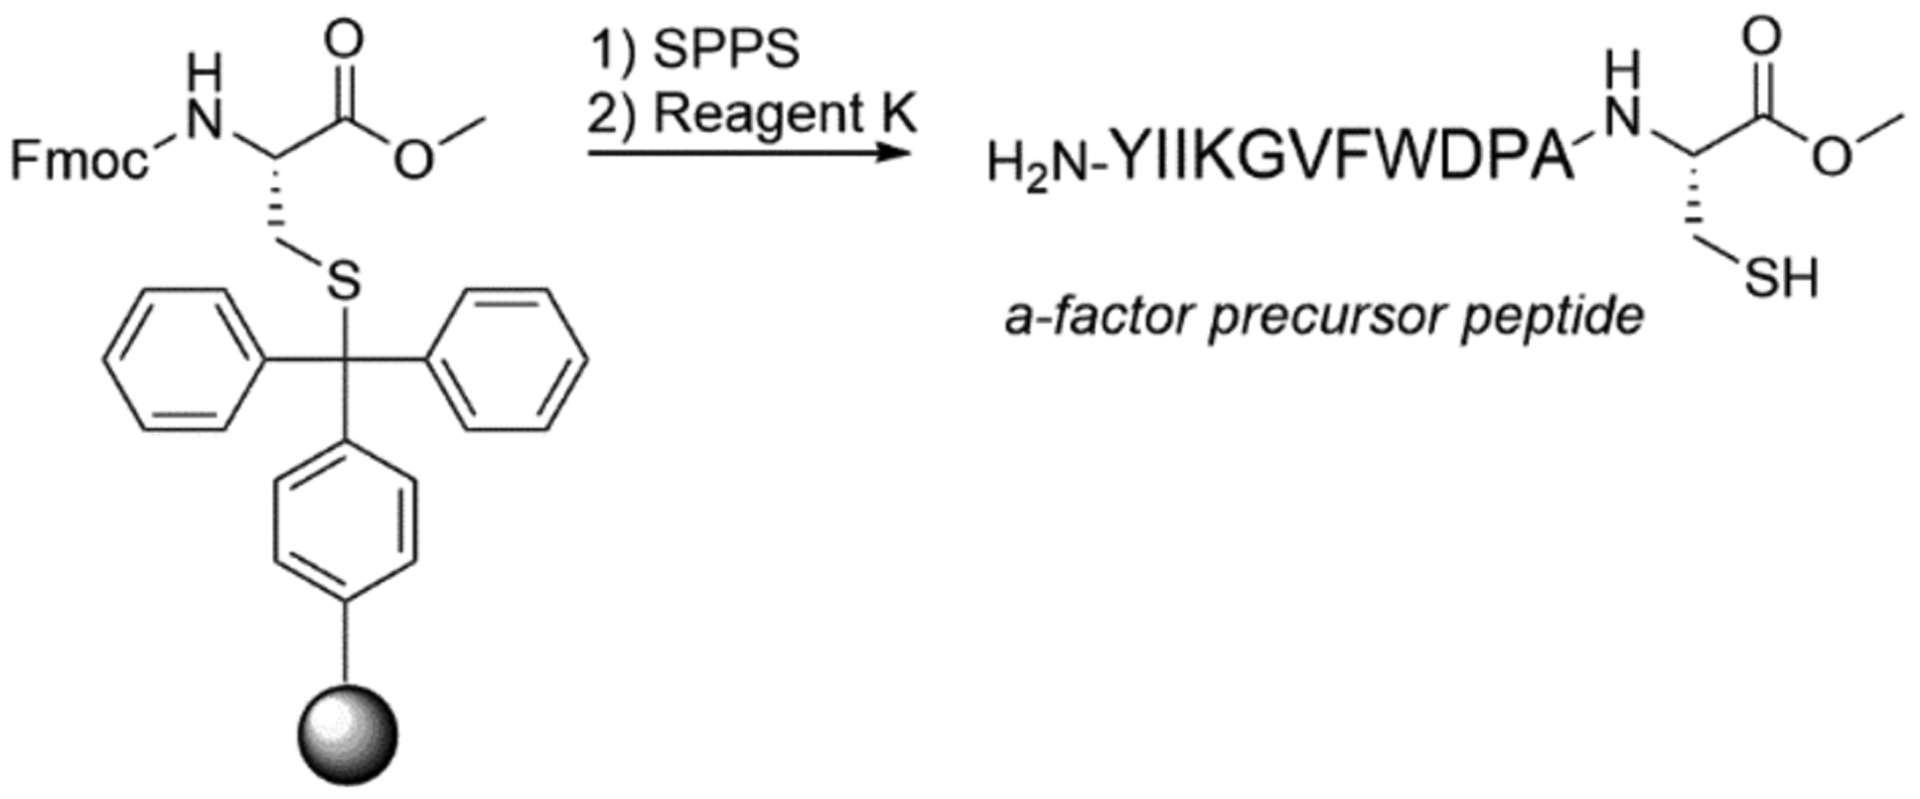
Synthesis of a-factor precursor peptide via standard solid phase peptide synthesis starting with Fmoc-Cys-OCH3 anchored to trityl resin.
2.4.1. Equipment
Peptide synthesizer
Fritted propylene syringe and syringe stopcock
Rotating mixer
Centrifuge
2.4.2. Reagents
Fmoc-l-CysOMe loaded trityl resin
Coupling agent. O-(1H-6-Chlorobenzotriazole-1-yl)-1,1,3,3-tetramethyluronium hexafluorophosphate (HCTU) was used
Standard Fmoc protected amino acids with acid labile side chain protecting groups
Activator base (20% N-methylmorpholine in DMF used here)
20% piperidine in DMF
DMF
Dry ice
Acetone
2.4.3. Procedure
Carry out synthesis on a 0.1 mmol scale. Swell the resin in DMF for 10 minutes. Extend the peptide using single couplings with 4.0 equivalents of activator and amino acids in activator base. Each coupling step should be allowed to proceed for at least 30 minutes. Deprotect amino acid side chains during the synthesis by treatment with 20% piperidine in DMF for 10 min twice. Repeat for the final deprotection. Formation of the free amine can then be observed using a ninhydrin test (Kaiser, Colescott, Bossinger, & Cook, 1970)
Once free amine formation is confirmed, wash resin with 5 mL DMF × 3 times, followed by CH2Cl2 × 3 times. Make 10 mL Reagent K (8.25 mL TFA, 500 mg phenol, 500 μL H2O, 500 μL Anisole, 250 μL 1,2 ethanedithiol) and bubble nitrogen through solution for 10 minutes to remove oxygen from it. Add to resin and place on rotary mixer for 2 hours to cleave peptide.
After 2 hours, fill two 50 mL falcon tubes with 30 mL diethyl ether each, then split the cleavage cocktail into both tubes. Wash resin with 5 more mL of TFA, then split into falcon tubes again. Dilute to the top with more ether, then cool tubes using acetone/dry ice bath. Spin down at 4000 RPM for 5 min to pellet peptide. Decant ether, refill tubes with fresh diethyl ether, and vortex tubes to resuspend pellet in solution. Once the pellet is resuspended, centrifuge and repeat the wash one more time for a total of three precipitation steps.
Use ~5 methanol to transfer peptide to pre-weighed glass vial, then dilute with equal amount H2O. Evaporate methanol and remaining ether using a gentle stream of nitrogen until ~5 mL of solution remains. This could take several hours. Flash freeze using liquid nitrogen and then place on a lyophilizer overnight.
The correct product can be confirmed using MALDI (section 3.1) after solubilization as described in section 2.5.3, step 6.
2.4.4. Notes
The synthesis was also performed using a microwave-assisted synthesizer (CEM Liberty/Discover microwave synthesizer). In this case double couplings were used. The coupling reagent was HBTU and the activator base was 35% v/v DIEA in NMM. The synthesis with the CEM microwave synthesizer gave similar results to the PS3 synthesizer. It is also worth mentioning that very little epimerization of the C-terminal cysteine residue was observed as determined by NMR integration (<5%).
Reagent K is extremely caustic, and so all handling should be done inside a well-ventilated fume hood. Appropriate safety precautions should be taken into consideration as well when handling of TFA, as it is highly corrosive.
It is possible to shorten step 4 in length by omitting the methanol transfer and lyophilizing the peptide directly in the falcon tubes after the last ether precipitation. This, however, could lead to inaccuracy when measuring the mass of the crude material. To avoid this, begin by pre-weighing the falcon tubes before step 3. After decanting the ether layer at the end of step 3, remove any remaining ether using a gentle stream of nitrogen applied for at least 30 minutes. Once the ether has evaporated completely, suspend the peptide in 5 mL H2O (solution will be cloudy), flash freeze and place the suspension on a lyophilizer.
Lyophilizing the peptide suspended in water as opposed to simply removing the solvent in vacuo or using N2 stream results in a powder rather than a residue, which helps with subsequent handling.
2.5. HPLC purification of unfarnesylated a-factor:
The crude a-factor precursor peptide has low solubility in aqueous solutions and many organic solvents. This can be due, in part, to adventitious disulfide bond formation. Additionally, the solubilized peptide tends to precipitate out remarkably fast, likely due to non-solubilized material acting as nucleation sites. A method has been developed here to solubilize the peptide completely and reduce any disulfide bonds using DTT. One issue that was encountered was that the peptide requires acidic conditions to dissolve, but DTT is more reactive for disulfide reduction under basic conditions. This issue was overcome by employing stepwise addition of organic solvents to a NaHCO3 buffered aqueous DTT solution with extended sonication in between, followed by the addition of a large excess of TFA.
2.5.1. Equipment
HPLC instrument
Semi-prep RP C-18 HPLC column (9.4 × 250 mm column used)
Analytical RP C-18 HPLC column (4.6 × 250 mm column used)
Sonicator
Lyophilizer
2.5.2. Reagents
HPLC grade water with 0.1% TFA (Buffer A)
HPLC grade CH3CN with 0.1% TFA (Buffer B)
HPLC grade water buffered to pH 8.0 with NaHCO3
HPLC grade CH3CN
TFA
HPLC grade methanol
0.5 M DTT aqueous solution
2.5.3. Procedure
Equilibrate the column with buffer A containing 1% buffer B. This should be done for at least 45 min to avoid that the peptide eluteing prematurely from the column due to the large amount of TFA utilized for its solubilization. If an analytical column is used, a flow rate of 1 mL/min is appropriate. For a Semi-prep column, it is advisable to use a flow rate of 3 mL/min.
To a 10 mg powder of crude peptide add 1 mL of HPLC grade water buffered to pH 8.0 with NaHCO3 and 30 μL 0.5 M DTT solution, then sonicate for 15 min
Add 1 mL HPLC grade CH3CN and sonicate for 15 min
Add 1 mL HPLC grade methanol and sonicate for 15 min
Add TFA until solution becomes clear. Anywhere from 0.1 to 1 mL can be expected depending on the amount of peptide used as well as the impurities present. Some particulates may still be floating in solution. The least amount of TFA required should be used for solubilization as it interferes with the purification where it will prevent the peptide from binding the column resin.
Centrifuge at 4000 RPM for 5 min. This should be done immediately, as a-factor can precipitate out of solution if particulates are present. If this occurs, an additional sonication step and more TFA can be used to resolubilize peptide. A small pellet may appear at the bottom.
Transfer the supernatant to a new falcon tube being careful not to disturb the pellet. Centrifuge again to ensure no particulates were transferred over. Dilute at least twofold with 50:50 buffer A/Buffer B solution. This is critical as the excess amount of TFA used can cause the peptide to elute prematurely.
Inject the desired amount into HPLC injection loop. For the analytical column, 20 μL peptide solution diluted to 100 μL in 50:50 buffer with a 200 μL injection loop gave the best results. For the semi-prep column, up to 4 mL of solution can be used with a 5 mL injection loop.
Run appropriate method. Figure 1 legend outlines the event sequences for analytical and semi-prep columns. One important consideration is the extended period at beginning of the run where buffer B remains constant at 1%. This is done to help prevent the peptide from eluting prematurely. If that occurs, the peptide typically elutes during this initial wash period and should be collected. The presence of peptide can then be confirmed using MALDI (section 3.1).
Unfarnesylated a-factor elutes between 60 to 80 % buffer B, depending on the size of the column, with larger columns having lower retention times. Because of this, it is recommended to collect all fractions in that region and keep the ones exhibiting the correct m/z ratio (as measured by MALDI-MS). HPLC chromatograms of the crude peptide and purified material are shown in Figures 1A and 1B, respectively.
Pool together the fractions displaying the correct m/z ratio based on desired purity as determined by MALDI or analytical HPLC integration (>90% required for NMR analysis, and >70% is required for farnesylation reaction). For pure fractions, proceed to step 12. For impure fractions, proceed to step 13.
Transfer pooled pure fractions to a pre-weighed glass vial, and remove excess organic solvent using a stream of N2. This step can take several hours. Once most of organic solvent is removed, the solution should be cloudy white in appearance. Flash freeze in liquid N2 and then place on a lyophilizer overnight (two days if NMR experiments are to be run on sample to maximize water removal). Weigh the vial at the end to obtain final mass of the purified material. The peptide should appear as a white powder. 6–8 mg of peptide can be obtained at the end depending on purity of crude peptide. Final purified yields in the 60–80% range can be expected.
If the volume of impure fractions is sufficiently small, it can be directly reinjected into the HPLC. Otherwise, remove the solvent using a gentle stream of N2 and lyophilize as described in step 12; then dissolve the resulting powder in 1:1 Buffer A/ Buffer B and reinject into the HPLC.
Figure 1.
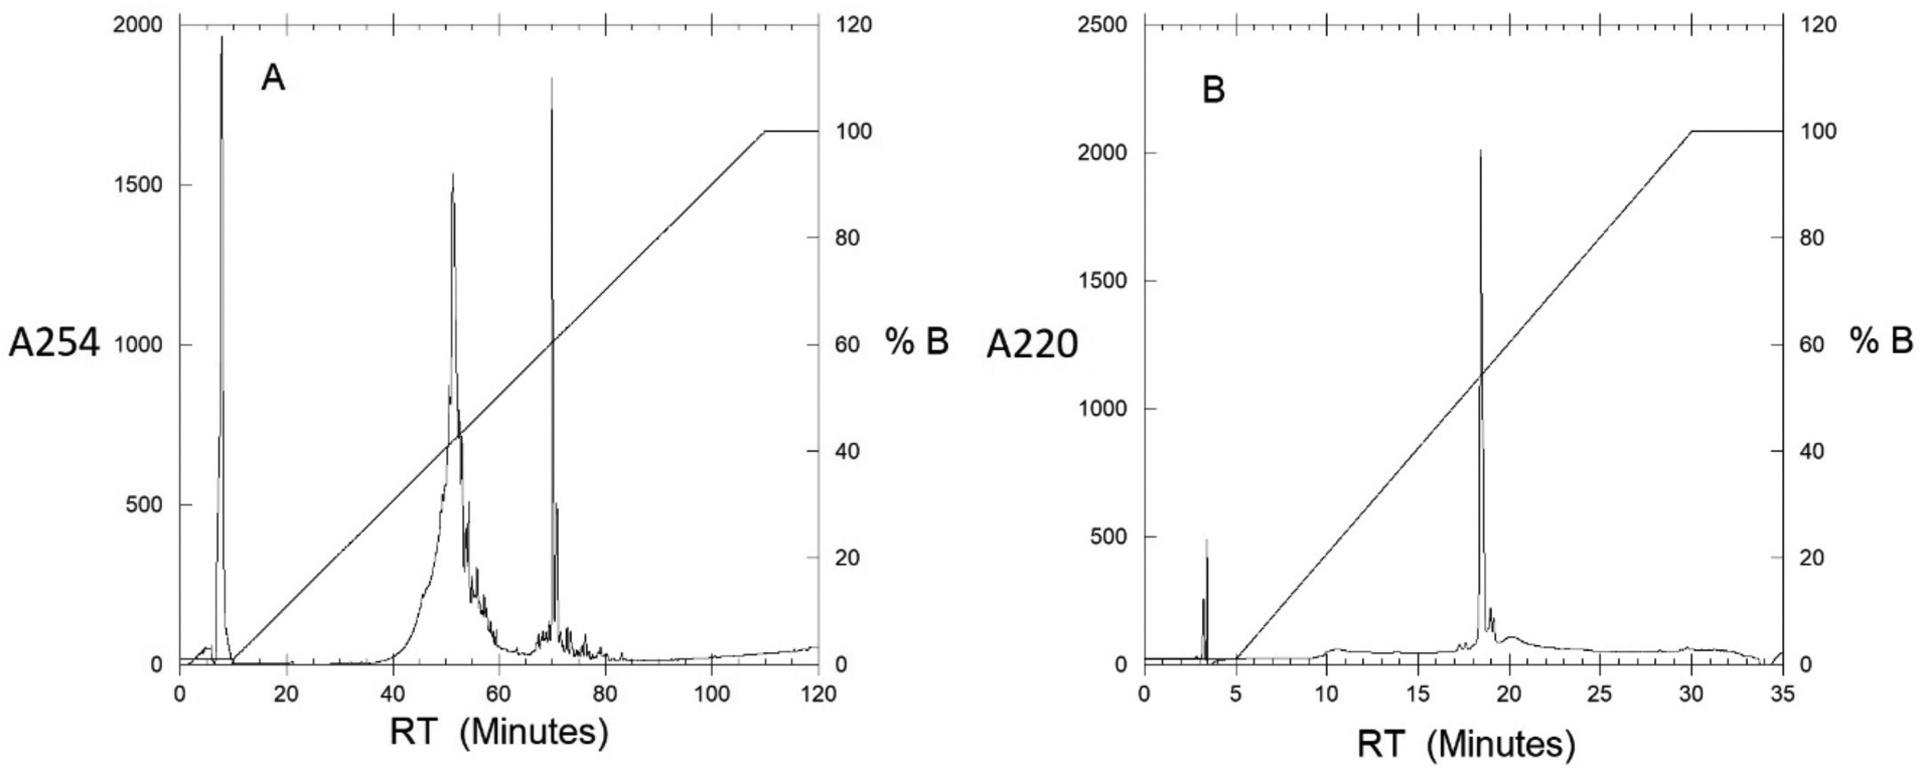
A: Crude semi-preparative chromatogram of a factor precursor peptide. The absorbance was monitored at 254 nm to observe aromatic groups and a flow rate of 3 mL/min. Gradient increased from 1 to 100 % buffer B over 100 minutes with 10-minute delay at the beginning of method. Fractions were collected between 40 – 60 min at 1 min intervals. B: Analytical chromatogram of purified a-factor precursor. The absorbance was monitored at 220 nm to show all contaminants and a flow rate of 1 mL/min. Gradient increased from 1 to 100 % buffer B over 25 minutes with 5-minute delay at the beginning of method.
2.5.4. Notes
The purified peptide should have improved solubility (relative to the crude peptide) and can be dissolved in 1:1 Buffer A/Buffer B, DMSO, or 4:2:1 DMF/1-BuOH/0.1% aqueous TFA in a concentration of up to 5 mg/mL.
Once the peptide is solubilized, it is possible to accurately quantify its amount using the Ellman’s assay for free thiols using previously published procedure (Riddles, L. Blakeley, & Zerner, 1983).
Multiple rounds of purification may be required to obtain highly pure peptide. This can be determined via MALDI analysis as well as analytical HPLC.
The peptide should be stored at 2–8 °C for short periods of time (1–2 weeks), or at −20 °C for extended periods.
For semi-prep HPLC, monitoring at 254 nm wavelength is recommended, as aromatic groups absorb at this wavelength. This simplifies the spectrum and prevent over-saturating the detector.
For analytical HPLC, monitoring at 220 nm wavelength is recommenced, as amide bonds absorbs in this region of the spectrum, hence possible contaminants will be observed.
Analytical chromatograms of HPLC fractions can be obtained by simply injecting 100 μL directly onto an analytical column and running the analytical method.
2.6. Farnesylation of a-factor:
This step is performed after the peptide synthesis and resin cleavage, since the highly acidic conditions for global peptide deprotection and cleavage cause isomerization and degradation of the isoprenoid group (Diaz-Rodriguez & Distefano, 2017). The reaction employed here uses zinc acetate dihydride to facilitate the nucleophilic reaction between the cysteinyl thiol moiety and the alkyl halide of trans,trans-farnesyl bromide (scheme 4). To overcome solubility problems and their effects on alkylation rate, a mixture of several different solvents was used (Diaz-Rodriguez et al., 2015). Those conditions along with the use of partially purified a-factor precursor allowed the reaction to proceed efficiently.
Scheme 4.
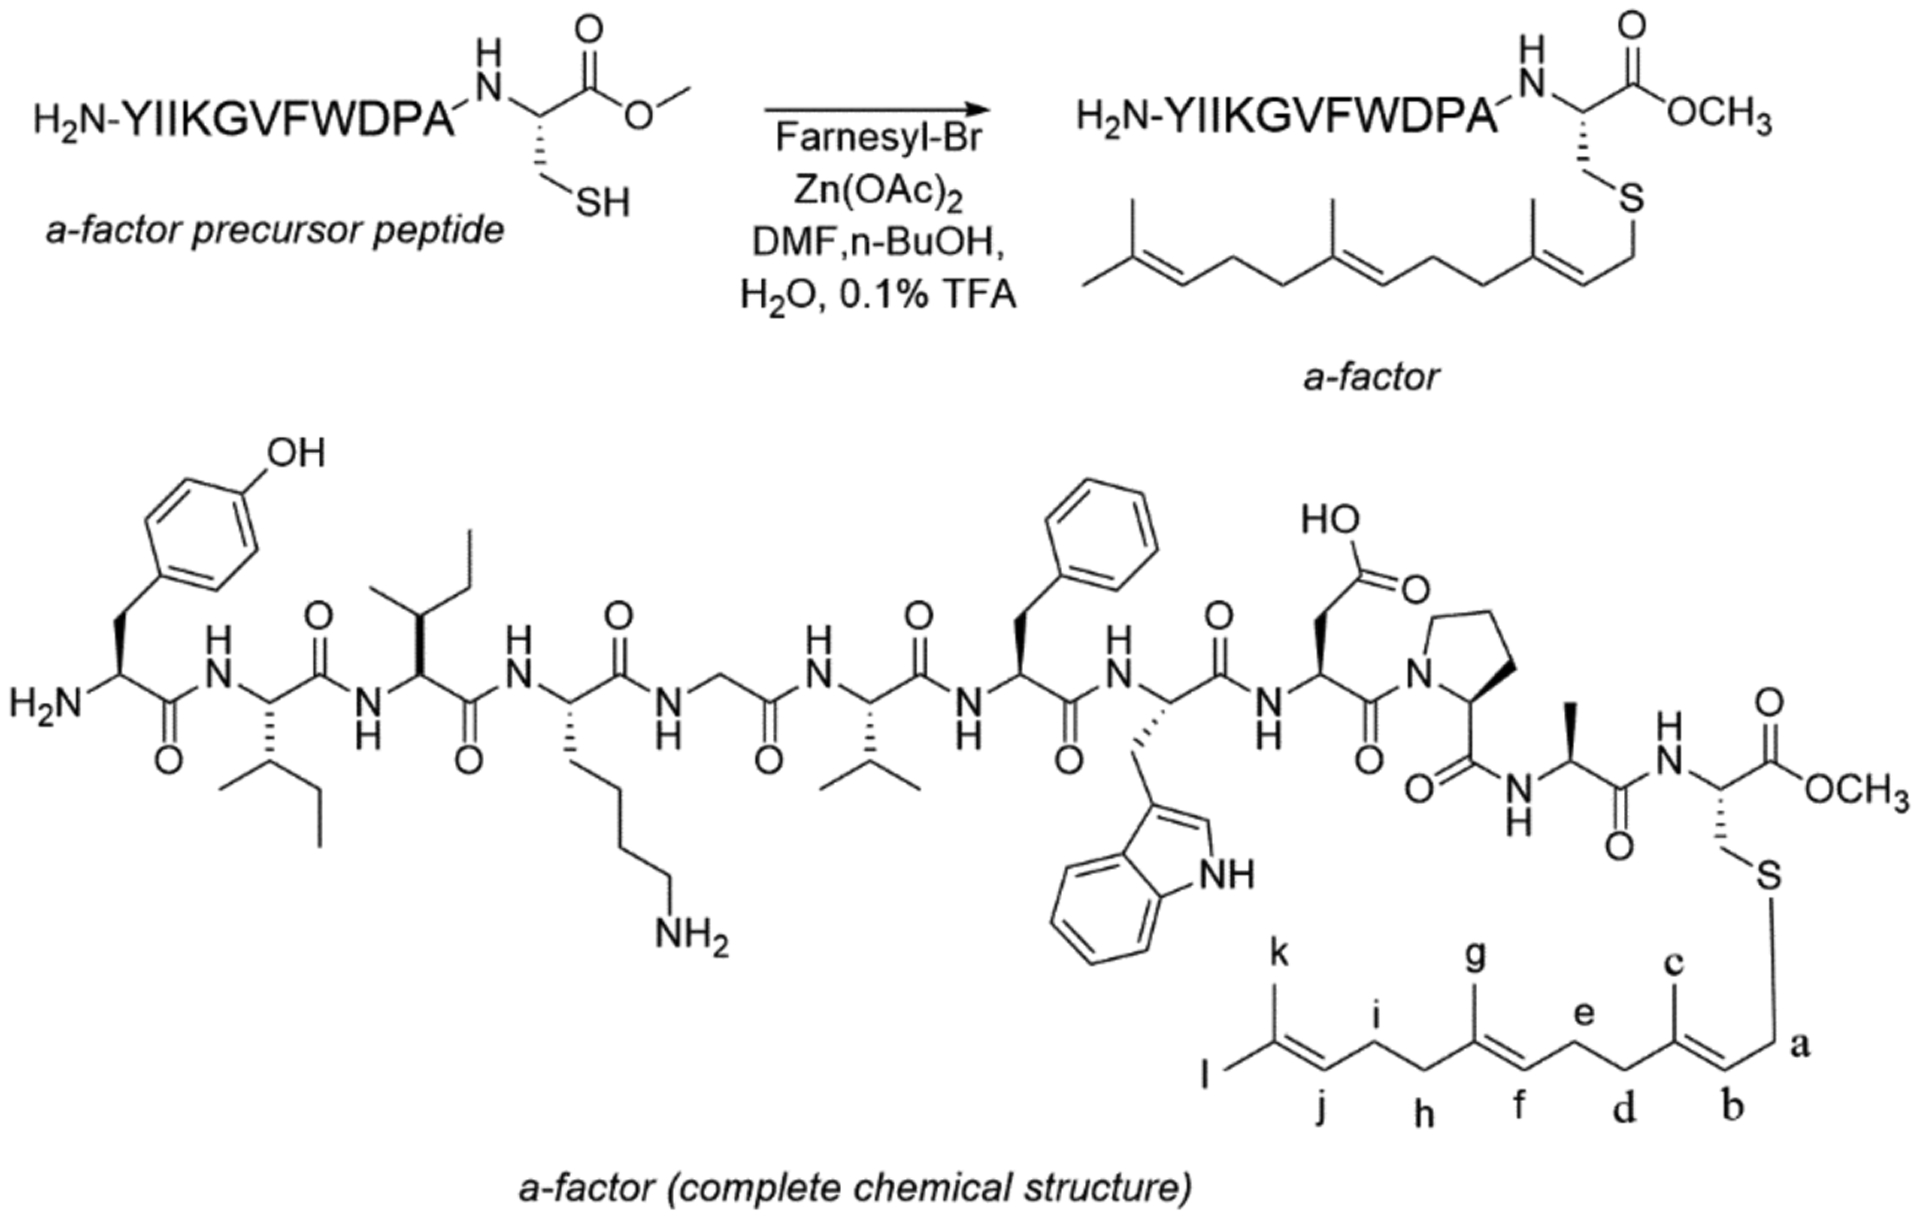
Farnesylation of a factor precursor peptide to yield a-factor.
2.6.1. Equipment
Standard synthetic chemistry labware
2.6.2. Reagents
Purified or partially purified a-factor precursor
trans,trans-farnesyl bromide
Zn(OAc)2•H2O
Degassed solvent blend: 4:2:1 DMF/1-BuOH/0.1% aqueous TFA
2.6.3. Procedure
Dissolve 10 mg (7.0 μmol) peptide in 3–10 mL of solvent blend. The amount required will vary depending on amount of impurities present. The smallest amount possible should be used to simplify the subsequent purification steps. The starting peptide needs to be at least partially purified (>70%), as crude peptide will likely have solubility issues.
Add 6.5 mg (5.0 equivalents) of Zn(OAc)2•H2O in 0.5 mL H2O containing 0.1% TFA to the solution.
Dilute 9.5 μL (5.0) equivalents of farnesyl bromide in 0.5 mL of DMF, then add it dropwise to the above solution while stirring. This step is critical to ensure that the farnesyl bromide remains soluble. Watch closely for any persisting undissolved materials. If observed, add more of the solvent blend as needed in 0.1 mL increments.
Stir under nitrogen for 2 to 4 hours and then check for the reaction completion using MALDI MS or analytical HPLC. The reaction time may be extended to obtain maximal conversion. Once the reaction is complete, it can be purified using HPLC.
2.6.4. Notes
Farnesyl bromide is air and moisture sensitive, so its exposure to those elements should be limited as much as possible. Unused material should be stored under nitrogen at 2–8 °C.
2.7. HPLC purification of farnesylated a-factor:.
In this step, care must be taken to dilute the solution containing the crude peptide appropriately to minimize the potential for premature elution. This issue is similar to that noted in step 2.5. To avoid this, dilute the crude reaction mixture, equilibrate the column with buffer A, and add an extended hold period in the HPLC method with buffer A to prevent premature elution.
2.8. Equipment
HPLC instrument
Semi-prep RP C-18 HPLC column (9.4 × 250 mm column used)
Analytical RP C-18 HPLC column (4.6 × 250 mm column used)
Sonicator
lyophilizer
2.8.2. Reagents
HPLC grade H2O with 0.1% TFA (Buffer A)
HPLC grade CH3CN with 0.1% TFA (Buffer B)
HPLC grade CH3OH
2.8.3. Procedure
Using a Falcon tube, dilute the crude reaction mixture at least twofold with a 50:50 Buffer A/B mixture. This is done to prevent premature elution due to the large amount of DMF used in the farnesylation reaction.
Centrifuge at 4000 RPM for 5 min to remove any particulates in the reaction mixture.
Inject onto the HPLC column and run appropriate method. See section 2.5.3 steps 8 and 9.
The farnesylated peptide typically elutes in the range of 75–85% buffer B. Collect all peaks in this region and confirm the presence of the desired product by MALDI MS. HPLC chromatograms of the crude peptide and purified material are shown in Figures 2A and 2B, respectively.
After pooling the appropriate fractions (>90% purity as determined by MALDI or analytical HPLC integration), evaporate the organic solvent using a stream of N2. The resulting solution should be cloudy when all the solvent is removed. This typically requires several hours. Once completely removed, flash freeze using liquid N2 and then lyophilize for at least two days to remove all water for subsequent NMR analysis.
Figure 2.
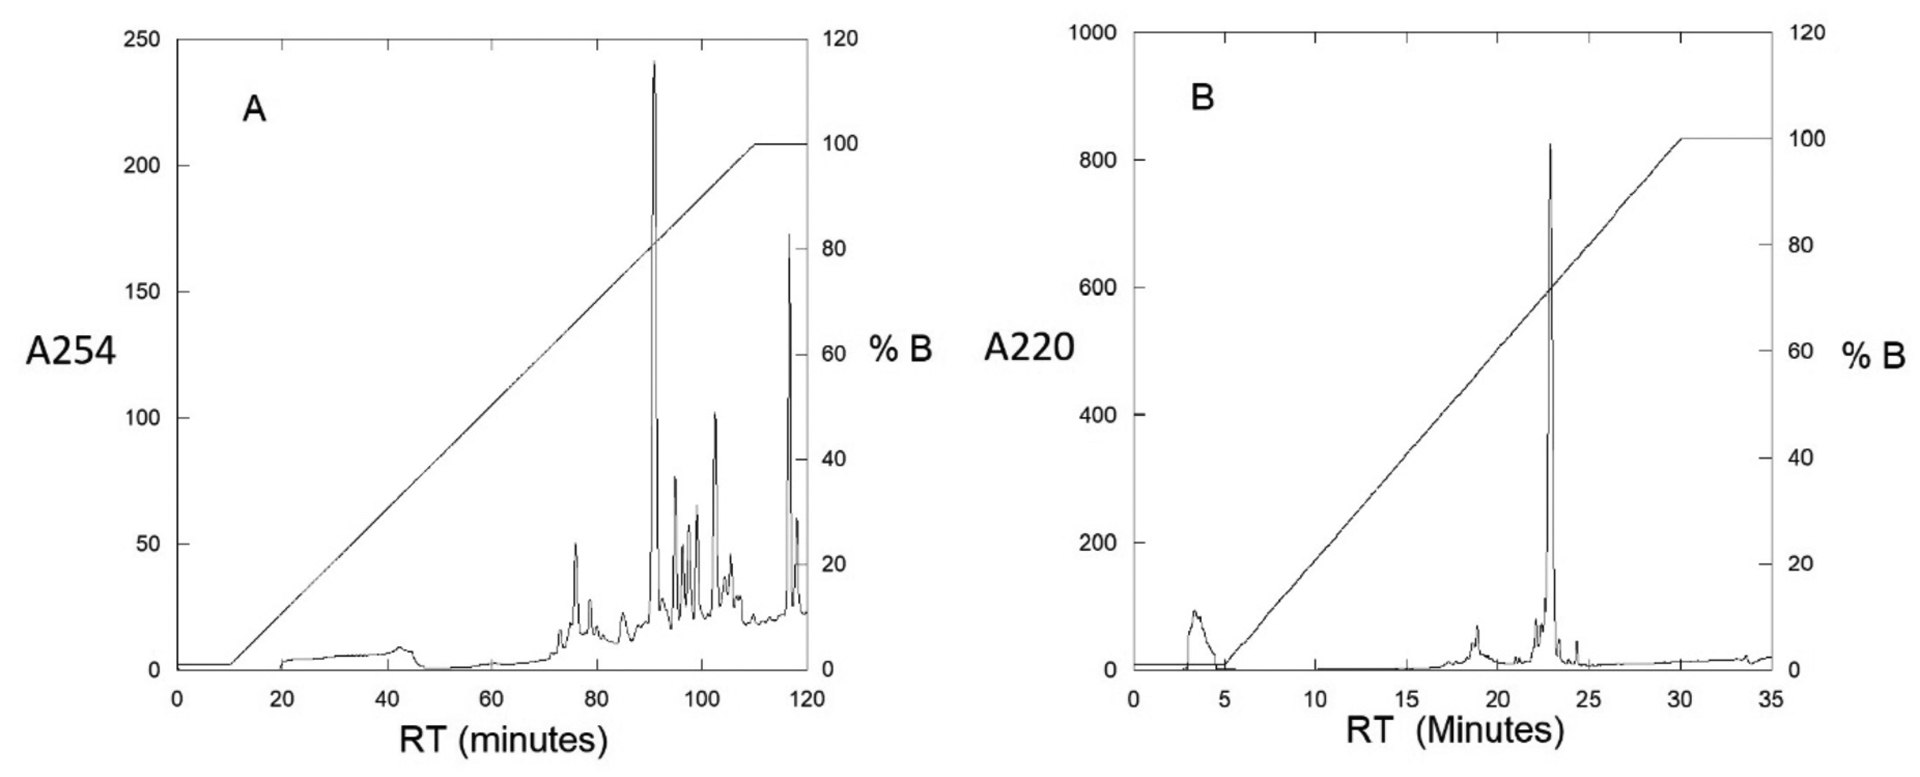
A: Crude semi-preparative chromatogram of the farnesylation reaction. The absorbance was monitored at 254 nm to observe aromatic groups with a flow rate of 2 mL/min. Fractions were collected between 80 −100 min at 1 min intervals. B, Analytical chromatogram of purified a-factor precursor. The absorbance was monitored at 220 nm to show all contaminants with a flow rate of 1 mL/min.
2.8.4. Notes
More than one round of chromatography may be required to obtain highly pure a-factor since some impurities elute with similar retention times. If that is observed by MALDI MS, partially pure fractions can be combined, lyophilized, and re-chromatographed. Some a-factor fails to adsorb to the column and elutes in the 1% buffer B hold phase due to the DMF used for the farnesylation reaction. If a significant amount is observed (via MALDI MS analysis), it can also be recombined with other impure fractions and then re-purified.
3. Analysis of a-factor
3.1. MALDI MS analysis:
MALDI MS allows the presence of the desired compound to be determined in a reliable manner. MALDI was chosen over ESI for two reasons; first, it generally affords mono-charged species, which simplifies the analysis, especially when disulfide bonds were present (Nadler et al., 2017). Second, MALDI MS tends to give more reproducible ionization of a-factor (compared with ESI).
3.1.1. Equipment
MALDI Instrument (AB SCIEX MALDI-TOF 5800 was used)
MALDI MS plate
Microcentrifuge
Micropipettes
3.1.2. Reagents
50:50 buffer A/ buffer B mixture
α-Cyano-4-hydroxycinnamic acid
3.1.3. Procedure
In a microcentrifuge tube, thoroughly mix a spatula-full of matrix in 1 mL of 50:50 buffer A/buffer B mixture, then centrifuge for 3 min at maximum speed. This will yield a saturated solution of matrix.
If DMF is present in the peptide sample, dilute it five-fold in 50:50 buffer A/buffer B mixture.
Spot 0.5 μL of the matrix solution on the MALDI MS plate, followed by 0.5 μL of sample. Mix by pipetting up and down a few times. Add another 0.5 μL of matrix solution and pipette up and down repeatedly until small crystals are observed. Leave for a few minutes to dry. If DMF was present in solution a small drop of liquid (instead of crystals) may still be present after 10 minutes. If that is the case, add 1 μL of the 50:50 buffer A/buffer B mixture, mix by pipetting up and down and then leave to dry again. Repeat until spot appears completely dry. Alternatively, dilute 0.5 μL of initial sample with 2 μL of 50:50 buffer A/buffer B mixture and spot 0.5 μL of newly diluted sample.
Acquire MALDI MS spectrum using positive reflector mode. Make sure that the mass range encompasses at least double the peptide’s mass to observe any dimerized peptide (disulfide-linked dimer).
a-factor typically appears as a mixture of [M + H]+, [M + Na]+, and [M + K]+ ions. Other ions may be observed however including [M + CH3OH + H]+, [M + CH3CN + H]+, [M + 2Na - H]+, and [M + CH3CN + Na]+.
The correct m/z ratio for a-factor can be calculated using programs such as ChemDraw that compute the monoisotopic mass. Sample MALDI-MS spectra of purified unfarnesylated and farnesylated a-factor are shown in Figures 3A and 3B respectively.
Figure 3.
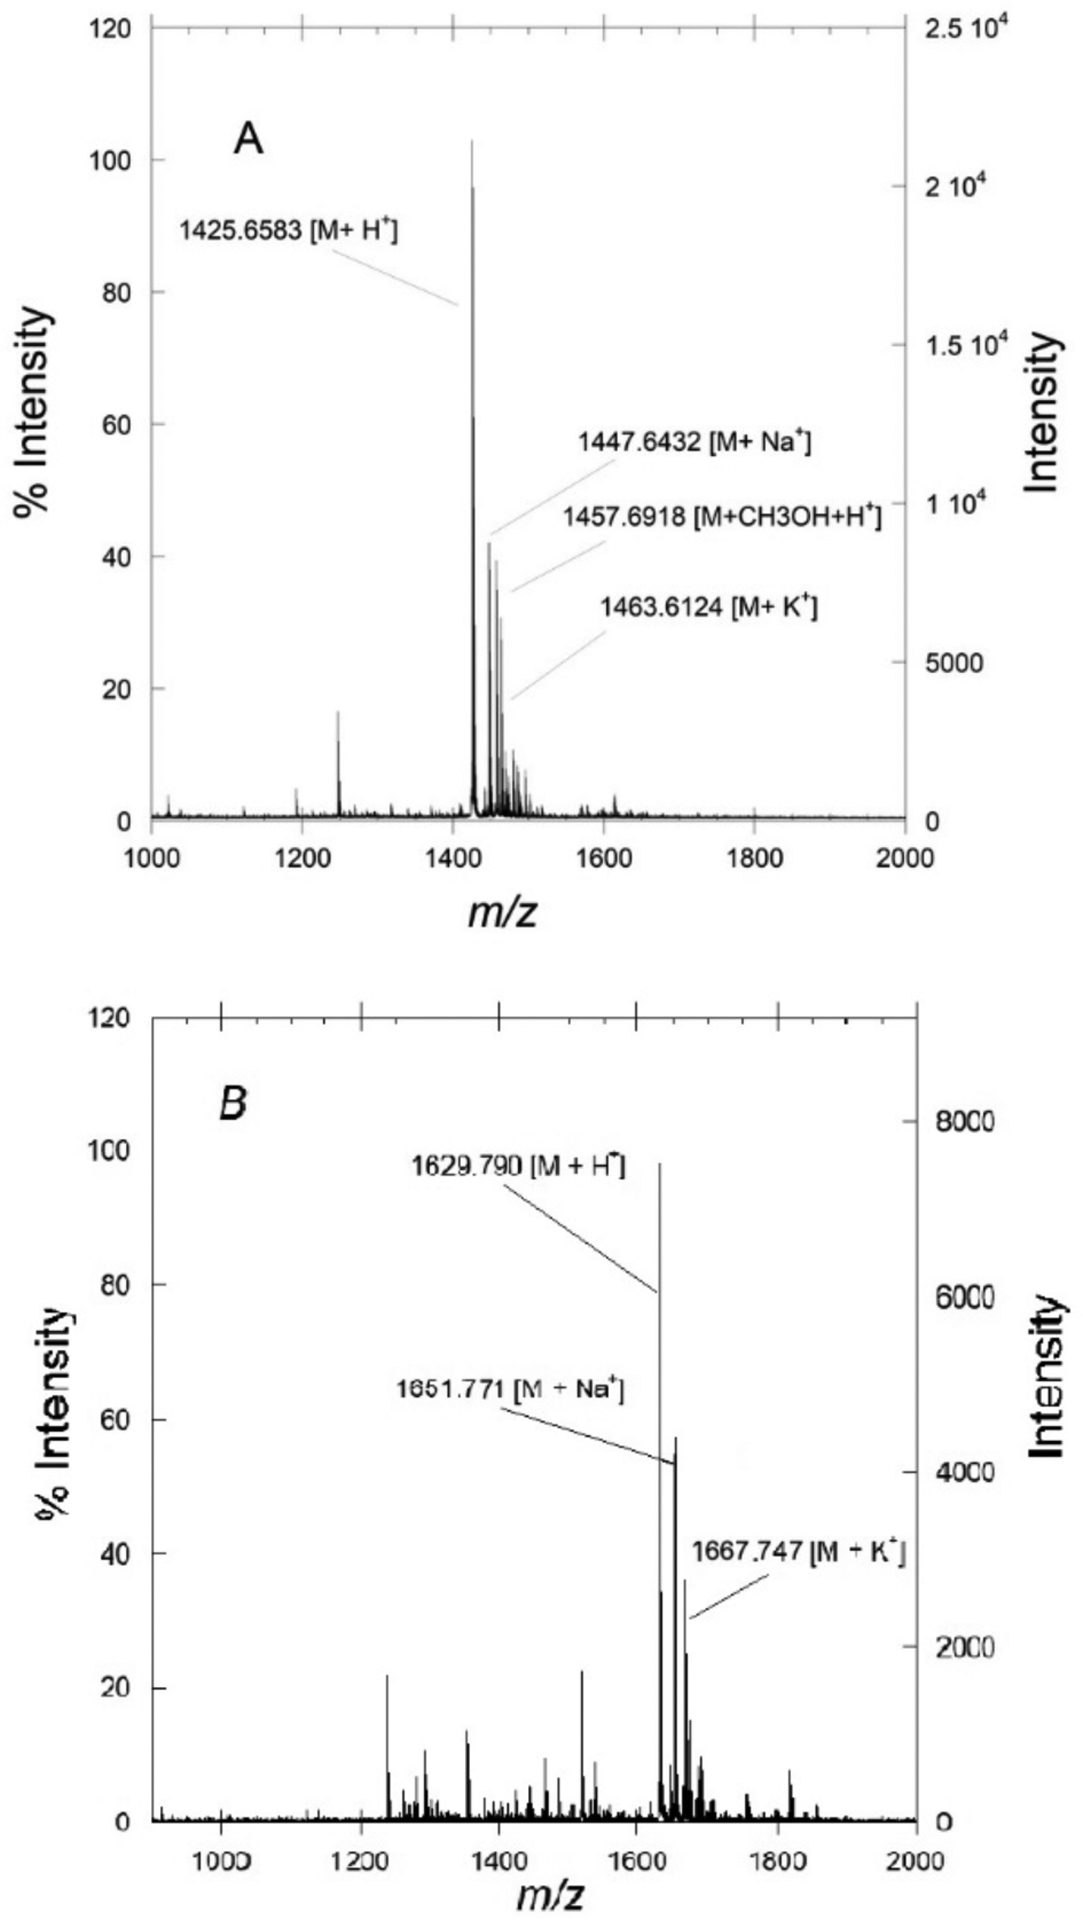
A: Example MALDI spectrum of purified a factor precursor. B: Example MALDI spectrum of purified farnesylated a factor. Notice the ionic charged states.
3.1.4. Notes
A calibrant should always be used to ensure accurate measurements. The following calibration mixture was used: Leucine enkephalin ([M + H]+ m/z = 556.2771), Bradykinin 2–9 ([M + H]+ m/z = 904.4680), Angiotensin I ([M + H]+ m/z = 1296.6850), Glu-fibrinogen ([M + H]+ m/z = 1570.6770), and ACTH 18–39 ([M + H]+ m/z = 2465.1990).
The matrix solution can be stored on the benchtop and reused. However, a blank MALDI-MS spectrum of the matrix solution alone should be acquired each time to ensure that it has not been contaminated, and also to compare to the peptide’s spectrum to avoid misidentifying the matrix peaks as contaminants. Special care should be taken to avoid labeling matrix clusters as contaminations (Smirnov et al., 2004).
In the case of DTT reduction, the crude peptide spectrum will show the [M + Na]+ ion as the predominant species while the other two ([M + H]+ and [M + K]+) may not be observed or only be observed at low levels.
A good practice is to spot each sample twice (at different locations on the plate) and acquire spectra of both. This is to prevent false negative results where some compounds fail to ionize due to inconstant co-crystallization with the matrix.
3.2. NMR analysis:
For the complete chemical characterization of the peptide, four homonuclear (1H,1H) and heteronuclear (1H,13C) 2D NMR experiments were necessary in addition to the basic 1H 1D experiment. COSY and TOCSY were used to analyze the short and long range 1H-1H coupled spin systems, while HSQC and HMBC were used to analyze the short and long range 1H-13C coupled spin systems. The full assignment of farnesylated a-factor was achieved, allowing unambiguous structural analysis of a-factor and a-factor precursors including specific stereochemical properties. For example, the TOCSY experiment allows for analysis and rough quantification of the extent of epimerization of the C-terminal cysteine residue (Diaz 2015), as the presence of L and D cysteine gives rise to significantly different chemical shifts.
3.2.1. Equipment
DMSO-d6 matched Shigemi NMR tube
Hamilton syringe
3.2.2. Reagents
DMSO-d6
3.2.3. Sample Preparation
Dissolve 1.5 mg peptide in 300 μL DMSO-d6 for a final concentration of 3 mM. Concentrations as low as 0.7 mM have been shown to give sufficient NMR signal (Diaz-Rodriguez et al., 2015), but higher concentrations will yield better spectra with stronger signal.
3.2.4. NMR experiments.
All acquisition for the experiments reported here was done using a Bruker Avance 700-MHz spectrometer with 5 mm 1H-13C-15N TXI cryoprobe. TopSpin was used to analyze all spectra.
One Dimensional 1H NMR (1D 1H NMR):
Acquire 1D proton NMR data. This can be extremely useful as a final quick analytical tool, since it can be compared to known spectra to judge the quality of the sample before acquiring more time consuming two-dimensional experiments. A sample 1H 1D NMR spectrum is shown in Figure 4. Assignment of the 1H 1D spectrum of a-factor has been previously reported (Gounarides et al., 1991), as well as the 1H 1D spectrum of the farnesyl moiety bonded to a factor (Anderegg, Betz, Carr, Crabb, & Duntze, 1988).
Figure 4.
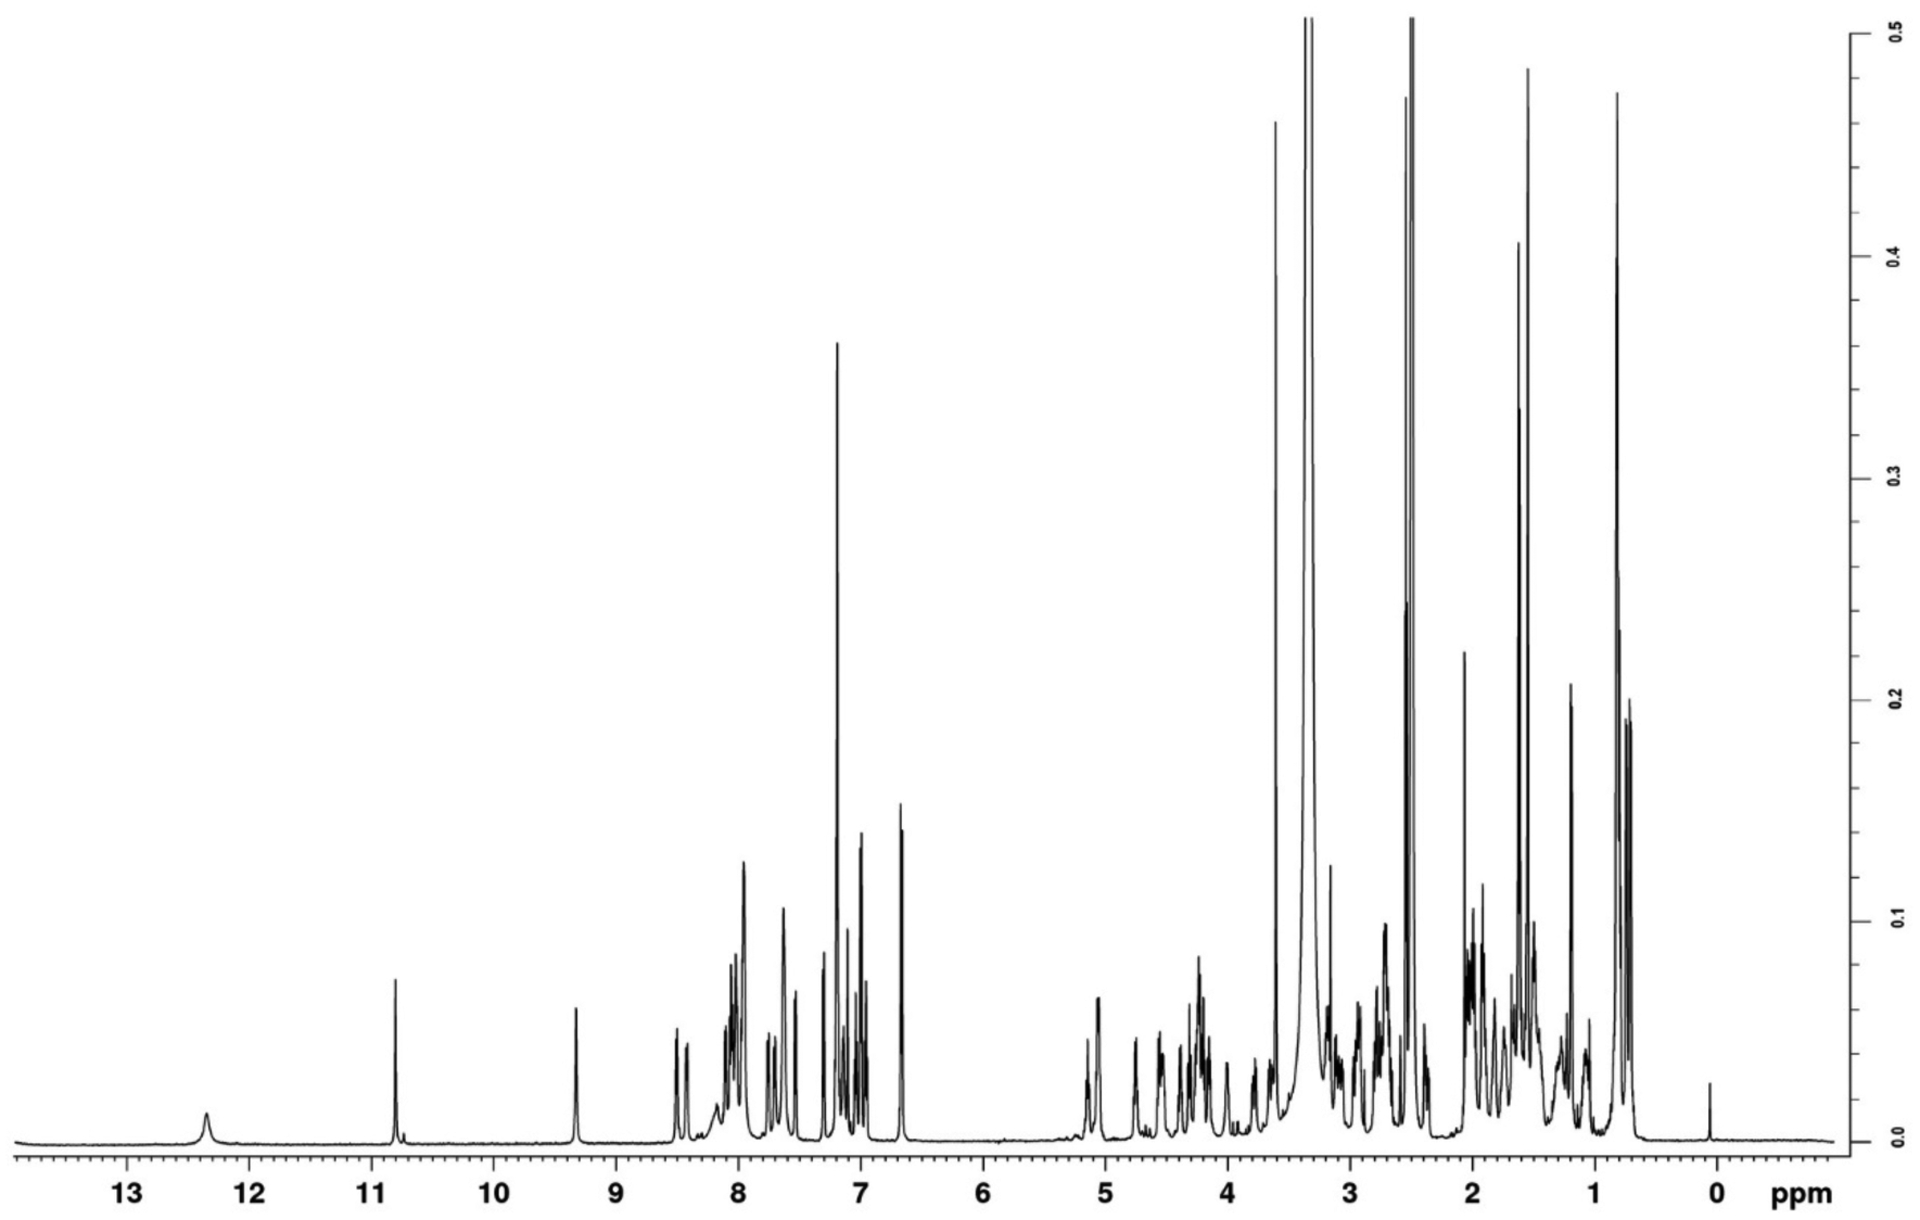
1D 1H NMR spectrum of farnesylated a factor in DMSO-d6. The water peak is observed at 3.33, and DMSO peak is observed at 2.5 and was used for all calibrations. Comparison to known 1D spectra offer a quick and reliable analytical method for determining the presence of correct peptide as well as purity. Spectra were acquired with 64 scans using 1 s recycle delay, 30° pulse, 3.1 s acquisition time with a sweep width of 15 ppm. Data were Fourier transformed with 0.3 Hz line broadening applied and manually phase-corrected. All acquisitions were done on a Bruker Avance 700-MHz spectrometer with a 5 mm TXI cryoprobe.
COSY:
Acquire COSY spectrum to gain primary assignment of 1H-1H coupled spin systems. The COSY spectrum will only show proton-proton coupled signals through less than three bonds. The assigned spectrum of a-factor is shown in Figure 5. The parameters used in the experiment are provided in the figure legend. Assignments are based on the 1D 1H spectrum.
Figure 5.
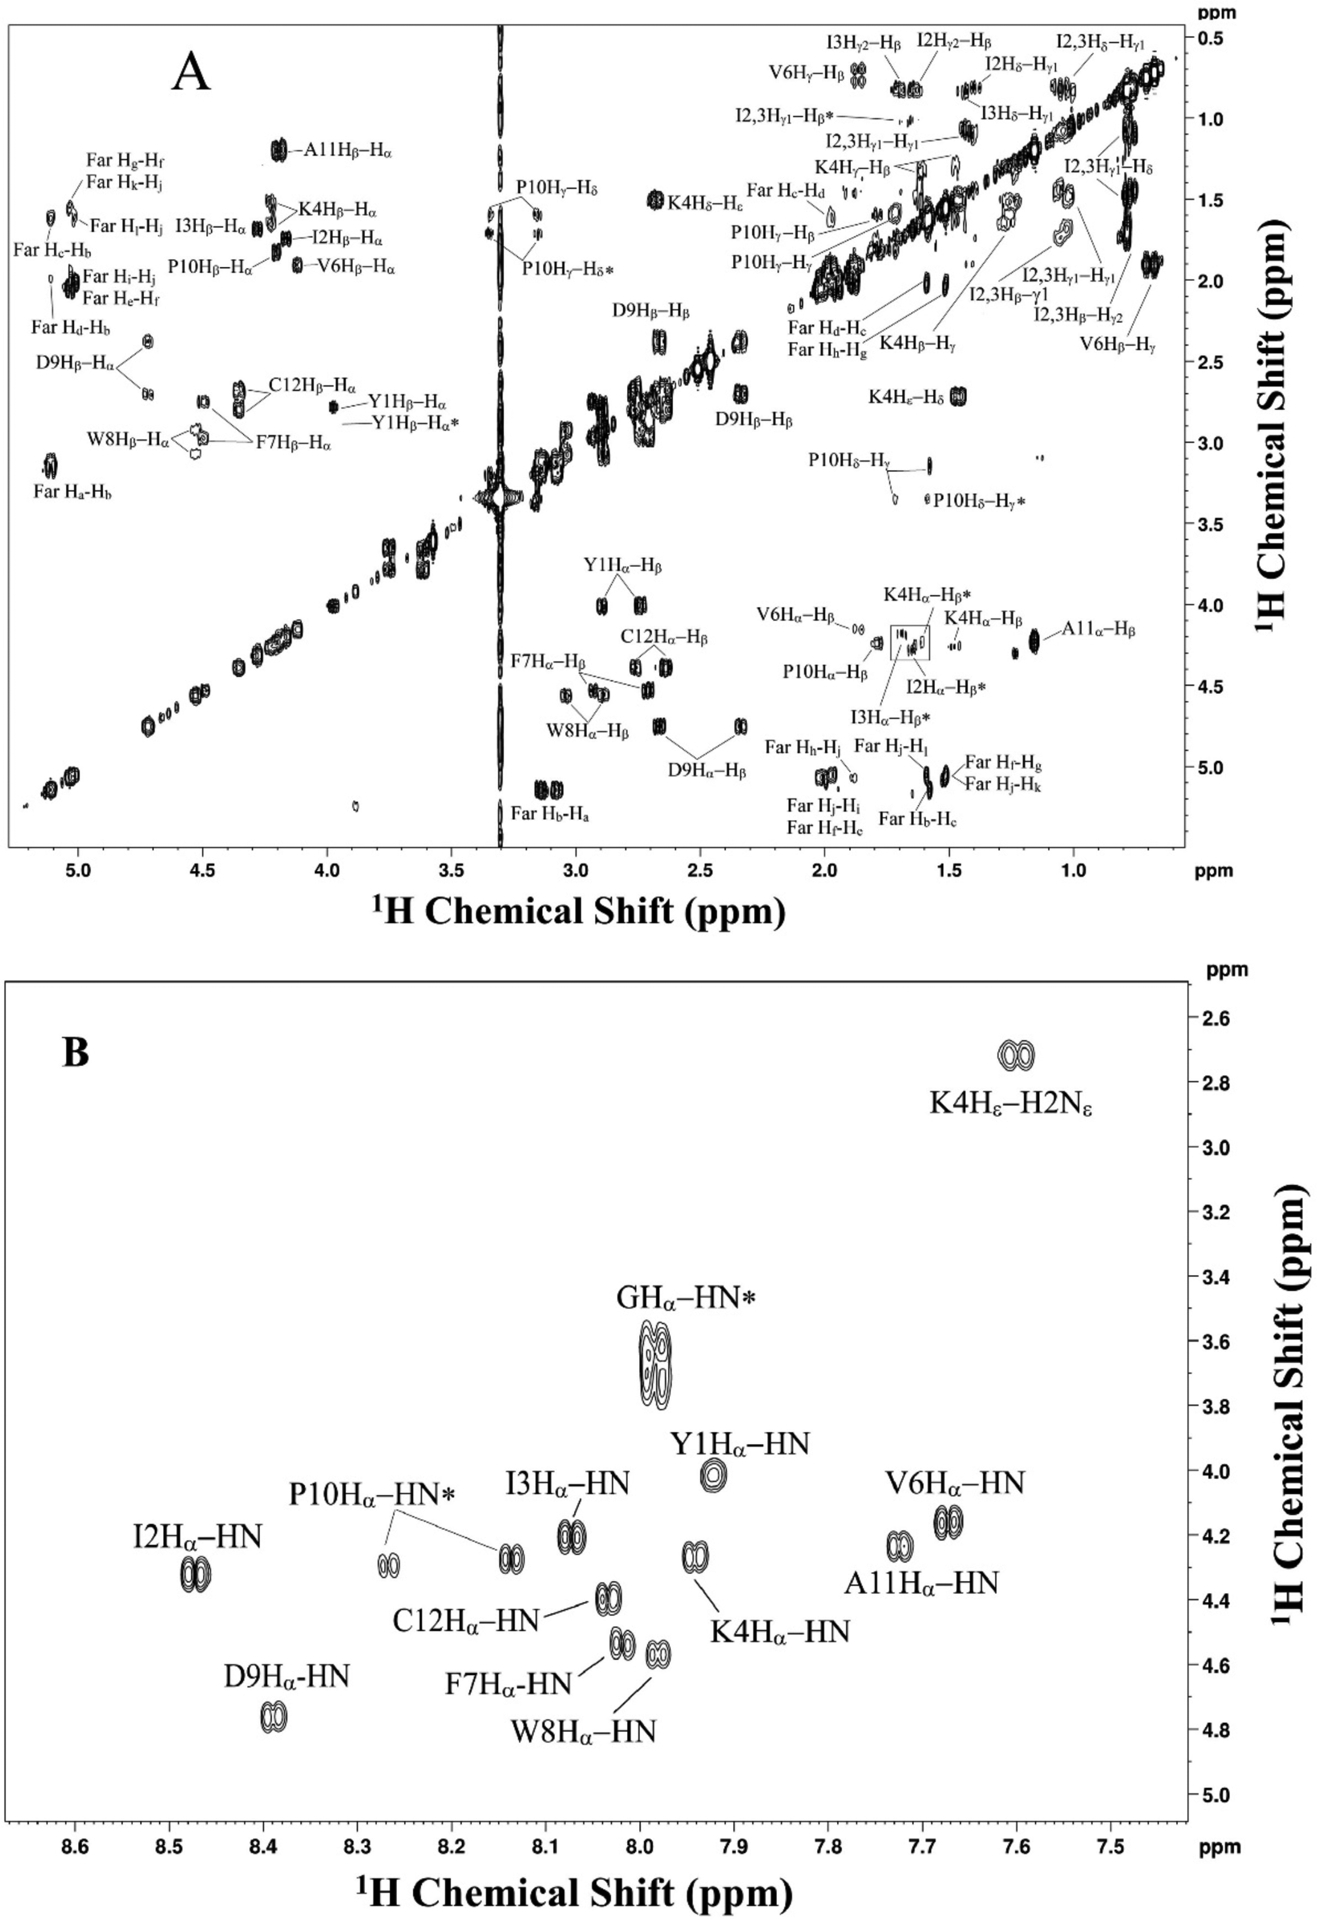
2D COSY NMR spectrum of farnesylated a factor in DMSO-d6, showing 1H-1H short range coupled spins (i.e., three bonds or less). Assignments are shown for each peak in the spectrum. Peaks labeled with asterisk are shown at a twofold to fourfold higher contour level. A: assigned aliphatic region. B: assigned backbone region. spectrum was acquired using 64 scans/increment, 16 dummy scans, 0.8 s recycle delay, and a spectral widths of 15 ppm. 6300 × 256 points were collected in the direct and indirect dimensions, respectively. Data were zero-filled with 8192 × 1024 points and Fourier-transformed with a shifted sine-bell squared function with 1.00 × 0.30 Hz line broadening applied. 2× linear prediction was applied in the indirect dimension. Sine bell shift was 0 × 0 and gaussian max position 0 × 0.1.
TOCSY:
Acquire TOCSY spectra to observe long range 1H-1H coupling (Bax & Davis, 1985). The TOCSY experiment shows long range interactions between coupled spins up to 5 continuous bonds. Assignments are based on the COSY spectrum and the 1D 1H spectrum. The parameters used in the experiment are described in the figure legend.
HSQC:
Acquire phase sensitive HSQC using Echo\Antiecho-TPPI gradient selection to gain primary assignment of the backbone (Boyer, Johnson, & Krishnamurthy, 2003; Palmer, Cavanagh, Wright, & Rance, 1991). This type of experiment only observes one bond carbon-hydrogen coupling (Schleucher et al., 1994). Peaks arising from CH1 or CH3 groups appear in the positive region, while peaks from CH2 appear in the negative region. The spectrum can be manually phased. The assignments are based on the 1D 1H spectrum and assisted by the 13C chemical shift values predicted using ChemDraw. The assigned spectrum of a-factor is shown in Figure 8. The parameters used for the data acquisition are described in the figure legend.
Figure 8.
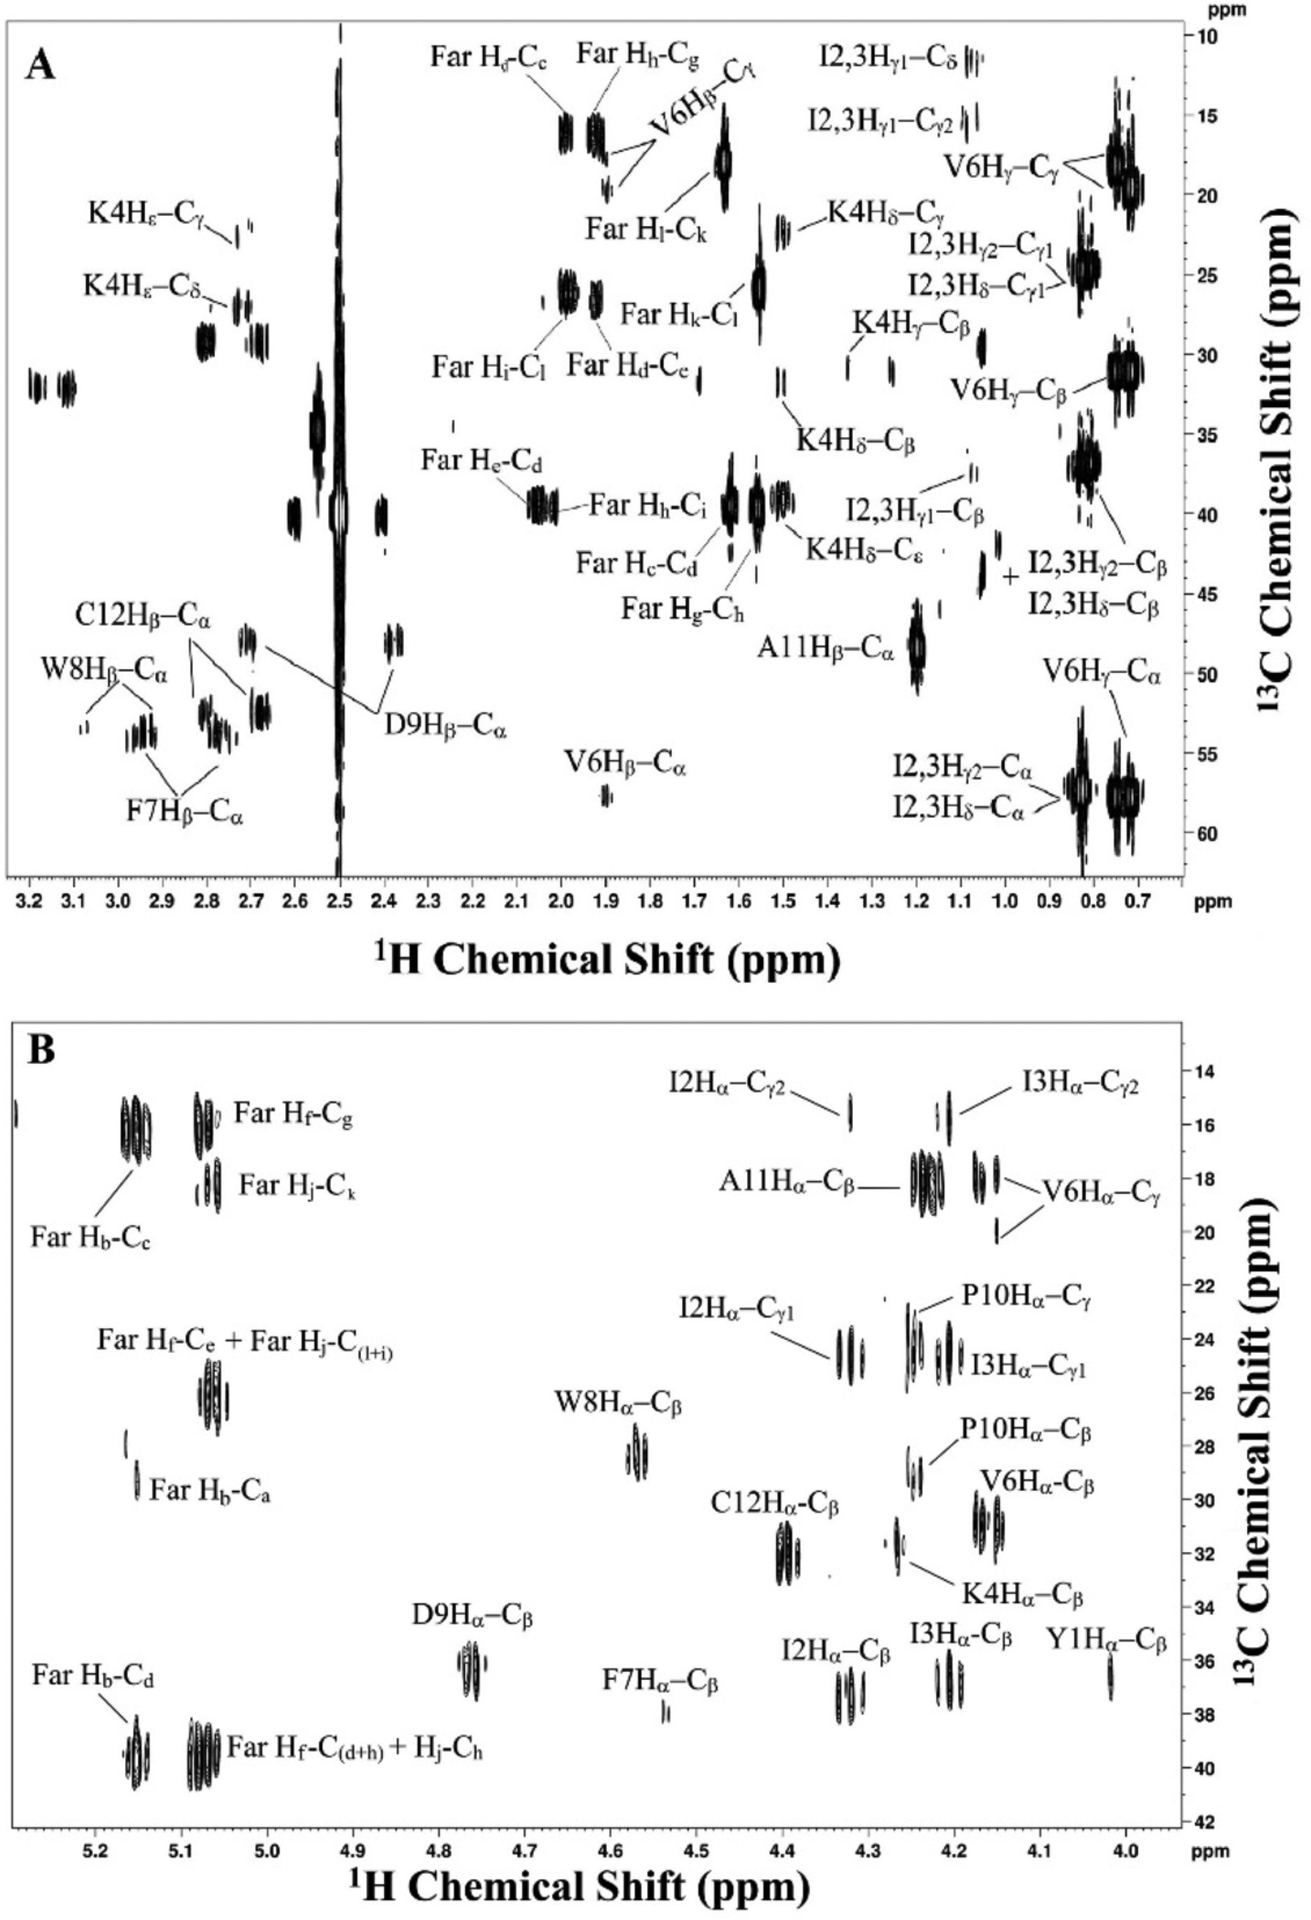
2D 1H,13C HMBC NMR spectrum of farnesylated a factor in DMSO-d6 showing 13C-1H long range coupled spin systems (up to five bonds). Assignments are shown adjacent to each peak. A: assigned aliphatic region. B: assigned backbone region. The spectrum was acquired using 32 scans/increment, 16 dummy scans, 0.8 s recycle delay, and a spectral widths of 15 ppm × 222 ppm. 5594 × 265 points were collected in the directly and indirectly detected dimensions, respectively. Data were zero-filled with 16384 × 2048 points and Fourier-transformed with a shifted sine-bell squared function with 1.00 × 1.00 Hz line broadening applied. 3× linear prediction was applied in the indirect dimension. Sine bell shift was 4 × 4 and gaussian max position 0.5 × 0.5.
HMBC:
Acquire phase sensitive HMBC using an echo/antiecho gradient selection with a three-fold low pass J-filter to suppress single bond correlations and obtain long range interactions (Cicero, Barbato, & Bazzo, 2001). In this experiment, coupled spin systems up to three continuous carbon-carbon bonds were observed. The assignments are based on the 1D 1H and HSQC spectra. An assigned spectrum of a-factor is shown in Figure 8. The parameters used in the experiment are described in the figure legend.
4. Summary
Using the side-chain anchoring method described here, it is possible to obtain a-factor in good yield and high purity. Most of the difficulties in the process arise from poor solubility, due to the presence of impurities and disulfide-linked dimers in the crude a-factor precursor. Sequential treatment with DTT and appropriate solvents as well as excess of TFA can be used to reduce the disulfide bond and keep the peptide solubilized for partial purification using HPLC. The excess TFA used, however, does interfere with adsorption of the peptide on the HPLC column. Sample dilution with aqueous solvent prior to injection, extended column equilibration, and an aqueous hold period all help ensure proper binding for purification. Partially purified a-factor precursor can then be farnesylated under mildly acidic conditions using farnesyl bromide and Zn(OAc)2. Solubility here is again problematic, as farnesyl bromide is soluble only in organic solvents, while Zn(OAc)2 requires aqueous conditions. Here a DMF/BuOH/aqueous TFA solvent blend is used to maintain a homogeneous mixture while pre-solubilized reactants are added sequentially. Finally, once a-factor has been farnesylated, it can be purified to homogeneity via multiple cycles of HPLC. Throughout the synthesis, MALDI-MS can be used to identify the presence of the correct products, as well as supplementing analytical HPLC for determining purity. MALDI-MS was chosen over ESI-MS methods as it simplified the analysis due to the production of singly charged species, as well as better ionization of a-factor and precursor. Once purified peptide is obtained, 2D NMR analysis provides an unambiguous analytical tool that can be used to inspect a-factor on the atomic level. COSY and TOCSY experiments provide the assignment of 1H-1H coupled spin systems, while HSQC and HMBC provide the assignments of 1H-13C coupled spin systems. While the methods described here are specifically for the preparation and characterization of a-factor, they can be used to prepare essentially any peptide that includes a C-terminal prenylated cysteine.
Figure 6.
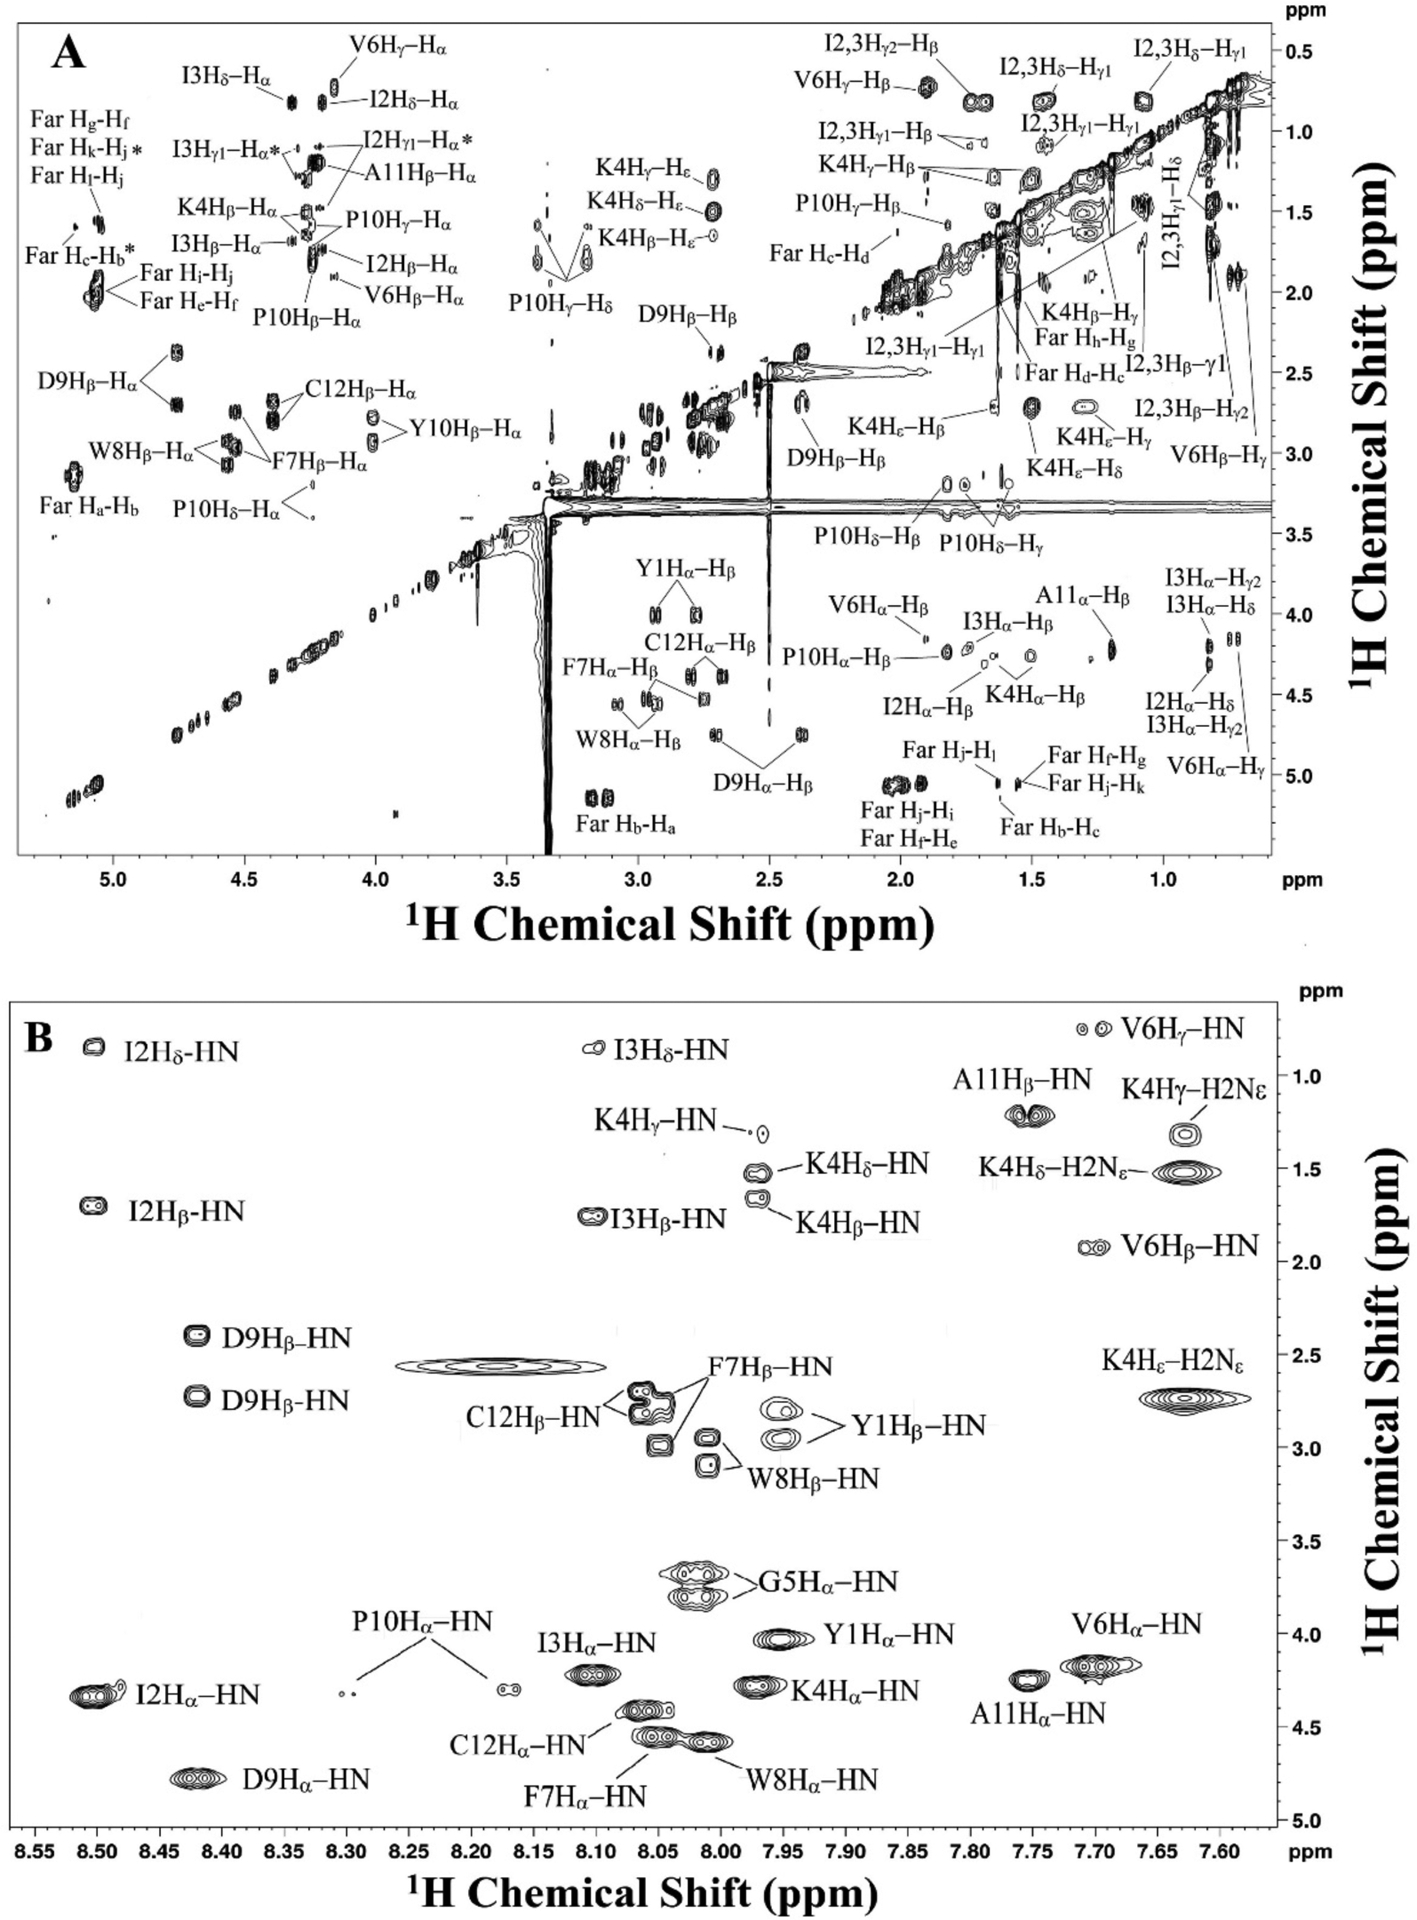
2D TOCSY NMR spectrum of farnesylated a factor in DMSO-d6 showing 1H-1H long range coupled spins (up to five bonds). Assignments are shown adjacent to each peak. Peaks labeled with asterisk are shown at a twofold to fourfold higher contour level. A: assigned aliphatic region. B: assigned backbone region. ROESY peaks appear as negative resonances and are are omitted from the spectrum for clarity. Spectral parameters were identical to the COSY spectrum except that the sine bell shit was 2 × 2 and the gaussian max position was 1 × 1.
Figure 7.
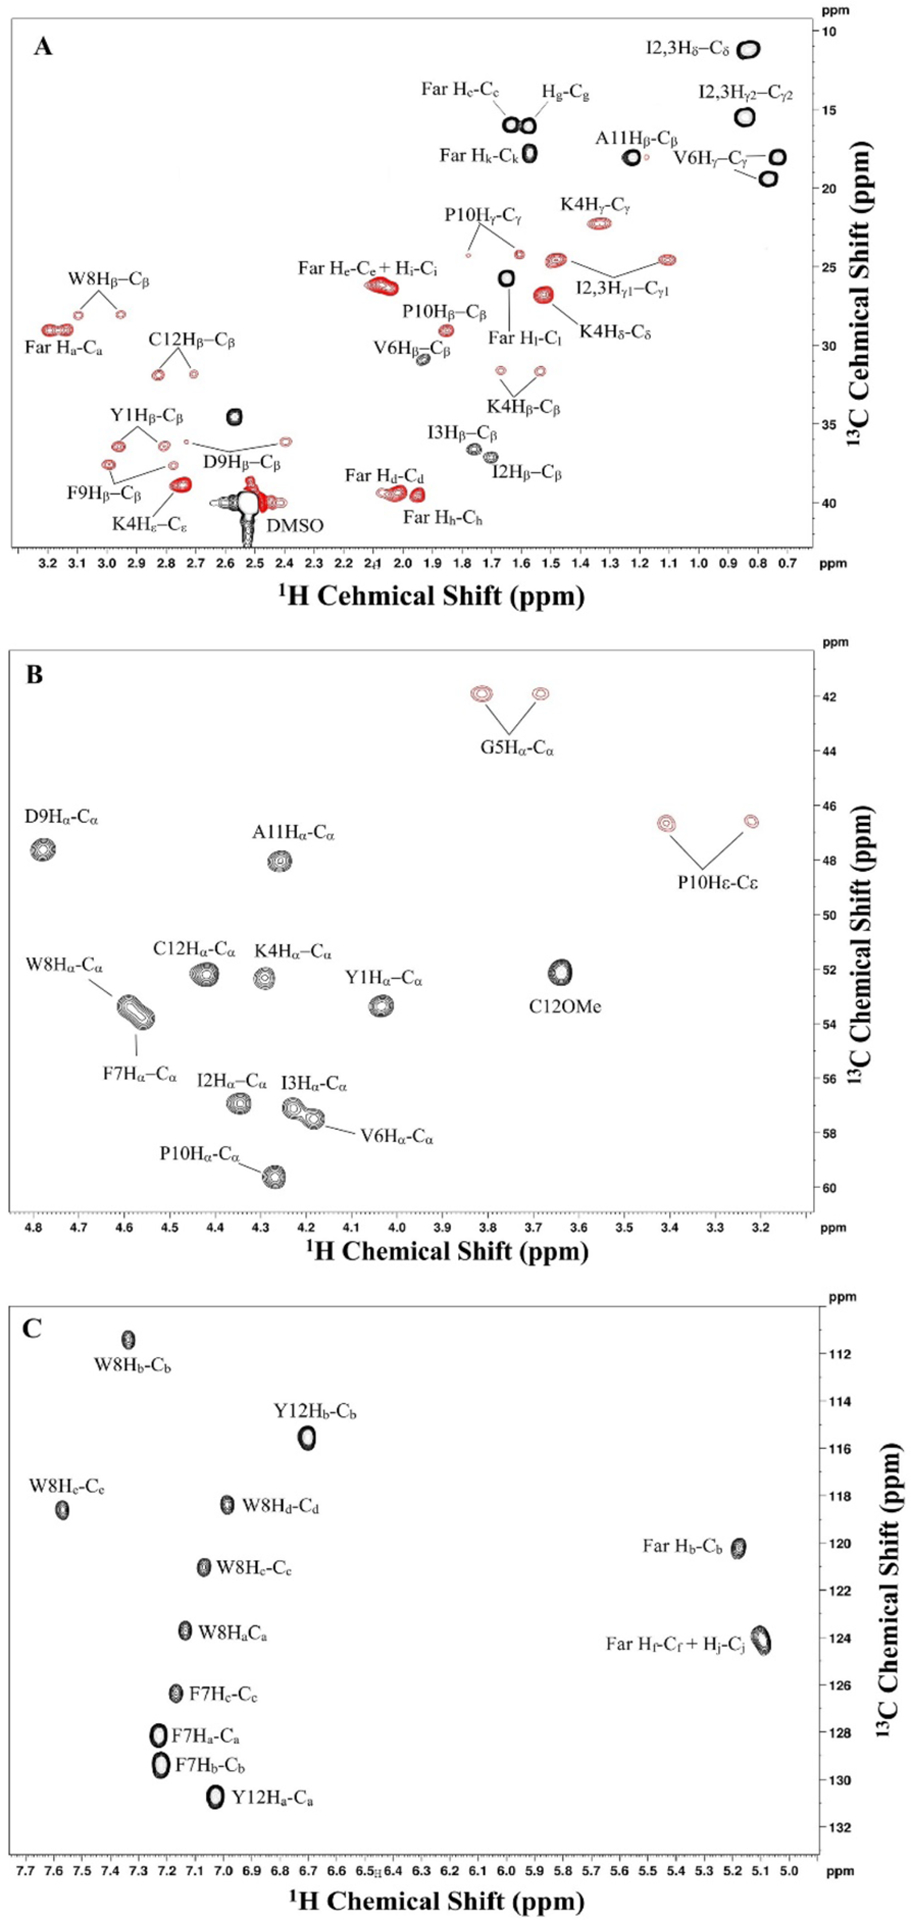
2D 1H, 13C-HSQC NMR spectrum of farnesylated a factor in DMSO-d6 showing 13C-1H short range coupled spin systems (via single bond). Assignments are shown adjacent to each peak. Peaks labeled with asterisk are shown at a twofold to fourfold higher contour level. Peaks with positive phasing (black) indicate a CH3 or CH1 moiety, while peaks with negative phasing (red) indicate a CH2 moiety. A: assigned aliphatic region. B: assigned backbone region. C: assigned aromatic region. Spectrum was acquired using 32 scans/increment, 32 dummy scans, 1.5 s recycle delay, and a spectral widths of 15 ppm × 165 ppm. 2048 × 1024 points were collected in the directly and indirectly detected dimensions, respectively. Data were zero-filled with 4096 × 2048 points and Fourier-transformed with a shifted sine-bell squared function with 1.00 × 0.30 Hz line broadening applied. 3× linear prediction was applied in the indirect dimension. Sine bell shift was 2 × 2 and gaussian max position 0 × 0.1.
Acknowledgment
Mass spectrometry analysis was performed at The University of Minnesota Department of Chemistry Mass Spectrometry Laboratory (MSL), supported by the Office of the Vice President of Research, College of Science and Engineering, and the Department of Chemistry at the University of Minnesota, as well as The National Science Foundation (NSF, Award CHE-1336940). The content of this paper is the sole responsibility of the authors and does not represent endorsement by the MSL or NSF. This work was supported in part by the National Institutes of Health (RF1AG056976, GM084152, and GM106082) and by the National Science Foundation (CHE-1308655). NMR analysis was performed at Minnesota NMR center. Funding for NMR instrumentation was provided by the Office of the Vice President for Research, the Medical School, the College of Biological Science, NIH, NSF, and the Minnesota Medical Foundation. Special thanks to Veronica Diaz-Rodriguez for providing the analytical HPLC chromatogram of a factor precursor.
References
- Anderegg RJ, Betz R, Carr SA, Crabb JW, & Duntze W (1988). Structure of Saccharomyces cerevisiae mating hormone a-factor. Identification of S-farnesyl cysteine as a structural component. Journal of Biological Chemistry, 263(34), 18236–18240. [PubMed] [Google Scholar]
- Barany G, Han Y, Hargittai B, Liu RQ, & Varkey JT (2003). Side-Chain Anchoring Strategy for Solid-Phase Synthesis of Peptid Acids with C-Terminal Cysteine. Biopolymers - Peptide Science Section, 71(6), 652–666. [DOI] [PubMed] [Google Scholar]
- Bax A, & Davis DG (1985). MLEV-17-based two-dimensional homonuclear magnetization transfer spectroscopy. Journal of Magnetic Resonance (1969), 65(2), 355–360. [Google Scholar]
- Boyer RD, Johnson R, & Krishnamurthy K (2003). Compensation of refocusing inefficiency with synchronized inversion sweep (CRISIS) in multiplicity-edited HSQC. Journal of Magnetic Resonance, 165(2), 253–259. [DOI] [PubMed] [Google Scholar]
- Caldwell G. a, Naider F, & Becker JM (1995). Fungal lipopeptide mating pheromones: a model system for the study of protein prenylation. Microbiological reviews, 59(3), 406–422. [DOI] [PMC free article] [PubMed] [Google Scholar]
- Casey PJ, & Seabra MC (1996). Protein prenyltransferases. J Biol Chem, 271(10), 5289–5292. American Society for Biochemistry and Molecular Biology. [DOI] [PubMed] [Google Scholar]
- Chakrabarti D, Silva T Da, Barger J, Paquette S, Patel H, Patterson S, & Allen CM (2002). Protein farnesyltransferase and protein prenylation in Plasmodium falciparum. Journal of Biological Chemistry, 277(44), 42066–42073. [DOI] [PubMed] [Google Scholar]
- Chan WC, & White PD (2000). Fmoc Solid Phase Peptide Synthesis: A Practical Approach. (Hames BD, Ed.)The practical approach. Oxford: Oxford University Press. [Google Scholar]
- Cicero DO, Barbato G, & Bazzo R (2001). Sensitivity enhancement of a two-dimensional experiment for the measurement of heteronuclear long-range coupling constants, by a new scheme of coherence selection by gradients. Journal of Magnetic Resonance, 148(1), 209–213. [DOI] [PubMed] [Google Scholar]
- Diaz-Rodriguez V, & Distefano MD (2017). A-Factor: A chemical biology tool for the study of protein prenylation. Current Topics in Peptide and Protein Research, 18, 133–151. [PMC free article] [PubMed] [Google Scholar]
- Diaz-Rodriguez V, Ganusova E, Rappe TM, Becker JM, & Distefano MD (2015). Synthesis of Peptides Containing C-Terminal Esters Using Trityl Side-Chain Anchoring: Applications to the Synthesis of C-Terminal Ester Analogs of the Saccharomyces cerevisiae Mating Pheromone a -Factor. Journal of Organic Chemistry, 80(22), 11266–11274. [DOI] [PMC free article] [PubMed] [Google Scholar]
- Diaz-Rodriguez V, Mullen DG, Ganusova E, Becker JM, & Distefano MD (2012). Synthesis of peptides containing C -terminal methyl esters using trityl side-chain anchoring: Application to the synthesis of a-factor and a-factor analogs. Organic Letters, 14(22), 5648–5651. [DOI] [PMC free article] [PubMed] [Google Scholar]
- Eckert GP, Hooff GP, Strandjord DM, Igbavboa U, Volmer DA, Müller WE, & Wood WG (2009). Regulation of the brain isoprenoids farnesyl- and geranylgeranylpyrophosphate is altered in male Alzheimer patients. Neurobiology of Disease, 35(2), 251–257. Elsevier Inc. [DOI] [PMC free article] [PubMed] [Google Scholar]
- Eissler S, Kley M, Bächle D, Loidl G, Meier T, & Samson D (2017). Substitution determination of Fmoc-substituted resins at different wavelengths. Journal of Peptide Science, 23(10), 757–762. [DOI] [PMC free article] [PubMed] [Google Scholar]
- García-Martín F, Bayo N, Cruz LJ, Bohling J, & Albericio F (2006). Chlorotrityl Chloride (CTC) Resin as a Convenient Reusable Protecting Group. Understanding Biology Using Peptides, 9(3), 220–221. [Google Scholar]
- Gounarides JS, Broido MS, Xue CB, Becker JM, & Naider FR (1991). The conformation of a-factor is not influenced by the S-prenylation of Cys12. Biochemical and Biophysical Research Communications, 181(3), 1125–1130. [DOI] [PubMed] [Google Scholar]
- Han Y, Albericio F, & Barany G (1997). Occurrence and Minimization of Cysteine Racemization during Stepwise Solid-Phase Peptide Synthesis. The Journal of Organic Chemistry, 62(13), 4307–4312. [DOI] [PubMed] [Google Scholar]
- Hosokawa A, Wollack JW, Zhang Z, Chen L, Barany G, & Distefano MD (2007). Evaluation of an alkyne-containing analogue of farnesyl diphosphate as a dual substrate for protein-prenyltransferases. International Journal of Peptide Research and Therapeutics, 13(1–2), 345–354. [Google Scholar]
- Kaiser E, Colescott RL, Bossinger CD, & Cook PI (1970). Color test for detection of free terminal amino groups in the solid-phase synthesis of peptides. Analytical Biochemistry, 34(2), 595–598. [DOI] [PubMed] [Google Scholar]
- Kassai H, & Fukada Y (2011). Farnesylation Versus Geranylgeranylation in G-Protein-Mediated Light Signaling. Enzymes, 29, 125–145. [Google Scholar]
- Li H, Kuwajima T, Oakley D, Nikulina E, Hou J, Yang WS, Lowry ER, et al. (2016). Protein Prenylation Constitutes an Endogenous Brake on Axonal Growth. Cell reports, 16(2), 545–558. ElsevierCompany. [DOI] [PubMed] [Google Scholar]
- Mullen DG, Kyro K, Hauser M, Gustavsson M, Veglia G, Becker JM, Naider F, et al. (2011). Synthesis of a-factor peptide from Saccharomyces cerevisiae and photoactive analogues via Fmoc solid phase methodology. Bioorganic and Medicinal Chemistry, 19(1), 490–497. [DOI] [PMC free article] [PubMed] [Google Scholar]
- Nadler WM, Waidelich D, Kerner A, Hanke S, Berg R, Trumpp A, & Rösli C (2017). MALDI versus ESI: The Impact of the Ion Source on Peptide Identification. Journal of Proteome Research, 16(3), 1207–1215. [DOI] [PubMed] [Google Scholar]
- Ochocki JD, & Distefano MD (2013). Prenyltransferase inhibitors: Treating human ailments from cancer to parasitic infections. MedChemComm, 4(3), 476–492. [DOI] [PMC free article] [PubMed] [Google Scholar]
- Palmer AG, Cavanagh J, Wright PE, & Rance M (1991). Sensitivity improvement in proton-detected two-dimensional heteronuclear correlation NMR spectroscopy. Journal of Magnetic Resonance (1969), 93(1), 151–170. [Google Scholar]
- Palsuledesai CC, Ochocki JD, Kuhns MM, Wang YC, Warmka JK, Chernick DS, Wattenberg EV, et al. (2016). Metabolic Labeling with an Alkyne-modified Isoprenoid Analog Facilitates Imaging and Quantification of the Prenylome in Cells. ACS Chemical Biology, 11(10), 2820–2828. [DOI] [PMC free article] [PubMed] [Google Scholar]
- Riddles PW, L. Blakeley R, & Zerner B (1983). Reassessment of Ellman’s reagent. Methods in Enzymology, 91, 49–60. [DOI] [PubMed] [Google Scholar]
- Rowell CA, Kowalczyk JJ, Lewis MD, & Garcia AM (1997). Direct demonstration of geranylgeranylation and farnesylation of Ki-Ras in vivo. Journal of Biological Chemistry, 272(22), 14093–14097. [DOI] [PubMed] [Google Scholar]
- Schleucher J, Schwendinger M, Sattler M, Schmidt P, Schedletzky O, Glaser SJ, Sørensen OW, et al. (1994). A general enhancement scheme in heteronuclear multidimensional NMR employing pulsed field gradients. Journal of Biomolecular NMR, 4(2), 301–306. [DOI] [PubMed] [Google Scholar]
- Sinensky M (2000). Recent advances in the study of prenylated proteins. Biochimica et Biophysica Acta - Molecular and Cell Biology of Lipids, 1484(2–3), 93–106. [DOI] [PubMed] [Google Scholar]
- Smirnov IP, Zhu X, Taylor T, Huang Y, Ross P, Papayanopoulos IA, Martin SA, et al. (2004). Suppression of α-cyano-4-hydroxycinnamic acid matrix clusters and reduction of chemical noise in MALDI-TOF mass spectrometry. Analytical Chemistry, 76(10), 2958–2965. [DOI] [PubMed] [Google Scholar]
- Suazo KF, Schaber C, Palsuledesai CC, Odom John AR, & Distefano MD (2016). Global proteomic analysis of prenylated proteins in Plasmodium falciparum using an alkyne-modified isoprenoid analogue. Scientific Reports, 6(November), 1–11. Nature Publishing Group. [DOI] [PMC free article] [PubMed] [Google Scholar]
- Vervacke JS, Funk AL, Wang YC, Strom M, Hrycyna CA, & Distefano MD (2014). Diazirine-containing photoactivatable isoprenoid: Synthesis and application in studies with isoprenylcysteine carboxyl methyltransferase. Journal of Organic Chemistry, 79(5), 1971–1978. [DOI] [PMC free article] [PubMed] [Google Scholar]
- Zhang S, Sperlich B, Li F, Al-ayoubi S, Chen H, Zhao Y, Li Y, et al. (2017). Phosphorylation Weakens but Does Not Inhibit Membrane Binding and Clustering of K-Ras4B. ACS Chemical Biology, 12(6), 1703–1710. [DOI] [PubMed] [Google Scholar]


