

Abstract
J Clin Hypertens (Greenwich). 2010;12:174–180. ©2010 Wiley Periodicals, Inc.
Despite the effects of sodium intake on blood pressure and on response to antihypertensive medication, sodium intake is rarely monitored in clinical practice. The current method, the 24‐hour urine collection for sodium excretion, is cumbersome, often incorrectly performed, and not commonly ordered. Further, its results have limited meaning because of the substantial day‐to‐day variation in sodium intake. A spot urine test to enable convenient, inexpensive, and serial monitoring of sodium excretion would be desirable. In this study, the accuracy of predicting 24‐hour sodium excretion from a spot urine sample was assessed. The urine sodium/creatinine ratio was determined from the following urine samples: an “AM sample,” submitted at the beginning of the 24‐hour urine collection; a “PM sample” collected in the later afternoon/early evening before dinner, at roughly the midpoint of the collection; and a “random sample,” collected after its completion. The ratio was then corrected for 24‐hour creatinine excretion. The strongest correlation between predicted and actual 24‐hour sodium excretion was observed with the PM sample collected near the midpoint (r=0.86, P<.001). This sample also identified persons with sodium excretion <100 mEq/d with a sensitivity of 100% and specificity of 82%. The sodium/creatinine ratio from a spot urine sample collected in the late afternoon/early evening at roughly the midpoint of the 24‐hour collection, and adjusted for 24‐hour creatinine excretion, strongly correlated with 24‐hour sodium excretion. Additional studies are merited to further evaluate the role of the spot urine sample in assessing sodium intake.
The important effects of sodium intake on blood pressure (BP) and on response to antihypertensive drug therapy have been widely recognized. Despite this, few physicians objectively measure or monitor the sodium intake of their hypertensive patients.
The main methods in current use for assessing sodium intake are dietary recall and measurement of 24‐hour urine sodium excretion. Dietary recall is often inaccurate, and many patients are truly unaware of the amount of sodium they consume. 1 , 2 , 3 Measurement of 24‐hour urine sodium excretion has major drawbacks. It is cumbersome and inconvenient. Many patients will not do it, and among those who do, many perform the collection incorrectly. As many as 30% submit undercollections, understating actual sodium intake. 4 Further, results reflect the intake of only the preceding day or two, which, because of the considerable day‐to‐day variability in sodium intake, often is not representative of that individual’s usual sodium intake.
Currently, hypertension is usually managed without knowledge of patients’ sodium intake. This can affect both control of hypertension and risk of adverse effects. For example, when diuretics are prescribed, the risk of adverse effects is magnified if a high dose is given to patients who consume little sodium, and the risk of inadequate BP control is magnified if a low dose is given to patients with a high sodium intake. Level of sodium intake can play an important role in resistant hypertension and the need for, and efficacy of, high‐dose diuretics in its treatment. 5 , 6
A preferable method, from a perspective of ease and convenience, to serially monitor sodium excretion, would be assessment of sodium excretion from spot urine samples. This would require measurement of the spot urine sodium concentration along with a measure of the state of concentration or dilution of the urine, such as the urine creatinine concentration, as is currently used to estimate 24‐hour excretion of other analytes such as albumin and catecholamines.
Unfortunately, the spot urine sodium/creatinine ratio has inherent limitations in estimating 24‐hour sodium excretion. First, sodium excretion varies considerably from day to day and hour to hour, and, therefore, spot urine results can differ substantially from results of 24‐hour collections. Second, the accuracy of the sodium/creatinine ratio is reduced by the considerable interindividual differences in 24‐hour creatinine excretion. Thus, for example, if one individual excreted 800 mg/d of creatinine daily while another excreted 2400 mg, and both had the same sodium/creatinine ratio, the ratio would be misleading in that it would indicate the same 24‐hour sodium excretion for both, even though sodium excretion would actually be 3‐fold higher in the individual who excretes 2400 mg. The use of a spot urine method, or a brief timed collection, for assessing sodium excretion has previously been examined. 7 , 8 , 9 Nevertheless, the spot urine method has not been adopted for clinical use. We have undertaken studies to reassess its accuracy and usefulness in estimating 24‐hour sodium excretion.
Participants and Methods
Study participants were recruited between July 2006 and September 2007. Informed consent was obtained, as approved by The New York Hospital‐Weill Cornell Medical Center Committee on Human Rights in Research. Patients older than 21 were recruited irrespective of hypertensive status and renal function, as long as renal function and appetite were stable. The following information was recorded: weight, height, body mass index (BMI), serum creatinine level obtained within 3 months of the urine collection, and casual office BP measurement. Participants were considered to be hypertensive if treated or untreated office BP was ≥140/90 or if the participant was normotensive but reported a history of hypertension and was taking antihypertensive medication.
All study participants were given a 3‐L jug and instructed to collect a 24‐hour urine sample by discarding the first voided urine upon arising in the morning and then collecting all voided urine up to and including the first void the following morning. The first 36 patients were asked to submit a random sample, collected when bringing in the completed 24‐hour urine collection. The next 36 patients were instructed instead to submit two spot samples obtained during the 24‐hour collection: an “AM sample,” consisting of the second morning void (ie, the first urine included in the 24‐hour collection and a “PM sample,” collected in the late afternoon or early evening, prior to the evening meal, near the midpoint of the 24‐hour collection. An additional 9 patients submitted only the PM sample.
The volume of the 24‐hour collections and of the random, AM, and PM samples were recorded, and aliquots were sent to The New York Hospital Laboratories for measurement of sodium, chloride, and creatinine concentration by standard laboratory methods. In calculating the 24‐hour excretion of sodium and creatinine, the amount excreted in the AM and PM samples was added to that contained in the 24‐hour jug.
Statistical Analysis
The sodium/creatinine ratio of the random, AM, and PM samples was determined from their respective sodium and creatinine concentrations. Pearson correlation coefficients were calculated for the relationship between sodium/creatinine ratio and 24‐hour sodium excretion.
The predicted 24‐hour sodium excretion was then calculated from the sodium/creatinine ratios of the random, AM, and PM samples by adjusting them for the participant’s 24‐hour creatinine excretion, using the following formula:
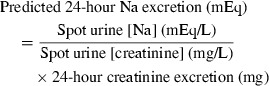 |
The correlation between 24‐hour sodium excretion predicted from the random, AM, and PM samples, and actual 24‐hour sodium excretion, was then assessed. Two‐tailed probability levels for statistical significance tests are reported, with P<.05 considered statistically significant.
Correlations between predicted and actual sodium excretion were also assessed in subgroups defined by hypertension status (normotensive vs hypertensive), BMI (normal [<25 kg/m²], overweight [25–29.9 kg/m²], and obese [≥30 kg/m²]), age (dichotomized at 60 years), and creatinine (dichotomized at 1.5 mg/dL). Correlations were also assessed in diuretic subgroups (diuretic vs no diuretic and thiazide diuretic vs no diuretic). The correlations were quantified by Pearson correlation coefficients.
Finally, participants’ results for 24‐hour sodium excretion were dichotomized into “low” (<100 mEq/d) or “not low” (≥100 mEq/d). The κ statistic was computed to assess the level of agreement between the dichotomized predicted 24‐hour excretion from the random, AM, and PM spot samples and the dichotomized 24‐hour excretion.
Results
Demographic characteristics of the 81 study participants are summarized in Table I. Ninety‐one percent were hypertensive. Correlations between spot urine sodium/creatinine ratios and 24‐hour sodium excretion are shown in Table II. As is seen, without adjustment for 24‐hour creatinine excretion, the sodium/creatinine ratio derived from PM samples correlated strongly with 24‐hour sodium excretion (r=0.67, P<.001), whereas the ratios from the random and AM samples did not demonstrate any correlation with the 24‐hour sodium excretion.
Table I.
Characteristics of the Study Sample (N=83)
| Characteristic | No. | Mean ± Standard Deviation | Range |
|---|---|---|---|
| Age, y | 81 | 59.2±12.2 | 21–82 |
| Body mass index, kg/m² | 77 | 28.5±5.7 | 18.4–45.4 |
| Systolic blood pressure, mm Hg | 80 | 129.4±16.0 | 95.0–180.0 |
| Diastolic blood pressure, mm Hg | 80 | 83.4±11.8 | 50.0–120.0 |
| Serum urea nitrogen, mg/dL | 77 | 17.9±7.2 | 6.0–38.0 |
| Serum creatinine, mg/dL | 78 | 1.1±0.4 | 0.7–2.3 |
| Male, % | 81 | 55.3 | |
| Race/ethnicity, % | 80 | ||
| White | 63.8 | ||
| Black | 25.0 | ||
| Other non‐white | 11.3 | ||
| Hypertensive | 81 | 91.6 | |
| Taking a diuretic | 81 | 56.8 | |
Table II.
Correlations Between Spot Urine Sodium/Creatinine Ratio and 24‐Hour Sodium Excretion
| Correlation of 24‐H Sodium Excretion With: | Unadjusted Sodium/Creatinine Ratio | Adjusted Sodium/Creatinine Ratio = Predicted 24‐H Sodium Excretion a | ||||
|---|---|---|---|---|---|---|
| Urine sample | R | P Value | No. | R | P Value | No. |
| Random | −0.01 | .97 | 36 | 0.17 | .33 | 36 |
| Morning | 0.14 | .42 | 36 | 0.31 | .06 | 36 |
| Evening | 0.67 | <.001 | 45 | 0.86 | <.001 | 45 |
When sodium/creatinine ratios were adjusted for 24‐hour creatinine excretion (Table II and Figure), all correlations were strengthened. For PM samples, the correlation between predicted and actual 24‐hour sodium excretion increased from 0.67 (P<.001) to 0.86 (P<.001). For AM samples, the correlation approached statistical significance (r=0.31, P=.06), whereas sodium excretion predicted from random samples was still not significantly correlated with actual 24‐hour sodium excretion. The Figure presents the individual data points, illustrating the relationship between actual 24‐hour sodium excretion and excretion predicted from random, AM, and PM samples. Table III further demonstrates the close relationship between predicted and actual 24‐hour sodium excretion in terms of the similar mean values, as seen particularly with the PM samples.
Figure.
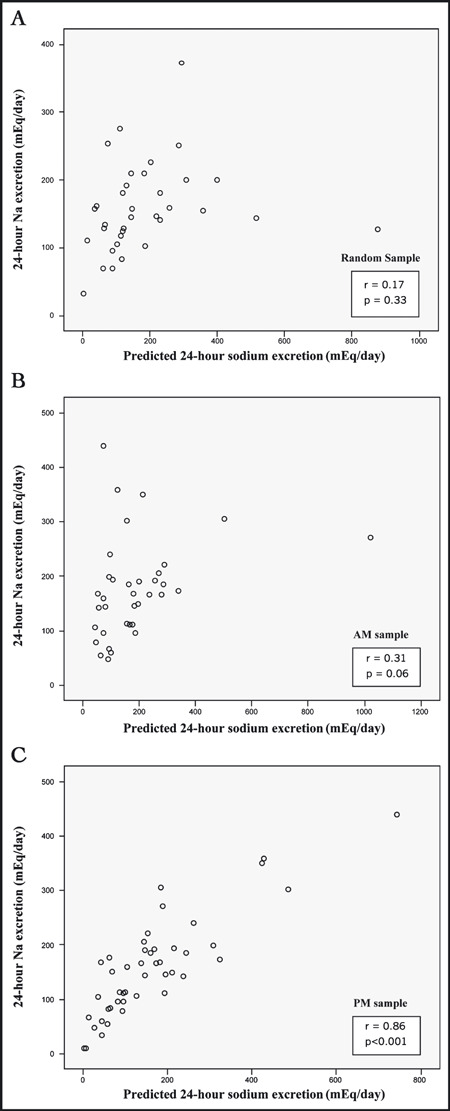
Correlation between actual 24‐hour sodium excretion and sodium excretion predicted from random sample (panel A), morning (AM) sample (panel B), and evening (PM) sample (panel C).
Table III.
Mean Values for Predicted and Actual 24‐Hour Sodium Excretion
| 24‐H Sodium Excretion Predicted From Spot Samples | Actual 24‐H Sodium Excretion | ||||
|---|---|---|---|---|---|
| Spot Urine Sample | No. | Mean | Standard Deviation | Mean | Standard Deviation |
| Random | 36 | 181.53 | 165.08 | 160.53 | 66.44 |
| Morning | 36 | 187.98 | 173.96 | 176.24 | 89.76 |
| Evening | 45 | 164.55 | 142.46 | 157.88 | 91.79 |
Finally, as shown in Table IV, there was good agreement between the PM samples and 24‐hour sodium excretion in identification of patients with sodium excretion > or <100 mEq/d (κ=0.71). Specifically, sensitivity in identifying patients with sodium excretion <100 mEq/d was 100% (12 of 12) and specificity was 82% (27 of 33). The random and AM samples performed less well (κ=0.38 and 0.33, respectively).
Table IV.
Classification of Patients With Low (<100 mEq/d) vs Not Low (≥100 mEq/d) Sodium Excretion
| 24‐H Urine Na Excretion | ||
|---|---|---|
| <100 | ≥100 | |
| Random samplea | ||
| Predicted 24‐h Na excretion <100 | 4 | 7 |
| Predicted 24‐h Na excretion ≥100 | 1 | 24 |
| Morning sampleb | ||
| Predicted 24‐h Na excretion <100 | 5 | 8 |
| Predicted 24‐h Na excretion ≥100 | 2 | 21 |
| Evening samplec | ||
| Predicted 24‐h Na excretion <100 | 12 | 6 |
| Predicted 24‐h Na excretion ≥100 | 0 | 27 |
aκ=0.38, P=.01. bκ=0.33, P=.03. cκ=0.71, P<.001.
Correlations between predicted and actual 24‐hour sodium excretion were not modified by age or BMI. The number of patients who were normotensive or who had a serum creatinine >1.5 was too small to permit subset analysis.
Regarding diuretic treatment status, correlations were equally strong among patients taking a diuretic and those not taking a diuretic (r=0.86, n=22 and r=0.81, n=13, respectively, for PM samples). For patients taking a thiazide diuretic, correlations were also strong (r=0.94, n=17, for PM samples). The small number of patients taking a loop diuretic (n=8) precluded meaningful assessment of the effect of loop diuretics. Of 14 patients who were taking a potassium‐sparing diuretic, 11 were concomitantly taking a loop diuretic or thiazide diuretic, precluding assessment of the effect of potassium‐sparing diuretics.
Discussion
The results indicate that the sodium/creatinine ratio from a spot urine sample collected in the late afternoon or early evening before dinner (the PM sample), and adjusted for 24‐hour creatinine excretion, accurately predicts 24‐hour sodium excretion. It also enables differentiation of patients with low sodium intake (<100 mEq/d) from those with higher sodium intake, with an accuracy, considering both sensitivity and specificity together, of 87%.
Variability of Sodium Intake
It is impossible for an estimate of sodium excretion from a spot urine sample to correlate precisely with 24‐hour excretion, because sodium intake and excretion constantly change. The variability of sodium intake also affects 24‐hour collections, as anywhere from three to eight 24‐hour collections, an obviously unrealistic option, have been suggested as necessary to provide a representative estimate of sodium excretion. 10 , 11 , 12
In this context, the strong correlation between the PM sample and the 24‐hour sodium excretion and the option of conveniently obtaining serial spot samples on different days, as often as desired, argue that spot urine testing might actually be superior to a once‐only 24‐hour collection in characterizing an individual’s usual level of sodium intake.
The results are consistent with previous studies that examined spot urine sodium/creatinine ratio adjusted for estimated creatinine excretion among normotensive Japanese persons, and extend those findings to a population of hypertensive white and African American persons. 7 , 8 , 9 Tanaka and colleagues7 reported a correlation coefficient of 0.54 between predicted and actual 24‐hour sodium excretion, examining spot urine values submitted at random times of day, coinciding with initiation of 24‐hour collection. 7 In the present study, the correlation between the AM sample, which was collected upon initiation of the 24‐hour collection, and 24‐hour sodium excretion was 0.31, whereas the correlation for the PM sample was stronger.
Kawasaki and colleagues, 9 using the second morning void on the day the 24‐hour urine collection was completed, reported a correlation coefficient of 0.53. Among patients who provided three 24‐hour collections, the correlation coefficient increased to 0.82. 9 Kamata and colleagues used overnight collections and a sampling pipe, and reported a correlation of 0.78. 8
Overcoming Barriers to Spot Urine Testing of Sodium Excretion
In this study we sought to maximize accuracy of predicting 24‐hour sodium excretion from a spot urine by addressing interfering factors (Table V). Among them, interindividual differences in 24‐hour creatinine excretion and time of day, are of particular importance.
Table V.
Barriers to Development of a Spot Urine Test for Assessment of 24‐Hour Urine Sodium Excretion
| Interindividual differences in 24‐hour creatinine excretion |
| Time of day |
| Variability of sodium intake |
| Effect of meals and intense exercise |
| Effect of incomplete collections |
Interindividual Differences in 24‐Hour Creatinine Excretion As discussed above, the meaningfulness of the sodium/creatinine ratio is considerably reduced if it is interpreted without taking into account the substantial interindividual differences in 24‐hour creatinine excretion. This concern would also be problematic in estimating the 24‐hour excretion of other analytes from a spot urine analyte/creatinine ratio. For example, the albumin/creatinine ratio overestimates microalbuminuria in women more than it does in men, attributable to the lower excretion of creatinine in women. 13 The false‐positive rate also increases with aging, also likely due to a fall in creatinine excretion. 14
In this study, adjustment of the sodium/creatinine ratio for patients’ 24‐hour creatinine excretion improved correlations between predicted and actual 24‐hour sodium excretion. Since the purpose of the spot urine test is to eliminate the need for a 24‐hour urine collection, either a one‐time 24‐hour urine collection to assess creatinine excretion or, much more conveniently, a reasonable estimation of 24‐hour creatinine excretion would be necessary. The latter is being assessed in ongoing studies.
Effect of Time of Day We sought to assess whether the time of day of the collection of the spot sample affects the accuracy of estimation of 24‐hour sodium excretion. The first morning void, or an overnight collection, was not assessed in this study because of the known considerable differences between nocturnal and diurnal rates of sodium excretion. 15 , 16 , 17 , 18 In most normotensive individuals, nocturnal sodium excretion, and hence the sodium content of the first morning void, are lower than diurnal values, whereas in many hypertensive individuals, they are considerably higher, particularly among those with a nondipping salt‐sensitive form of hypertension. 15
In this study, the AM samples, ie, the second morning void, obtained at the start of the 24‐hour collection, and the random samples, collected at or after its completion, did not correlate as well with 24‐hour sodium excretion as did the PM samples. Although the PM sample performed better than the AM sample, this seeming superiority might simply reflect the timing of the PM sample near the midpoint of the 24‐hour collection. It is possible that AM samples might perform just as well in a study examining evening‐to‐evening 24‐hour collections, in which the AM sample would be near the midpoint.
Effect of Meals and Intense Exercise Although an individual’s 24‐hour creatinine excretion is traditionally regarded as being constant, it does vary by as much as 10% to 20%, largely attributable to the level of protein intake and intense exercise on a given day. 19 , 20 , 21 , 22 , 23 Since urine creatinine concentration increases during the first few hours after a high‐protein meal or intense exercise, it would be preferable to obtain spot urine samples at least 3 to 4 hours after such activities. 22 , 23 In this study, the PM sample was collected prior to the evening meal to avoid effects of a high‐protein meal. Patients were not specifically instructed to avoid strenuous exercise prior to sample collections, and the performance of such exercise could have been a confounding factor. This, however, would have weakened rather than overstated the observed correlations.
The Problem of Incomplete Collections A major problem in assessing the accuracy of the spot urine method is the inaccuracy of the 24‐hour collection with which it is being compared. Incomplete collections could reduce the correlation between the spot urine and 24‐hour results, regardless of the accuracy of the spot urine method. 4 In this study, several collections appeared incomplete, based on 24‐hour creatinine values, which would, if anything, have reduced rather than increased the strength of the correlations observed, although re‐analysis after exclusion of data from patients whose 24‐hour collections appeared incomplete (24‐hour creatinine <15 mg/kg in women and <20 mg/kg in men 4 ) did not affect the correlations.
Limitations
An important concern in estimating sodium excretion from a spot urine sample is the possible confounding effect of diuretic use, particularly loop diuretics, which would initially increase and subsequently decrease the spot urine sodium excretion rate. In this study, 57% of patients were taking a diuretic, including 40% who were taking a thiazide diuretic. The accuracy of the test did not differ between patients taking a diuretic or thiazide diuretic and those not taking any diuretic. The effect of loop diuretics and potassium‐sparing diuretics could not be meaningfully assessed because of the small number of patients taking them. The effects of the various diuretic classes on spot urine results, and the effect of the interval since the most recent diuretic ingestion need to be examined in a larger study. The accuracy of the spot urine in individuals with advanced renal insufficiency was also not assessed, because of small numbers.
Estimation of sodium excretion from a spot urine sample is best performed at a time of metabolic and hemodynamic stability. Sampling at times of instability might provide misleading estimates.
Conclusions
The sodium/creatinine ratio of a late afternoon/early evening urine sample obtained near the midpoint of the 24‐hour collection strongly correlated with actual 24‐hour sodium excretion. The importance of adjusting the sodium/creatinine ratio for the individual’s 24‐hour creatinine excretion was demonstrated, suggesting that a convenient method for estimating 24‐hour urine creatinine is necessary in accurately estimating 24‐hour excretion of sodium or any other analyte from a spot urine sample. The strong correlations observed, the convenience, the option of serial sampling, and the low cost argue for renewed consideration of the spot urine method for assessing sodium excretion in clinical practice and in epidemiologic studies, particularly given the rarity of monitoring of sodium intake in clinical practice today.
Disclosures: Study funding was provided by the Julia and Seymour Gross Foundation and by Allied Minds, Inc. The authors have applied for intellectual property rights concerning this and other related research directed toward development of a method for estimation of sodium excretion from spot urine samples.
References
- 1. Schachter J, Harper PH, Radin ME, et al. Comparison of sodium and potassium intake with excretion. Hypertension. 1980;2:695–699. [DOI] [PubMed] [Google Scholar]
- 2. Pietinen P, Tanskanen A, Tuomilehto J. Assessment of sodium intake by a short dietary questionnaire. Scand J Soc Med. 1982;10:105–112. [DOI] [PubMed] [Google Scholar]
- 3. Bentley B. A review of methods to measure dietary sodium intake. J Cardiovasc Nurs. 2006;21:63–67. [DOI] [PubMed] [Google Scholar]
- 4. Christopher‐Stine L, Petri M, Astor BC, et al. Urine protein‐to‐creatinine ratio is a reliable measure of proteinuria in lupus nephritis. J Rheumatol. 2004;31:1557–1559. [PubMed] [Google Scholar]
- 5. Setaro JF, Black HR. Refractory hypertension. N Engl J Med. 1992;32:543–547. [DOI] [PubMed] [Google Scholar]
- 6. Calhoun DA, Jones D, Textor S, et al. Resistant hypertension: diagnosis, evaluation, and treatment. A scientific statement from the American Heart Association Professional Education Committee of the Council for High Blood Pressure Research. Hypertension. 2008;51:1403–1419. [DOI] [PubMed] [Google Scholar]
- 7. Tanaka T, Okamura T, Miura K, et al. A simple method to estimate populational 24‐h urinary sodium and potassium excretion usinga casual urine specimen. J Hum Hypertens. 2002;16:97–103. [DOI] [PubMed] [Google Scholar]
- 8. Kamata K, Tochikubo O. Estimation of 24‐h urinary sodium excretion using lean body mass and overnight urine collected by a pipe‐sampling method. J Hypertens. 2002;20:2191–2197. [DOI] [PubMed] [Google Scholar]
- 9. Kawasaki T, Itoh K, Uezono K, et al. A simple method for estimating 24 h urinary sodium and potassium excretion from second morning voiding urine specimen in adults. Clin Exper Pharmacol Phys. 1993;20:7–14. [DOI] [PubMed] [Google Scholar]
- 10. Liu K, Cooper R, McKeever J, et al. Assessment of the association between habitual salt intake and high blood pressure: methodological problems. Am J Epidemiol. 1979;110:219–226. [DOI] [PubMed] [Google Scholar]
- 11. Liu K, Stamler J. Assessment of sodium intake in epidemiological studies on blood pressure. Ann Clin Res. 1984;16(suppl 43):49–54. [PubMed] [Google Scholar]
- 12. Langford HG, Watson RL. Electrolytes, environment and blood pressure. Clin Sci Mol Med. 1973;45(suppl 1):111s–113s. [DOI] [PubMed] [Google Scholar]
- 13. Mattix HJ, Hsu C‐Y, Shaykevich S, et al. Use of the albumin/creatinine ratio to detect microalbuminuria: implications of sex and race. J Am Soc Nephrol. 2002;13:1034–1039. [DOI] [PubMed] [Google Scholar]
- 14. Houlihan CA, Tsalamandris C, Akdeniz A, et al. Albumin to creatinine ratio: a screening test with limitations. Am J Kidney Dis. 2002;39:1183–1189. [DOI] [PubMed] [Google Scholar]
- 15. Sachdeva A, Weder AB. Nocturnal sodium excretion, blood pressure dipping, and sodium sensitivity. Hyperrtension. 2006;48:527–533. [DOI] [PubMed] [Google Scholar]
- 16. Dyer AR, Stamler R, Grimm R, et al. Do hypertensive patients havea different diurnal pattern of electrolyte excretion? Hypertension. 1987;10:417–424. [DOI] [PubMed] [Google Scholar]
- 17. Dyer AR, Martin GJ, Burton WN, et al. Blood pressure and diurnal variation in sodium, potassium, and water excretion. J Hum Hypertens. 1998;12:363–371. [DOI] [PubMed] [Google Scholar]
- 18. Staessen JA, Birkenhager W, Bulpitt CJ, et al. The relationship between blood pressure and sodium and potassium excretion during the day and at night. J Hypertens. 1993;11:443–447. [DOI] [PubMed] [Google Scholar]
- 19. Webster J, Garrow JS. Creatinine excretion over 24 hours as a measure of body composition or of completeness of urine collection. Hum Nutr Clin Nutr. 1985;39:101–106. [PubMed] [Google Scholar]
- 20. Bingham SA, Cummings JH. The use of creatinine output as a check on the completeness of 24‐hour urine collections. Hum Nutr Clin Nutr. 1985;39:343–353. [PubMed] [Google Scholar]
- 21. Edwards OM, Bayliss RI, Millen S. Urinary creatinine excretion as an index of the copleteness of 24‐hour urine collections. Lancet. 1969;2:1165–1166. [DOI] [PubMed] [Google Scholar]
- 22. Calles‐Escandon J, Cunningham JJ, Snyder P, et al. Influence of exercise on urea, creatinine, and 3‐methylhistidine excretion in normal human subjects. Am J Physiol. 1984;246:E334–E338. [DOI] [PubMed] [Google Scholar]
- 23. Mayersohn M, Conrad KA, Achari R. The influence of a cooked meat meal on creatinine plasma concentration and creatinine clearance. Br J Clin Pharmacol. 1983;15:227–230. [DOI] [PMC free article] [PubMed] [Google Scholar]