

Abstract
J Clin Hypertens(Greenwich). 2010;12:588–596. © 2010 Wiley Periodicals, Inc.
The authors evaluated the significance of metabolic syndrome (MetS) diagnosis, as defined by the National Cholesterol Education Program (NCEP) and by the International Diabetes Federation (IDF), in the evaluation of cardiovascular risk in hypertensive patients. Among 638 patients, the prevalence of MetS was 54.7% when the IDF criteria were used, compared with 45.5% when the NCEP criteria were used. MetS correlated significantly with the presence of cardiovascular disease (CVD). In patients without type 2 diabetes mellitus (T2DM), only MetS diagnosed using the IDF criteria was associated with the presence of CVD. In those with T2DM, MetS was not associated with CVD, regardless of the criteria used. The diagnosis of MetS, using either set of criteria, was associated with the development of T2DM. We conclude that, in hypertensive patients without diabetes, a diagnosis of MetS according to IDF criteria, but not the NCEP criteria, is useful in identifying individuals with a higher probability of incident CVD. In patients with diabetes, a population already considered at high risk for CVD, a diagnosis of MetS, regardless of the criteria used, has no further impact on prognosis.
Cardiovascular disease (CVD) is the main cause of death in various populations, being responsible for 37.7% of all deaths in the American population. 1 Various risk factors for CVD have been identified, among which are smoking, type 2 diabetes mellitus (T2DM), hypertension, dyslipidemia, and visceral obesity. 2 There has been a consistent increase in the prevalence of visceral obesity, which has attenuated the increase in life expectancy. According to the World Health Organization (WHO), the number of overweight and obese individuals worldwide will reach 1.5 billion by 2015. 1
Visceral obesity is intimately linked to metabolic syndrome (MetS), which is a disorder involving cardiovascular risk factors that are typically associated with insulin resistance. 3 Various studies have demonstrated that MetS correlates with an increase in the number of cardiovascular events and in the occurrence of T2DM. 4 , 5 The 2006 prevalence of MetS was estimated to range from 6.7% (between 20 and 29 years old) to 43% (between 60 and 69 years old). 1
Due to the high cardiovascular morbidity and mortality associated with MetS, 6 , 7 the appropriate characterization of the syndrome is extremely relevant. Among individuals with MetS, the mortality rate is twice as high as in those without. In addition, the incidence of CVD and cerebral vascular accident is 3 times higher in individuals with MetS than in those without. 5 Furthermore, the risk of developing T2DM is 5 times greater among patients with MetS than among those without. 8 , 9 However, the lack of a universal standard for MetS criteria hinders understanding of the magnitude of its impact on the occurrence of these events. Although the Executive Summary of the Third Report of the National Cholesterol Education Program (NCEP) Expert Panel on Detection, Evaluation, and Treatment of High Blood Cholesterol in Adults (ATP III) criteria are easier to apply, evidence suggests that cardiovascular risk is increased at blood glucose and waist circumference values lower than those initially recommended. 10 , 11 , 12 Therefore, in 2005, the International Diabetes Federation (IDF) reformulated the criteria for the classification of MetS and designated waist circumference as an essential component of the definition, specific cut‐off points for individuals of various ethnicities were also established. 13
The aim of the present study was to analyze the significance of MetS, defined using either set of criteria in CVD among hypertensive patients with and without diabetes mellitus.
Methods
Patients were selected among those treated at the Integrated Center for Hypertension and Cardiovascular Metabolism of the Universidade Federal de São Paulo (UNIFESP, Federal University of São Paulo) with the following inclusion criteria: at least 18 years old, patients presenting at least one component of MetS, and wash‐out of 1 month from lipid modifying agents. The study protocol was approved by the UNIFESP Ethics in Research Committee. All individuals participating in the study gave written informed consent. The study was conducted in accordance with the Declaration of Helsinki and with Brazilian National Ministry of Health Resolution CNS 196/96.
Patients presenting active infectious or inflammatory diseases were excluded, as were pregnant/breastfeeding patients and patients with human immunodeficiency virus. The use of the following medications was discontinued in the 4 weeks preceding inclusion in the study: 3‐hydroxy‐3‐methylglutaryl coenzyme A reductase inhibitors (statins); cholesterol absorption inhibitors such as ezetimibe; probucol; cholestyramine; niacin; fibric acid derivates (fibrates); and drugs for treating obesity (orlistat and sibutramine). Temporary discontinuation of medications that alter the lipid profile was aimed at facilitating the appropriate characterization of MetS.
The patients were submitted to anamnesis and physical examination, in which weight, height, blood pressure (BP), and waist circumference were determined. Body mass index (BMI) was calculated by dividing weight in kilograms by height in meters squared (kg/m2). Blood pressure was obtained by a trained operator in the sitting position after 5 minutes of rest. A mercury sphygmomanometer was used according to a standard protocol and BP was calculated as the average after excluding the first of 4 measurements. 14
For analysis of the metabolic profile, 30 mL of blood were collected from each participant after a 12‐hour fast. Fasting glycemia, serum levels of uric acid, total cholesterol, and triglycerides were determined using an automated enzymatic‐colorimetric method. Fractions of high‐density lipoprotein (HDL) cholesterol were measured using enzyme homogeneous colorimetric method and low‐density lipoprotein cholesterol was calculated using the Friedewald formula. The analyzer used was the Roche Hitachi 912 (Roche Hitachi, Montreal, QC, Canada). Serum levels of C‐reactive protein (CRP) were determined using chemiluminescence immunoassay (Diagnostic Products Corporation, Los Angeles, CA).
The glomerular filtration rate was estimated using the equations described in the Modification of Diet in Renal Disease (MDRD) study. 15 The diagnosis of T2DM was made based on fasting glycemia and the need for treatment with hypoglycemic agents. CVD was defined as the presence of coronary heart disease (evidence of silent myocardial infarction or myocardial ischemia, history of unstable angina or stable angina pectoris, and history of coronary angioplasty or coronary artery surgery) or coronary heart disease (CHD) risk equivalent (stroke, peripheral arterial disease, abdominal aortic aneurysm, carotid artery disease, renal artery disease), according to American Heart Association guidelines. 16 To complete the data collection and review of medical records, we used computerized hospital registers to identify hospitalizations due to stroke, CHD, and atherosclerotic vascular events for all participants.
The patients were classified according to a diagnosis of MetS, based on the NCEP and IDF criteria, 17 as shown in Table I. The NCEP criteria define MetS as the presence of 3 or more of the following factors: elevated BP ≥130/85 mm Hg; waist circumference >102 cm for men and >88 cm for women; plasma triglycerides ≥150 mg/dL; HDL cholesterol <40 mg/dL in men and <50 mg/dL in women; and blood glucose ≥110 mg/dL. The guidelines proposed by the IDF identify waist circumference (≥94 cm for men and ≥80 cm for women) as an essential component for the diagnosis of MetS. Therefore, in order to meet the IDF criteria for MetS, an individual must present a large waist circumference, as well as at least 2 of the following factors: elevated BP ≥130/85 mm Hg; plasma triglycerides ≥150 mg/dL; HDL cholesterol <40 mg/dL in men and <50 mg/dL in women; and blood glucose ≥100 mg/dL.
Table I.
NCEP and IDF Definitions of Metabolic Syndrome
| IDF Definition | NCEP Definition |
|---|---|
| Waist circumference ≥94 cm (for men) and ≥80 cm (for women) plus any 2 of the following | Presence of 3 or more of the components: |
| 1. TG ≥150 mg/dL | 1. Waist circumference >102 cm (for men) and >88 cm (for women) |
| 2. HDL‐C <40 mg/dL (for men) and <50 mg/dL (for women) | 2. TG ≥150 mg/dL |
| 3. BP ≥130/85 mm Hg | 3. HDL‐C <40 mg/dL (for men) and <50 mg/dL (for women) |
| 4. Fasting glucose ≥100 mg/dL | 4. BP ≥130/85 mm Hg |
| 5. Fasting glucose ≥110 mg/dL |
Abbreviations: BP, blood pressure; HDL‐C, high‐density lipoprotein cholesterol; IDF, International Diabetes Federation; NCEP, National Cholesterol Education Program; TG, triglycerides.
For those patients with primary prevention, cardiovascular risk was calculated using the Framingham score, which establishes the absolute 10‐year risk of coronary artery disease (CAD) by sex. The risk factors employed are as follows: age; smoking; family history of CVD, HDL; and systolic BP. The score for each risk factor is calculated and associated with the absolute risk of CAD according to the percentage risk (low, medium or high).
Statistics
Data are expressed as means and standard deviations for variables with regular distribution and as medians for nonparametric variables. To test the differences found between patients with T2DM and those without diabetes in terms of the various variables analyzed, the Student t‐test (for parametric variables) and the chi‐square test (for nonparametric variables) were used. The groups were divided according to the presence or absence of T2DM, as well as to the presence or absence of MetS. The chi‐square test was carried out to determine whether MetS correlated with CVD. One model of binary logistic regression was employed, using CVD as a dependent variable. We included the following as independent variables: sex; age; creatinine clearance; serum levels of CRP; smoking; microalbuminuria; and a diagnosis of MetS according to IDF criteria. A receiver operating characteristic curve was constructed, and the area under the curve (AUC) was used in order to evaluate the value of a diagnosis of MetS, as defined using the NCEP criteria, the IDF criteria, and the Framingham score, in predicting the occurrence of CVD. In all tests, the level of statistical significance required to reject the null hypothesis was set at 5%. The statistical analysis was conducted using the Statistical Package for the Social Sciences, version 15.0 (SPSS, Inc., Chicago, IL).
Results
The sample consisted of 664 patients, but 26 of them were excluded because they did not fulfill the hypertension definition criteria. Women represented 66.8% of the studied population (426 patients). The mean age was 57.7±5.7 years and was similar for men and women. There were 202 patients with T2DM (31.7%). Of the 638 patients evaluated, 68 (10.7%) were smokers, and 64 (10.1%) had established CVD. The cardiovascular events were distributed as follows: 50 patients with CHD, 37 patients with CHD risk equivalent (30 patients with stroke, 7 patients with other vascular diseases), as described in the methods, and 23 patients with both criteria.
Of the 426 women in the sample, 334 (78.6%) were postmenopausal, and 12 (3.5%) of those were under hormone replacement therapy. In the sample as a whole, 262 (41.1%) of the patients were overweight (BMI ≥25 and <30 kg/m2) and 263 (41.2%) were obese (BMI ≥30 kg/m2) (Table II). There were 23.2% patients with low HDL (<40 mg/dL in men and <50 mg/dL in women), and 40.3% of the patients had elevated triglycerides.
Table II.
Demographic Characteristics and Biochemical Evaluation of Patients With and Without Metabolic Syndrome According to the 2 Sets of Criteria
| Diagnosis of MetS Using NCEP Criteria | Diagnosis of MetS Using IDF Criteria | |||||
|---|---|---|---|---|---|---|
| Yes | No | P Valuea | Yes | No | P Valuea | |
| n (%) | n (%) | n (%) | n (%) | |||
| n | 290 (45) | 348 (55) | 349 (54.7) | 289 (45.3) | ||
| Female, n (%) | 205 (70.7) | NS | 242 (96.3) | NS | ||
| Age, y | 57.9±9.5 | 57.6±10.5 | NS | 57.9±9.5 | 57.6±11.0 | NS |
| BMI, kg/m2 | 32.1±4.7 | 27.5±4.6 | <.05 | 31.4±4.9 | 27.5±4.7 | <.05 |
| SBP, mm Hg | 139±19 | 136±20 | <.05 | 138±19 | 136±21 | NS |
| DBP, mm Hg | 86±11 | 84±11 | NS | 86±11 | 85±11 | NS |
| Waist circumference men, cm | 105.8±10 | 94.1±8.5 | <.05 | 105.1±8.4 | 92.3±9.1 | <.05 |
| Waist circumference women, cm | 101.3±10 | 90.0±12 | <.05 | 99.3±11 | 90.9±12 | <.05 |
| TC, mg/dL | 213.5±45 | 209.2±37 | NS | 213.2±44 | 209.2±37 | NS |
| HDL‐C, mg/dL | 50.8±13 | 61.9±15 | <.05 | 52.3±13 | 62±16 | <.05 |
| LDL‐C, mg/dL | 123.9±38 | 123.2±33 | NS | 124.5±37 | 122.4±34 | NS |
| TG, mg/dL | 197.8±111 | 120.5±62 | <.05 | 186.7±107 | 118.2±61 | <.05 |
| Glucose, mg/dL | 117.8±49 | 93.1±34 | <.05 | 115.1±46 | 91.3±37 | <.05 |
| Uric acid, mg/dL | 6.0±1.6 | 5.2±1.6 | <.05 | 5.9±1.6 | 5.3±1.6 | <.05 |
| Creatinine clearance, mL/min/1.73 m2 | 68.8±15 | 71.5±12.8 | <.05 | 69.5±14 | 71.2±13 | NS |
| Microalbuminuria, μg/min | 62.8±233 | 18.6±118 | <.05 | 45.6±175 | 30.2±187 | NS |
| CRP, mg/dL | 0.7±0.8 | 0.5±0.6 | <.05 | 0.7±0.7 | 0.5±0.6 | <.05 |
| Framingham score | 15±3.7 | 13±4.3 | <.05 | 14.7±3.7 | 13.1±4.5 | <.05 |
Abbreviations: BMI, body mass index; CRP, C‐reactive protein; DBP, diastolic blood pressure; HDL‐C, high‐density lipoprotein cholesterol; IDF, International Diabetes Federation; LDL‐C, low‐density lipoprotein cholesterol; MetS, metabolic syndrome; NCEP, National Cholesterol Education Program; NS, not significant; SBP, systolic blood pressure; TC, total cholesterol; TG, triglycerides. avs patients without MetS.
According to the criteria defined by the IDF, 349 (54.7%) of the patients presented MetS, compared with only 290 (45.5%) according to the NCEP criteria (P<.05).
A diagnosis of MetS was associated with a >20% 10‐year risk of CAD, and this was true for the use of the NCEP criteria and the IDF criteria (odds ratio [OR], 5.98; 95% confidence interval [CI], 4.2–8.6 vs OR, 5.84; 95% CI, 4.0–8.6; P<.05 for both, respectively). A diagnosis of MetS was associated with CVD using the NCEP criteria or the IDF criteria (OR, 2.04; 95% CI, 1.2–3.4 vs OR, 2.68; 95% CI, 1.5–4.8; P<.05 for both).
An NCEP or IDF criteria‐based diagnosis of MetS was also associated with the development of T2DM (OR, 6.8; 95% CI, 4.7–10.0 vs OR, 8.4; 95% CI, 5.4–13.0; P<.05 for both).
When the population was subdivided into patients with T2DM and those without diabetes, the correlation between the diagnoses of MetS, using either set of criteria, and a history of CVD began to differ. In the group without diabetes (Table III), the association between an NCEP criteria‐based diagnosis of MetS and a history of CVD ceased to exist (OR, 1.99; 95% CI, 0.9–4.3; P=NS). However, the correlation between an IDF criteria‐based diagnosis of MetS and a history of CVD remained significant (OR, 2.4; 95% CI, 1.1–5.2; P=.029).
Table III.
Demographic Characteristics and Biochemical Evaluation of Patients Without Diabetes
| Diagnosis of MetS Using NCEP Criteria | Diagnosis of MetS Using IDF Criteria | |||||
|---|---|---|---|---|---|---|
| Yes | No | P Valuea | Yes | No | P Valuea | |
| n (%) | n (%) | n (%) | n (%) | |||
| n | 137 (31.4) | 298 (68.3) | 177 (40.6) | 285 (59.2) | ||
| Female, n (%) | 104 (75.9) | NS | 129 (72.9) | NS | ||
| Age, y | 56.1±9.4 | 57.2±10.8 | NS | 56.3±9.3 | 57.2±11.0 | NS |
| BMI, kg/m2 | 32.2±5.0 | 27.8±4.7 | <.05 | 31.3±5.2 | 27.7±4.7 | <.05 |
| SBP, mm Hg | 139±19 | 137±20 | NS | 138±19 | 137±20 | NS |
| DBP, mm Hg | 88±11 | 85±11 | <.05 | 87±11 | 85±11 | <.05 |
| Waist circumference men, cm | 104.3±9 | 94.6±9 | <.05 | 103.5±6.1 | 93.3±9.8 | <.05 |
| Waist circumference women, cm | 101.3±10.6 | 90.5±11.8 | <.05 | 99.1±11.4 | 90.5±12 | <.05 |
| TC, mg/dL | 218.9±42 | 211.3±36 | NS | 218.5±41 | 210.4±36 | <.05 |
| HDL‐C, mg/dL | 48.1±10 | 62.2±15 | <.05 | 50.2±11 | 63.0±15 | <.05 |
| LDL‐C, mg/dL | 130.6±37 | 124.6±33 | NS | 130.4±36 | 124.0±33 | NS |
| TG, mg/dL | 204.4±85 | 122.3±59 | <.05 | 195.4±85 | 115.8±53 | <.05 |
| Glucose, mg/dL | 88.8±12 | 84.2±10 | <.05 | 89.5±12 | 83±9 | <.05 |
| Uric acid, mg/dL | 6.1±1.5 | 5.3±1.5 | <.05 | 6.0±1.5 | 5.2±1.5 | <.05 |
| Creatinine clearance, mL/min/1.73 m2 | 69.7±14 | 71.1±13 | NS | 70.1±13 | 71±13 | NS |
| Microalbuminuria, μg/min | 29.8±107 | 12.7±57 | <.05 | 25.1±95 | 13.7±60 | NS |
| CRP, mg/dL | 0.7±0.7 | 0.5±0.6 | <.05 | 0.7±0.7 | 0.5±0.6 | <.05 |
| Framingham score | 15±3.7 | 13±4.5 | <.05 | 14.7±3.7 | 13.2±4.6 | <.05 |
Abbreviations: BMI, body mass index; CRP, C‐reactive protein; DBP, diastolic blood pressure; HDL‐C, high‐density lipoprotein cholesterol; IDF, International Diabetes Federation; LDL‐C, low‐density lipoprotein cholesterol; MetS, metabolic syndrome; NCEP, National Cholesterol Education Program; NS, not significant; SBP, systolic blood pressure; TC, total cholesterol; TG, triglycerides. avs patients without MetS.
The 202 patients with T2DM (Table IV) accounted for 31.7% of the sample, and 120 (59.4%) of those patients were women. Within this subgroup, already considered high risk, 16 (7.9%) were smokers and 39 (19.3%) had established CVD (OR, 3.7; 95% CI, 2.2–6.2; P<.05 vs a history of CVD in patients without diabetes). The use of NCEP criteria in patients with T2DM resulted in a 75.7% prevalence of MetS, compared with 85.1% when the IDF criteria were used. However, a diagnosis of MetS presented no association with a history of CVD, whether MetS was defined using the NCEP criteria (OR, 0.8; 95% CI, 0.4–1.7; P=.54) or the IDF criteria (OR, 0.9; 95% CI, 0.4–2.5, P=1.0).
Table IV.
Demographic Characteristics and Biochemical Evaluation of Patients With Diabetes
| Diagnosis of MetS Using NCEP Criteria | Diagnosis of MetS Using IDF Criteria | |||||
|---|---|---|---|---|---|---|
| Yes | No | P Valuea | Yes | No | P Valuea | |
| n (%) | n (%) | n (%) | n (%) | |||
| n | 153 (75.7) | 49 (24.3) | 172 (85.1) | 30 (14.9) | ||
| Female, n (%) | 113 (65.7) | <.05 | 101 (66) | <.05 | ||
| Age, y | 59.5±9.4 | 60.5±8.5 | NS | 57.5±9.3 | 60.8±8.5 | NS |
| BMI, kg/m2 | 32.0±4.5 | 26.2±3.7 | <.05 | 31.5±4.6 | 25.7±4.6 | <.05 |
| SBP, mm Hg | 139±18 | 127±17 | <.05 | 138±18 | 124.7±17 | <.05 |
| DBP, mm Hg | 85±11 | 79.7±8 | <.05 | 84±11 | 80±9 | NS |
| Waist circumference men, cm | 106.6±11 | 92.6±6.4 | <.05 | 106.4±9.7 | 88.8±5 | <.05 |
| Waist circumference women, cm | 101.3±9.5 | 85.4±13.3 | <.05 | 99.5±10.5 | 87.9±22.5 | <.05 |
| TC, mg/dL | 208.6±48 | 196.2±41 | NS | 207.7±47 | 193.9±45 | NS |
| HDL‐C, mg/dL | 53.1±15 | 59.6±17 | <.05 | 54.5±15 | 55.9±20 | NS |
| LDL‐C, mg/dL | 117.8±38 | 114.8±35 | NS | 118.3±37 | 110.1±38 | NS |
| TG, mg/dL | 192.0±130 | 109.6±73 | <.05 | 177.6±126 | 139.8±106 | NS |
| Glucose, mg/dL | 143.8±55 | 147.5±66 | NS | 141.5±52 | 163.0±82 | NS |
| Uric acid, mg/dL | 6.0±1.7 | 5.2±0.2 | <.05 | 5.8±1.7 | 5.7±2.5 | NS |
| Creatinine clearance, mL/min/1.73 m2 | 68±16 | 74.4±14 | <0.05 | 69.9±15 | 73.3±16 | NS |
| Microalbuminuria, μg/min | 92.7±303 | 53.2±276 | NS | 66.7±228 | 176.5±542 | NS |
| CRP, mg/dL | 0.7±0.8 | 0.4±0.6 | <.05 | 0.7±0.7 | 0.5±0.7 | NS |
| Framingham score | 14.8±3.7 | 13±3.2 | <.05 | 14.6±3.7 | 12.9±3.0 | <.05 |
Abbreviations: BMI, body mass index; CRP, C‐reactive protein; DBP, diastolic blood pressure; HDL‐C, high‐density lipoprotein cholesterol; IDF, International Diabetes Federation; LDL‐C, low‐density lipoprotein cholesterol; MetS, metabolic syndrome; NCEP, National Cholesterol Education Program; NS, not significant; SBP, systolic blood pressure; TC, total cholesterol; TG, triglycerides. avs patients without MetS.
The binary logistic regression model included the presence of CVD as a dependent variable and the following as independent variables which were significantly associated with CVD in univariate analyzes: sex; age; serum levels of uric acid; microalbuminuria; serum levels of CRP; smoking; creatinine clearance, as calculated using the MDRD method; and a diagnosis of MetS. Using this model, only an IDF criteria‐based diagnosis of MetS and uric acid were found to be predictors of CVD (Table V). The AUC for the power of a diagnosis of MetS to predict a history of CVD was greater when the IDF criteria were used (AUC = 0.724; 95% CI, 0.66–0.789) than when the NCEP criteria were used (AUC = 0.703; 95% CI, 0.634–0.776; P<.05) or when the Framingham score was used (AUC = 0.659; 95% CI, 0.69–0.73; P<.05) (Figure).
Table V.
Odds Ratio for Cardiovascular Disease in a Multivariate Analysis Using MetS IDF as an Independent Variable
| Odds Ratio | 95% CI | ||
|---|---|---|---|
| MetS IDFa | 1.969 | 1.06 | 3.659 |
| Uric acida | 1.332 | 1.094 | 1.298 |
| Sex | 1.733 | 0.925 | 3.248 |
| CRP | 1.130 | 0.785 | 1.625 |
| Age | 1.013 | 0.982 | 1.044 |
| Microalbuminuria | 0.999 | 0.997 | 1.001 |
| Creatinine clearance | 0.986 | 0.963 | 1.009 |
| Smoking | 0.906 | 0.35 | 2.343 |
Abbreviations: CRP, C‐reactive protein; MetS IDF, metabolic syndrome, as defined by the International Diabetes Federation. a P<.05.
Figure.
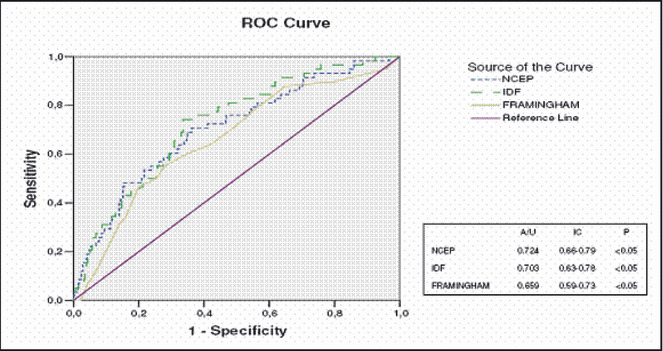
Receiver operating characteristic (ROC) curve: cardiovascular disease in relation to the Framingham score, as well as to metabolic syndrome according to the National Cholesterol Education Program (NCEP) and International Diabetes Federation (IDF) criteria. A/U indicates area under the curve; IC, confidence interval.
Discussion
In the present study, we evaluated a final sample of 638 patients with hypertension and found the prevalence of MetS to be 45.5% when patients were analyzed according to NCEP criteria, compared with 54.7% when IDF criteria were applied. It was similar to that reported by the American Heart Association Statistics Committee and Stroke Statistics Subcommittee, 1 which found the prevalence of MetS, according to NCEP criteria, to be 43.5% in the American population between 60 and 69 years of age. In contrast, Ford and colleagues 18 evaluated 20,050 American noninstitutionalized individuals over the age of 20 in the Third National Health and Nutrition Examination Survey (NHANES) and found the NCEP criteria‐based prevalence of MetS to be 23.9%. The higher prevalence of MetS in our sample can be attributed to the inclusion of a greater number of older patients, as well as to the fact that our sample was composed of patients with at least one MetS component.
Comparing the 2 sets of criteria, the prevalence of MetS was higher when the IDF criteria were used than when the NCEP criteria were used. Our data are in accordance with the results of Lorenzo and associates. 19 The authors compared American individuals of 2 ethnicities (Hispanics and Caucasians), and, in both groups, more patients with MetS were identified when the IDF criteria were used. In addition, in a recent analysis involving 20,789 outpatient evaluations conducted as part of the NHANES between 1999 and 2002, Katzmarzyk and colleagues demonstrated that the prevalence of MetS according to IDF criteria was 50% greater that that determined using the NCEP criteria. 20
Regardless of the criteria used, MetS contains variables which increase the risk of CVD. 7 , 12 Despite this fact, not all studies associate MetS with a risk of CVD. The INTERHEART study 2 was a case‐control study involving 262 treatment facilities in 52 countries and evaluating the principal predictive factors of cardiovascular events. The study identified the variables responsible for 95% of the risk of CVD, especially myocardial infarction. In the subanalysis of that study, a diagnosis of MetS, as defined by NCEP criteria, was not predictive of CVD. In the present study, a diagnosis of MetS, regardless of the set of criteria used, was clearly associated with CVD. However, this association seemed to be at least partially dependent upon the inclusion of patients with T2DM. In fact, when patients with T2DM were excluded, the correlation between MetS and CVD remained significant only when the IDF criteria were used. It could be a result of high prevalence of MetS in patients with diabetes.
Our results are in accordance with those of Lakka and associates and Eckel and colleagues, 4 , 21 who demonstrated a correlation between an NCEP criteria‐based diagnosis of MetS and CVD, as well as with those of Nisson and associates, 22 who showed that an IDF criteria‐based diagnosis of MetS correlates with a significant increase in the occurrence of CVD. In fact, among individuals without diabetes, the mortality rate and incidence of CVD are 2 times and 3 times higher, respectively, for those with an IDF criteria‐based diagnosis of MetS than for those without MetS. In addition, the risk of developing T2DM is 5 times greater for individuals with MetS. 8 It is possible that the elevated prevalence of CVD associated with MetS is due to insulin resistance, 23 which is associated with endothelial dysfunction and the atherosclerosis process.
Our study showed that the IDF definition has higher accuracy in identifying individuals at higher cardiovascular risk compared with NCEP ATP III criteria. The IDF MetS definition emphasizes waist circumference, an established index of abdominal obesity. Abdominal obesity has been described as an independent risk factor for CVD, and predicts increased risk of morbidity and mortality beyond that explained by BMI alone. 24
Due to a strong association between larger waist circumference and insulin resistance, the IDF definition of MetS includes, as an obligatory criterion, a larger waist circumference, with cutoff values determined by gender and ethnicity. 25 On the basis of epidemiological data, the waist circumference cutoff point has been reduced for various ethnic groups. 26 , 27 , 28 , 29 Tan and colleagues 29 studied 4723 individuals of different ethnicities in Singapore and observed that when MetS was defined using lower values of waist circumference (<80 cm in women and <90 cm in men, values similar to those proposed by the IDF), it was possible to identify patients at risk for CVD with greater reliability than when NCEP values were used.
In a recent evaluation of MetS sponsored by the American Association of Diabetes and the European Association for the Study of Diabetes, Bruno and associates 30 found that, in patients with diabetes, a diagnosis of MetS has little or no value in determining CVD mortality risk. The study involved 1565 patients with diabetes in outpatient treatment for 8 years. The authors found the prevalence of MetS to be 76%, and the relative risk for all‐cause mortality, as well as for cardiovascular mortality, in the group with MetS was similar to that of patients with T2DM without MetS. A retrospective analysis conducted by Cull and colleagues, 31 involving data from the United Kingdom Prospective Diabetes Study, provided a better evaluation of the association between MetS and CVD in patients with diabetes through the simultaneous analysis of different definitions of MetS in a more than 50,000 person‐years of follow‐up evaluation. In that analysis, there was a considerable superimposition in the estimate of risk of CVD in 10 years between T2DM patients with and without MetS, and the authors attributed limited clinical value to the diagnosis of MetS for the stratification of cardiovascular risk in patients with T2DM. Our data are in accordance with those cited, since we did not find a correlation between MetS and CVD when we evaluated patients with T2DM, regardless of the criteria used to define MetS. However, in patients without diabetes, a diagnosis of MetS based solely on the IDF criteria was associated with a higher frequency of CVD.
In the present investigation, some limitations should be put into consideration. The cross‐sectional nature of this study precludes definitive causal inferences about the association between each MetS criterion and CVD. Patients were selected among those that attended a specific clinic and had to have at least one component of MetS to be included. Moreover, this study included only individuals with hypertension, and the conclusions refer specifically to this population.
We conclude that, in hypertensive patients without diabetes, a diagnosis of MetS according to IDF criteria, but not the NCEP criteria, is useful in identifying individuals with a higher probability of incident CVD. In patients with diabetes, a population already considered at high risk for CVD, a diagnosis of MetS, regardless of the criteria used, has no further impact on prognosis. Nevertheless, in patients without diabetes, a diagnosis of MetS, regardless of the criteria used, can identify individuals more likely to develop T2DM.
Acknowledgments and disclosures: This work was supported by São Paulo Research Foundation—FAPESP.
References
- 1. Thom T, Haase N, Rosamond W, et al.; American Heart Association Statistics Committee and Stroke Statistics Subcommittee . Heart disease and stroke statistics—2006 update: a report from the American Heart Association Statistics Committee and Stroke Statistics Subcommittee. Circulation. 2006;113:e85–e151. [DOI] [PubMed] [Google Scholar]
- 2. Yusuf S, Hawken S, Ounpuu S, et al.; INTERHEART Study Investigators . Effect of potentially modifiable risk factors associated with myocardial infarction in 52 countries (the INTERHEART study): case‐control study. Lancet. 2004;364:937–952. [DOI] [PubMed] [Google Scholar]
- 3. Opie LH. The Metabolic Syndrome. Circulation. 2007;115:e32–e35. [DOI] [PubMed] [Google Scholar]
- 4. Lakka HM, Laasksonen DE, Lakka TA, et al. The metabolic syndrome and total cardiovascular disease mortality in middle‐aged men. JAMA. 2002;288:2709–2716. [DOI] [PubMed] [Google Scholar]
- 5. Isomaa B, Almgren P, Tuomi T, et al. Cardiovascular morbidity and mortality associated with the metabolic syndrome. Diabetes Care. 2001;24:683–89. [DOI] [PubMed] [Google Scholar]
- 6. Ford ES. The metabolic syndrome and mortality from cardiovascular disease and all‐causes: findings from National Health and Nutrition Examination Survey II Mortality Study. Atherosclerosis. 2004;173:309–314. [DOI] [PubMed] [Google Scholar]
- 7. Girman CJ, Rhodes T, Mercury M, et al.; The 4S group, the AFCAPS/Texas research group . The metabolic syndrome and risk of major coronary events in the Scandinavian Simvastatin Survival Study (4S) and Air Force/Texas Coronary Atherosclerosis Prevention Study. Am J Cardiol. 2004;93:136–141. [DOI] [PubMed] [Google Scholar]
- 8. Stern MP, Williams K, González‐Villalpando C, et al. Does the metabolic syndrome improve identification of individuals at risk of type 2 diabetes and/or cardiovascular disease? Diabetes Care. 2004;27:2676–2681. [DOI] [PubMed] [Google Scholar]
- 9. Albeit KG, Zimmet PZ. Definition, diagnosis and classification of diabetes mellitus and its complication. Part 1: diagnosis and classification of diabetes mellitus provisional report of a WHO consultation. Diabet Med. 1998;15:539–553. [DOI] [PubMed] [Google Scholar]
- 10. Expert Panel on Detection, Evaluation and Treatment of High Blood Cholesterol in Adults . Executive Summary of the Third Report of the National Cholesterol Education Program (NCEP) Expert Panel on Detection, Evaluation and Treatment of High Blood Cholesterol In Adults (Adult Treatment Panel III). JAMA. 2001;285:2486–2497. [DOI] [PubMed] [Google Scholar]
- 11. Oh JY, Hong YS, Sung YA. Prevalence and factor analysis of metabolic syndrome in urban Korean population. Diabetes Care. 2004;27:2027–2032. [DOI] [PubMed] [Google Scholar]
- 12. Gang H, Qiao Q, Tuomilehto J, et al.; for DECODE Study Group . Prevalence of the metabolic syndrome and its relation to all case and cardiovascular mortality in nom diabetic European men and women. Arch Intern Med. 2004;164:1066–1076. [DOI] [PubMed] [Google Scholar]
- 13. Alberti KGMM, Zimmet P, Shaw J. The metabolic syndrome: a new worldwide definition. Lancet. 2005;366:1059–1062. [DOI] [PubMed] [Google Scholar]
- 14. Perloff D, Grim C, Flack J, et al. Human blood pressure determination by sphygmomanometry. Circulation. 1993;88:2460–2470. [DOI] [PubMed] [Google Scholar]
- 15. Levey A, Bosch J, Lewis JB, et al. A more accurate method to estimate glomerular filtrations rate from serum creatinin: a new prediction equation. Modification of Diet in Renal Disease Study Group. Ann Intern Med. 1999;130:461–470. [DOI] [PubMed] [Google Scholar]
- 16. National Cholesterol Education Program, National Heart, Lung and Blood Institute, National Institutes of Health . Third Report of the National Cholesterol Education Program (NCEP) Expert Panel on Detection, Evaluation, and Treatment of High Blood Cholesterol in Adults (Adult Treatment Panel III). Circulation. 2002;106:3143–3421. [PubMed] [Google Scholar]
- 17. Alberti KG, Zimmet P, Shaw J. Metabolic syndrome: a new world‐wide definition: a consensus statement from the International Diabetes Federation. Diabet Med. 2006;23:469–480. [DOI] [PubMed] [Google Scholar]
- 18. Ford ES. Prevalence of the metabolic syndrome defined by the International Diabetes Federation among adults in the U.S. Diabetes Care. 2005;28:2745–2749. [DOI] [PubMed] [Google Scholar]
- 19. Lorenzo C, Willians K, Hunt K, et al. The National Cholesterol Education Program‐Adult Treatment Panel III, International Diabetes Federation, and World Health Organization definitions of the metabolic syndrome as predictors of incident cardiovascular disease and diabetes. Diabetes Care. 2007;30:8–13. [DOI] [PubMed] [Google Scholar]
- 20. Katzmarzyk PT, Janssen I, Ross R, et al. The importance of waist circumference in definition of metabolic syndrome. Diabetes Care. 2006;29:404–984. [DOI] [PubMed] [Google Scholar]
- 21. Eckel RH, Grundy SM, Zimmet PZ. The Metabolic Syndrome. Lancet. 2005;366:1923–1923. [DOI] [PubMed] [Google Scholar]
- 22. Nilsson PM, Engstron G, Hedblad B. The metabolic syndrome and incidence of cardiovascular disease in non‐diabetic subjects—a population‐based study comparing three different definitions. Diabet Med. 2007;24:464–472. [DOI] [PubMed] [Google Scholar]
- 23. International Diabetes Federation . The IDF consensus worldwide definition of the metabolic syndrome. Available at: http://www.idf.org/webdata/docs/MetS_def_update2006.pdf. Accessed April 9, 2010..
- 24. Rexrode KM, Carey VJ, Hennekens CH, et al. Abdominal adiposity and coronary heart disease in women. JAMA. 1998;280:1843–1848. [DOI] [PubMed] [Google Scholar]
- 25. Ford ES, Giles WH, Dietz WH. Prevalence of the metabolic syndrome among US adults: findings from the Third National Health and Nutrition Examination Survey. JAMA. 2002;287:356–359. [DOI] [PubMed] [Google Scholar]
- 26. Meigs JB, Wilson PW, Nathan DM, et al. Prevalence and characteristics of the metabolic syndrome in the Santo Antonio Heart and Framingham Offspring Studies. Diabetes. 2003;52:2160–2167. [DOI] [PubMed] [Google Scholar]
- 27. Resnick HE, Jones K, R’uotolo G, et al. Insulin resistance, the metabolic syndrome, and risk of incident cardiovascular disease in non diabetics American Indians: the Strong Heart Study. Diabetes Care. 2003;26:861–867. [DOI] [PubMed] [Google Scholar]
- 28. Snehatala C, Viswanathan V, Ramachandran A. Cutoff values for normal anthropometric variables in Asian Indian adults. Diabetes Care. 2003;26:1380–1384. [DOI] [PubMed] [Google Scholar]
- 29. Tan CE, Ma S, Wai D, et al. Can we apply The NCEP definition of metabolic syndrome in Asians? Diabetes Care. 2004;27:182–186. [DOI] [PubMed] [Google Scholar]
- 30. Bruno G, Merlleti F, Biggeri A, et al.; Casale Monferrato Study . Metabolic syndrome as a predictor of all‐cause and cardiovascular mortality in type 2 diabetes: the Casale Monferrato Study. Diabetes Care. 2004;27:2689–2694. [DOI] [PubMed] [Google Scholar]
- 31. Cull AC, Jensen CC, Retnakaran R, et al. Impact of the metabolic syndrome on macrovascular and microvascular outcomes in type 2 diabetes mellitus. Circulation. 2007;116:2119–2126. [DOI] [PubMed] [Google Scholar]