
Fig. 7.
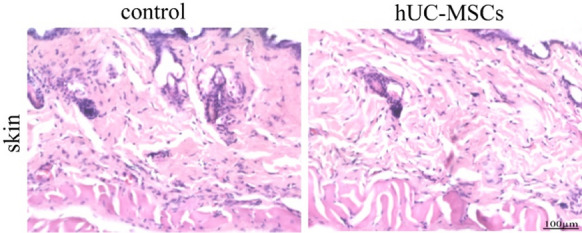
Pathological hematoxylin–eosin staining analysis of the hUC-MSCs injection site in nude mice. There was no significant difference between hUC-MSCs and control group. Bar = 100 μm
Official websites use .gov
A
.gov website belongs to an official
government organization in the United States.
Secure .gov websites use HTTPS
A lock (
) or https:// means you've safely
connected to the .gov website. Share sensitive
information only on official, secure websites.
Pathological hematoxylin–eosin staining analysis of the hUC-MSCs injection site in nude mice. There was no significant difference between hUC-MSCs and control group. Bar = 100 μm