Abstract
Purpose
Protein tyrosine phosphatase receptor type T (PTPRT), which is a well‐known phosphatase and mutates frequently in melanoma and non‐small cell lung cancer (NSCLC). Our research aims to elucidate its mutation association with immune checkpoint inhibitors (ICI) efficacy.
Methods
We integrated whole‐exome sequencing (WES)‐based somatic mutation profiles and clinical characteristics of 631 melanoma samples received ICI agents from eight studies and 109 NSCLC samples from two studies. For validation, 321 melanoma and 350 NSCLC immunotherapy samples with targeted next‐generation sequencing (NGS) were employed. Besides, an independent NSCLC cohort contained 240 samples was also collected for further corroboration. Distinct immune infiltration was evaluated according to the PTPRT mutational status.
Results
In the WES melanoma cohort, patients with PTPRT mutations harbored a significantly elevated ICI response rate (40.5% vs. 28.6%, p = 0.036) and a prolonged survival outcome (35.3 vs. 24.9 months, p = 0.006). In the WES NSCLC cohort, the favorable response and immunotherapy survival were also observed in PTPRT‐mutated patients (p = 0.036 and 0.019, respectively). For the validation cohorts, the associations of PTRPT mutations with better prognoses were identified in melanoma, NSCLC, and pan‐cancer patients with targeted‐NGS (all p < 0.05). Moreover, immunology analyses showed the higher mutation burden, increased lymphocyte infiltration, decreased‐ activated‐stroma, and immune response pathways were detected in patients with PTPRT mutations.
Conclusion
Our investigation indicates that PTPRT mutations may be considered as a potential indicator for assessing ICI efficacy in melanoma and NSCLC, even across multiple cancers. Further prospective validation cohorts are warranted.
Keywords: biomarker, immunotherapy, melanoma, NSCLC, PTPRT mutation
Our study suggests that PTPRT mutations may serve as a strong biomarker to assess ICI efficacy in melanoma and NSCLC, even across multiple cancers.

1. INTRODUCTION
The survival outcome of advanced or metastatic cancer patients has been markedly prolonged owing to the emergence of immune checkpoint inhibitors (ICI). The ICI treatments have become the first‐line selection for several cancers, such as melanoma and non‐small cell lung cancer (NSCLC). 1 , 2 , 3 Nevertheless, only a fraction of patients exhibited the clinical benefits of ICI agents. The three FDA‐approved immunotherapy efficacy indicators, including programmed‐death ligand‐1 (PD‐L1) expression, 3 microsatellite instability (MSI), 4 and tumor mutation burden (TMB) 5 exhibit remarkable effects in clinical practice. However, they are sometimes ineffective in evaluating ICI responses.
The protein tyrosine phosphatase receptor type T (PTPRT), which contains 37 exons and spans over 500 kilobases, is a member of the PTP family. Recent two studies provided in vivo and in vitro evidence and demonstrated that PTPRT normally acts as a cancer suppressive mediator in colon tumor. 6 , 7 In addition, PTPRT has been determined as a significantly mutated gene (SMG) in lung squamous cell carcinoma, 8 colorectal cancer, 9 and melanoma. 10 Chen et al. reported that PTPRT mutations may be associated with gastric cancer metastasis. 11 Another study involved in lung adenocarcinoma revealed that the African American patients had a markedly elevated PTPRT mutations than the European American patients and suggested the clinical significance for the recruitment of the minority population in clinical trials. 12 Based on the mutational profile of The Cancer Genome Atlas (TCGA) derived from the cBioPortal, the alteration rate of PTPRT was 29.9% in melanoma and >10% in patients with lung adenocarcinoma, stomach, colorectal, uterine, and esophageal cancers. 13
Recent studies have demonstrated that mutations in single genes, such as POLE, 14 PBRM1, 15 TTN, 16 MUC16, 17 B2M, 18 JAK1/2 19 , 20 were linked with ICI response or resistance. Specific mutational signatures, for example, tobacco smoking, APOBEC, and ultraviolet light exposure‐related signatures were frequently accumulated in ICI responders. 21 An activated‐stroma signature was identified to exhibit immune‐suppressive roles in cancer immunity. 22 The well‐known epithelial to mesenchymal transition (EMT) signal was also associated with tumor immune escape. 23 , 24
PTPRT is frequently mutated in tumors; nevertheless, its connection with ICI efficacy was incompletely elucidated. In this study, we first integrated ICI‐treated melanoma and NSCLC samples with whole‐exome sequencing to explore the link between PTPRT mutation and ICI survival. Then, melanoma and NSCLC samples with targeted next‐generation sequencing were also curated for further validation. Via multiple verifications, we here suggest the solid connection between PTPRT mutation and immunotherapy effect.
2. MATERIALS AND METHODS
2.1. Melanoma and NSCLC samples collection and study design
Whole‐exome sequencing (WES) based somatic mutation data of 631 melanoma patients received immune checkpoint inhibitors (ICI) agents (i.e., anti‐CTLA‐4, anti‐PD‐l/PD‐L1, or combination) were acquired from previous eight studies, 20 , 25 , 26 , 27 , 28 , 29 , 30 , 31 and 109 NSCLC patients were from two studies. 32 , 33 We used the Oncotator to uniformly re‐annotate all somatic mutations curated in this study. 34 Non‐synonymous alterations were used for analyses. The predicted MHC binding affinity scores and HLA types, which were used for evaluating neoantigen counts were curated from 224 melanoma 25 , 27 , 30 and 109 NSCLC samples. 32 , 33 The detailed sequencing and clinical characteristics, including age, sex, stage, ICI treatment information, and so on are illustrated in Table S1 for melanoma and Table S2 for NSCLC. A patient was considered to be efficacious to ICI treatment if the response status was complete response (CR) or partial response (PR).
A total of 1661 ICI‐treated pan‐cancer patients, who underwent the Integrated Mutation Profiling of Actionable Cancer Targets (MSK‐IMPACT) assay of a targeted 468‐gene next‐generation sequencing (NGS) at Memorial Sloan Kettering Cancer Center (MSKCC) were collected. 35 Among, 321 were melanoma patients and 350 were NSCLC. The detailed clinical and treatment information are shown in Table S3. Besides, another independent NSCLC cohort 36 contained 240 samples with also targeted‐NGS was employed for further corroboration (Table S4).
Gene expression, somatic mutation profiles, and clinical characteristics of 457 melanoma and 995 NSCLC samples derived from the TCGA were acquired from Genome Data Commons (https://gdc.cancer.gov). In this work, all mRNA expression‐related analyses were achieved by using the gene expression data from the TCGA. The workflow of this study is provided in Figure 1.
FIGURE 1.
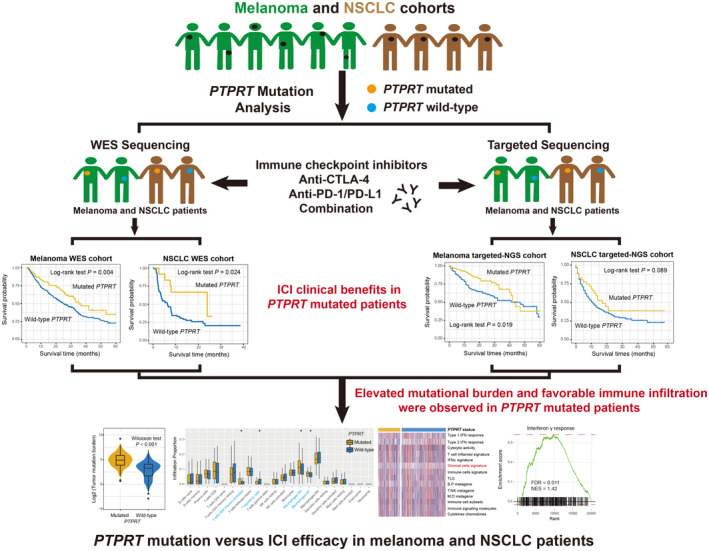
The flow chart of this work. Graphical abstract exhibition of the association of PTPRT mutations with immune checkpoint inhibitors efficacy and immune‐related factors in melanoma and NSCLC samples with distinct sequencing methods
2.2. Deciphering mutational signatures operative in the genome
The method proposed by Kim et al. 37 was employed to detect mutational signatures from integrated melanoma and NSCLC cohorts. The core of this algorithm is Bayesian variant nonnegative matrix factorization (NMF). Specifically, NMF was employed to decompose mutation portrait matrix A that contained the 96 base substitution classes. Matrix A was divided into two nonnegative matrices W and H (i.e., A ≈ WH), where W indicates the detected mutational signatures and H represents the mutation activities of each corresponding signature. The column of matrix A is the count of detected signatures and rows representing the 96 base substitution types. The rows and columns of matrix H indicate the individual signatures and their corresponding mutational activities, respectively. All extracted mutational signatures were subsequently annotated with the 30 well‐curated signatures stored in the COSMIC database (version 2) based on cosine similarity.
2.3. Evaluation of tumor infiltration immune cells
CIBERSORT algorithm was applied to infer the tumor infiltration proportion of 22 immune cell types based on the LM22 signature. 38 Angelova et al. established an 812‐immune‐metagene signature to infer 31 distinct immune cells infiltration and tumor immune landscape, 39 specific genes for each assessed immune cell are curated in Table S5. We used both methods to obtain comprehensive immune infiltration results.
2.4. Microenvironment‐based immune‐related signatures
Previously reported immune‐related signatures were collected as follows: (1) immune and stromal cells signatures, which respectively reflect the total immune and stromal cell infiltration levels in microenvironment 40 ; (2) immune cell subsets, enrichment of T cells, B cells, and NK cells 41 ; (3) T/NK, B/P, and M/D metagene, which respectively indicate the activities of T/NK cells, B/plasma cells, and monocytes/dendritic cells 42 ; (4) Type 1/2 IFN response, which are two distinct interferon response types functioned respectively by interferon α and γ 43 ; (5) IFNγ signature, which plays vital roles in the immune response and ICI efficacy 44 ; (6) T cell‐inflamed signature, a factor associated with IFNγ response 45 ; (7) immune cytolytic activity 43 ; (8) immune signaling molecules 41 ; (9) cytokines and chemokines 41 ; (10) TLS, which is tertiary lymphoid structures associated with inflammation response. 46 The detailed feature genes for each immune signature are shown in Table S6.
2.5. A signature of activated‐stroma
Moffitt et al. reported a stroma‐related signature, 22 which was defined by two distinct features (i.e., activated‐stroma and normal‐stroma). Based on the nearest template prediction (NTP) algorithm 47 with distinct feature gene subgroups, the activated stromal subtype could be identified.
2.6. GSVA and GSEA
Single sample gene set enrichment analysis (ssGSEA) method within GSVA package 36 was applied to infer the enrichment scores of all curated immune signatures for each sample based on the specific feature genes. Differential analysis of gene expression profile according to PTPRT mutation status was achieved with R package DESeq2. 37 The t values extracted from differential results were then employed to performed gene set enrichment analysis (GSEA) implemented by fgsea package (https://github.com/ctlab/fgsea). The well‐annotated pathways in hallmark gene sets and KEGG from Molecular Signatures Database (MSigDB) were used as the background signals. The false discovery rate (FDR) and normalized enrichment score (NES) were obtained based on 1 million permutations.
2.7. Association of PTPRT mutations with mutational burden
Genome instability is always influenced by alterations in genomic maintenance regulators. 48 Therefore, multivariate logistic regression models were performed with mutations in genomic maintenance genes (i.e., BRCA1/2, TP53, and POLE) and detected mutational signatures taken into consideration to obtain an adjusted association between PTPRT mutations and mutational burden. In our work, TMB was calculated as the log2 transformation of total non‐synonymous mutations per megabase in both WES and TCGA cohorts; for the targeted cohorts, TMB was acquired from the supplementary file. The neoantigen burden (NB) for 224 melanoma and 109 NSCLC WES samples was evaluated according to a recent method provide by Balachandran et al. 49 The neoantigen data of 340 melanoma and 656 NSCLC samples from the TCGA cohort were downloaded from the Cancer Immunome Atlas (TCIA, https://www.tcia.at/home).
2.8. Statistical analyses
R software (version 4.0.2) was used to complete related calculations. Mutational patterns for specific genes were illustrated with maftools package. 50 Heatmap representation of distinct subgroups was achieved based on pheatmap package. Survival curves were obtained by using the Kaplan–Meier approach and the Log‐rank test to analyze the differences. Multivariate Cox regression models embedded in forestmodel package were employed to control confounding variables and obtain the adjusted results. Correlation of continuous and categorical variables with PTPRT mutational status was assessed with Wilcoxon rank‐sum test and Fisher exact test, respectively. Two‐sided p values less than 0.05 were considered to be statistically significant.
3. RESULTS
3.1. PTPRT mutations in WES melanoma cohort
Of the 631 melanoma samples derived from eight WES immunotherapy studies, 193 (30.6%) were recognized as the ICI treatment responders. This integrated melanoma cohort was dominated by C > T mutations (Figure 2). The PTP family members and genome integrity maintenance genes (e.g., BRCA1, BRCA2, TP53, and POLE) with respect to PTPRT mutations are exhibited in the Figure 2. We observed that PTPRT was the most frequently mutated gene in the PTP family, contributing to 126 of 631 melanoma samples (20.0%). Detailed amino acid changes of PTPRT mutations are shown with the lollipop plot (Figure S1).
FIGURE 2.
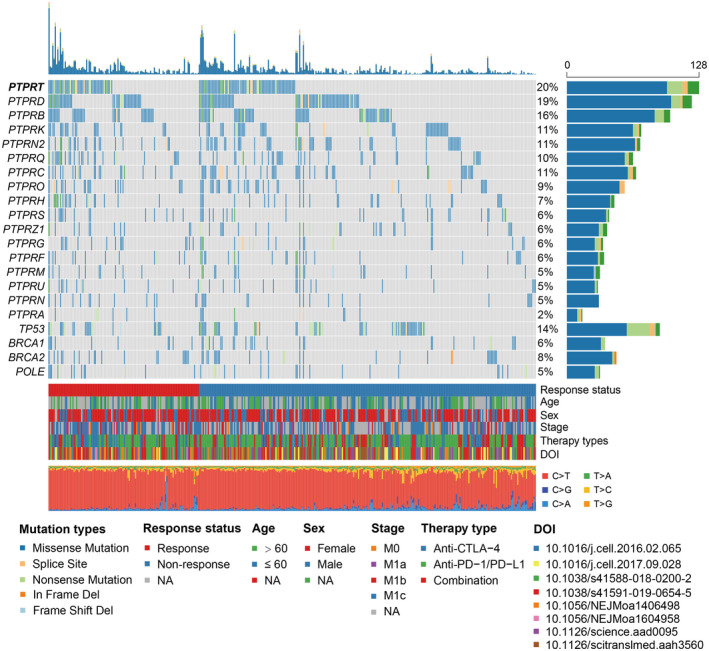
Waterfall plot representation of the mutational patterns of PTPRT, its family members, and genomic integrity maintenance genes. The left panel shows the gene symbols, the upper panel indicates the non‐synonymous mutation counts for each sample, the middle plot illustrates mutational patterns of the included genes with distinct mutation types colored distinctly, the right penal shows the mutation rate of each gene, and the bottom panel indicates immunotherapy response status, clinical characteristics, and base substitution categories
3.2. PTPRT mutations predictive of melanoma immunotherapy outcome and response
Results demonstrated that patients with PTPRT mutations harbored a significantly prolonged ICI prognosis as compared with those without such mutations (median survival time: 35.3 vs. 24.9 months, Log‐rank test p = 0.004; Figure 3A). This link was still existing when controlling for age, sex, stage, and therapy type in the multivariate Cox regression analysis (HR: 0.65, 95% CI: 0.48–0.88, p = 0.006; Figure 3B). Prognostic abilities of PTPRT mutations in the individual cohort and distinct treatment types were calculated and relevant results were shown as Figures S2 and S3, respectively. We observed that PTPRT mutations were also connected with the elevated immunotherapy response rate (40.5% vs. 28.6%, Fisher exact test p = 0.013; Figure 3C). Multivariate logistic model was conducted with clinical confounders taken into consideration and the result still reached the statistical significance (OR: 0.69, 95% CI: 0.41–0.96, p = 0.036; Figure 3D).
FIGURE 3.
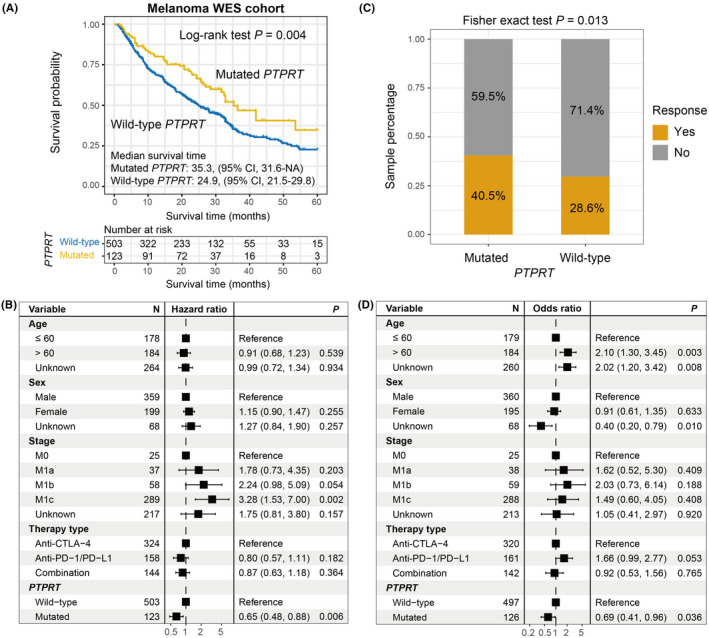
PTPRT mutations predictive of ICI efficacy in the aggregated melanoma WES cohort. (A) Kaplan–Meier curves of the distinct PTPRT status. (B) Forest plot representation of the connection between PTPRT mutations and ICI prognosis with clinical confounding factors taken into consideration. (C) Fisher exact test and (D) multivariate logistic regression model evaluation of PTPRT mutations versus ICI response rate
3.3. PTPRT mutations versus mutational burden in melanoma
The markedly higher TMB and NB were found in melanoma patients with PTPRT mutations (median TMB: 4.99 vs. 2.61, median NB: 5.01 vs. 2.98, both p < 0.001; Figure 4A,B). Since specific mutational signatures operative in the genome could result in genomic instability and variational mutation rates. We extracted four mutational signatures from this pooled melanoma cohort by annotating with COSMIC (Figure S4A); they are age‐related signature 1, smoking‐related signature 4, ultraviolet light exposure‐induced signature 7, and alkylating agent treatment‐induced signature 11 (Figure S4B). The extracted detailed mutational activities for melanoma cohort are exhibited in Table S7. To eliminate the probability that the connection between PTPRT mutations and TMB was influenced by other miscellaneous variables, we incorporated clinical factors, detected signatures (i.e., 1, 4, 7, and 11), and mutations of BRCA1/2, TP53, and POLE into the multivariate logistic analysis. Association of PTPRT mutations with TMB was still significative after adjusted analysis (OR: 11.82, 95% CI: 5.83–26.85, p < 0.001; Figure 4C). The consistent results of PTPRT mutations with elevated TMB and NB were also obtained based on the melanoma samples from the TCGA cohort (both p < 0.001; Figure 4D,E).
FIGURE 4.
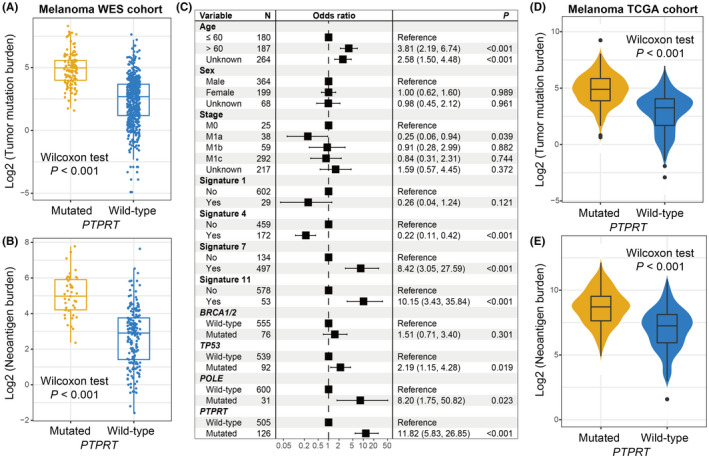
PTPRT mutations association with mutational burden in melanoma. Distribution of (A) TMB and (B) NB in distinct PTPRT subgroups in the pooled melanoma WES cohort. (C) Multivariate regression model underlying the association between PTPRT mutations and TMB with clinical features, extracted mutational signatures, and genome repair gene mutations taken into account to adjust confounders. Distribution of (D) TMB and (E) NB in distinct PTPRT subgroups in the TCGA melanoma cohort
3.4. PTPRT mutations association with ICI efficacy and mutational burden in WES NSCLC cohort
Of the 109 curated NSCLC WES samples, 36 (33.0%) were evaluated as the immunotherapy responders. PTPRT also mutated frequently in NSCLC, accounting for 12 of 109 patients (11.0%). Via the Kaplan–Meier survival analysis, we demonstrated that PTPRT‐mutated NSCLC patients exhibited a preferable ICI survival outcome than those wild‐type patients (median survival time: 24.0 vs. 6.3 months, Log‐rank test p = 0.024; Figure 5A). This link remained stable in the multivariate‐adjusted Cox model with confounding factors (i.e., age, sex, histology, smoking status, PD‐L1 expression, and therapy type) incorporated (HR: 0.32, 95% CI: 0.12–0.83, p = 0.019; Figure 5B). Prognosis analyses of PTPRT mutations in distinct cohorts and treatment types are illustrated in Figure S5. The further exploration showed that an enhanced ICI response rate was observed in patients with PTPRT mutations (58.3% vs. 32.2%, Fisher exact test p = 0.038; Figure 5C); and this link was still significant even adjusted for multiple confounders (OR: 0.15, 95% CI: 0.02–0.74, p = 0.027; Figure 5D).
FIGURE 5.
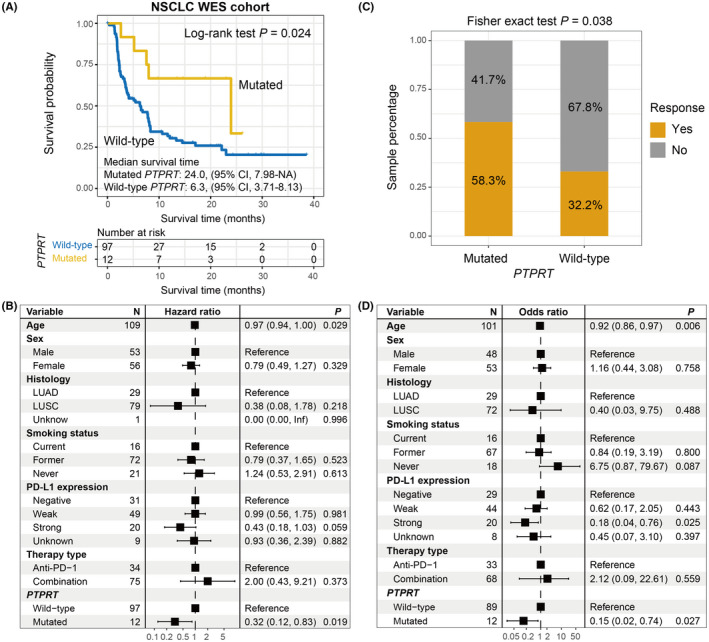
PTPRT mutations predictive of ICI efficacy in the aggregated NSCLC WES cohort. (A) Kaplan–Meier curves of the distinct PTPRT status. (B) Forest plot representation of the connection between PTPRT mutations and ICI prognosis with clinical confounding factors taken into consideration. (C) Fisher exact test and (D) multivariate logistic regression model evaluation of PTPRT mutations versus ICI response rate
In this WES NSCLC cohort, the markedly increased TMB and NB were found in PTPRT mutant patients (median TMB: 4.91 vs. 3.84, median NB: 9.27 vs. 7.73, both p < 0.001; Figure 6A,B). We extracted three mutational signatures from NSCLC patients (Table S8). In the multivariate logistic regression model, we included clinical variables, extracted signatures, and DNA repair gene mutations; and the connection between PTPRT mutations and higher TMB was still existing (OR: 61.71, 95% CI: 2.75–4113.06, p = 0.029; Figure 6C). Based on the NSCLC samples from TCGA, we also noticed the positive associations of PTPRT mutations with TMB and NB (both p < 0.001; Figure 6D,E).
FIGURE 6.
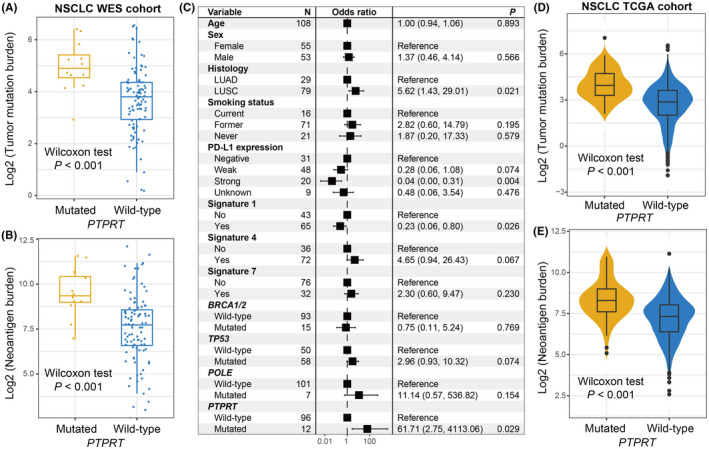
PTPRT mutations association with mutational burden in NSCLC. Distribution of (A) TMB and (B) NB in distinct PTPRT subgroups in the pooled NSCLC WES cohort. (C) Multivariate regression model underlying the association between PTPRT mutations and TMB with clinical features, extracted mutational signatures, and genome repair gene mutations taken into account to adjust confounders. Distribution of (D) TMB and (E) NB in distinct PTPRT subgroups in the TCGA NSCLC cohort
3.5. Corroboration in melanoma and NSCLC patients with targeted‐NGS
To validate the immunotherapy implications of PTPRT mutations, we employed 1661 ICI‐treated pan‐cancer patients with targeted‐NGS. Survival analysis showed that PTPRT mutations were linked with the favorable survival outcome across multiple cancers (Log‐rank test p < 0.001; Figure 7A). This link still reached statistical significance after adjusting age, sex, therapy type, metastasis status, and cancer type (HR: 0.73, 95%CI: 0.56–0.94, p = 0.015; Figure 7B). We subsequently evaluated PRPRT mutations versus prognosis in melanoma and NSCLC patients derived from this targeted pan‐cancer cohort. Accordant with aforementioned results, melanoma patients with PTPRT mutations harbored a markedly preferable ICI prognosis than those without such mutations in Kaplan–Meier analysis (Log‐rank test p = 0.019; Figure 7C) and multivariate Cox model (HR: 0.57, 95% CI: 0.36–0.90, p = 0.023; Figure 7D). For the NSCLC, a marginally significantly better prognosis was observed in PTPRT mutant subgroup in both univariate (Log‐rank test p = 0.089; Figure 7E) and multivariate analyses (HR: 0.73, 95% CI: 0.45–1.16, p = 0.121; Figure 7F). The elevated TMB of PTPRT mutations was also observed in pan‐cancer, melanoma, and NSCLC cohorts (all p < 0.001; Figure 7G–I).
FIGURE 7.
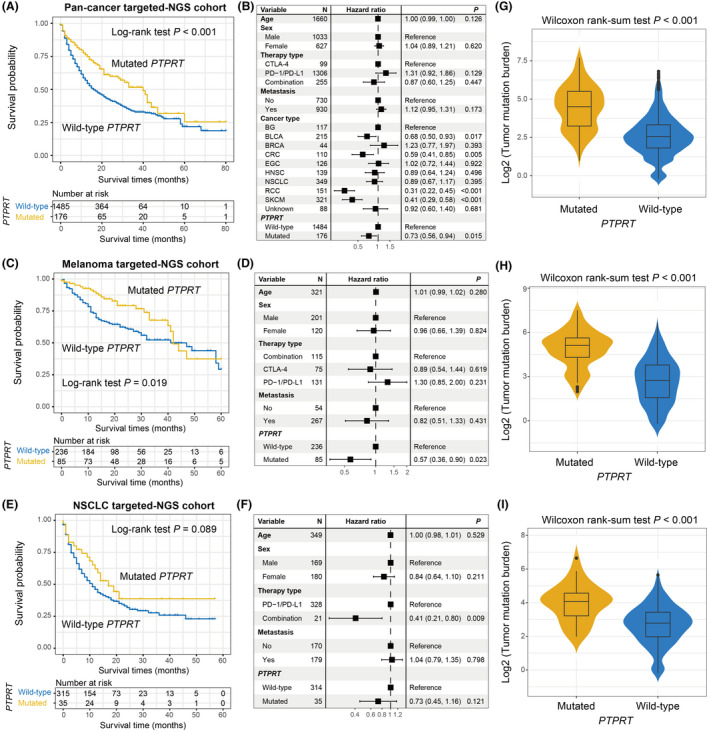
Validation of the link of PTPRT mutations with preferable ICI prognosis and elevated TMB with targeted‐NGS cohorts. Kaplan–Meier survival curves of distinct PTPRT groups and adjusted forest plots illustration in (A, B) pan‐cancer, (C, D) melanoma, and (E, F) NSCLC samples, respectively. Box plots showed the connections between PTPRT mutations and TMB in (G) pan‐cancer, (H) melanoma, and (I) NSCLC samples, respectively
3.6. Further corroboration in an independent NSCLC cohort with targeted‐NGS
From Rizvi et al. study, 36 we obtained 240 NSCLC samples who underwent targeted sequencing and ICI treatments. We further validated the prognosis roles of PTPRT mutations in this independent cohort. As expected, PTPRT mutations are connected with a favorable ICI survival (Log‐rank test p = 0.029; Figure 8A), and this association was still significant in multivariate‐adjusted model (HR: 0.58, 95% CI: 0.34–0.97, p = 0.039; Figure 8B). In addition, the increased immunotherapy response rate was also noticed in patients with PTPRT mutations via Fisher exact test (52.0% vs. 27.7%, p = 0.021; Figure 8C) and logistic regression model (OR: 0.35, 95% CI: 0.15–0.84, p = 0.019; Figure 8D). PTPRT mutant group also had a markedly higher TMB than wild‐type group in this cohort (Wilcoxon rank‐sum test p < 0.001; Figure S6).
FIGURE 8.
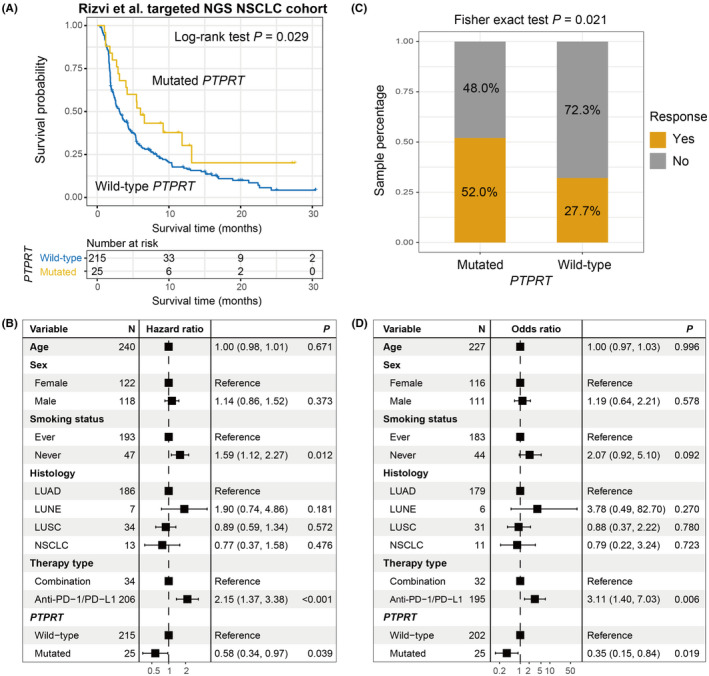
Further corroboration with an independent targeted NSCLC cohort. (A) Kaplan–Meier curves of the distinct PTPRT status. (B) Forest plot representation of the connection between PTPRT mutations and ICI prognosis with clinical confounding factors taken into consideration. (C) Fisher exact test and (D) multivariate logistic regression model evaluation of PTPRT mutations versus ICI response rate
3.7. Immunocyte infiltration, immune‐relevant signatures, and pathways associated with PTPRT mutations
Considering the crucial roles of PTPRT mutations for immunotherapy prognosis evaluation, we explored the potential mechanisms behind PTPRT mutations in melanoma. Immune cell analysis showed that more infiltration of immune‐responsive cells (i.e., activated CD4 and CD8 T cells, effector memory CD4 T cells, and M1 macrophages) and lesser infiltration of immune‐suppressive cells (i.e., regulatory T cells) were connected with PTPRT mutations (Wilcoxon rank‐sum test, all p < 0.05; Figure 9A,B). Besides, we also observed the decreased abundance of mast cells (p = 0.002; Figure 9B), which were previously revealed as an immune inhibitor. 51 , 52 The ssGSEA analysis against gene expression profile indicated that of 14 immune signatures, the stromal cell signature enrichment was negatively associated with PTPRT mutations (p = 0.006; Figure 9C). Moreover, a reduced proportion of activated‐stroma, which plays immune‐suppressive roles, was simultaneously observed in the PTPRT mutant group (Fisher exact test p = 0.039; Figure 9D). GSEA pathway results (Figure S7) suggested that two interferon‐mediated immune signals, including IFNα and IFNγ responses, were both enriched in the top circuits of patients with PTPRT mutations (NES = 1.71 and 1.42, respectively; both FDR <0.05; Figure 9E,F). Consistently, the well‐known EMT pathway, which promotes tumor immune escape, was absent in the PTPRT mutant group (NES = −1.97, FDR = 0.026; Figure 9G).
FIGURE 9.
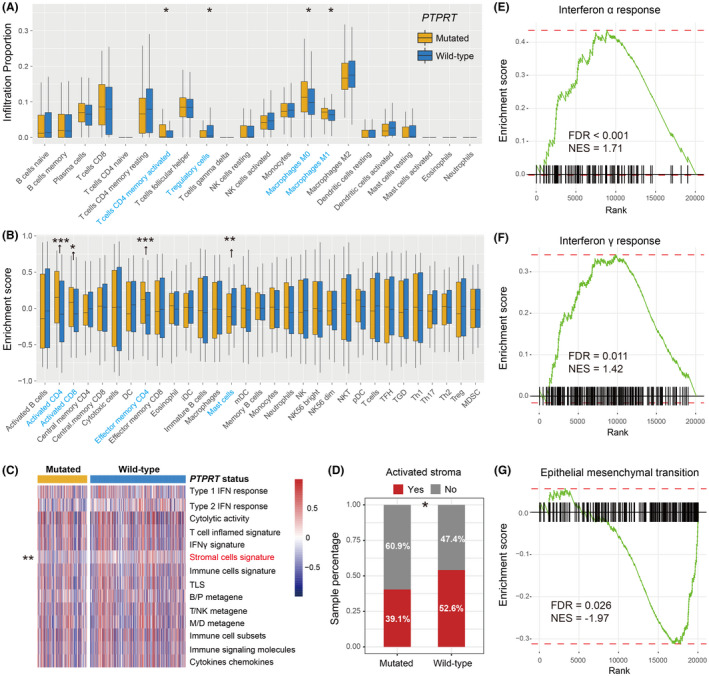
Immunology analyses of PTPRT mutations in melanoma. The abundance of distinct immune infiltration cells was calculated with (A) CIBERSORT and (B) Angelova et al. methods, separately. Significantly differentially infiltrated immune cells between two subgroups were highlighted with blue. (C) Heatmap illustrated the enrichment scores of immune‐related signatures in PTPRT mutated versus wild‐type patients. The significantly differentially enriched immune signature between two subgroups was highlighted with red. (D) Distinct distribution proportion of activated‐stroma subtype in PTPRT mutated versus wild‐type patients. Enrichment of the immune‐relevant pathways, such as (E) Interferon α and (F) Interferon γ responses in the PTPRT‐mutated group. (G) Enrichment of the immune‐suppressive EMT signaling pathway in the PTPRT wild‐type group. * p < 0.05; ** p < 0.01; *** p < 0.001
In NSCLC, the enhanced infiltration of CD8 T cells and M1 macrophages (both p < 0.05), reduced infiltration of M2 macrophages (p = 0.026), and immune response‐relevant circuits (e.g., antigen processing and presentation, graft‐versus‐host disease, and allograft rejection) were also observed in PTPRT‐mutated patients (Figure S8A,B).
4. DISCUSSION
We conducted an integrative immunotherapy analysis of PTPRT mutations in melanoma and NSCLC patients with both WES and targeted sequencing. Results indicated that PTPRT mutations were linked with the prolonged ICI survival outcome and response rate, which may be attributed to the more favorable immune infiltration and enhanced mutational burden. A strength of this work is that our observations were cross‐validated with distinct cancer types and sequencing platforms. These findings demonstrate that PTPRT mutations may be considered as a strong indicator for evaluating immunotherapy effect in melanoma, NSCLC, even across multiple cancers.
Besides melanoma and NSCLC, PTPRT was also frequently mutated in other several cancers, such as stomach, colorectal, uterine, and esophageal cancers, as described by the cBioPortal TCGA data. PTPRT was always not considered as the SMG candidate due to its large size. Two similar genes were TTN and MUC16, but recent studies have revealed their mutations were strongly correlated with the favorable prognosis or immunotherapy outcome, 16 , 53 suggesting their potential roles for immunotherapy evaluation. Mechanisms under the connection between PTPRT mutation and immune response are not fully elucidated. A leading explanation indicates that PTPRT plays phosphorylation functions involved in the JAK‐STAT pathway, 54 , 55 which is a critical mediator in T cell immunity, 56 PD‐1 signal, 57 and antigen presentation. 58
Recently numerous studies have been revealed that PTPs played vital roles in the immune regulation. PTPRA was reported to regulate the lymphocyte function via the modulation of oncogenic FYN signaling. 59 PTPRC is a key point of T/B cell antigen receptor activation in leukemia and lymphoma. 60 Aberrations of PTPRD were identified to implicate in chronic lymphocytic leukemia, 61 and PTPRD was demonstrated as the tumor suppressor in hepatocellular carcinoma by regulating the PD‐1/PD‐L1 axis. 62 In lung adenocarcinoma, the elevated metastasis ability and decreased NK cell activity were identified to be associated with PTPRN overexpression. 63 PTPRZ was recognized as a novel immunotherapy target in glioblastoma owing to its multiple roles in immune surveillance. 64
Recent two studies also revealed PTPRT mutations may be implicated in immunotherapy response. 65 , 66 He et al. 65 used only one aggregated tumor cohort to explore the potential connection of PTPRT mutations and did not conduct the multivariate‐adjusted analyses, these may introduce biases to the final results. Wang et al.66 performed the relevant exploration only for NSCLC patients and lacked additional cancer type validation. In our study, by using multiple distinct cohorts and across‐validation under distinct sequencing platforms, we could obtain a reliable association between PTPRT mutations and ICI outcomes.
A study demonstrated that PTPRT may predict bevacizumab chemotherapy resistance with deleterious mutation of PTPRT causing a poor prognosis in metastatic colorectal cancer. 55 Based on the results from TCGA melanoma and NSCLC cohorts, patients with PTPRT mutations did not exhibit the clinical benefits of simply chemotherapy (Figure S9A,B), but had the favorable treatment prognosis in patients treated with immune checkpoint‐based agents, suggesting the specific predictive roles of PTPRT mutations in the immunotherapy settings.
Recently several studies have demonstrated the vital roles of mutations in a single gene for assessing ICI efficacy. Jia et al. observed that TTN mutations were positively linked with ICI determinants and immunotherapy survival outcome in melanoma and NSCLC. 16 Patients with POLE/POLD1 mutations harbored a markedly favorable prognosis in a pan‐cancer ICI cohort contained 1644 patients. 14 In metastatic renal cell carcinoma patients received nivolumab antibody, Braun et al. found that preferable overall and progression‐free survival were significantly associated with PBRM1 mutations. 15 The high TMB is a promising indicator in cancer immunotherapy, nevertheless, some factors, such as uncertain threshold, exome sequencing fees, and bias of distinct platforms largely influence the accurate assessment of the TMB. 16 Instead of performing WES sequencing and determining a certain threshold, PTPRT mutational status could be obtained by using the targeted sequencing methods, which will reduce the sequencing fee and make the TMB evaluation and ICI prognosis prediction more easily. Therefore, PTPRT mutations may be an alternative surrogate for predicting ICI response in melanoma and NSCLC.
This work employed public cohorts of distinct institutions, which may introduce some biases in the procedures of data integration and analysis. In addition, gene expression‐related findings were calculated based on the TCGA cohorts, rather than the initial ICI‐treated dataset, which may incompletely illuminate the mechanisms of ICI outcome. As a result, the links between PTPRT mutation pattern and distinct immunology, including analysis of lymphocyte infiltration, immune‐related signatures and oncogenic pathways, needs further experimental verification.
5. CONCLUSION
In summary, in this integrative study, PTPRT mutation was identified as a putative strong biomarker to infer immune checkpoint‐based treatment responses in melanoma, NSCLC, even across multiple cancers. Relevant results were obtained under mutual validation with distinct cancer types and sequencing platforms. Further prospective verification cohorts and mechanistic studies are needed.
CONFLICT OF INTEREST
The authors declare that they have no conflict of interest.
AUTHORS CONTRIBUTION
QW and SW designed this study; QW, SW, WZ, and FS collected and integrated the related genomic data; WZ, FS, QW, SW, YK, YL, and CS conducted distinct data analysis; WZ, FS, QW, and SW composed and corrected the manuscript.
ETHICS APPROVAL AND CONSENT TO PARTICIPATE
All samples used in this study were obtained from the previously published datasets and the informed consent has been completed.
Supporting information
Fig S1‐S9
Table S1‐S8
ACKNOWLEDGMENTS
QHW would like to appreciate SZW at Weifang Medical University for her assistance in work and research. Especially, QHW thanks WJZ for her accompany over the past 9 years.
Zhang W, Shi F, Kong Y, et al. Association of PTPRT mutations with immune checkpoint inhibitors response and outcome in melanoma and non‐small cell lung cancer. Cancer Med. 2022;11:676–691. doi: 10.1002/cam4.4472
Wenjing Zhang and Fuyan Shi, contributed equally to this work.
Funding information
This work was supported by the Shandong Provincial Youth Innovation Team Development Plan of Colleges and Universities (No. 2019‐6‐156, Lu‐Jiao) and the National Natural Science Foundation of China (No. 81872719).
Contributor Information
Suzhen Wang, Email: wangsz@wfmc.edu.cn.
Qinghua Wang, Email: wangqinghua@wfmc.edu.cn.
DATA AVAILABILITY STATEMENT
All samples used in this work are acquired from the previously published studies.
REFERENCES
- 1. Motzer RJ, Tannir NM, McDermott DF, et al. Nivolumab plus ipilimumab versus sunitinib in advanced renal‐cell carcinoma. N Engl J Med. 2018;378:1277‐1290. [DOI] [PMC free article] [PubMed] [Google Scholar]
- 2. Wolchok JD, Chiarion‐Sileni V, Gonzalez R, et al. Overall survival with combined nivolumab and ipilimumab in advanced melanoma. N Engl J Med. 2017;377:1345‐1356. [DOI] [PMC free article] [PubMed] [Google Scholar]
- 3. Reck M, Rodríguez‐Abreu D, Robinson AG, et al. Pembrolizumab versus chemotherapy for PD‐L1‐positive non‐small‐cell lung cancer. N Engl J Med. 2016;375:1823‐1833. [DOI] [PubMed] [Google Scholar]
- 4. Le DT, Durham JN, Smith KN, et al. Mismatch repair deficiency predicts response of solid tumors to PD‐1 blockade. Science. 2017;357:409‐413. [DOI] [PMC free article] [PubMed] [Google Scholar]
- 5. Hellmann MD, Callahan MK, Awad MM, et al. Tumor mutational burden and efficacy of nivolumab monotherapy and in combination with ipilimumab in small‐cell lung cancer. Cancer Cell. 2019;35:329. [DOI] [PubMed] [Google Scholar]
- 6. Zhao Y, Zhang X, Guda K, et al. Identification and functional characterization of paxillin as a target of protein tyrosine phosphatase receptor T. Proc Natl Acad Sci U S A. 2010;107:2592‐2597. [DOI] [PMC free article] [PubMed] [Google Scholar]
- 7. Scott A, Wang Z. Tumour suppressor function of protein tyrosine phosphatase receptor‐T. Biosci Rep. 2011;31:303‐307. [DOI] [PMC free article] [PubMed] [Google Scholar]
- 8. Choi M, Kadara H, Zhang J, et al. Mutation profiles in early‐stage lung squamous cell carcinoma with clinical follow‐up and correlation with markers of immune function. Ann Oncol. 2017;28:83‐89. [DOI] [PMC free article] [PubMed] [Google Scholar]
- 9. Yan P, Wang Y, Meng X, et al. Whole exome sequencing of ulcerative colitis‐associated colorectal cancer based on novel somatic mutations identified in Chinese patients. Inflamm Bowel Dis. 2019;25:1293‐1301. [DOI] [PubMed] [Google Scholar]
- 10. Ding LI, Kim M, Kanchi KL, et al. Clonal architectures and driver mutations in metastatic melanomas. PLoS One. 2014;9:e111153. [DOI] [PMC free article] [PubMed] [Google Scholar]
- 11. Chen C, Shi C, Huang X, et al. Molecular profiles and metastasis markers in Chinese patients with gastric carcinoma. Sci Rep. 2019;9:13995. [DOI] [PMC free article] [PubMed] [Google Scholar]
- 12. Mitchell KA, Nichols N, Tang W, et al. Recurrent PTPRT/JAK2 mutations in lung adenocarcinoma among African Americans. Nat Commun. 2019;10:5735. [DOI] [PMC free article] [PubMed] [Google Scholar]
- 13. Cerami E, Gao J, Dogrusoz U, et al. The cBio cancer genomics portal: an open platform for exploring multidimensional cancer genomics data. Cancer Discov. 2012;2:401‐404. [DOI] [PMC free article] [PubMed] [Google Scholar]
- 14. Wang F, Zhao Q, Wang YN, et al. Evaluation of POLE and POLD1 mutations as biomarkers for immunotherapy outcomes across multiple cancer types. JAMA Oncol. 2019;5(10):1504‐1506. [DOI] [PMC free article] [PubMed] [Google Scholar]
- 15. Braun DA, Ishii Y, Walsh AM, et al. Clinical validation of PBRM1 alterations as a marker of immune checkpoint inhibitor response in renal cell carcinoma. JAMA Oncol. 2019;5(11):1631‐1633. [DOI] [PMC free article] [PubMed] [Google Scholar]
- 16. Jia Q, Wang J, He N, He J, Zhu B. Titin mutation associated with responsiveness to checkpoint blockades in solid tumors. JCI Insight. 2019;4:e127901. [DOI] [PMC free article] [PubMed] [Google Scholar]
- 17. Wang Q, Yang Y, Yang M, Li X, Chen K. High mutation load, immune‐activated microenvironment, favorable outcome, and better immunotherapeutic efficacy in melanoma patients harboring MUC16/CA125 mutations. Aging (Albany NY). 2020;12:10827‐10843. [DOI] [PMC free article] [PubMed] [Google Scholar]
- 18. Sade‐Feldman M, Jiao YJ, Chen JH, et al. Resistance to checkpoint blockade therapy through inactivation of antigen presentation. Nat Commun. 2017;8:1136. [DOI] [PMC free article] [PubMed] [Google Scholar]
- 19. Shin DS, Zaretsky JM, Escuin‐Ordinas H, et al. Primary resistance to PD‐1 blockade mediated by JAK1/2 mutations. Cancer Discov. 2017;7:188‐201. [DOI] [PMC free article] [PubMed] [Google Scholar]
- 20. Zaretsky JM, Garcia‐Diaz A, Shin DS, et al. Mutations associated with acquired resistance to PD‐1 blockade in melanoma. N Engl J Med. 2016;375:819‐829. [DOI] [PMC free article] [PubMed] [Google Scholar]
- 21. Keenan TE, Burke KP, Van Allen EM. Genomic correlates of response to immune checkpoint blockade. Nat Med. 2019;25:389‐402. [DOI] [PMC free article] [PubMed] [Google Scholar]
- 22. Moffitt RA, Marayati R, Flate EL, et al. Virtual microdissection identifies distinct tumor‐ and stroma‐specific subtypes of pancreatic ductal adenocarcinoma. Nat Genet. 2015;47:1168‐1178. [DOI] [PMC free article] [PubMed] [Google Scholar]
- 23. Zhang H, Qin G, Zhang C, et al. TRAIL promotes epithelial‐to‐mesenchymal transition by inducing PD‐L1 expression in esophageal squamous cell carcinomas. J Exp Clin Cancer Res. 2021;40:209. [DOI] [PMC free article] [PubMed] [Google Scholar]
- 24. Kudo‐Saito C, Shirako H, Takeuchi T, Kawakami Y. Cancer metastasis is accelerated through immunosuppression during Snail‐induced EMT of cancer cells. Cancer Cell. 2009;15:195‐206. [DOI] [PubMed] [Google Scholar]
- 25. Van Allen EM, Miao D, Schilling B, et al. Genomic correlates of response to CTLA‐4 blockade in metastatic melanoma. Science. 2015;350:207‐211. [DOI] [PMC free article] [PubMed] [Google Scholar]
- 26. Miao D, Margolis CA, Vokes NI, et al. Genomic correlates of response to immune checkpoint blockade in microsatellite‐stable solid tumors. Nat Genet. 2018;50:1271‐1281. [DOI] [PMC free article] [PubMed] [Google Scholar]
- 27. Roh W, Chen P‐L, Reuben A, et al. Integrated molecular analysis of tumor biopsies on sequential CTLA‐4 and PD‐1 blockade reveals markers of response and resistance. Sci Transl Med. 2017;9:eaah3560. [DOI] [PMC free article] [PubMed] [Google Scholar]
- 28. Hugo W, Zaretsky JM, Sun LU, et al. Genomic and transcriptomic features of response to anti‐PD‐1 therapy in metastatic melanoma. Cell. 2017;168:542. [DOI] [PubMed] [Google Scholar]
- 29. Riaz N, Havel JJ, Makarov V, et al. Tumor and microenvironment evolution during immunotherapy with nivolumab. Cell. 2017;171(934–49):e16. [DOI] [PMC free article] [PubMed] [Google Scholar]
- 30. Snyder A, Makarov V, Merghoub T, et al. Genetic basis for clinical response to CTLA‐4 blockade in melanoma. N Engl J Med. 2014;371:2189‐2199. [DOI] [PMC free article] [PubMed] [Google Scholar]
- 31. Liu D, Schilling B, Liu D, et al. Integrative molecular and clinical modeling of clinical outcomes to PD1 blockade in patients with metastatic melanoma. Nat Med. 2019;25:1916‐1927. [DOI] [PMC free article] [PubMed] [Google Scholar]
- 32. Hellmann MD, Nathanson T, Rizvi H, et al. Genomic features of response to combination immunotherapy in patients with advanced non‐small‐cell lung cancer. Cancer Cell. 2018;33(843–52):e4. [DOI] [PMC free article] [PubMed] [Google Scholar]
- 33. Rizvi NA, Hellmann MD, Snyder A, et al. Mutational landscape determines sensitivity to PD‐1 blockade in non‐small cell lung cancer. Science. 2015;348:124‐128. [DOI] [PMC free article] [PubMed] [Google Scholar]
- 34. Ramos AH, Lichtenstein L, Gupta M, et al. Oncotator: cancer variant annotation tool. Hum Mutat. 2015;36:E2423‐E2429. [DOI] [PMC free article] [PubMed] [Google Scholar]
- 35. Samstein RM, Lee C‐H, Shoushtari AN, et al. Tumor mutational load predicts survival after immunotherapy across multiple cancer types. Nat Genet. 2019;51:202‐206. [DOI] [PMC free article] [PubMed] [Google Scholar]
- 36. Rizvi H, Sanchez‐Vega F, La K, et al. Molecular determinants of response to anti‐programmed cell death (PD)‐1 and anti‐programmed death‐ligand 1 (PD‐L1) blockade in patients with non‐small‐cell lung cancer profiled with targeted next‐generation sequencing. J Clin Oncol. 2018;36:633‐641. [DOI] [PMC free article] [PubMed] [Google Scholar]
- 37. Kim J, Mouw KW, Polak P, et al. Somatic ERCC2 mutations are associated with a distinct genomic signature in urothelial tumors. Nat Genet. 2016;48:600‐606. [DOI] [PMC free article] [PubMed] [Google Scholar]
- 38. Newman AM, Liu CL, Green MR, et al. Robust enumeration of cell subsets from tissue expression profiles. Nat Methods. 2015;12:453‐457. [DOI] [PMC free article] [PubMed] [Google Scholar]
- 39. Angelova M, Charoentong P, Hackl H, et al. Characterization of the immunophenotypes and antigenomes of colorectal cancers reveals distinct tumor escape mechanisms and novel targets for immunotherapy. Genome Biol. 2015;16:64. [DOI] [PMC free article] [PubMed] [Google Scholar]
- 40. Yoshihara K, Shahmoradgoli M, Martínez E, et al. Inferring tumour purity and stromal and immune cell admixture from expression data. Nat Commun. 2013;4:2612. [DOI] [PMC free article] [PubMed] [Google Scholar]
- 41. Cancer Genome Atlas Network . Genomic classification of cutaneous melanoma. Cell. 2015;161:1681‐1696. [DOI] [PMC free article] [PubMed] [Google Scholar]
- 42. Nagalla S, Chou JW, Willingham MC, et al. Interactions between immunity, proliferation and molecular subtype in breast cancer prognosis. Genome Biol. 2013;14:R34. [DOI] [PMC free article] [PubMed] [Google Scholar]
- 43. Rooney MS, Shukla SA, Wu CJ, Getz G, Hacohen N. Molecular and genetic properties of tumors associated with local immune cytolytic activity. Cell. 2015;160:48‐61. [DOI] [PMC free article] [PubMed] [Google Scholar]
- 44. Dong ZY, Zhong WZ, Zhang XC, et al. Potential predictive value of TP53 and KRAS mutation status for response to PD‐1 blockade immunotherapy in lung adenocarcinoma. Clin Cancer Res. 2017;23:3012‐3024. [DOI] [PubMed] [Google Scholar]
- 45. Ayers M, Lunceford J, Nebozhyn M, et al. IFN‐gamma‐related mRNA profile predicts clinical response to PD‐1 blockade. J Clin Investig. 2017;127:2930‐2940. [DOI] [PMC free article] [PubMed] [Google Scholar]
- 46. Finkin S, Yuan D, Stein I, et al. Ectopic lymphoid structures function as microniches for tumor progenitor cells in hepatocellular carcinoma. Nat Immunol. 2015;16:1235‐1244. [DOI] [PMC free article] [PubMed] [Google Scholar]
- 47. Hoshida Y. Nearest template prediction: a single‐sample‐based flexible class prediction with confidence assessment. PLoS One. 2010;5:e15543. [DOI] [PMC free article] [PubMed] [Google Scholar]
- 48. Martin SA, Hewish M, Lord CJ, Ashworth A. Genomic instability and the selection of treatments for cancer. J Pathol. 2010;220:281‐289. [DOI] [PubMed] [Google Scholar]
- 49. Balachandran VP, Łuksza M, Zhao JN, et al. Identification of unique neoantigen qualities in long‐term survivors of pancreatic cancer. Nature. 2017;551:512‐516. [DOI] [PMC free article] [PubMed] [Google Scholar]
- 50. Mayakonda A, Lin DC, Assenov Y, Plass C, Koeffler HP. Maftools: efficient and comprehensive analysis of somatic variants in cancer. Genome Res. 2018;28:1747‐1756. [DOI] [PMC free article] [PubMed] [Google Scholar]
- 51. Eller K, Wolf D, Huber JM, et al. IL‐9 production by regulatory T cells recruits mast cells that are essential for regulatory T cell‐induced immune suppression. J Immunol. 2011;186:83‐91. [DOI] [PMC free article] [PubMed] [Google Scholar]
- 52. Ganeshan K, Bryce PJ. Regulatory T cells enhance mast cell production of IL‐6 via surface‐bound TGF‐beta. J Immunol. 2012;188:594‐603. [DOI] [PMC free article] [PubMed] [Google Scholar]
- 53. Li X, Pasche B, Zhang W, Chen K. Association of MUC16 mutation with tumor mutation load and outcomes in patients with gastric cancer. JAMA Oncol. 2018;4:1691‐1698. [DOI] [PMC free article] [PubMed] [Google Scholar]
- 54. Xu D, Qu CK. Protein tyrosine phosphatases in the JAK/STAT pathway. Front Biosci. 2008;13:4925‐4932. [DOI] [PMC free article] [PubMed] [Google Scholar]
- 55. Hsu HC, Lapke N, Chen SJ, et al. PTPRT and PTPRD deleterious mutations and deletion predict bevacizumab resistance in metastatic colorectal cancer patients. Cancers. 2018;10(9):314. [DOI] [PMC free article] [PubMed] [Google Scholar]
- 56. Waldmann TA, Chen J. Disorders of the JAK/STAT pathway in T cell lymphoma pathogenesis: implications for immunotherapy. Annu Rev Immunol. 2017;35:533‐550. [DOI] [PMC free article] [PubMed] [Google Scholar]
- 57. Narayanapillai SC, Han YH, Song JM, Kebede ME, Upadhyaya P, Kassie F. Modulation of the PD‐1/PD‐L1 immune checkpoint axis during inflammation‐associated lung tumorigenesis. Carcinogenesis. 2020;41:1518‐1528. [DOI] [PMC free article] [PubMed] [Google Scholar]
- 58. Zhou F. Molecular mechanisms of IFN‐gamma to up‐regulate MHC class I antigen processing and presentation. Int Rev Immunol. 2009;28:239‐260. [DOI] [PubMed] [Google Scholar]
- 59. Maksumova L, Le HT, Muratkhodjaev F, Davidson D, Veillette A, Pallen CJ. Protein tyrosine phosphatase alpha regulates Fyn activity and Cbp/PAG phosphorylation in thymocyte lipid rafts. J Immunol. 2005;175:7947‐7956. [DOI] [PubMed] [Google Scholar]
- 60. Al Barashdi MA, Ali A, McMullin MF, Mills K. Protein tyrosine phosphatase receptor type C (PTPRC or CD45). J Clin Pathol. 2021;74(9):548‐552. [DOI] [PMC free article] [PubMed] [Google Scholar]
- 61. Klintman J, Appleby N, Stamatopoulos B, et al. Genomic and transcriptomic correlates of Richter transformation in chronic lymphocytic leukemia. Blood. 2021;137:2800‐2816. [DOI] [PMC free article] [PubMed] [Google Scholar]
- 62. Huang X, Qin F, Meng Q, Dong M. Protein tyrosine phosphatase receptor type D (PTPRD)‐mediated signaling pathways for the potential treatment of hepatocellular carcinoma: a narrative review. Ann Transl Med. 2020;8:1192. [DOI] [PMC free article] [PubMed] [Google Scholar]
- 63. Song X, Jiao X, Yan H, et al. Overexpression of PTPRN promotes metastasis of lung adenocarcinoma and suppresses NK cell cytotoxicity. Front Cell Dev Biol. 2021;9:622018. [DOI] [PMC free article] [PubMed] [Google Scholar]
- 64. Muller S, Lamszus K, Nikolich K, Westphal M. Receptor protein tyrosine phosphatase zeta as a therapeutic target for glioblastoma therapy. Expert Opin Ther Targets. 2004;8:211‐220. [DOI] [PubMed] [Google Scholar]
- 65. He Z, Li A, Lin D, et al. Association of immune checkpoint inhibitor with survival in patients with cancers with protein tyrosine phosphatase receptor T mutation. Clin Transl Med. 2020;10:e214. [DOI] [PMC free article] [PubMed] [Google Scholar]
- 66. Wang X, Wu B, Yan Z, et al. Association of PTPRD/PTPRT mutation with better clinical outcomes in NSCLC patients treated with immune checkpoint blockades. Front Oncol. 2021;11:650122. [DOI] [PMC free article] [PubMed] [Google Scholar]
Associated Data
This section collects any data citations, data availability statements, or supplementary materials included in this article.
Supplementary Materials
Fig S1‐S9
Table S1‐S8
Data Availability Statement
All samples used in this work are acquired from the previously published studies.


