Abstract
Despite the increased overall survival rates, curative options for metastatic breast cancer remain limited. We have previously shown that Metadherin (MTDH) is frequently overexpressed in poor prognosis breast cancer, where it promotes metastasis and therapy resistance through its interaction with Staphylococcal nuclease domain-containing 1 (SND1). Through genetic and pharmacological targeting of the MTDH-SND1 interaction, we reveal a key role for this complex in suppressing anti-tumor T cell responses in breast cancer. The MTDH-SND1 complex reduces tumor antigen presentation and inhibits T cell infiltration and activation by binding to and destabilizing Tap1/2 mRNAs, which encode key components of the antigen presentation machinery. Following small molecule compound C26-A6 treatment to disrupt the MTDH-SND1 complex, we showed enhanced immune surveillance and sensitivity to anti-PD-1 therapy in preclinical models of metastatic breast cancer, in support of this combination therapy as a viable approach to increase immune checkpoint blockade therapy responses in metastatic breast cancer.
Introduction
Despite recent advances in immunotherapy for leukemia, melanoma, lung cancer, bladder cancer and other cancers, clinical success of immunotherapy for metastatic breast cancer has been limited so far1–3. Breast tumors are not as inherently immunogenic as other solid malignancies such as melanoma. In particular, breast tumors that have metastasized may have developed multiple means to avoid immune detection and elimination. Thus, it is imperative for research efforts to focus on elucidating mechanisms to promote immune eradication of metastatic breast tumors through new immunotherapeutic approaches4–6.
One gene that has been recently validated as a functional mediator of breast cancer initiation, metastasis and drug resistance is Metadherin (MTDH), which we previously identified as a key target gene encoded in the 8q22 genomic gain frequently found in poor prognosis breast cancer7. As MTDH is overexpressed in >40% of human breast tumors7, this protein may be an ideal therapeutic target to develop new therapeutic approaches against metastatic or treatment-resistant breast cancer. Several studies have implicated MTDH in promoting tumor growth and chemoresistance through association with Staphylococcal nuclease domain-containing 1 (SND1)8–10. Based on the small hydrophobic interaction interface between MTDH and SND1 revealed by crystal structure analysis11, our recent study identified a class of small chemical inhibitors that could specifically disrupt the complex (see companion manuscript12). MTDH-SND1 inhibition by these compounds significantly reduces breast cancer progression and metastasis, and sensitizes tumors to chemotherapy, supporting the therapeutic potential of this new class of inhibitors12.
Although the critical function of MTDH in breast cancer progression and metastasis has been validated by genetic and pharmacological approaches, the underlying molecular mechanism of the pro-malignant function of MTDH-SND1 has not been fully characterized. In the present study, we revealed a previously unknown function of MTDH-SND1 in promoting immune evasion by suppressing tumor antigen presentation.
Results
MTDH promotes breast cancer immune evasion during metastasis
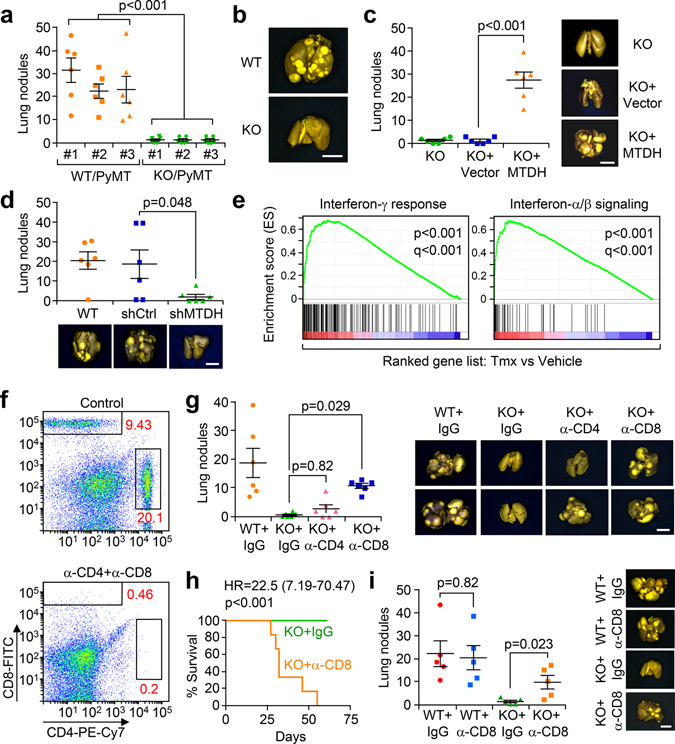
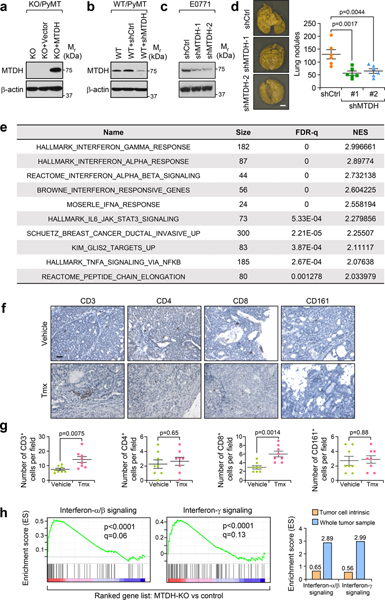
To explore the role of MTDH in breast cancer metastasis, we utilized MTDH knockout (FVB.Mtdh−/−) mice crossed with the FVB.MMTV-PyMT tumor model, as previously reported10. Several metastatic PyMT tumor cell clones were isolated from tumors spontaneously arising from PyMT;Mtdh+/+ (WT) or PyMT;Mtdh−/− (KO) mice, and three WT/PyMT and KO/PyMT cells lines were generated. The propensity for experimental lung metastasis of these cell lines was evaluated by tail vein injections into wild type female FVB mice. MTDH-WT (WT/PyMT) tumor cells generated large numbers of metastatic lung nodules in multiple experiments with different cell lines. In contrast, MTDH-KO (KO/PyMT) tumor cell lines failed to establish significant metastases (Fig. 1a,b). When MTDH expression was restored in the KO cells by lentiviral expression of the wild type Mtdh cDNA (Extended Data Fig. 1a), we observed increased numbers of metastatic lung nodules, which were comparable in number to animals injected with the WT tumor cells (Fig. 1a,c). Similarly, depletion of MTDH expression by lentiviral expression of Mtdh-targeting short hairpin RNA (shRNA) in the MTDH-WT PyMT tumor cells decreases measurable metastatic lung nodules (Extended Data Fig. 1b and Fig. 1d). To further confirm this finding, mouse mammary tumor cell line E0771, which was derived from a spontaneously occurring breast tumor in the C57BL/6 background13 was employed in a similar assay. E0771 cells with or without MTDH knockdown (KD) (Extended Data Fig. 1c) were injected into female C57BL/6 mice via tail vein. Consistently, MTDH KD significantly attenuates lung metastasis (Extended Data Fig. 1d). These results demonstrate that the status of MTDH expression strongly influences the metastatic potential of breast cancer cells.
Fig. 1. MTDH promotes metastatic breast cancer by enhancing immune evasion.
a, Three WT/PyMT (Mtdh+/+) and KO/PyMT (Mtdh−/−) cell lines were injected into FVB female mice via tail vein. Five weeks after injection, lungs were fixed, and numbers of metastatic nodules were quantified. n=6 mice per group. b, Representative lungs from (a) are shown. c, KO/PyMT cell lines that were rescued with vector or wild type MTDH were employed for tail vein injection. Five weeks after injection, lung metastatic nodules were counted. n=6 female FVB mice per group. d, WT/PyMT cells with/without endogenous Mtdh knockdown were injected in to female FVB mice intravenously. Numbers of lung nodules and representative lungs were shown. n=6 mice per group. e, PyMT;UBC-CreERT+/−;Mtdhfl/fl tumors with or without MTDH acute knockout (KO) were collected for RNA sequencing and GSEA. p and q values automatically determined by GSEA 3.0. Tmx, Tamoxifen. n=4 mice per group. f, FVB female mice were injected with CD4 and CD8 neutralizing antibodies or isotype control (IgG) for 3 days. Peripheral blood was collected to examine the depletion of CD4 and CD8. % of CD4 and CD8 in CD45+ populations are shown. n=6 mice. g, FVB females were inoculated with WT/PyMT or KO/PyMT cells via tail vein. The mice were treated with anti-CD4 or CD8 neutralization antibodies or IgG. Five weeks after injection, numbers of lung metastasis nodules were counted. n=6 mice per group. h, FVB females inoculated with KO/PyMT cells via tail vein were treated with anti-CD8 antibody or IgG. The survival of mice was plotted. KO+IgG, n=11 mice, KO+α-CD8, n=12 mice. i, WT/PyMT and KO/PyMT cells were inoculated into FVB females via mammary fat pad injections. The mice were treated with anti-CD8 neutralizing antibody or IgG. Eight weeks after injection, metastatic nodules were quantified. n=5 mice per group. In all lung images, size bar, 5 mm. Data represent mean ± SEM. Significance determined by two tailed Student’s t-test (a,c,d,i), one-way ANOVA analysis with Sidak’s test for multiple comparisons (g), or Log-rank test (h). Numerical source data for a, c, d, g, h, and i are provided.
As presented in our companion study12, to evaluate the therapeutic potential of targeting MTDH, we have generated a tamoxifen (Tmx)-inducible Mtdh knockout model PyMT;UBC-CreERT+/−;Mtdhfl/fl 12. In these mice, the floxed Mtdh alleles are excised by tamoxifen-activated Cre after the mice were injected with 60 mg/kg of Tmx for 5 constitutive days. Such a dosing regimen of tamoxifen was commonly used in conditional KO of genes of interest in mouse models of breast cancer including MMTV-PyMT and been shown to have no direct effect on tumor growth and metastasis14,15. Taking advantage of the strain, tumors with/without Mtdh acute knockout and after treatments with vehicle or 60 mg/kg of Tmx were collected for RNA extraction and sequencing. Gene set enrichment analysis revealed significant enrichment of interferon related signatures in the ranked listed of up-regulated genes in Mtdh acute knockout tumors versus wild type tumors (Extended Data Fig. 1e and Fig. 1e), suggesting MTDH might promote metastatic breast cancer progression by suppressing immune responses to tumors. Consistent with this notion, in MTDH KO tumors, we observed significant higher numbers of CD3+ and CD8+ T cells infiltration (Extended Data Fig. 1f,g), suggesting that the observed enrichment of the interferon-related signatures might be due to the increased immune cell infiltration in the local tumor microenvironment. To further test this, in vitro cultured PyMT;UBC-CreERT+/−;Mtdhfl/fl tumorspheres were treated with vehicle (Ctrl) or 4-Hydroxytamoxifen (4-OHT) to KO MTDH. The tumorspheres were then collected for RNA sequencing followed by gene set enrichment analysis. Although interferon related signatures showed a trend to be enriched in MTDH KO tumorspheres, the overall enrichment scores are much lower as compared to that from in vivo tumor samples (Extended Data Fig. 1h), indicating that the enriched interferon-related signatures are mostly caused by changes in the tumor microenvironment. Collectively, these results suggest that MTDH KO induces a more immunogenic tumor microenvironment.
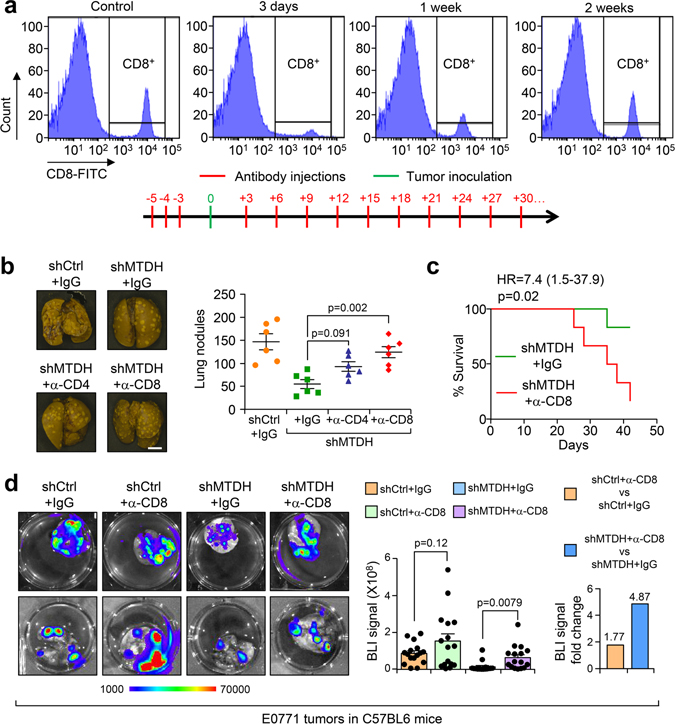
Given the importance of T lymphocytes in the tumor immune responses, we evaluated the metastatic behavior of MTDH-WT and KO PyMT tumor cells in mice with T cell depletion. To this end, we purified anti-CD4 and anti-CD8 neutralizing antibodies from hybridoma cell lines and pretreated immune-competent FVB mice with these T-cell depleting antibodies. The antibodies ablated greater than 97% of both CD4+ and CD8+ T cells as assessed by flow cytometry compared with isotype control (Fig. 1f), and such depletion was sustained for approximately 3 days. The relevant T cell population returned to normal levels 1–2 weeks after the initial injections (Extended Data Fig. 2a). Therefore, we used the antibody injection scheme in Extended Data Fig. 2a (antibody injection every 3 days) to maintain T-cell depletion over the course of experimental metastasis studies. We found that when CD4 and CD8 T cells are depleted in FVB mice, intravenous injection of MTDH-KO PyMT tumor cells generated more metastatic nodules than in wild type mice. The difference was particularly striking when CD8+ cytotoxic T cells were depleted (Fig. 1g). Importantly, when we repeated the experiment to directly compare the survival of mice intravenously injected with MTDH-KO PyMT tumor cells, depletion of CD8+ T cells dramatically reduced the overall survival of the mice (Fig. 1h). Similar CD4+ and CD8+ T cell depletion assays were performed with the E0771 model. Again, CD8+ T cell depletion restored lung metastasis of E0771-MTDH-KD cells and reduced the survival of C57BL/6 mice injected with E0771-MTDH-KD cells compared to control (Extended Data Fig. 2b,c). To further confirm the role of MTDH in spontaneous lung metastasis, we depleted CD8+ T cells in FVB mice and injected PyMT tumor cells with or without MTDH KO into the mammary fat pad to generate primary mammary gland tumors. MTDH-KO tumors developed significantly more lung metastasis when CD8+ T cells were depleted, whereas the depletion did not significantly alter spontaneous metastasis of MTDH-WT PyMT tumor cells (Fig. 1i). Similar observation was made using the E0771 models in C57BL/6 mice (Extended Data Fig. 2d). Of note, although we observed increased trend of metastasis in control groups upon CD8+ T depletion, the difference did not reach statistical significance, and the increase was much lower as compared to MTDH KD groups (Extended Data Fig. 2d). Overall, our results indicate that MTDH allows metastatic tumor cells to evade the attack from CD8+ cytotoxic T cells, and as a consequence, promotes metastatic progression of breast cancer.
MTDH protects tumor cells from the killing of CD8+ T cells
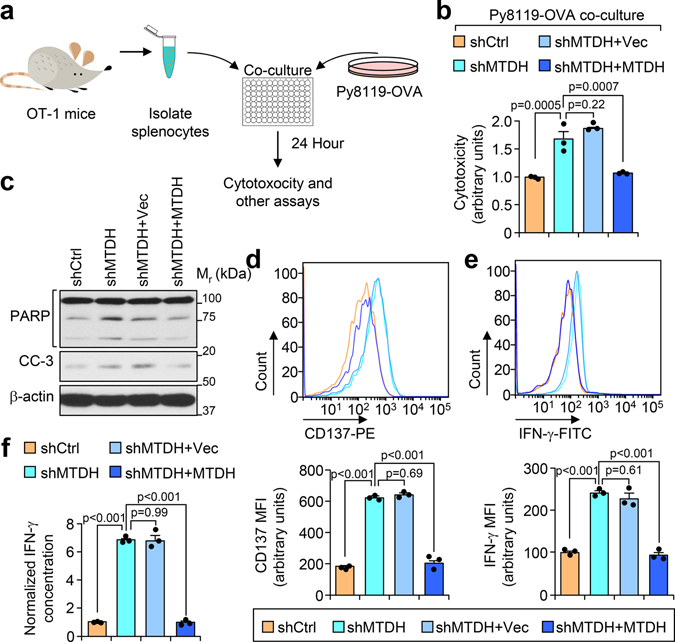
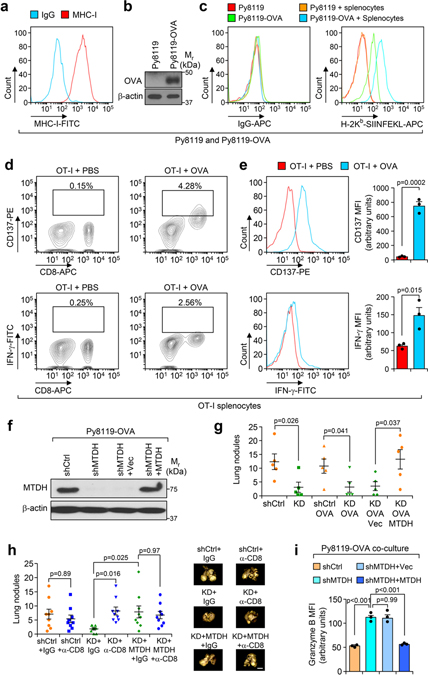
To more accurately evaluate the observed MTDH-mediated immune phenotype, we utilized the widely used ovalbumin (OVA)/OT-I antigen expression system to elicit strong epitope-specific immune responses against MTDH-WT and KD tumor cells expressing the OVA protein. We obtained MHC class I haplotype compatible PyMT tumor cell line Py8119 that was derived from C57BL/6 mice16. Unlike the FVB PyMT cells used in our experiments described above, the Py8119 expresses the MHC class I allele H-2Kb, and can efficiently process and present the dominant antigen peptide (OVAp257) that is recognized by T cells from OT-I mouse17,18. The MHC class I surface presentation in Py8119 cells and the OVAp257 surface presentation in OVA overexpressed Py8119 cells were validated (Extended Data Fig. 3a–c). Moreover, the antibody recognizing OVA complexes (H-2Kb-SIINFEKL) has been systematically compared with its isotype control to validate the specificity (Extended Data Fig. 3c). We next established an in vitro co-culture system by isolating immune cells from the spleen of OT-I mouse and then co-cultured them with OVA-expressing Py8119 tumor cells to analyze in vitro T-cell mediated killing of tumor cells (Fig. 2a). To this end, we first evaluated the immune cells that isolated from spleens of OT-I mice. As expected, the splenocytes can be effectively activated by OVAp257 peptide treatment (Extended Data Fig. 3d,e; gating strategy shown in Supplementary Fig. 1), confirming the recognition of OVA by OT-I T cells. Next, endogenous Mtdh was knocked down and rescued with wild type MTDH in Py8119-OVA cells (Extended Data Fig. 3f). Consistent with the results described above, Py8119 model reproduced the lung metastasis phenotypes that we observed in PyMT and E0771 models, and moreover, OVA expression does not alter MTDH-induced immune evasion phenotype (Extended Data Fig. 3g,h).
Fig. 2. MTDH inhibits T cell activation.
a, Schematic diagram of in vitro tumor-immune cell co-culture assay. Ovalbumin (OVA) expressing Py8119 tumor cells were seeded into plates. One day after the seeding, splenocytes or CD8+ T cells isolated from OT-I mice were co-cultured with tumor cells at 10:1 ratio. 24 hr after co-culture, the cells or culture media were collected for the following analysis. b,c, Indicated tumor cells were co-cultured with CD8+ T cells. 24 hr after co-culture, culture media were collected for cytotoxicity analysis (b). The tumor cells were harvested for western blot to examine with apoptotic markers PARP and cleaved-caspase 3 (CC-3) (c). Data represent mean ± SEM. n=3 independent experiments. Significance determined by one-way ANOVA analysis with Sidak’s test for multiple comparisons. d-f, OT-I splenocytes co-cultured with indicated tumor cells for 24 hr were harvested for flow cytometry analysis. The expression of activation markers CD137 (d) and IFN-γ (e) in CD8+ T cells were determined. MFI, Mean Fluorescence Intensity. The culture media were collected for ELISA assay to examine the concentration of IFN-γ (f). Data represent mean ± SEM. n=3 independent experiments. Significance determined by one-way ANOVA analysis with Sidak’s test for multiple comparisons. Numerical source data for b, d-f, and uncropped blots for c are provided.
Next, we performed an in vitro co-culture assay with the Py8119-OVA cell lines and OT-I cells. CD8+ cytotoxic T cells that were isolated from OT-I splenocytes have stronger killing effects on Py8119-OVA cells with MTDH KD, which can be abolished by wild type MTDH rescue (Fig. 2b,c), suggesting that MTDH in tumor cells protects them from immune clearance. Consistently, CD8+ T cells from MTDH-KD Py8119-OVA co-culture have stronger activation as indicated by higher CD137, IFN-γ, and Granzyme B expression (Fig. 2d,e and Extended Data Fig. 3i). To confirm the flow cytometry data, conditioned media from indicated co-culture conditions were also collected to test the IFN-γ concentration with ELISA. Again, we observed significant higher IFN-γ in the media that co-cultured with MTDH KD cells (Fig. 2f). Collectively, tumor MTDH inhibits the activation of immune cells, and therefore, prevents the immune clearance of tumor cells.
MTDH inhibits tumor antigen presentation
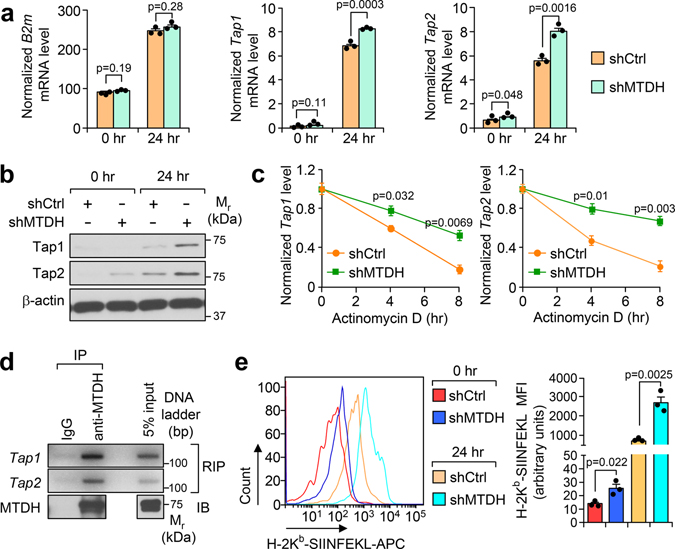
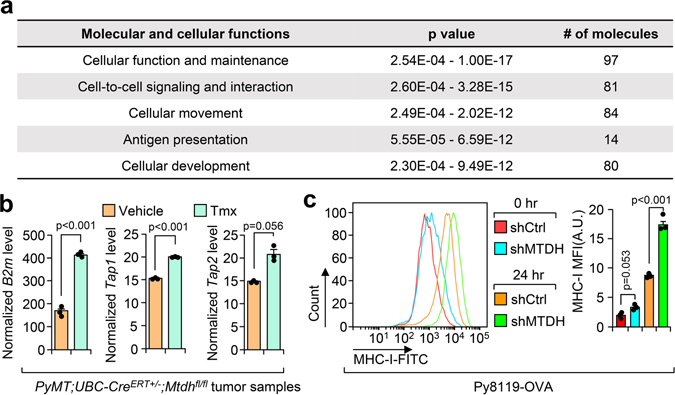
To uncover the mechanism underlying MTDH-mediated T cells suppression, we re-analyzed the RNA sequencing data with Ingenuity Pathway Analysis by focusing on MTDH-KO up-regulated genes. Several pathways are significantly enriched in MTDH acute KO tumors (Extended Data Fig. 4a), among which, the antigen presentation pathway is directly related to the phenotypes observed above. qRT-PCR analysis confirmed the notion that MTDH depletion in tumor context enhanced the mRNA expression level of several genes in the antigen presentation machinery, such as B2m, Tap1 and Tap2 (Extended Data Fig. 4b)19, suggesting MTDH is involved in antigen presentation regulation. Next, the in vitro co-culture system was utilized again to investigate MTDH-mediated antigen presentation. Upon OT-I splenocytes co-culture, Tap1/2 in Py8119-OVA tumor cells were significantly elevated; moreover, MTDH KD Py8119-OVA tumor cells had higher Tap1/2 protein levels (Fig. 3a,b). However, we did not observe significant difference of B2m between MTDH-WT and KD Py8119-OVA tumor cells after co-culture (Fig. 3a). Of note, we also observed increased steady levels of Tap1/2 in MTDH KD Py8119-OVA tumor cells before the co-culture (Fig. 3a). Given the difference of RNA levels of Tap1/2, we examined the stability of these two RNAs in the tumor cells in co-culture. Py8119-OVA tumor cells with or without MTDH knockdown were co-cultured with OT-I splenocytes for 24 hr and then treated with 10 μg/ml of actinomycin D. The tumor cells were harvested at indicated time points after the treatment. Total RNA was extracted and qRT-PCR was performed to test Tap1/2 levels in the tumor cells. We found that MTDH KD significantly attenuates the degradation of Tap1/2 (Fig. 3c). RNA-binding protein immunoprecipitation (RIP) assay further revealed that MTDH interacts with Tap1/2 (Fig. 3d), suggesting MTDH binds to Tap1/2 and promotes the degradation of these RNAs. Consistent with this molecular alteration we also observed less OVA antigen and MHC-I complex presentation in MTDH-WT tumor cells compared to MTDH-KD cells before and after immune cell challenge (Fig. 3e and Extended Data Fig. 4c).
Fig. 3. MTDH destabilizes Tap1/2.
a, Py8119-OVA cells with (shMTDH) or without (shCtrl) Mtdh knockdown were co-cultured with splenocytes from OT-I mice. At 0 hr or 24 hr after the co-culture, tumor cells were collected, RNA was extracted, and qRT-PCR was performed to test the indicated genes. Data represent mean ± SEM. n=3 independent experiments. Significance determined by two tailed Student’s t-test. b, Tumor cells in (a) were also harvested for western blot. c, Indicated tumor cells were co-cultured with OT-I splenocytes for 24 hr, and then treated with 10 μg/ml of actinomycin D. The tumor cells were harvested at indicated time points after the treatment. RNA was extracted and qRT-PCR was performed to test Tap1/2 levels. Data represent mean ± SEM. n=3 independent experiments. Significance determined by two tailed Student’s t-test. d, Py8119-OVA cells co-cultured with OT-1 splenocytes for 24 hr were collected for RNA-binding protein immunoprecipitation (RIP) assay. MTDH protein was pull-down, the binding RNA was extracted, and Tap1/2 was amplified with PCR. e,Indicated tumor cells were co-cultured with OT-I splenocytes for 0 or 24 hr. The tumor cells were then collected and subjected to flow cytometry to determine the surface presentation of Ovalbumin (H-2Kb-SIINFEKL). MFI, Mean Fluorescence Intensity. Data represent mean ± SEM. n=3 independent experiments. Significance determined by two tailed Student’s t-test. Numerical source data for a, c, e and uncropped images for b, d are provided.
MTDH-SND1 interaction suppresses antigen presentation
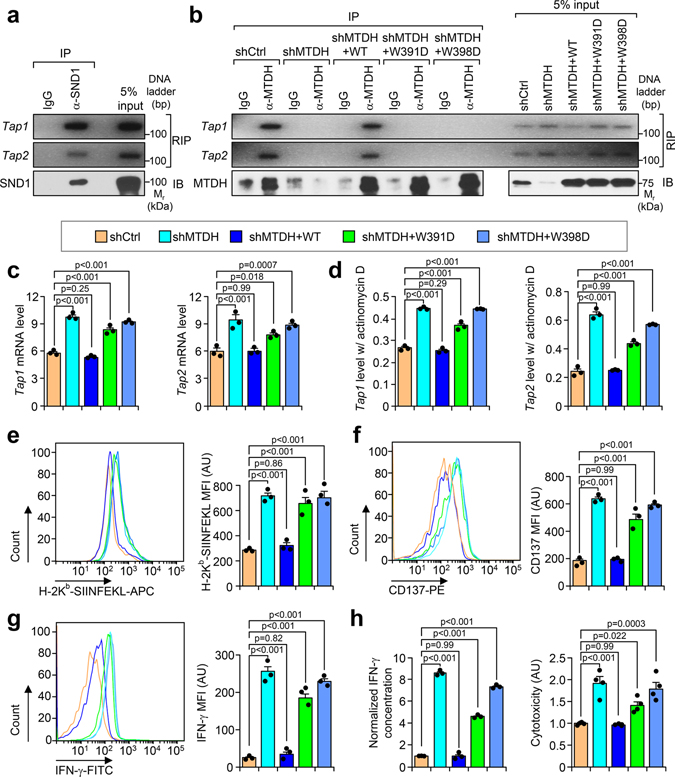
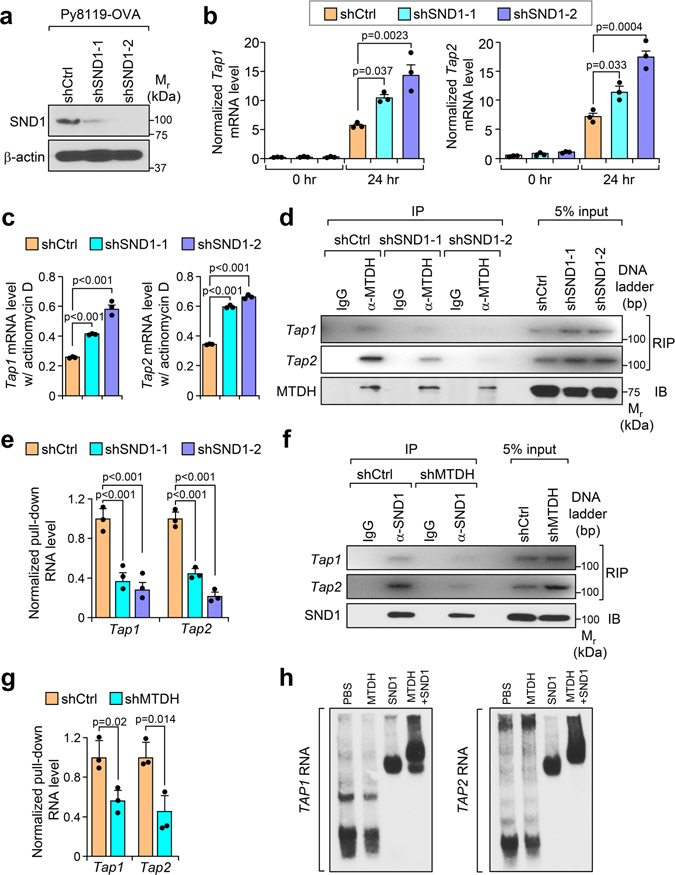
Our previous studies indicate that SND1 is a critical interaction partner of MTDH8. MTDH binds to SND1 to exert its tumor promoting function10,11. In this regard, we asked whether SND1 is also involved in MTDH-mediated suppression of antigen presentation. To address the question, we generated Py8119-OVA SND1 KD cell lines which were then subjected to OT-I splenocytes co-culture assay (Extended Data Fig. 5a). Similar to MTDH-KD, SND1 KD significantly stabilizes and increases the levels of Tap1/2 (Extended Data Fig. 5b,c). RIP assay also confirmed the interaction between SND1 and Tap1/2 (Fig. 4a). Interestingly, SND1 KD disrupted the interaction between MTDH and Tap1/2 (Extended Data Fig. 5d,e), indicating that SND1 is required for the binding of MTDH to these two RNAs. On the other hand, the binding between SND1 and Tap1/2 was also significantly reduced in the tumor cells with MTDH KD (Extended Data Fig. 5f,g), suggesting MTDH facilitates SND1’s Tap1/2 binding. To investigate if MTDH or SND1 has direct interaction with Tap1/2, we performed electrophoretic mobility gel shift assay with in vitro transcribed human TAP1/2 mRNA and recombinant human MTDH and SND1 proteins. Consistent with in vivo findings, we did not detect the interaction between MTDH and TAP1/2 mRNA in the absence of SND1, whereas SND1 alone could bind to TAP1/2 mRNA. Moreover, the addition of MTDH further enhanced the binding of the MTDH/SND1 complex to TAP1/2 RNA and induced a supershift (Extended Data Fig. 5h). Taken together, the data suggest that MTDH and SND1 form a complex to bind Tap1/2 and promotes their degradation in vivo.
Fig. 4. MTDH forms complex with SND1 to inhibit tumor antigen presentation and T cell activation.
a, Py8119-OVA cells were co-cultured with OT-1 splenocytes for 24 hr, and then collected for RIP assay. SND1 pull-down was confirmed by immunobloting (IB). The binding RNA was extracted, and Tap1/2 was amplified with PCR. b, Py8119-OVA cells with endogenous Mtdh KD (shMTDH) and indicated rescues (shMTDH+WT, +W391D, or +W398D) were co-cultured with OT-1 splenocytes for 24 hr, and then collected for RIP assay. MTDH protein pull-down was confirmed by immunobloting (IB). The binding RNA was extracted, and Tap1/2 was amplified with PCR. WT, wildtype MTDH; W391D and W398D, SND1 interaction-deficient mutants MTDH-W391D and MTDH-W398D. c, Indicated Py8119-OVA cells co-cultured with OT-1 splenocytes for 24 hr were harvested for RNA extraction. Levels of Tap1/2 were determined by qRT-PCR. d, Indicated Py8119-OVA tumor cells co-cultured for 24 hr were treated with 10 μg/ml of actinomycin D. 8 hr after treatment, RNA levels of Tap1/2 were determined by qRT-PCR. e-g, Indicated Py8119-OVA tumor cells (e) and OT-1 splenocytes (f,g) after co-culture were collected to test the OVA (H-2Kb-SIINFEKL) presentation on tumor cells, or CD137 and IFN-γ expression in splenocytes. MFI, Mean Fluorescence Intensity; AU, arbitrary units. h, Media from (e) was employed for ELSA to test IFN-γ concentration and cytotoxicity assay. AU, arbitrary units. In all panels data represent mean ± SEM. n=3 independent experiments. Significance determined by one-way ANOVA analysis with Dunnett’s test for multiple comparisons. Numerical source data for c-h and uncropped images for a, b are provided.
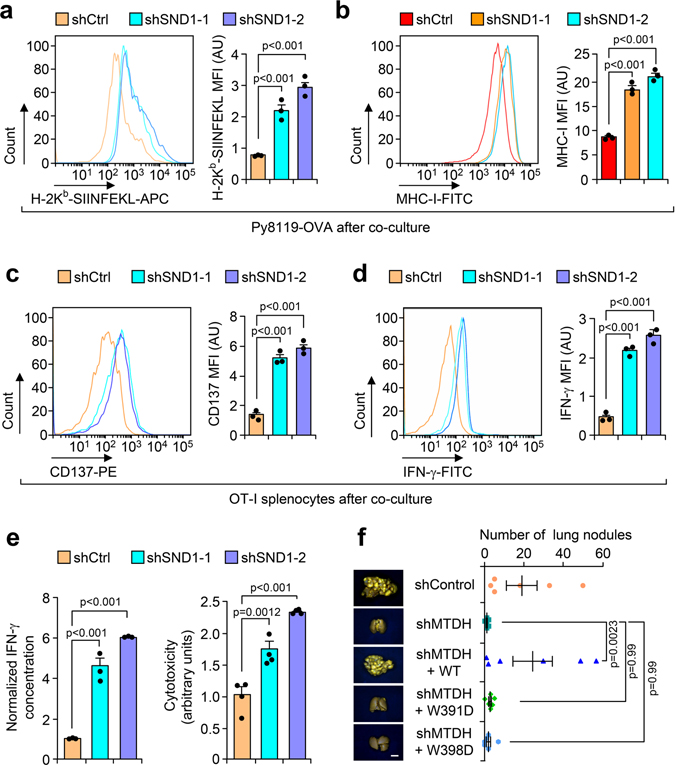
To further confirm the importance of the MTDH-SND1 binding in antigen presentation, we rescued MTDH KD Py8119-OVA tumor cells with wild type and SND1 interaction mutant forms of MTDH. Only WT, but not mutant MTDH (W391D and W398D), was found to bind and promote the degradation of Tap1/2 (Fig. 4b–d). Consistently, only the WT but not the mutant MTDH inhibits antigen presentation of tumor cells and activation of the T cells (Fig. 4e–h). Functionally, the immune cells have weaker killing effects on the tumor cells with wild type MTDH (Fig. 4h). Similar to MTDH KD, SND1 KD also dramatically enhances the antigen presentation in tumor cells, and therefore, promotes the activation and killing effects of T cells (Extended Data Fig. 6a–e). The critical role of MTDH-SND1 complex in breast cancer metastasis has also been validated by in vivo lung metastasis assays using cell lines with or without MTDH-KD and subsequent rescue with WT or mutant forms of MTDH (Extended Data Fig. 6f). In summary, these results indicate that the MTDH-SND1 complex promotes the immune evasion of metastatic breast cancer by down-regulating the tumor antigen presentation pathway.
Inhibition of MTDH-SND1 enhances immune surveillance
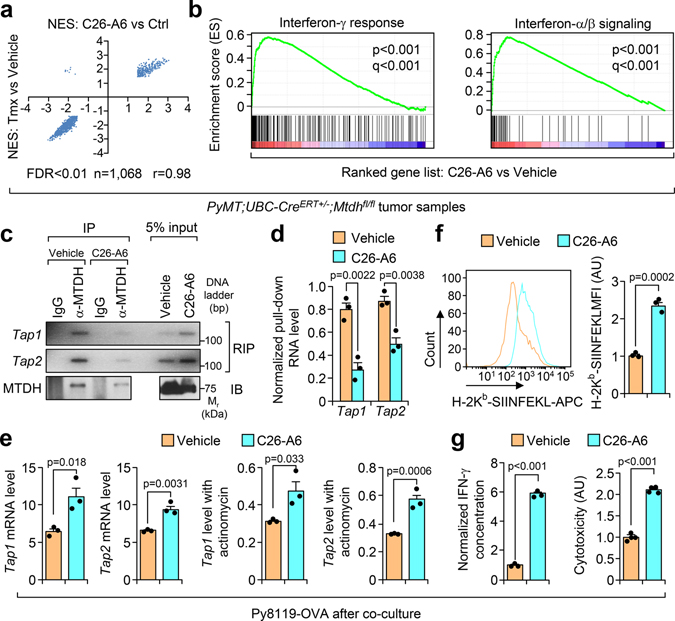
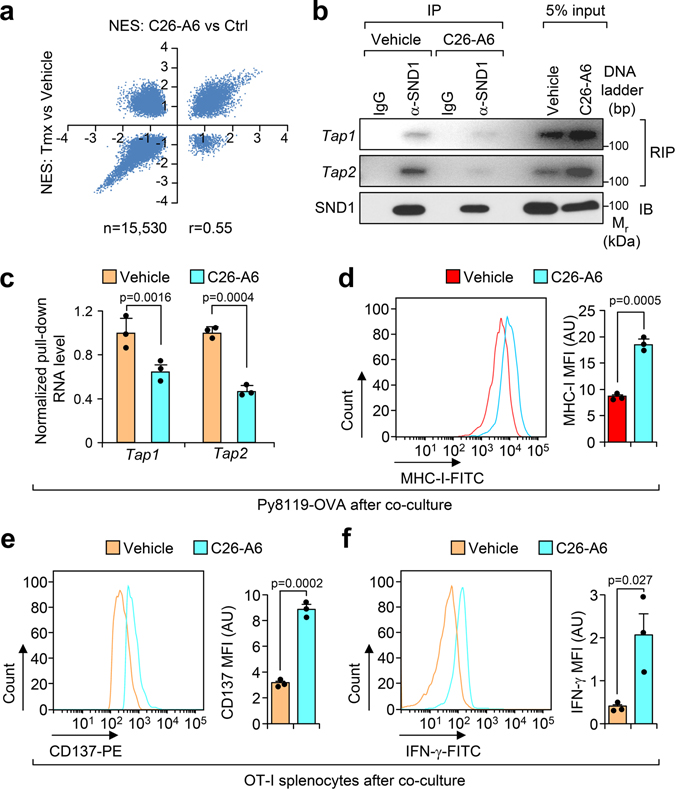
Recently we used high-throughput screening to identify a small chemical inhibitor, C26-A6, which specifically blocks MTDH-SND1 interaction12. Given the importance of the MTDH-SND1 complex in antigen presentation, we asked if the compound could enhance immune surveillance in breast cancer. To this end, PyMT tumors treated with C26-A6 or control vehicle12 were collected for RNA sequencing. Gene set enrichment analyses indicated a high degree of correlation between gene signatures that altered by acute genetic knockout of MTDH and by C26-A6 treatment (Extended Data Fig. 7a), especially the ones that were most significantly inhibited or enhanced (Fig. 5a). Interferon signatures were dramatically enriched in C26-A6-treated tumors (Fig. 5b), which is consistent with the similar enrichment in MTDH-KO tumors (Fig. 1e), suggesting the enhanced immune surveillance upon C26-A6 treatment. Similarly, C26-A6 treatment decreased the Tap1/2 binding of MTDH and SND1 (Fig. 5c,d and Extended Data Fig. 7b,c), and increased the expression level of these mRNAs (Fig. 5e). These results further confirm the importance of MTDH-SND1 complex in promoting Tap1/2 degradation and suppressing antigen presentation. Consistent with these molecular alterations, MTDH-SND1 disruption by C26-A6 promotes OVA antigen and MHC-I complex presentation, T cell activation, and sensitizes the tumor cells to immune clearance (Fig. 5f,g and Extended Data Fig. 7d–f).
Fig. 5. MTDH-SND1 blocking activates T cells by enhancing antigen presentation in tumors.
a, The correlation of the gene sets that significantly enriched (FDR<0.01) in Mtdh acute loss and C26-A6 treated tumors. Tmx, Tamoxifen. b, Gene set enrichment analysis showing the enrichment of interferon signatures in C26-A6 treated PyMT tumors as compared to control PyMT tumors. p and q values automatically determined by GSEA 3.0. c, Py8119-OVA cells co-cultured with OT-I splenocytes were treated with 200 μM of C26-A6 or same amount of vehicle. The binding between MTDH and Tap1/2 in tumor cells were determined by RIP assay. d, Tap1/2 RNAs that bind to MTDH in (c) were quantified and normalized to the pulled down MTDH levels. e, Tap1/2 levels in Py8119-OVA cells with/without 200 μM of C26-A6 treatment during co-culture were examined by qRT-PCR. f, OVA (H-2Kb-SIINFEKL) presentation in Py8119-OVA cells with/without 200 μM of C26-A6 treatment in co-culture were determined by flow cytometry. MFI, Mean Fluorescence Intensity; AU, arbitrary units. g, Media in (E) was collected for IFN-γ ELISA and cytotoxicity assay. AU, arbitrary units. In panels c-g, data represent mean ± SEM. n=3 independent experiments. Significance determined by two tailed Student’s t-test. Numerical source data for a, d-g and uncropped images for c are provided.
MTDH-SND1 suppresses antigen presentation by reducing Tap1/2
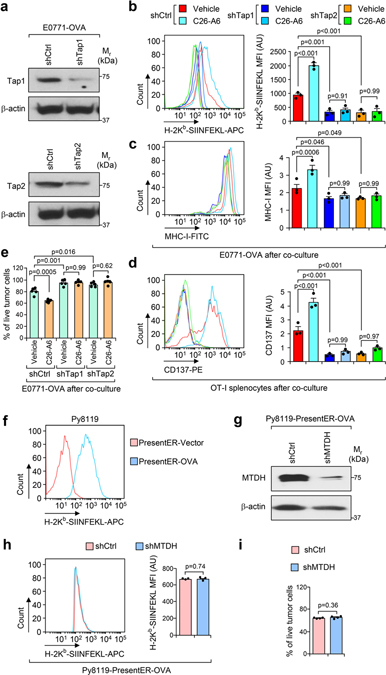
To confirm that MTDH-SND1 drives immune evasion through suppressing the Tap1/2 pathway, we generated antigen presentation-deficient cells by knocking down Tap1/2 as previously reported20. E0771-OVA cells were transduced with lentiviruses expressing Tap1/2-targeting shRNAs. Tap1/2 KD was confirmed by western blot (Extended Data Fig. 8a), and antigen presentation deficiency upon Tap1/2 KD was also validated (Extended Data Fig. 8b,c). Next, shCtrl (control shRNA) or Tap1/2 KD cells were co-cultured with OT-I splenocytes together with vehicle or C26-A6 treatment. Compared to a significant increase of antigen presentation and T cell activation in control cells after C26-A6 treatment, no such change occurred in Tap1/2 KD cells (Extended Data Fig. 8b–d). Consistently, Tap1/2 KD significantly increased the survival of tumor cells in the co-culture with OT-I splenocytes, with no boosting of immune killing by C26-A6 treatment (Extended Data Fig. 8e). These results indicate that MTDH-SND1 promotes immune evasion through suppressing Tap1/2.
To further confirm this finding, we generated PresentER system-mediated OVA presentation that bypass Tap1/2 as previously reported (Extended Data Fig. 8f)21. Py8119 cells with OVA presented by PresentER (Py8119-PresentER-OVA) were then transduced with lentiviral expressed MTDH-targeting shRNA. MTDH KD was confirmed by western blot (Extended Data Fig. 8g). Py8119-PresentER-OVA cells with (shMTDH) or without (shCtrl) MTDH KD were next employed to co-culture with OT-I splenocytes. In such Tap1/2-bypassed antigen presentation system, MTDH KD did not enhance the OVA presentation, and moreover, MTDH KD did not sensitize tumor cells to the immune killing (Extended Data Fig. 8h,i). The results again validate that Tap1/2 is essential for the MTDH-SND1-mediated immune evasion.
MTDH-SND1 disruption synergizes with anti-PD-1 therapy
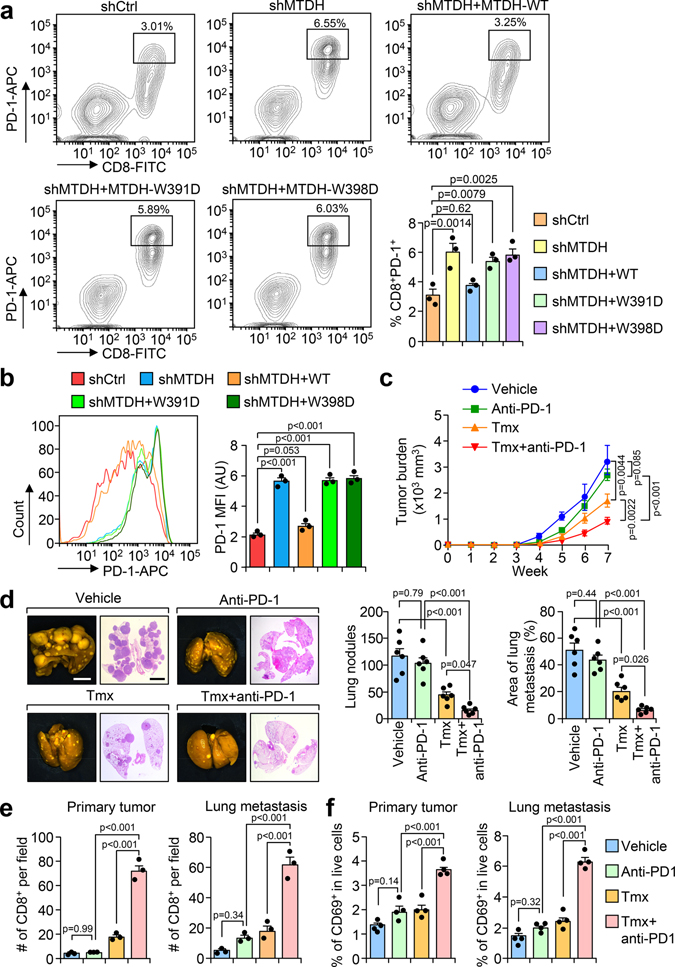
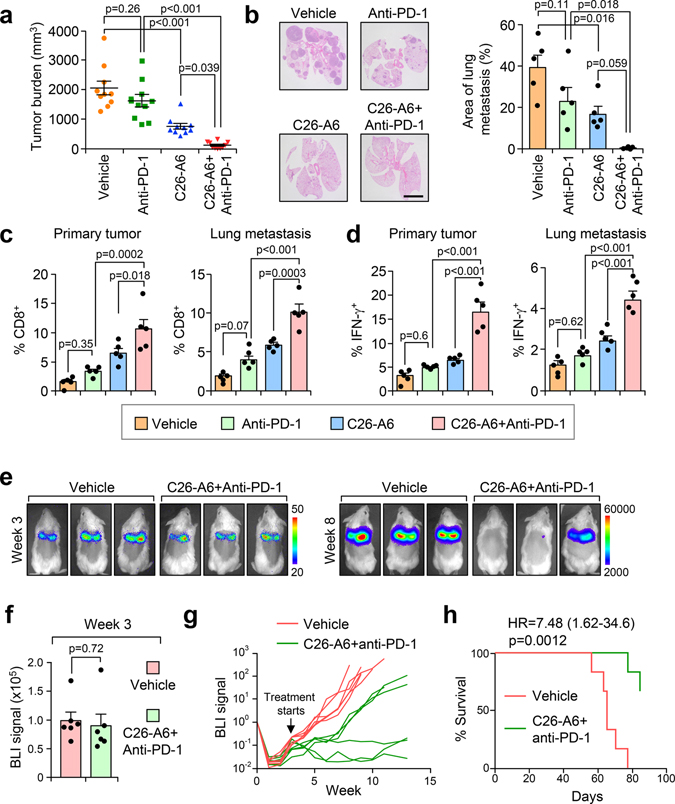
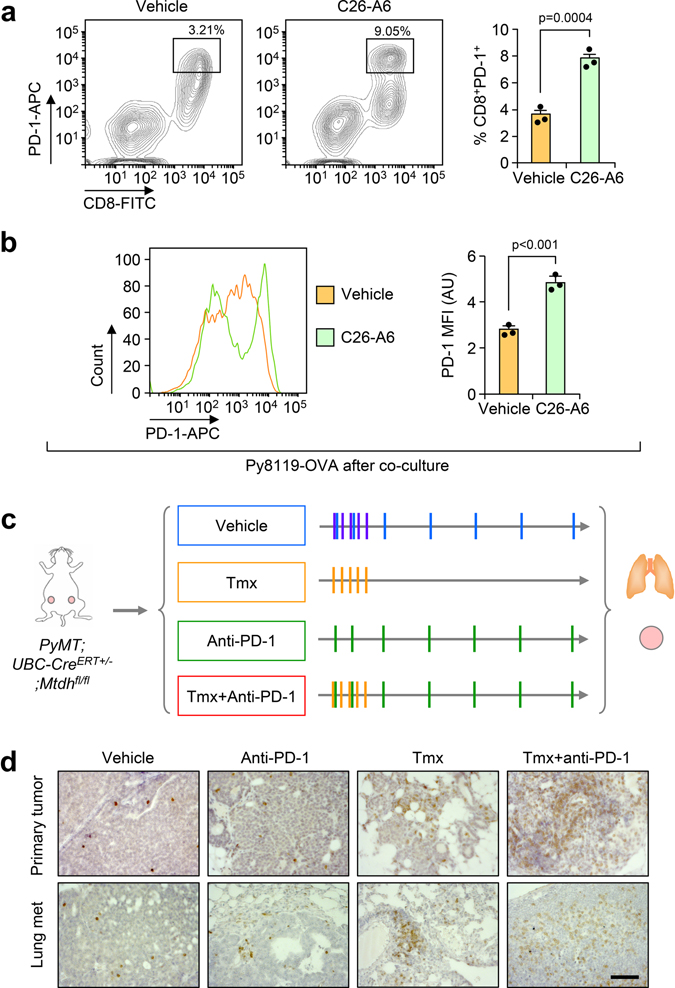
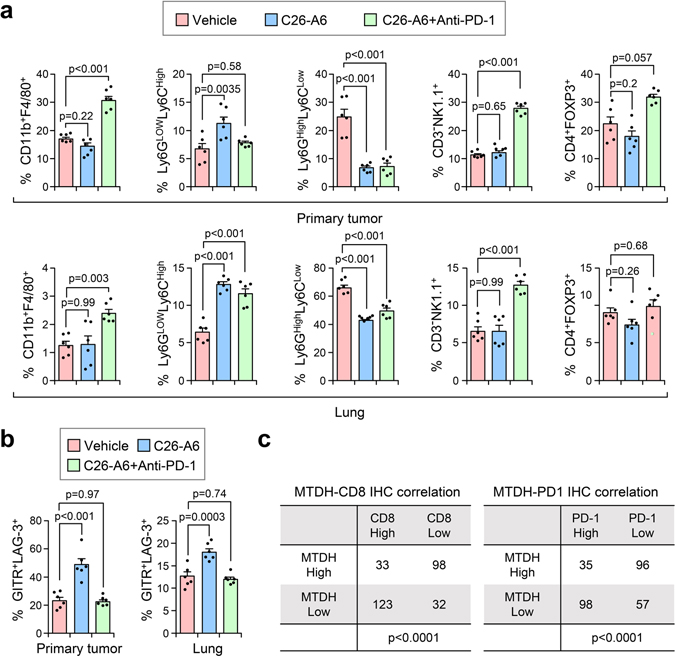
Although disruption of MTDH-SND1 interaction activates CD8+ cytotoxic T cells (Fig. 3–5), we also observed increased T cell exhaustion as indicated by PD-1 expression (Fig. 6a,b and Extended Data Fig. 9a,b).These observations suggested a potential synergistic anti-tumor effect of combining MTDH-SND1 blocking and anti-PD-1 therapy. To test this hypothesis, we treated PyMT;UBC-CreERT+/−;Mtdhfl/fl mice bearing developed PyMT tumors with Tmx, anti-PD-1 alone or in combination (Fig. 6c; and Extended Data Fig. 9c). Consistent with results from clinical trials22, anti-PD-1 alone did not significantly inhibit the progression of advanced breast cancer (Fig. 6c,d). However, MTDH acute KO together with anti-PD-1 treatment demonstrated strong synergy in suppressing the growth and lung metastasis of MMTV-PyMT tumors (Fig. 6c,d). Analysis of tumor samples indicated that MTDH-SND1 disruption and anti-PD-1 synergistically enhances T cell infiltration and activation (Fig. 6e,f and Extended Data Fig. 9d). Similarly, C26-A6 combined with anti-PD-1 markedly reduced primary tumor growth and lung metastasis, and such therapeutic response was significantly better than single treatments with C26-A6 or anti-PD-1 alone (Fig. 7a,b). Consistent with this result, increased CD8+ T cell infiltration and activation were observed with the combination treatment (Fig. 7c,d). In addition to examining the CD8+ T cells, we performed a more detailed profiling of immune cell infiltration in mice after such treatments. C26-A6 treatment alone significantly enhanced and reduced the infiltration of Ly6GlowLy6Chigh and Ly6GhighLy6Clow sub-populations of MDSCs respectively, and also elevated CD8+ T cell exhaustion (Extended Data Fig. 10a,b). However, the populations of macrophages, NK cells and regulatory T cells are not significantly altered upon C26-A6 monotherapy (Extended Data Fig. 10a,b). Interestingly, combination with anti-PD-1 therapy increased the numbers of macrophage, NK cell and regulatory T cell in the microenvironment, and also reduced the exhausted CD8+ T cells (Extended Data Fig. 10a,b). These results collectively indicate that, in addition to affecting the CD8+ T cells, C26-A6 significantly reshaped the immune populations in the tumor microenvironment, especially in combination with anti-PD-1.
Fig. 6. MTDH-SND1 disruption and anti-PD-1 treatment synergistically inhibits metastatic breast cancer progression.
a, OT-I splenocytes co-cultured with indicated Py8119-OVA cells were harvested after 24 hr. The expression of PD-1 in CD8+ T cells was examined by flow cytometry. % of CD8+PD-1+ cells in live cell populations are shown. shCtrl, Py8119-OVA without MTDH KD; shMTDH, Py8119-OVA with MTDH KD; shMTDH+WT, Py8119-OVA with MTDH KD and rescued with wildtype MTDH; shMTDH+W391D, Py8119-OVA with MTDH KD and rescued with SND1 interaction-deficient mutant MTDH-W391D; shMTDH+W398D, Py8119-OVA with MTDH KD and rescued with SND1 interaction-deficient mutant MTDH-W398D. n=3 independent experiments. Significance determined by one-way ANOVA analysis with Dunnett’s test for multiple comparisons. b, Cells in (a) were gated on the CD8+ T cell population and the mean fluorescence intensity (MFI) of PD-1 expression was measured. AU, arbitrary units. n=3 independent experiments. Significance determined by one-way ANOVA analysis with Sidak’s test for multiple comparisons. c, PyMT;UBC-CreERT+/−;Mtdhfl/fl females with tumors established were treated with Tmx and anti-PD-1 alone or in combination as illustrated in Extended Data Fig. 9c. Primary tumors were measured weekly during the treatments. n=6 mice per group. Significance determined by Two-Way Repeated Measures ANOVA test. d, Lungs were collected and fixed at endpoint. Metastatic nodules were counted. The % of metastatic tumor area in lungs was also quantified based on H&E staining. Size bars, 5 mm. n=6 lungs per group. Significance determined by one-way ANOVA analysis with Sidak’s test for multiple comparisons. e, Primary tumors and lungs from (c) were fixed for CD8 IHC staining. Infiltrated CD8+ T cells were quantified. n=3 lungs per group. Significance determined by one-way ANOVA analysis with Sidak’s test for multiple comparisons. f, Primary tumors and lungs from mice as treated in (c) were dissociated for flow cytometry analysis. Activated T cells were quantified using CD69 as a marker. % of CD8+CD69+ cells in live cell populations are shown. n=4 lungs per group. Significance determined by one-way ANOVA analysis with Sidak’s test for multiple comparisons. Data represent mean ± SEM in all panels. Numerical source data are for all panels provided.
Fig. 7. C26-A6 treatment synergizes with anti-PD-1 therapy for metastatic breast cancer.
a,b, FVB-PyMT females with primary tumors established were divided into 4 groups and treated with vehicle, anti-PD-1, and C26-A6 alone or in combination. Six weeks after treatment, primary tumor (a) and lung metastatic (b) burdens were quantified. Anti-PD-1, 200 μg/mouse i.p. injection, twice per week for the first week and then once per week after that; C26-A6, 15 mg/kg i.v. injection, 5 days per week. n=10 mice per group (a). n=5 lungs per group (b). Size bar, 5 mm. Data represent mean ± SEM. Significance determined by one-way ANOVA analysis with Sidak’s test for multiple comparisons. c,d, CD8+ T cell infiltration (c) and IFN-γ expression in CD8+ T cells (d) of the sample in (a) were determined by flow cytometry. % of CD8+ cells (c) and CD8+IFN-γ+ cells (d) in CD45+ populations are shown. Data represent mean ± SEM. n=5 tumors/lungs per group. Significance determined by one-way ANOVA analysis with Sidak’s test for multiple comparisons. e-h, FVB females were injected with 100k of luciferase stably expressed PyMT cells. Three weeks after the injection, lung metastases were established and the mice were randomized into two groups (e). BLI signals were determined before the treatment (f). The mice were treated with vehicle or C26-A6+anti-PD-1 and the metastasis were monitored by BLI (g). Kaplan-Meier survival curves of the two groups are shown (h). n=6 mice per group. Data represent mean ± SEM (f). Significance determined by two tailed Student’s t-test (f), or two-sided Log-rank test (h). Numerical source data for a-d and f-h are provided.
To more closely mimic the clinical treatment situation, we asked if C26-A6+anti-PD-1 treatment could control cancer progression in a model with established macro-metastases. To this end, we generated FVB females with well-established lung macro-metastases 3 weeks after intravenous injection of PyMT tumor cells (Fig. 7e). Six mice in each group were then randomized based on BLI signals (Fig. 7f), followed by treatment with vehicle or C26-A6+anti-PD-1. C26-A6+anti-PD1 treatment group in general has significantly slower metastasis progression pace compared to aggressive metastatic growth in the control group. Importantly, two mice in the combined treatment group had metastasis regression and the other one had stabilized disease (Fig. 7g). C26-A6+anti-PD1 treatment group also had significantly improved survival rate (Fig. 7h). The data suggest that C26-A6 combined with anti-PD1 therapy may have clinical benefits in metastatic breast cancer patients.
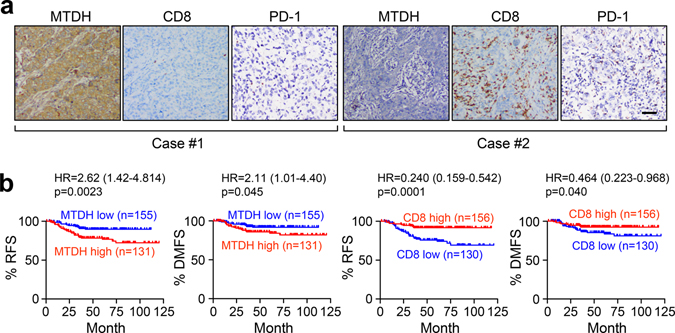
Consistent with these findings from mouse models, IHC staining of human triple-negative breast tumor samples showed that MTDH expression is negatively correlated with CD8+ cytotoxic T cell infiltration as well as PD-1 expression (Fig. 8a and Extended Data Fig. 10c). Consistent with our previous studies, MTDH-high patients have worse relapse-free and distant-metastasis free survival (Fig. 8b)7,10. In contrast, CD8+ T cell infiltration is correlated with better survival (Fig. 8b). In summary, our study indicates MTDH-SND1 complex prevents tumor antigen presentation by degrading Tap1/2, and therefore, inhibits CD8+ T cell infiltration and activation to eventually promote immune evasion and metastasis. Importantly, MTDH-SND1 blocking improves response to anti-PD-1 therapy and synergistically suppresses metastatic breast cancer progression.
Fig. 8. MTDH expression negatively correlates with CD8+ T cell infiltration and PD-1 expression in TNBC patients.
a, IHC staining shows negative correlation between MTDH expression and CD8+ T cell infiltration or PD-1 expression in primary tumors from TNBC patients. n=286 patients. Representative images were shown. Scale bar, 100 μm. b, Kaplan-Meier plot of relapse free survival (RFS) and distant metastasis free survival (DMFS) of TNBC patients stratified by MTDH protein levels and infiltrated CD8+ T cells. p-value by two-sided Log-rank test.
Discussion
Given the fact that metastasis remains the single most important reason why patients still die from breast cancer23, we focused on understanding the molecular and cellular basis of the metastasis-promoting function of MTDH as an avenue to develop new therapeutics against metastatic diseases. Based on the findings that MTDH promotes breast cancer progression by interacting with SND1, we developed small chemical inhibitors that disrupt MTDH-SND1 complex, which show significant therapeutic potential in animal models12. However, the detailed molecular mechanism underlying this therapeutic effect is poorly understood. In the present study, we took advantage of the PyMT mouse model in the FVB genetic background with constitutive or inducible KO of MTDH, which provided us the first clue that MTDH plays a role in regulating the anti-tumor immune response in immunocompetent mouse models. Moreover, Py8119 and E0771 models in C57BL/6 background were also employed, which enabled us to perform tumor/immune cell co-culture to specifically investigate the mechanism underlying MTDH-SND1-mediated immune regulation. Combing these mouse models and human tumor sample studies, we discovered a new role of MTDH-SND1 in reducing the cell surface presentation of tumor antigen by destabilizing Tap1/2 mRNAs which encode key components of the antigen presentation machinery. As such, a high level of MTDH in tumors decreases the infiltration and activation of T cells, and facilitates immune evasion of metastatic breast cancer.
Immunotherapy has achieved exciting success in several cancers24–26, however, metastatic breast cancer patients did not respond well to this treatment in clinical trials27,28. The resistance to immunotherapy, especially immune checkpoint blockade therapy, is partially due to the low immunogenicity of the disease29,30, which resulted in limited immune cell infiltration. The presentation of tumor associated antigens attracts the CD8+ cytotoxic T cell infiltration, enhances the T cell activation, and consequently leads to tumor suppression31,32. However, to escape such immunosurveillance, tumor cells may develop resistant mechanisms, including attenuating antigenicity. MTDH is a frequently overexpressed protein in breast cancer7, and in our present study, was found to decrease the presenting of antigens on the surface of malignant cells (Fig. 3). In line with this finding, mice with MTDH-KO or breast cancer patients with lower MTDH have significantly elevated CD8+ cytotoxic T cell infiltration and activation (Figs. 6–8).
In cancer context, tumor antigens are produced through proteasome-mediated degradation, endoplasmic reticulum loading (ER), and then cell surface presenting33. At the molecular level, TAP1 and TAP2, which are members of the ATP-Binding Cassette (ABC) family34, associate with other proteins to load the peptides to MHC-I-β2m complex, and then present antigens on the cell surface35–38. Given the critical roles of TAP1/2 in antigen processing and presentation, cells that lack TAP1 or TAP2 forms limited MHC-I-peptide complex39,40, which in turn significantly affects the surface presenting of antigens. Consistent with this notion, breast cancer patients with lower TAP1/2 have significantly worse prognosis41,42. Not only in breast cancer, reduced expression of TAP has also been observed in other tumor types, and it is thought to be one major mechanism of tumor immune evasion39,43. In this study, MTDH was found to bind and destabilize Tap1/2, which resulted in less Tap1/2 in tumor cells (Fig. 3). This finding also explains reduced antigen presentation in the tumors with high MTDH expression and lower activation of the co-cultured immune cells. However, we cannot exclude the possibility that MTDH also regulated Tap1/2 in transcriptional or post-translational level. Indeed, MTDH was found to be localized to ER41. It may also affect antigen processing and presenting by disrupting peptide loading complex or in other TAP1/2 independent pathways.
MTDH and SND1 have both been reported as RNA binding proteins before44–49, which is consistent with our findings. The RNA binding of both MTDH and SND1 promotes cancer progression44,47–49, suggesting the oncogenic role of these two proteins through the RNA regulation. SND1 is a member of RNA-induced silencing complex (RISC) that binds and degrades RNAs48,49. In lines with these previous findings, our data indicate SND1 interacts with and destabilizes Tap1/2 in association with MTDH (Fig. 4). Given the data that SND1 knockdown almost completely eliminates the binding between MTDH and Tap1/2 but not vice versa (Extended Data Fig. 5), we believe that instead of directly binding Tap1/2, MTDH assists Tap1/2 binding and degradation by SND1, and therefore inhibits the antigen presentation. Functionally, MTDH-SND1 disruption enhances immunosurveillance and inhibits metastatic breast cancer development. As reported in previous studies48,49, we believe that the RNA binding of SND1 may not be restricted to Tap1/2 and may include other RNAs with functional importance, However, the detailed mechanism underlying its RNA binding and degradation is beyond the scope of the current study and needs to be further characterized.
Although MTDH-SND1 prevents the immune recognition of breast cancer cells, we also observed the tumor promoting function of MTDH-SND1 in immune deficient mouse models in our co-submitted companion study12. Based on the NGS analysis of gene expression changes in tumors upon acute MTDH depletion or C26-A6 treatment, we identified two classes of functionally important genes: genes that are up-regulated after MTDH depletion or C26-A6 treatment; and genes that are down-regulated. By analyzing MTDH depletion or C26-A6 treatment-downregulated genes, we found the negative enrichment of cell survival pathways and positive enrichment of necrosis and apoptotic pathways12. This data suggested that MTDH-SND1 enhanced tumor-intrinsic proliferation and survival, which is also supported by Ki67 and cleaved caspase-3 IHC staining and the in vitro tumorsphere assay in the companion study12. On the other hand, by analyzing MTDH depletion or C26-A6 treatment upregulated genes, we found the enrichment of immune related signatures (Fig. 1e and Extended Data Fig. 1e); and further mechanistic studies indicated that MTDH-SND1 inhibits tumor antigen presentation and suppresses anti-tumor immune response in immunocompetent models. Collectively, MTDH-SND1 promotes tumor progression and metastasis by enhancing tumor-intrinsic proliferation and survival rates (see companion study12). Meanwhile, MTDH-SND1 also suppresses breast tumor progression by regulating stromal immune responses (current study). Given the data from CD8+ T cell depletion experiments (Fig. 1i, and Extended Data Fig. 2b–d), we believe CD8+ T cells play critical roles in suppressing cancer progression after genetic disruption or therapeutic targeting of MTDH-SND1. In addition, NK cell has also been demonstrated to restrain breast cancer metastasis50. However, as MTDH KO or C26-A6 treatment did not alter the NK cell population in the tumor microenvironment (Extended Data Figs. 1f, 1g, and 10a), we believe that the antitumor effects of NK cell is independent of MTDH. On the other hand, since C26-A6 also affects MDSC populations (Extended Data Fig. 10a), we cannot exclude the possibility that MDSC populations might also be involved in this effect.
Taken together, the experimental results from our two studies support the notion that both mechanisms contribute to the tumor promoting role of MTDH-SND1. Importantly, C26-A6 is able to block both MTDH-mediated mechanisms and achieve therapeutic benefits, making it an ideal candidate for further development as a novel therapeutics. Besides the increased CD8+ cytotoxic T infiltration and activation upon MTDH-SND1 disruption, we also observed elevated levels of PD-1 expression (Fig. 6a,b and Extended Data Fig. 9a,b). Such a finding was also supported by patient samples (Fig. 8a), which supports the rationale for the combined therapy of immune checkpoint blockade and MTDH-SND1 disruption. Indeed, synergistic effects have been obtained when we treated the metastatic breast cancer together with C26-A6 and anti-PD-1 (Figs. 6 and 7). In summary, our study not only provides novel insights into the mechanism underlying MTDH-mediated immune evasion but also establishes a new strategy to enhance the immunotherapy response in metastatic breast cancer.
Methods
Animal models
All experimental protocols involving animals were conducted in compliance with the Institutional Animal Care and Use Committee (IACUC) of Princeton University. According to our approved IACUC protocol (1881–20), the primary humane endpoint of tumor burden for an individual mouse is 20 mm in any dimension or a total volume of 4000 mm3 for mice with multiple tumors. Mice were euthanized before exceeding the limit of tumor burden in this study. In our facility, mice were maintained at 20–22°C with 14 h:10 h light:dark cycles at 40–70% relative humidity. MTDH knockout mice and backcrossed derivatives generated in our laboratory (MMTV-PyMT; Mtdh−/− 10, MMTV-PyMT;UBC-CreERT+/−;Mtdhfl/fl 12 on the FVB background were described previously, while the OT-I mice were obtained from Jackson Laboratory (Stock No: 003831). For spontaneous and experimental metastasis experiments, 8–10 weeks old female FVB, C57BL/6, or OT-I mice were injected with tumor cells by either tail vein or mammary fat pad injection as described. For spontaneous tumorigenesis studies, 4–6 weeks old mice were anaesthetized, and subsequently, a small incision was made to reveal the mammary gland. Single-cell suspensions of 10μL PBS/Matrigel (1:1) were injected into the inguinal (#4) mammary fat pad following standard injection procedures51, and mice were examined weekly for mammary tumor development. Tumors were considered established when they became palpable for 2 consecutive weeks, and tumors were measured by calipers for calculation of tumor volumes (length × width2/2). For the cell lines that are stably labeled with a firefly luciferase expressing vector, lung metastases were monitored by bioluminescent imaging (BLI) and images were processed with Living Image 3D Analysis (version 1.0). Alternatively, lung nodules were counted directly after fixation in Bouin’s solution or after sectioning and H&E staining of the lungs. We used 5–10 mice per experimental group as indicated in each experiment.
Generation of triple-negative breast cancer cohort
Our study was approved by the independent ethics committee/institutional review board of FUSCC (Shanghai Cancer Center Ethics Committee). All patients gave their written informed consent before inclusion. The cohort was generated as described in detail in our previous studies52,53. Detailed patient information has also been provided in our companion study12.
Immunohistochemistry (IHC) staining and IHC-based classification
We performed immunohistochemistry (IHC) staining on paraffin-embedded sections (4 μm thick) of tumor specimens to evaluate the expression of MTDH, CD8, and PD-1. IHC staining was performed using Ventana Benchmark ULTRA automated immunostainer (Ventana Medical Systems, Tucson, Arizona, USA). We used the following primary antibodies: anti-CD8 (SP57, Ventana, undiluted for patient samples; CST, # 98941S, 1:100 dilution for mouse samples), anti-MTDH (Sigma, AMAB90762, 1:500 dilution), anti-PD-1 (CST, 43248S, 1:200 dilution), anti-CD3 (abcam, Ab16669, 1:200 dilution), anti-CD4 (CST, 25229S, 1:200 dilution), and anti-CD161 (CST, 39197S, 1:200 dilution). Slides were then incubated with Goat Anti-Rabbit (Vector Laboratories, BA-1000, 1:300 dilution) IgG Antibody (H+L), Biotinylated. Images were taken with Carl Zeiss Zen (version 3.0) and processed with ImageJ (bundled with Java 1.8.0_172).
The IHC staining of MTDH was mainly found in the cytoplasm in tumor cells. We measured the protein expression level of this marker as the percentage of positive tumor cells (the number of positive tumor cells divided by the total number of tumor cells). By contrast, CD8 and PD-1 staining was primarily found in tumor-infiltrating lymphocytes (TILs), so we measured the protein expression level of CD8 and PD-1 as the percentage of positive cells (the number of positive cells divided by the total number of all types of cells). We employed a cutoff of >7.5% positive tumor cells to define MTDH high, cutoff of ≥ 10% positive cells to define CD8 high, and cutoff of >4% positive cells to define PD-1 high. All stained paraffin-embedded sections were independently evaluated by two experienced pathologists who were blinded to the patients’ clinical information. Discrepancies between the two pathologists were resolved by discussion and consensus.
Cell lines
HEK293T (CRL-3216) were obtained from American Type Culture Collection (ATCC), PyMT cells (FVB background) were generated in our previous study10, Py8119 (ATCC, CRL-3278) and E0771 (ATCC, CRL-3461) cells (C57BL/6 background) were obtained from Dr. Weizhou Zhang’s lab. HEK293T, PyMT, and E0771 cells were cultured in DMEM media containing 10% FBS, 2 mM glutamine, and 100U penicillin/ 0.1 mg/ml streptomycin, while Py8119 cells were cultured in DMEM/F12 (1:1) media containing 10% FBS, 20 ng/ml EGF, 5 μg/ml insulin, 2 μg/ml hydrocortisone and 100U penicillin/ 0.1 mg/ml streptomycin. All cells were regularly checked for Mycoplasma and authenticated. Mouse splenocytes freshly isolated from OT-I mice were cultured in RPMI-1640 with 10% FBS, 1% HEPES, 1% sodium pyruvate, 0.05 mM β-mercaptoethanol, and 100U penicillin/ 0.1 mg/ml streptomycin.
NGS and GSEA analysis
For Next-generation sequencing (NGS), PyMT;UBC-CreERT+/−;Mtdhfl/fl tumorspheres were cultured as previously reported10. The tumorspheres were treated with vehicle or 0.02 μg/ml of 4-Hydroxytamoxifen (4-OHT) for 5 days. The 4-OHT containing media was changed with fresh media and the tumorspheres were cultured for another week. Total RNA samples were prepared from the tumorspheres using RNAeasy kit (Qiagen), and the following RNA preparation and sequencing procedures were performed as described in our companion paper12. Normalized gene expression data were pre-ranked based on the differences of expression (fold changes). The differential genes were identified as p<0.05 (moderated T-test) and fold change > 2 folds. Gene Set Enrichment (GSEA) analysis was performed as described in the companion paper12.
Viral production and infection
pLKO plasmids containing shRNA sequences that target murine Mtdh (shMTDH-1, TRCN0000125816; and shMTDH-2, TRCN0000313386), murine Snd1 (shSND1–1, TRCN0000054742; and shSND1–2, TRCN0000295753), murine Tap1 (TRCN0000066349), and murine Tap2 (TRCN0000066389) were purchased from Sigma-Aldrich (St Louis, MO, USA) and were cloned as described previously8,10. For overexpression and rescue experiments, plasmids encoding wild-type Mtdh and mutant forms of Mtdh with SND1-interaction deficiency (W391D, W398D) were generated as previously described10,11. To generate Py8119-OVA and E0771-OVA cell lines, Ovalbumin cDNA was obtained from pCl-neo-cOVA (Addgene, #25097). The Ova cDNA was cut out using NheI/SalI and ligated to IRES2-mCherry fragment from pIRES2-mCherry, and altogether cloned into the lentiviral vector pLEX replacing the IRES2-puro fragment. All plasmids were packaged into viruses using HEK293T cells as packaging cell lines along with helper plasmids, VSVG and dR8.9, following standard protocols. Viruses were collected 48–72 h after transfection. Target cells were infected with viral media in the presence of 5 μg/ml Polybrene. The infected cells were selected with puromycin (KD stable cell lines) or picking mCherry positive cells with flow (Py8119-OVA and E0771-OVA stable cell lines). E0771-OVA cell line was transduced with lentiviral expressing firefly luciferase with the same virus production and infection procedure as above to generated luciferase stably expressing E0771-OVA cell line.
Splenocyte isolation
OT-I mice were euthanized by cervical dislocation and spleens were collected into 50 ml conical tubes containing serum-free RPMI-1640 media. Spleens were smashed and passed through sterile mesh filters using 10 ml of media to wash the screen. Cells were spun down at 1200 rpm for 5 min, supernatant removed, and then resuspended in 10 ml ACK buffer (Fisher) for red blood cell lysis. Cells were briefly vortexed, allowed to sit at room temperature for 1 minute, and then quenched with 5 ml of culture media. Cells were then spun down and resuspended in culture media, counted, and plated in 6 well plates at 2×10⁶ cells/ml.
CD8+ T cell isolation
CD8+ T cells from OT-I splenocytes obtained above were further isolated with CD8a+ T Cell Isolation Kit (Miltenyi Biotec, #130–104-075). Briefly, Cells were resuspended in 40 μL of buffer (PBS with 0.5% BSA and 2 mM EDTA) per 107 total cells. 10 μL of Biotin-Antibody Cocktail was added followed by 5 min of incubation at 4°C. After adding another 30 μL of buffer, 20 μL of Anti-Biotin MicroBeads was added. The cells were incubated for 10 min at 4°C and passed through LS column. The flow through CD8+ T cells were collected for future experiments.
Immune cell and tumor cell co-culture assay
Py8119-OVA tumor cells with various MTDH expression status were plated in 6-well plates for in vitro co-culture in DMEM/F12 media listed above. Once cells reached 50–75% confluency OT-I splenocytes or CD8+ T cells were added to the tumor cells at the 1:10 ratio (tumor cell : immune cell). After 24 hr of co-culture, the cells and culture media were collected for further experiments.
ELISA
Conditioned media was collected from OT-I and tumor cell co-cultures. IFN-γ Quantikine® ELISA kits (R&D systems) were utilized to measure the concentration of IFN-γ according to the manufacturer’s instruction.
qRT-PCR analyses
Total RNA was isolated from tumor samples or cells using the Qiagen RNA extraction kit in accordance with the manufacturer’s instructions and reverse transcript into cDNA with SuperScript™ IV kit. Real-time RT-PCR was performed on an ABI 7900 96 HT series PCR machine (Applied Biosystems) using SYBR Green Supermix (Bio-Rad Laboratories). The gene-specific primer sets were used at a final concentration of 0.2 μM and their sequences are listed in Supplementary Table 1. All qRT-PCR assays were performed in duplicate in at least three independent experiments using three different cell or tissue samples.
RNA-Binding immunoprecipitation (RIP) and western blot (WB)
Py8119-OVA tumor cells after co-culture for 24 hr were collected for RIP using RNA-Binding Protein Immunoprecipitation Kit (Millipore, #17–700). Briefly, 5×10⁷ tumor cells were resuspended with 200 μL of RIP lysis buffer and frozen at −80°C for at least 1 hr to lyse the cells. The sample was then centrifuged at 14,000 rpm for 10 min at 4°C. 20 μL of supernatant was transferred to two new tubes with 10 μL each and frozen at −80°C to serve as input of total. The rest of the supernatant was diluted with 1.8 ml of RIP immunoprecipitation buffer and split equally into two 1.5 ml EP tubes. 5 μg of MTDH (Invitrogen, catalogue # 40–6500), SND1 (Santa Cruz, catalogue # sc-271590) or IgG (provided in the Kit) antibody was added into each tube and incubated at 4°C overnight. The next day, 50 μL of magnetic beads was added and incubated for another 2 hr. The beads were then washed with 500 μL of RIP wash buffer on a magnetic separator for 5 times. During the final wash, 25 μL of the beads in the wash buffer was transferred into a new tube, stored at −80°C to serve as input of IP. The rest of the beads together and 10 μL input of total were resuspended with 300 μL of proteinase K buffer respectively and incubated at 55°C for 30 min to degrade proteins. RNA was extracted with phenol:chloroform:isoamyl alcohol and precipitated with 100 μL of Salt Solution I, 30 μL of Salt Solution II, and 10 μL of Precipitation Enhancer at −80°C overnight. The samples were then spun at 14,000 rpm for 30 min and RNA was washed with 80% ethanol. Finally, RNA was resuspended with 10 μL of RNase-free water. qRT-PCR was performed to detect Tap1/2. The pulldown of MTDH and SND1 was confirmed with western blot.
For western bot, the input of total and IP described above, or proteins that extracted from Py8119 cells with/without co-culture in RIPA buffer were resolved with SDS-PAGE gel and immunoblotted with standard protocols. Antibodies against MTDH (invitrogen, catalogue # 40–6500), SND1 (Santa cruz, catalogue # sc-271590), SND1 (Sigma, HPA002529), TAP1 (CST, #12341S), and TAP2 (Thermo Fisher Scientific, # PA5–37414) were diluted 1:1000, while antibody against β-actin control (Abcam, catalogue #ab6276) was diluted 1:5000.
Electrophoretic Mobility Gel Shift Assay (EMSA)
TAP1 and TAP2 mRNA was prepared by in vitro transcription with Standard RNA Synthesis Kit (NEB, E2050). pcDNA3.1 with full-length TAP1 and TAP2 ORFs were used as template (GeneScript, OHu19274D and OHu24630D). The products were Biotin-labelled and purified with Pierce™ RNA 3’ End Biotinylation Kit (ThermoFisher, 20160). 100 nM of human recombinant MTDH protein (Abnova, H00092140-P01) or human recombinant SND1 protein (Abnova, H00027044-P01) alone or in combination were incubated with 10 nM of biotin-labelled TAP1 or TAP2 mRNA for 15 min in room temperature. For MTDH and SND1 in combination group, 100 nM of MTDH and SND1 proteins were preincubated on ice for 1 hr. After the incubation, EMSA assay was performed using LightShift™ Chemiluminescent EMSA Kit (ThermoFisher, 20148).
Cell viability and cytotoxicity assays
To assess tumor cell viability after CD8+ T cell co-culture, we used the LDH cytotoxicity assay (Promega, #G1780) to measure T-cell killing of Py8119-OVA tumor cells following the manufacturer’s instructions. Briefly, after co-culture, 50 μL co-culture media was collected and added to 96-well plate. Same amount of CytoTox 96 reagent was added and incubated in room temperature for 30 min. Absorbance at 490 nm was measured to calculate cytotoxicity.
Antibody collection and T-cell depletion
TIB-207 (anti-CD4) and TIB-105 (anti-CD8) hybridoma cell lines were obtained from ATCC for the collection of T-cell depletion antibodies. CD hybridoma media (Gibco®) supplemented with 4% GlutaMAX™ was used for hybridoma cell culture. Conditioned media from >90% confluent 10 cm plates of hybridoma cells was collected, spun down to remove cell debris, and filtered through a 0.2 μm filter set before purification. The HiTrap Protein G HP column (GE Healthcare Life Sciences) was used to purify antibody using binding buffer (20mM sodium phosphate pH 7.0) elution buffer (0.1 M glycine-HCl pH2.7) and neutralization buffer (1 M Tris-HCl pH 9.0) following the manufacturer’s instructions. Purified antibodies were then concentrated using Amicon ultra-15ml (3K) spin tubes (Millipore) at 4000 rpm for 45 min at 20°C. Concentrated antibody was dialyzed against PBS at 4°C overnight and then antibody concentration was quantified by standard Bradford assay. For in vivo T-cell depletion experiments, animals were injected with either 125 μg/mouse of antibody or same amount of isotype control in PBS by i.p. injection three days prior to tumor cell injection and then every three days post tumor cell injection.
Flow cytometry
Dissociated tumors or lungs were dissected and prepared as previously described10. Specifically, samples were minced into small pieces and digested for 1 hr at 37°C in culture medium (1:1 Dulbecco’s modified Eagle’s medium (DMEM): Ham’s F-12 medium containing 5% FBS, 10 ng/ml epidermal growth factor [EGF], 500 ng/ml hydrocortisone, 5 μg/ml insulin, 20 ng/ml cholera toxin, and 1% Pen/Strep) supplemented with 300 U/ml type 1A collagenase (Thermofisher) and 100 U/ml hyaluronidase (Sigma) to prepare single cell suspensions as previously described54. Organoids were sequentially suspended with 0.25% trypsin-EDTA for 1.5 min, 5 mg/ml Dispase (Invitrogen), and 0.1 mg/ml DNase (Sigma) for 5 min, and 0.64% ammonium chloride for 5 min at 37°C before filtration through a 40 μm nylon cell strainer. Tumor or lung cell suspensions were incubated with an antibody cocktail in FACS buffer (PBS + 3% BSA) for 30 minutes at 4°C, washed, and resuspended in FACS buffer for flow analysis. Isotype controls were used to assess specificity of antibody labeling. Antibodies (with 1:200 dilution) used for staining immune or tumor cells are as follows: DAPI (ThermalFisher, #62248, 1:1000) or Fixable Viability Dye eFluor™ 506 (ThermalFisher, #65–0866-14, 1:1000) served as live/dead indicator; PerCP-Cy5.5 anti-mouse CD45 (eBioscience, #45–0451-82); PE-Cy7 anti-mouse CD4 (BioLegend, #100422); APC anti-mouse CD25 (BioLegend, #102012); FITC anti-mouse CD8a (eBioscience, #11–0081-82), APC anti-mouse CD8a (BioLegend, #100712), APC-Cy7 anti-CD8a (BioLegend, #100714), APC anti-mouse PD-1 (BioLegend, #135210); APC-Cy7 anti-mouse CD3 (BioLegend, #100330); PE anti-mouse CD137 (BioLegend, #106106); FITC anti-mouse CD69 (BioLegend, #104506); PE anti-mouse Granzyme B (ThermoFisher, #12–8898-82); FITC anti-mouse IFN-γ (BioLegend, #505806); APC anti-mouse OVA256–264 peptide (SIINFEKL) bound to H-2Kb (BioLegend, #141605); FITC anti-mouse H-2Kd/H-2Dd (MHC-I) (BioLegend, #114606); PE-Cy7 anti-mouse CD11b (BioLegend, #101216), APC-Cy7 anti-mouse F4/80 (BioLegend, #123118), FITC anti-mouse Ly6G (BioLegend, #127606), PE anti-mouse Ly6C (BioLegend, #128008), PE anti-mouse NK1.1 (BioLegend, #108708), FITC anti-mouse FOXP3 (eBioscience, #11–5773-82), PE-Cy7 anti-mouse GITR (BioLegend, #126318), and PE anti-mouse LAG-3 (BioLegend, #125208). To test the expression of cytokines, such as IFN-γ and Granzyme B, cells were treated with 100 ng/ml of Phorbol 12-myristate 13-acetate (Sigma, #79364), Ionomycin (Sigma, #I0634), and protein transport inhibitor for 4 hr, before subjected to the antibody staining. Fixation/Permeabilization Solution Kit with BD GolgiStop™ Kit (BD, #554715) was employed for the cell staining. Samples were analyzed with BD FACSDiva v6 software and data was processed with FlowJo v10 software. Gating strategy is shown in Supplementary Fig. 1.
Tamoxifen (Tmx), C26-A6 and anti-PD-1 in vivo treatment
MMTV-PyMT or MMTV-PyMT;UBC-CreERT+/−;Mtdhfl/fl females were divided into four groups when primary tumors have been established (tumors were considered established when they became palpable for 2 consecutive weeks).The mice were treated with C26-A6 and anti-PD-1 alone or in combination; or treated with Tmx and anti-PD-1 alone or in combination respectively.
Tmx (Sigma-Aldrich, #T5648) and C26-A6 was prepared and administrated as previously described. Briefly, for Tmx treatment, indicated mice were injection with 60 mg/kg of the solution via i.p. for 5 constitutive days. Such dosing regiment of tamoxifen was commonly used in conditional KO of gene of interest in mouse models of breast cancer including MMTV-PyMT and been shown to have no direct effect on tumor growth and metastasis14,15. For C26-A6 treatment, the mice were injected via tail-vein (T.V.) 5 days per week at 15 mg/kg. For the mice that T.V. injection was failed due to the high frequency treatment at late timepoints, i.p. injection with 2x dose was performed instead.
PD-1 antibody (BioXcell, #BP0146) treatment was performed as previous reported55. The mice were treated on days 0, 4, 7, and then once weekly at 200 μg/mouse via i.p. Rat IgG2a (BioXcell, #BP0089) was injected with the same scheme served as control.
Statistics and reproducibility
Animals were excluded only if they died or had to be euthanized according to our IACUC protocol. No statistical method was used to predetermine sample size. Data collection and analysis were not performed blinded to the conditions of the experiments. For in vivo experiments, animals were randomized and treated as indicated in each experiment. For in vitro experiments, all samples were analyzed equally with no sub-sampling; therefore, there was no requirement for randomization. The experiments in Figures 3b,d; 4a,b and in Extended Data Figures 1a–c; 3b,f; 5a,h; 8a,g; 9d have been repeated for at least 3 times with similar results. Statistical analyses were indicated in figure captions. Error bars indicate means ± SEM. GraphPad Prism software (version 7) was used for statistical calculations.
Reporting Summary
Further information on research design is available in the Nature Research Reporting Summary linked to this article.
Data availability
All RNA sequencing data generated in this study have been deposited as a superseries at the NCBI Gene Expression Omnibus with the accession code GSE174630. Further information and requests for resources and reagents should be directed to the corresponding author. All requests for raw and analyzed data and materials will be reviewed promptly by the corresponding author to verify whether the request is subject to any intellectual property or confidentiality obligations. Any data and materials that can be shared will be released via a material transfer agreement. Source data supporting the findings of this study are provided.
Extended Data
Extended Data Fig. 1. MTDH depletion reshapes immune cell populations in tumors.
a, KO/PyMT cells were rescued with vector or wild type MTDH. The expression of MTDH was validated by western blot. b, Western blot analysis of endogenous MTDH knockdown in WT/PyMT cells. c, Western blot analysis of endogenous MTDH knockdown in E0771 cells with stable luciferase expression. d, 1×10⁶ of E0771 cells with (shMTDH-1, −2) or without (shCtrl) MTDH knockdown were injected into female C57/BL6 mice via tail-vein. 6 weeks after injection, lungs were collected (left) and metastatic nodules were counted (right). n=6 mice per group. Size bar, 5 mm. Data represent mean ± SEM. Significance determined by one-way ANOVA analysis with Dunnett’s test for multiple comparisons. e, PyMT;UBC-CreERT+/−;Mtdhfl/fl mice with tumors established were treated with vehicle or Tamoxifen (Tmx) for five consecutive days. One week after the treatment, tumors were collected, and RNA was extracted for RNA sequencing. Gene sets that are significantly enriched in ranked gene list of Tmx treated versus control cells. n=4 mice per group. f,g, Tumors from PyMT;UBC-CreERT+/−;Mtdhfl/fl mice treated with vehicle or Tmx were collected for immunohistochemistry (IHC) staining with indicated antibodies (f). The numbers of positive cells per field were quantified (g). Size bar, 50 μm. Data represent mean ± SEM. n=8 fields from 4 mice in each group. Significance determined by two tailed Student’s t-test. h, PyMT;UBC-CreERT+/−;Mtdhfl/fl tumorspheres were treated with vehicle (Ctrl) or 4-Hydroxytamoxifen (4-OHT) (MTDH-KO). The spheres were then collected for RNA sequencing. Gene set enrichment analysis demonstrates the enrichment of the indicated gene sets. p and q values automatically determined by GSEA 3.0. The enrichment scores of the indicated signatures from tumorspheres in vitro or tumor samples in vivo (Fig. 1e) were presented (right). Numerical source data for d, g, and uncropped blots for a-c are provided.
Extended Data Fig. 2. CD8+ T cells depletion partially restores MTDH knockdown induced metastatic inhibition.
a, FVB females were treated with 125 μg/mouse of anti-CD8 antibody or isotype control for 3 days. Peripheral blood was collected for flow cytometry analysis at indicated days after treatment (top). % of CD8+ cells in CD45+ populations are shown. Anti-CD8 antibody treatment scheme that used for the in vivo experiments in this study (bottom). b, 1×10⁶ E0771-shCtrl or shMTDH-1 (shMTDH hereafter) cells were injected into C57/BL6 females intravenously. The mice were subjected to isotype control or anti-CD4, anti-CD8 neutralizing antibodies treatment as in (a). 6 weeks after injection, the mice were euthanized, lungs were collected and fixed with Bouin’s solution. Representative lungs are shown and lung metastatic nodules were counted. n=6 mice per group. Size bar, 5 mm. Data represent mean ± SEM. Significance determined by one-way ANOVA analysis with Sidak’s’s test for multiple comparisons. c, Kaplan-Meier survival curve of C57/BL6 female mice injected with 1×10⁶ E0771-shMTDH that were treated with IgG or anti-CD8 neutralizing antibodies. n=6 mice per group. Significance determined by Log-rank test. d, 5×10⁵ -shCtrl or shMTDH E0771 cells were injected into the mammary fat pad of female C57BL6 mice, and the mice were treated with IgG or anti-CD8 neutralizing antibody as in (a). 6 weeks after injection, lungs were harvested and bioluminescent imaging (BLI) was performed to measure lung metastasis. Representative lungs (left), quantitative BLI signals (middle), and fold change of BLI signal between IgG and anti-CD8 groups (right) are shown. n=16 mice per group. Data represent mean ± SEM. Significance determined by two tailed Student’s t-test. Numerical source data for b, c, d, are provided.
Extended Data Fig. 3. Characterization of in vitro tumor-immune cell co-culture system.
a, MHC-I (H-2Kd/H-2Dd) presentation in parental Py8119 cells were analyzed by flow cytometry. Isotype IgG served as negative control. b, Stable expression of Ovalbumin (OVA) in the resulted Py8119-OVA cells were confirmed with western blot. c, Surface presentation of OVA (H-2Kb-SIINFEKL) in parental Py8119 and Py8119-OVA cells with or without OT-1 splenocytes co-culture were analyzed with flow cytometry. d, Splenocytes isolated from OT-I mice were treated with PBS or 2 μg/ml of Ovalbumin peptide (OVAp257) for 2 hr. The cells were washed with PBS and plated in fresh media for another 24 hr followed by flow cytometry analysis. % of CD137+ or IFN-γ+ cells in live populations are shown. e, Splenocytes on the CD8 population were gated and the mean fluorescence intensity (MFI) of CD137 and IFN-γ were measured. n=3 independent experiments. f, The indicated cells with endogenous Mtdh knockdown and vector (Vec) or wild type MTDH rescue were confirmed with western blot. g, The tumorigenesis ability of indicate cell lines were evaluated. Indicated cells were inoculated into the mammary fat pad of C57BL/6 female mice. Ten weeks after injection, lung metastatic nodules were counted. shCtrl, Py8119-shCtrl; KD, Py8119-shMTDH; shCtrl-OVA, Py8119-OVA-shCtrl; KD-OVA, Py8119-OVA-shMTDH; KD-OVA-Vec, Py8119-OVA-shMTDH rescued with vector; KD-OVA-MTDH, Py8119-OVA-shMTDH rescued with wild type MTDH. n=5 mice per group. h, Py8119-OVA cells with/without endogenous Mtdh knockdown or with/without wild type MTDH rescued were employed for mammary fat pad injections. The injected OT-I female mice were treated with/without anti-CD8 neutralization antibody or IgG. Six weeks after treatment, lung metastasis was determined. n=9 mice per group. i, Splenocytes co-cultured with indicated Py8119-OVA tumor cells (same as in Fig. 2b) for 24 hr were harvested for flow cytometry analysis. The expression of Granzyme B in CD8+ T cells were examined. MFI, Mean Fluorescence Intensity. n=3 independent experiments. Data represent mean ± SEM. Significance determined by two tailed Student’s t-test (e,g), or one-way ANOVA analysis with Sidak’s’s test for multiple comparisons (h,i).Numerical source data for e, g, h, i, and uncropped blots for b, f are provided.
Extended Data Fig. 4. Mtdh acute loss enhances tumor antigen presentation.
a, PyMT;UBC-CreERT+/−;Mtdhfl/fl mice with tumors were treated with vehicle or 60 mg/kg of Tamoxifen (Tmx) for five consecutive days. One week after the treatment, tumors were collected, and RNA was extracted for RNA sequencing. Ingenuity pathway analysis shows the top five molecular and cellular functions of Mtdh acute loss up-regulated genes. p values automatically generated by QIAGEN Ingenuity Pathway Analysis (QIAGEN IPA). b, RNA samples from (a) were subjected to qRT-PCR test of indicated genes. Data represent mean ± SEM. n=3 independent experiments. Significance determined by two tailed Student’s t-test. c, Py8119-OVA-shCtrl or shMTDH tumor cells were co-cultured with OT-I splenocytes for 0 or 24 hr. Tumor cells were then collected and subjected to flow cytometry to determine the surface presentation of MHC-I. MFI, mean fluorescence intensity. Data represent mean ± SEM. n=3 independent experiments. Significance determined by two tailed Student’s t-test. Numerical source data for b, c are provided.
Extended Data Fig. 5. SND1 binds to Tap1/2 and promotes their degradation.
a, Endogenous SND1 knockdown in Py8119-OVA cells was confirmed with western blot. b, Tap1/2 mRNA levels in the indicated Py8119-OVA cells that were co-cultured with OT-I splenocytes for 0 or 24 hr was examined by qRT-PCR. n=3 independent experiments. c, Indicated Py8119-OVA tumor cells co-cultured for 24 hr were treated with 10 μg/ml of actinomycin D for another 8 hr. RNA levels of Tap1/2 in tumor cells were determined by qRT-PCR. n=3 independent experiments. d-g Py8119-OVA cells with SND1 (d) or MTDH (f) knockdown were subjected to RIP assay after 24 hr co-culture. The interaction between SND1 or MTDH and Tap1/2 was determined by PCR. Tap1/2 RNAs that bind to MTDH (e) or SND1 (g) were quantified and normalized to the pulled down MTDH and SND1 levels, respectively. n=3 independent experiments. h, Electrophoretic mobility gel shift assay was performed with in vitro transcribed TAP1/2 mRNA incubated with PBS, recombinant MTDH and SND1 alone or in combination. Data represent mean ± SEM. Significance determined by one-way ANOVA analysis with Dunnett’s test for multiple comparisons (b,c,e), or two tailed Student’s t-test (g). Numerical source data for b, c, e, g,and uncropped images for a, d, f, h are provided.
Extended Data Fig. 6. SND1 inhibits antigen presentation and T cell activation.
a-d, Py8119-OVA tumor cells (a,b) and OT-I splenocytes (c,d) after co-culture were collected to test OVA (H-2Kb-SIINFEKL) and MHC-I presentation, or CD137 and IFN-γ expression. MFI, mean fluorescence intensity; AU, arbitrary units. e, Media from (a) was employed for ELSA to test IFN-γ concentration and cytotoxicity assay. In panels from a-e, n=3 independent experiments. f, PyMT tumor cells with MTDH KD or indicated rescues were injected into FVB females intravenously. Five weeks after injection, lung metastatic nodules were counted, and representative lungs were shown. n=6 lungs per group. Data represent mean ± SEM. Significance determined by one-way ANOVA analysis with Dunnett’s test for multiple comparisons (a-e), or one-way ANOVA analysis with Sidak’s test for multiple comparisons (f). Numerical source data for a-f are provided.
Extended Data Fig. 7. C26-A6 treatment elevates immune responses in tumors.
a, The correlation between all the gene sets that alters by Mtdh acute loss and C26-A6 treatment. b,c, Py8119-OVA cells co-cultured with OT-I splenocytes were treated with 200 μM of C26-A6 or same amount of vehicle. The binding between SND1 and Tap1/2 in tumor cells were determined by RIP assay (b). Tap1/2 RNAs that bind to SND1 were quantified and normalized to the pulled down SND1 levels (c). d, MHC-I presentation in Py8119-OVA cells with/without 200 μM of C26-A6 treatment in co-culture were determined by flow cytometry. MFI, mean fluorescence intensity; AU, arbitrary units. e,f, The expression of CD137 and IFN-γ in splenocytes co-cultured with Py8119-OVA were determined by flow cytometry upon 200 μM of C26-A6 or vehicle treatment. MFI, Mean Fluorescence Intensity; AU, arbitrary units. In panels from b-f, data represent mean ± SEM. n=3 independent experiments. Significance determined by two tailed Student’s t-test. Numerical source data for a, c-f and uncropped images for b are provided.
Extended Data Fig. 8. MTDH-SND1 complex promotes immune evasion through Tap1/2.
a, Western blot analyzing to confirm the knock down of Tap1/2 in E0771 cells (E0771-OVA) stably expressing luciferase and OVA after lentiviral transduction of respective shRNAs. b-d, E0771-OVA cells with (shTap1/2) or without (shCtrl) Tap1/2 knockdown were co-cultured with OT-I splenocytes with the ratio of 1:10 (tumor cells:splenocytes). 24 hr after co-culture, Tumor cells (b,c) and splenocytes (d) were collected for examining OVA (H-2Kb-SIINFEKL), MHC-I, and CD137 expression, respectively. MFI, mean fluorescence intensity; AU, arbitrary units. Data represent mean ± SEM. n=3 independent experiments. Significance determined by one-way ANOVA analysis with Sidak’s test for multiple comparisons. e, The same co-culture experiment as in (b) were performed. The live tumor cells were indicated by luciferase signal. The percentage of live cells were determined as normalized to the non-co-culture control. Data represent mean ± SEM. n=5 independent experiments. Significance determined by one-way ANOVA analysis with Sidak’s test for multiple comparisons. f, PresentER-Vector or PresentER-OVA (H-2Kb-SIINFEKL) system was stably expressed in Py8119 cells. The surface presentation of OVA (H-2Kb-SIINFEKL) was validated by flow cytometry analysis. g, Western blot analysis confirming the knock down of MTDH in Py8119 cells stably expressing luciferase and PresentER-OVA (Py8119-PresentER-OVA) after lentiviral transduction of respective shRNAs. h, Py8119-PresentER-OVA cells with (shMTDH) or without (shCtrl) MTDH knockdown were co-cultured with OT-I splenocytes with the ratio of 1:10 (tumor cells:splenocytes). 24 hr after co-culture, Tumor cells were collected for examining OVA (H-2Kb-SIINFEKL). Data represent mean ± SEM. n=3 independent experiments. Significance determined by two tailed Student’s t-test. i, The same co-culture experiment as in (h) were performed. The live tumor cells were indicated by luciferase signal. The percentage of live cells were determined as normalized to the non-co-culture control. Data represent mean ± SEM. n=3 independent experiments. Significance determined by two tailed Student’s t-test. Numerical source data for b-e, h, i and uncropped blots for a and g are provided.
Extended Data Fig. 9. MTDH-SND1 disruption and anti-PD-1 treatment synergistically enhance anti-tumor immune response.
a, OT-I splenocytes were co-cultured with Py8119-OVA cells with or without 200 μM of C26-A6 treatment for 24 hr. The expression of PD-1 in CD8+ T cells was examined by flow cytometry. % of CD8+PD-1+ in live populations are shown. Data represent mean ± SEM. n=3 independent experiments. Significance determined by two tailed Student’s t-test. b, Cells in (a) were gated on the CD8+ T cell population and the mean fluorescence intensity (MFI) of PD-1 expression was measured. AU, arbitrary units. Data represent mean ± SEM. n=3 independent experiments. Significance determined by two tailed Student’s t-test. c, Schematic diagram of treatment. PyMT;UBC-CreERT+/−;Mtdhfl/fl females with tumors established were treated with Tmx and anti-PD-1 alone or in combination. Tmx, Tamoxifen, 60 mg/kg i.p. for 5 consecutive days; anti-PD-1, 200 μg/mouse i.p. injection, twice per week for the first week and then once per week after that. d, Primary tumors and lungs from experiment in Fig. 6c were fixed for CD8 IHC staining. Scale bar, 100 μm. Numerical source data for a and b are provided.
Extended Data Fig. 10. C26-A6 combined with anti-PD-1 treatment reshapes the tumor immune microenvironment.
a,b, 100k PyMT tumor cells were orthotopically injected into the mammary glands of FVB females. The mice were randomized and divided into three groups when primary tumors were established, followed by vehicle, C26-A6, or C26-A6+anti-PD-1 treatment. Six weeks after treatment, primary tumors and lung with metastatic lesions were collected for flow analysis with indicated antibodies. % of CD11b+F4/80+, Ly6GlowLy6Chigh, Ly6GhighLy6Clow, CD3-NK1.1+ in CD45+ population are shown. % of CD4+FOXP3+ in CD3+ population are shown, and % of GITR+LAG-3+ in CD8+ population are shown. Anti-PD-1, 200 μg/mouse i.p. injection, twice per week for the first week and then once per week after that; C26-A6, 15 mg/kg i.v. injection, 5 days per week. n=6 mice per group. Data represent mean ± SEM. Significance determined by one-way ANOVA analysis with Dunnett’s test for multiple comparisons. c, Negative correlation between MTDH expression and CD8+ T cell infiltration or PD-1 expression in TNBC patients. Representative IHC images are shown in Fig. 8a. p-value by two-sided chi square test tests. Numerical source data for a and b are provided.
Supplementary Material
Acknowledgements
We thank G. Ren, W. Li, Z. Li, W. Lu and other lab members for technical supports and helpful discussions. We thank W. Wang at the Genomics Core Facility of Princeton University for RNA sequencing, C. DeCoste and K. Rittenbach at Molecular Biology Flow Cytometry Resource Facility of Princeton University for flow cytometry assays. We thank Dr. Weizhou Zhang (University of Florida) for providing E0771 cells. This research was supported by the Brewster Foundation and Ludwig Institute for Cancer Research, and grants from the Breast Cancer Research Foundation, the NIH (R01CA134519), Department of Defense Breast Cancer Research Program (BC151403), American Cancer Society, Ludwig Foundation, and Susan G. Komen Foundation to Y. Kang and postdoctoral fellowships from Susan G. Komen (PDF17332118) and NJCCR (DFHS15PPCO21) to M. Shen. This research was also supported by the Pre-clinical Imaging and Flow Cytometry Shared Resources of the Rutgers Cancer Institute of New Jersey (P30CA072720).
Footnotes
Competing interests
Princeton has filed a disclosure on the findings based on this study. Y.K. and M.S. are named as co-inventors on the disclosure. Y.K. is a co-founder and chair of Scientific Advisory Board of Firebrand Therapeutics, Inc, which is currently developing novel therapeutics based on the targeting of MTDH-SND1 and have licensed relevant technologies from Princeton University. Y.K. is also a co-founder of Kayothera, Inc. and a member of Scientific Advisory Board for Cytocare, Inc and Vibrant Pharma Limited. The remaining authors declare no competing interests.
References
- 1.Criscitiello C & Curigliano G Immunotherapeutics for breast cancer. Current opinion in oncology 25, 602–608 (2013). [DOI] [PubMed] [Google Scholar]
- 2.Ernst B & Anderson KS Immunotherapy for the treatment of breast cancer. Current oncology reports 17, 5 (2015). [DOI] [PubMed] [Google Scholar]
- 3.Ravelli A et al. Immune-related strategies driving immunotherapy in breast cancer treatment: a real clinical opportunity. Expert review of anticancer therapy 15, 689–702 (2015). [DOI] [PubMed] [Google Scholar]
- 4.Page DB, Naidoo J & McArthur HL Emerging immunotherapy strategies in breast cancer. Immunotherapy 6, 195–209, doi: 10.2217/imt.13.166 (2014). [DOI] [PubMed] [Google Scholar]
- 5.Soliman H Immunotherapy strategies in the treatment of breast cancer. Cancer control : journal of the Moffitt Cancer Center 20, 17–21 (2013). [DOI] [PubMed] [Google Scholar]
- 6.Emens LA Breast cancer immunobiology driving immunotherapy: vaccines and immune checkpoint blockade. Expert review of anticancer therapy 12, 1597–1611, doi: 10.1586/era.12.147 (2012). [DOI] [PMC free article] [PubMed] [Google Scholar]
- 7.Hu G et al. MTDH activation by 8q22 genomic gain promotes chemoresistance and metastasis of poor-prognosis breast cancer. Cancer cell 15, 9–20 (2009). [DOI] [PMC free article] [PubMed] [Google Scholar]
- 8.Blanco MA et al. Identification of staphylococcal nuclease domain-containing 1 (SND1) as a Metadherin-interacting protein with metastasis-promoting functions. The Journal of biological chemistry 286, 19982–19992 (2011). [DOI] [PMC free article] [PubMed] [Google Scholar]
- 9.Qian BJ et al. MTDH/AEG-1-based DNA vaccine suppresses lung metastasis and enhances chemosensitivity to doxorubicin in breast cancer. Cancer Immunol Immunother 60, 883–893 (2011). [DOI] [PMC free article] [PubMed] [Google Scholar]
- 10.Wan L et al. MTDH-SND1 interaction is crucial for expansion and activity of tumor-initiating cells in diverse oncogene- and carcinogen-induced mammary tumors. Cancer cell 26, 92–105 (2014). [DOI] [PMC free article] [PubMed] [Google Scholar]
- 11.Guo F et al. Structural insights into the tumor-promoting function of the MTDH-SND1 complex. Cell reports 8, 1704–1713 (2014). [DOI] [PMC free article] [PubMed] [Google Scholar]
- 12.Shen M et al. Small Molecule Inhibitors that Disrupt the MTDH-SND1 Complex Suppress Breast Cancer Progression and Metastasis. Nature Cancer, Co-submitted companion manuscript (2021). [DOI] [PMC free article] [PubMed] [Google Scholar]
- 13.Ewens A, Mihich E & Ehrke MJ Distant metastasis from subcutaneously grown E0771 medullary breast adenocarcinoma. Anticancer Res 25, 3905–3915 (2005). [PubMed] [Google Scholar]
- 14.Du J et al. PDK1 promotes tumor growth and metastasis in a spontaneous breast cancer model. Oncogene 35, 3314–3323, doi: 10.1038/onc.2015.393 (2016). [DOI] [PubMed] [Google Scholar]
- 15.Canovas B et al. Targeting p38alpha Increases DNA Damage, Chromosome Instability, and the Anti-tumoral Response to Taxanes in Breast Cancer Cells. Cancer cell 33, 1094–1110 e1098, doi: 10.1016/j.ccell.2018.04.010 (2018). [DOI] [PubMed] [Google Scholar]
- 16.Gibby K et al. Early vascular deficits are correlated with delayed mammary tumorigenesis in the MMTV-PyMT transgenic mouse following genetic ablation of the NG2 proteoglycan. Breast cancer research : BCR 14, R67, doi: 10.1186/bcr3174 (2012). [DOI] [PMC free article] [PubMed] [Google Scholar]
- 17.Clarke SR et al. Characterization of the ovalbumin-specific TCR transgenic line OT-I: MHC elements for positive and negative selection. Immunology and cell biology 78, 110–117 (2000). [DOI] [PubMed] [Google Scholar]
- 18.Hogquist KA et al. T cell receptor antagonist peptides induce positive selection. Cell 76, 17–27 (1994). [DOI] [PubMed] [Google Scholar]
- 19.Leone P et al. MHC class I antigen processing and presenting machinery: organization, function, and defects in tumor cells. Journal of the National Cancer Institute 105, 1172–1187 (2013). [DOI] [PubMed] [Google Scholar]
- 20.Das K et al. Generation of murine tumor cell lines deficient in MHC molecule surface expression using the CRISPR/Cas9 system. PLoS One 12, e0174077, doi: 10.1371/journal.pone.0174077 (2017). [DOI] [PMC free article] [PubMed] [Google Scholar]
- 21.Gejman RS et al. Rejection of immunogenic tumor clones is limited by clonal fraction. Elife 7, doi: 10.7554/eLife.41090 (2018). [DOI] [PMC free article] [PubMed] [Google Scholar]
- 22.Solinas C et al. Targeting immune checkpoints in breast cancer: an update of early results. ESMO open 2, e000255 (2017). [DOI] [PMC free article] [PubMed] [Google Scholar]
- 23.Nguyen DX, Bos PD & Massague J Metastasis: from dissemination to organ-specific colonization. Nature reviews 9, 274–284 (2009). [DOI] [PubMed] [Google Scholar]
- 24.Mellman I, Coukos G & Dranoff G Cancer immunotherapy comes of age. Nature 480, 480–489 (2011). [DOI] [PMC free article] [PubMed] [Google Scholar]
- 25.Park TS, Rosenberg SA & Morgan RA Treating cancer with genetically engineered T cells. Trends in biotechnology 29, 550–557 (2011). [DOI] [PMC free article] [PubMed] [Google Scholar]
- 26.Wolchok JD & Chan TA Cancer: Antitumour immunity gets a boost. Nature 515, 496–498 (2014). [DOI] [PMC free article] [PubMed] [Google Scholar]
- 27.Kroemer G, Senovilla L, Galluzzi L, Andre F & Zitvogel L Natural and therapy-induced immunosurveillance in breast cancer. Nature medicine 21, 1128–1138 (2015). [DOI] [PubMed] [Google Scholar]
- 28.Marme F Immunotherapy in Breast Cancer. Oncology research and treatment 39, 335–345 (2016). [DOI] [PubMed] [Google Scholar]
- 29.Bates JP, Derakhshandeh R, Jones L & Webb TJ Mechanisms of immune evasion in breast cancer. BMC cancer 18, 556 (2018). [DOI] [PMC free article] [PubMed] [Google Scholar]
- 30.Denkert C The immunogenicity of breast cancer--molecular subtypes matter. Ann Oncol 25, 1453–1455 (2014). [DOI] [PubMed] [Google Scholar]
- 31.Lanitis E, Dangaj D, Irving M & Coukos G Mechanisms regulating T-cell infiltration and activity in solid tumors. Ann Oncol 28, xii18–xii32 (2017). [DOI] [PubMed] [Google Scholar]
- 32.Wellenstein MD & de Visser KE Cancer-Cell-Intrinsic Mechanisms Shaping the Tumor Immune Landscape. Immunity 48, 399–416 (2018). [DOI] [PubMed] [Google Scholar]
- 33.Johnsen AK, Templeton DJ, Sy M & Harding CV Deficiency of transporter for antigen presentation (TAP) in tumor cells allows evasion of immune surveillance and increases tumorigenesis. J Immunol 163, 4224–4231 (1999). [PubMed] [Google Scholar]
- 34.Oancea G et al. Structural arrangement of the transmission interface in the antigen ABC transport complex TAP. Proceedings of the National Academy of Sciences of the United States of America 106, 5551–5556 (2009). [DOI] [PMC free article] [PubMed] [Google Scholar]
- 35.Blum JS, Wearsch PA & Cresswell P Pathways of antigen processing. Annual review of immunology 31, 443–473 (2013). [DOI] [PMC free article] [PubMed] [Google Scholar]
- 36.Leonhardt RM, Keusekotten K, Bekpen C & Knittler MR Critical role for the tapasin-docking site of TAP2 in the functional integrity of the MHC class I-peptide-loading complex. J Immunol 175, 5104–5114 (2005). [DOI] [PubMed] [Google Scholar]
- 37.Panter MS, Jain A, Leonhardt RM, Ha T & Cresswell P Dynamics of major histocompatibility complex class I association with the human peptide-loading complex. The Journal of biological chemistry 287, 31172–31184 (2012). [DOI] [PMC free article] [PubMed] [Google Scholar]
- 38.Sadasivan B, Lehner PJ, Ortmann B, Spies T & Cresswell P Roles for calreticulin and a novel glycoprotein, tapasin, in the interaction of MHC class I molecules with TAP. Immunity 5, 103–114 (1996). [DOI] [PubMed] [Google Scholar]
- 39.Gabathuler R, Reid G, Kolaitis G, Driscoll J & Jefferies WA Comparison of cell lines deficient in antigen presentation reveals a functional role for TAP-1 alone in antigen processing. The Journal of experimental medicine 180, 1415–1425 (1994). [DOI] [PMC free article] [PubMed] [Google Scholar]
- 40.Lampen MH et al. CD8+ T cell responses against TAP-inhibited cells are readily detected in the human population. J Immunol 185, 6508–6517 (2010). [DOI] [PubMed] [Google Scholar]
- 41.Henle AM, Nassar A, Puglisi-Knutson D, Youssef B & Knutson KL Downregulation of TAP1 and TAP2 in early stage breast cancer. PloS one 12, e0187323 (2017). [DOI] [PMC free article] [PubMed] [Google Scholar]
- 42.Pedersen MH et al. Downregulation of antigen presentation-associated pathway proteins is linked to poor outcome in triple-negative breast cancer patient tumors. Oncoimmunology 6, e1305531 (2017). [DOI] [PMC free article] [PubMed] [Google Scholar]
- 43.Qin Z et al. Increased tumorigenicity, but unchanged immunogenicity, of transporter for antigen presentation 1-deficient tumors. Cancer research 62, 2856–2860 (2002). [PubMed] [Google Scholar]
- 44.Meng X et al. Cytoplasmic Metadherin (MTDH) provides survival advantage under conditions of stress by acting as RNA-binding protein. The Journal of biological chemistry 287, 4485–4491 (2011). [DOI] [PMC free article] [PubMed] [Google Scholar]
- 45.Liu R, Ma Y & Chen X Quantitative assessment of the association between TAP2 rs241447 polymorphism and cancer risk. Journal of cellular biochemistry 120, 15867–15873 (2019). [DOI] [PubMed] [Google Scholar]
- 46.Chou HL, Tian L, Kumamaru T, Hamada S & Okita TW Multifunctional RNA Binding Protein OsTudor-SN in Storage Protein mRNA Transport and Localization. Plant physiology 175, 1608–1623 (2017). [DOI] [PMC free article] [PubMed] [Google Scholar]
- 47.Hsu JC, Reid DW, Hoffman AM, Sarkar D & Nicchitta CV Oncoprotein AEG-1 is an endoplasmic reticulum RNA-binding protein whose interactome is enriched in organelle resident protein-encoding mRNAs. RNA (New York, N.Y 24, 688–703 (2018). [DOI] [PMC free article] [PubMed] [Google Scholar]
- 48.Jariwala N et al. Role of the staphylococcal nuclease and tudor domain containing 1 in oncogenesis (review). International journal of oncology 46, 465–473 (2015). [DOI] [PMC free article] [PubMed] [Google Scholar]
- 49.Tsuchiya N et al. SND1, a component of RNA-induced silencing complex, is up-regulated in human colon cancers and implicated in early stage colon carcinogenesis. Cancer research 67, 9568–9576 (2007). [DOI] [PubMed] [Google Scholar]
- 50.Ohs I et al. Restoration of Natural Killer Cell Antimetastatic Activity by IL12 and Checkpoint Blockade. Cancer research 77, 7059–7071, doi: 10.1158/0008-5472.CAN-17-1032 (2017). [DOI] [PubMed] [Google Scholar]
- 51.Shen M et al. Tinagl1 Suppresses Triple-Negative Breast Cancer Progression and Metastasis by Simultaneously Inhibiting Integrin/FAK and EGFR Signaling. Cancer cell 35, 64–80 e67 (2019). [DOI] [PubMed] [Google Scholar]
- 52.Jiang YZ et al. Preoperative measurement of breast cancer overestimates tumor size compared to pathological measurement. PloS one 9, e86676, doi: 10.1371/journal.pone.0086676 (2014). [DOI] [PMC free article] [PubMed] [Google Scholar]
- 53.Xiao Y et al. Multi-Omics Profiling Reveals Distinct Microenvironment Characterization and Suggests Immune Escape Mechanisms of Triple-Negative Breast Cancer. Clin Cancer Res 25, 5002–5014, doi: 10.1158/1078-0432.CCR-18-3524 (2019). [DOI] [PubMed] [Google Scholar]
- 54.Shackleton M et al. Generation of a functional mammary gland from a single stem cell. Nature 439, 84–88 (2006). [DOI] [PubMed] [Google Scholar]
- 55.Twyman-Saint Victor C et al. Radiation and dual checkpoint blockade activate non-redundant immune mechanisms in cancer. Nature 520, 373–377 (2015). [DOI] [PMC free article] [PubMed] [Google Scholar]
Associated Data
This section collects any data citations, data availability statements, or supplementary materials included in this article.
Supplementary Materials
Data Availability Statement
All RNA sequencing data generated in this study have been deposited as a superseries at the NCBI Gene Expression Omnibus with the accession code GSE174630. Further information and requests for resources and reagents should be directed to the corresponding author. All requests for raw and analyzed data and materials will be reviewed promptly by the corresponding author to verify whether the request is subject to any intellectual property or confidentiality obligations. Any data and materials that can be shared will be released via a material transfer agreement. Source data supporting the findings of this study are provided.


