Abstract
The spread of highly pathogenic avian influenza H5N1 has posed a major threat to global public health. Understanding the spatiotemporal outbreak characteristics and environmental factors of H5N1 outbreaks is of great significance for the establishment of effective prevention and control systems. The time and location of H5N1 outbreaks in poultry and wild birds officially confirmed by the World Organization for Animal Health from 2005 to 2019 were collected. Spatial autocorrelation analysis and multidistance spatial agglomeration analysis methods were used to analyze the global outbreak sites of H5N1. Combined with remote sensing data, the correlation between H5N1 outbreaks and environmental factors was analyzed using binary logistic regression methods. We analyzed the correlation between the H5N1 outbreak and environmental factors and finally made a risk prediction for the global H5N1 outbreaks. The results show that the peak of the H5N1 outbreaks occurs in winter and spring. H5N1 outbreaks exhibit aggregation, and a weak aggregation phenomenon is noted on the scale close to 5000 km. Water distance, road distance, railway distance, wind speed, leaf area index (LAI), and specific humidity were protective factors for the outbreak of H5N1, and the odds ratio (OR) were 0.985, 0.989, 0.995, 0.717, 0.832, and 0.935, respectively. Temperature was a risk factor with an OR of 1.073. The significance of these ORs was greater than 95%. The global risk prediction map was obtained. Given that the novel coronavirus (COVID-19) is spreading globally, the methods and results of this study can provide a reference for studying the spread of COVID-19.
Keywords: H5N1, Remote sensing, Spatiotemporal analysis, Binary logistic regression, COVID-19, Responsible Editor: Lotfi Aleya
Introduction
Highly pathogenic avian influenza H5N1 (hereinafter referred to as H5N1) has caused a global pandemic among poultry and wild birds since it was first discovered in 1959 (Anonymous, 2007). At present, greater than 60 countries have been affected by the H5N1 virus. It has been reported that the mortality rate of avian influenza depends on the strain of the virus. Specifically, the mortality rate of H5N1 virus is higher (Lam Thanh et al., 2020; Liu et al., 2017; Sealy et al., 2019), and the mortality rate of poultry infected with H5N1 is as high as 100%. Once humans are infected by the virus, it also produces high pathogenicity to humans (Hill et al., 2017), and the mortality rate of global humans can reach 63%. The incidence of human infection with H5N1 has increased five-fold during the peak of H5N1 outbreaks for poultry infected than usual (Durand et al., 2015). The outbreak of the H5N1 virus has attracted the attention of many countries around the world. The World Health Organization has issued the following warning: H5N1 poses a major threat to global public health, and global health departments must guard against the epidemic of the virus among humans through mutation (Salvador et al., 2020).
At present, some scholars use geographic information system methods and remote sensing data to research the transmission risk of dengue fever (Tian et al., 2017), pulmonary tuberculosis (Cai et al., 2021), fever with thrombocytopenia syndrome (Miao et al., 2020), and avian influenza H5N6 (Ekong et al., 2012; Li et al., 2020; Mellor et al., 2018). Although some scholars have performed spatiotemporal distribution analysis of avian influenza H5N1 or its correlation with environmental factors (Ahmed et al., 2010; Li et al., 2015a; Walsh et al., 2020), the analysis time series of these studies is short, the research area is small, and the environmental factors considered in these studies are limited. Moreover, these studies employ the interannual interval as the research scale. For example, the following topics have been assessed: the spatial and temporal aggregation of H5N1 outbreaks in Bangladesh in 2007–2008 (Ahmed et al., 2010), the correlation between H5N1 outbreaks and environmental factors (temperature, precipitation, and temperature) in India (Walsh et al., 2020), the correlation between H5N1 outbreaks and environmental factors (temperature, precipitation, and temperature) in China (Fang et al., 2008; Li et al., 2015a), and the relationship between H5N1 outbreaks and temperature changes in Eurasia (Liu et al., 2007). Through these studies, it has been recognized that H5N1 outbreaks exhibit spatial distribution characteristics, and strong evidence of a relationship between H5N1 outbreaks and environmental factors is noted.
In order to make the results closer to the real situation, we tried to increase the number of samples for the study. In terms of data, we obtained data of 15 years of H5N1 outbreaks (2005–2019) and selected 12 environmental factors. When studying the correlation of environmental factors to H5N1 outbreaks, we used month rather than year as the time resolution of the study to increase the number of samples. Finally, we analyzed the spatiotemporal distribution of global H5N1 outbreaks, related environmental factors, and predicted the global outbreak risk map. The results provide technical support for global H5N1 prevention and early warning, and have important public health significance for the prevention and control of H5N1 outbreaks. At present, COVID-19 is still a global epidemic. This study can provide methods and experience for the analysis of its spatiotemporal distribution characteristics and environmental factors through remote sensing technology to accelerate the fight against COVID-19 and achieve the goal of sustainable development.
The objectives of the study are as follows: (1) determine the characteristics of global H5N1 time outbreaks; (2) assess the global spatial aggregation of H5N1; (3) identify the environmental factors related to H5N1 outbreaks, classify protective factors and risk factors, and quantitatively analyze the degree of correlation; and (4) predict the risk of global H5N1 outbreaks.
Data
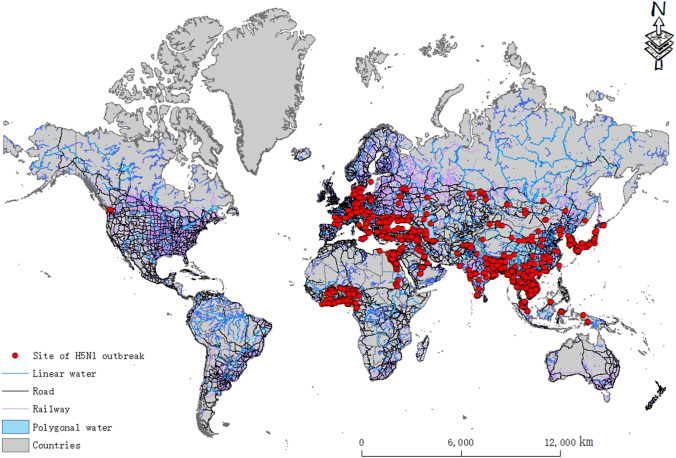
The global H5N1 outbreak statistics used in this paper were obtained from the website of the World Organization for Animal Health (OIE). The data included the time, latitude, and longitude of the outbreak and the number of cases. The distribution of the data after spatial vectorization is shown in Fig. 1. The environmental factor data include LAI, elevation, air pressure, specific humidity, temperature, surface radiation, rainfall, snow, wind speed, roads, railways, and water areas (rivers, lakes and reservoirs, etc.). Because the correlation analysis of environmental factors for the H5N1 outbreaks in this paper was based on a monthly time scale (1-month time resolution), these data need to be processed into monthly averages for use in the subsequent analysis. (A large amount of data is used in this paper. Due to limited space, the data information can be found in supplementary material S1, including the name, source, format, and date of the data.)
Fig. 1.
Spatial distribution of global H5N1 outbreak sites during 2005–2019
Method
Periodicity of phenomena of the outbreak
Because H5N1 is highly transmissible, when a case occurs in one location, it can quickly spread through poultry and cause a large outbreak in a short time. Thus, one case can be considered an outbreak (usually when H5N1 is detected there are already a large number of cases). To reveal the trend of the H5N1 virus outbreak, the global H5N1 outbreak data from 2005 to 2019 are divided into different outbreak time periods based on season. The trend of the global H5N1 outbreak in each season is plotted, and the total number of H5N1 virus outbreaks in each season is calculated. The statistical formula of the number of H5N1 outbreaks in each season is as follows:
| 1 |
where is the number of H5N1 outbreaks in the -th season, and is the number of outbreaks on the -th day in the -th season.
Spatial distribution
In this paper, the spatial autocorrelation function (Moran’s I) is used to analyze the distribution characteristics of outbreak sites (whether agglomerated or not) (Zhao et al., 2020). Moran’s I is a standardized measure of spatial autocorrelation among variables of neighboring elements (Pinto et al., 2021), varying in the range of − 1 to 1. The closer Moran’s I index is to 0, the less self-correlated (random) H5N1 outbreak sites. The closer to − 1, the more scattered H5N1 outbreak sites. The closer to 1, the more agglomerated H5N1 outbreak sites. The Z test is used to test the significance of Moran’s I test in this paper.
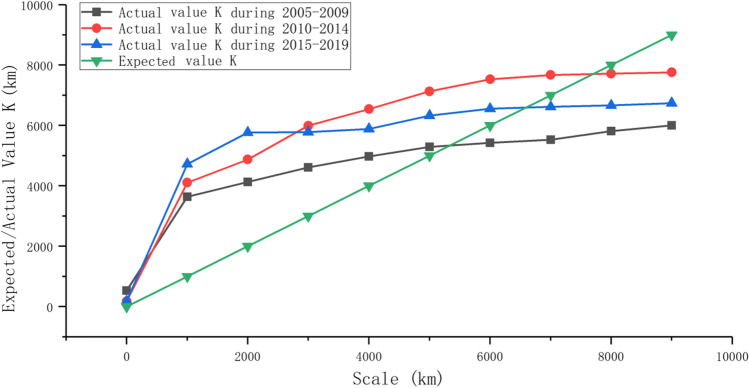
Multidistance spatial agglomeration analysis is used to analyze the agglomeration phenomenon of H5N1 outbreak sites at different spatial scales, and an expected K value and an actual K value can be calculated according to different spatial scales. If the actual K value is less than the expected K value, it indicates that the distribution of H5N1 outbreak sites on this scale is discrete; otherwise, the distribution on this scale is agglomerated. In addition, the smaller the difference between the two K values is, the more random the distribution. The multidistance spatial agglomeration analysis in this paper uses the common transformation of Ripley’s k function, and the transformation L(d) is determined as follows:
| 2 |
where is the region, is the number of points, d is the distance, is the weight, the expected K is d, and the actual K is L(d).
Correlation between the outbreak of H5N1 and environmental factors
To explore whether a relationship exists between environmental factors and the outbreak of H5N1, the binary logistic regression method is used in this paper. Two dependent variables are included in the binary logistic regression. One variable is the “outbreak” site of H5N1, and the other variable is the “nonoutbreak” site of H5N1. The “nonoutbreak” site was selected according to the principle (Lee et al., 2020; Li et al., 2016) of site selection.
The method of selecting “nonoutbreak” sites is described below:
The distance between the “nonoutbreak” site and the “outbreak” site is outside the range of 10 km.
The number of “nonoutbreak” sites is 5 times that of “outbreak” sites.
The distance between the “nonoutbreak” site is greater than that of 10 km.
The month corresponding to the “nonoutbreak” site is randomly generated.
Binary logistic regression can express the 0 and 1 characteristics of outbreaks (Gierak and Mietanka, 2021), i.e., H5N1 virus outbreaks and nonoutbreaks.
Before using binary logistic regression, it is necessary to test the collinearity of various factors to remove the factors that can be regarded as the same variable. In this paper, the dependent variable Y is determined by whether the H5N1 virus causes an outbreak. The events corresponding to 0 and 1 are “nonoutbreak of H5N1” and “outbreak of H5N1,” respectively.
The binary logistic regression model obtained from the above correlation analysis can be used for risk prediction. To test the reliability of the predicted results of the binary logistic regression model, the Omnibus test of model coefficients is first used in this paper to test whether the model was meaningful. Then, the Hosmer–Lemeshow test is used to test the goodness of fit of the model, that is, the approximate degree of predicted value and real value.
In addition, we need to create prediction sites before risk prediction. To make the predicted range cover the whole world, this paper divides the study area into rows and columns, and divides it into grids with an interval of 5°. The grid location is represented by the grid center point and assigned to the environmental factor value. Then, then the value is predicted by using the binary logistic regression model. The predicted data used in this paper are the monthly average of the environmental factor data of the peak period of the H5N1 outbreak (spring and winter) in the last three years (2017, 2018, and 2019), and the data are used to predict the outbreak risk in the future spring and winter.
Results
Periodicity of outbreak phenomena
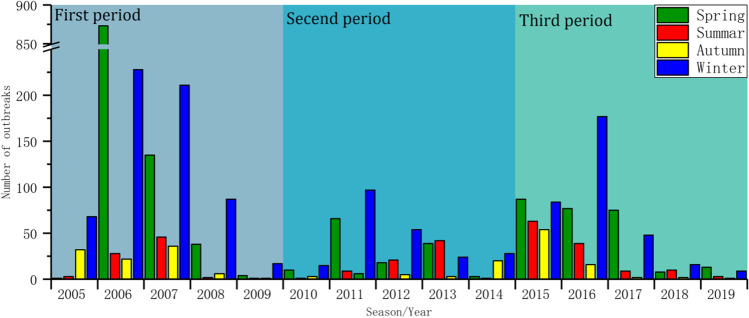
Because only three outbreak sites are located in the Southern Hemisphere and the number of cases in the source data is 0, it can be considered that all the outbreak sites are distributed in the Northern Hemisphere. In this paper, the annual outbreak trend of global H5N1 is obtained according to the division of the seasons in the Northern Hemisphere (Fig. 2). As noted in the chart, during the 15-year period from 2005 to 2019, the number of global H5N1 outbreaks showed three “upward-downward” trends over time: the first period is 2005–2009, the second period is 2010–2014, and the last period is 2015–2019. These data indicate that the global H5N1 has the characteristics of repeated outbreaks about every 5 years. To further explain the characteristics of the number of H5N1 outbreaks in each season, a box chart (Fig. 3) of the number of outbreaks in each season was calculated. From this chart, we can see that spring has the highest number of outbreaks followed by winter, summer, and finally autumn, accounting for 46.72%, 37.55%, 8.98%, and 6.75% of the total, respectively. The median number of H5N1 outbreaks in spring and winter was also greater than that in other seasons, indicating that spring and winter represent the peaks of H5N1 outbreaks. In addition, the outliers and the range of 1.5 IQR in spring and winter are larger, and the upper limit and lower limit of the numbers of H5N1 outbreaks are very different, indicating that the number of H5N1 outbreaks in spring and winter is not too stable.
Fig. 2.
Global H5N1 outbreak trends by season for each year during the study period of 2005–2019
Fig. 3.
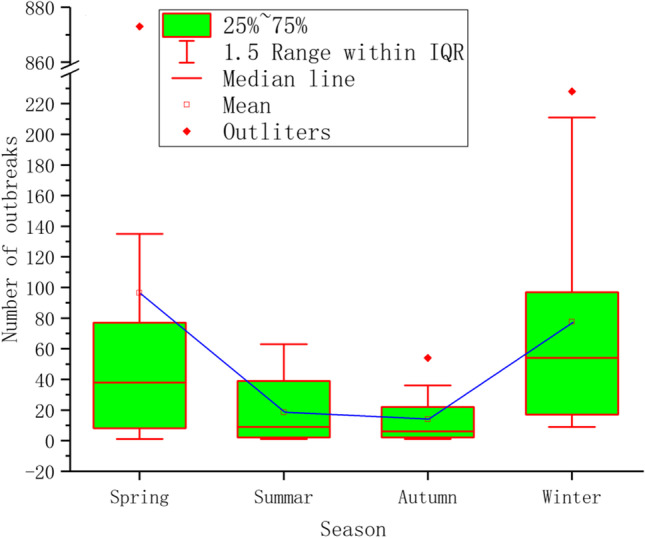
Box chart of the number of outbreaks of global H5N1 in each season during the study period of 2005–2019
Spatial distribution
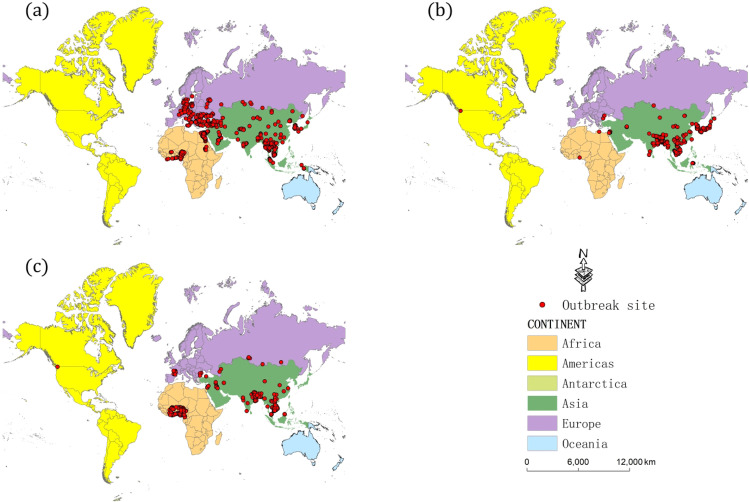
In the analysis of the time period of H5N1 outbreaks, the trend of the number of H5N1 outbreaks shows that there are three outbreak time periods in the 15-year period from 2005 to 2019, and we further analyze the spatial distribution of global H5N1 outbreaks on the basis of these three time periods (Fig. 4a, b, c). We can see that the global H5N1 outbreaks are distributed on four continents, including Africa, Asia, Europe, and America, and H5N1 breakouts mainly occurred in Africa, Asia, and Europe.
Fig. 4.
Spatial distribution of global H5N1 outbreak sites during 2005–2009 (a), 2010–2014 (b), and 2015–2019 (c)
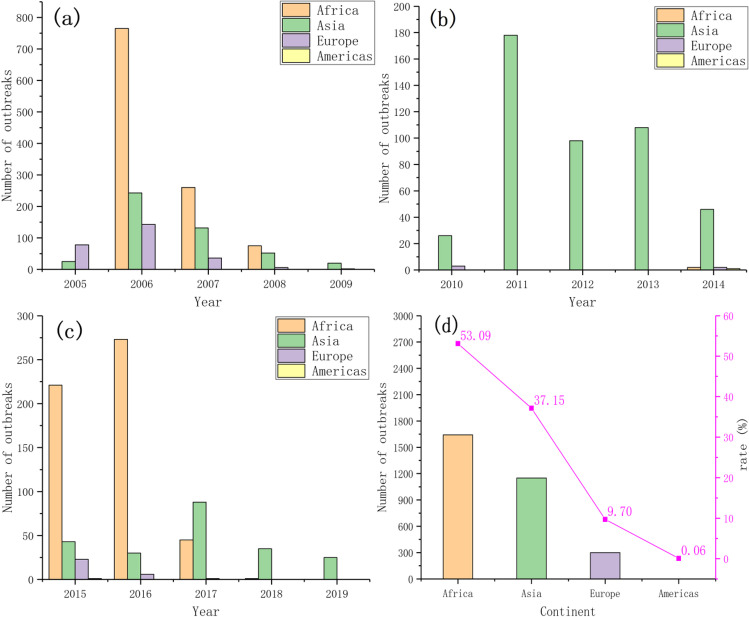
Significant differences in the number of outbreaks on each continent were noted over the three periods (Fig. 5). In the first period (Fig. 5a), the number of H5N1 outbreaks in Asia, Europe, and Africa was very high. In 2006, H5N1 appeared in Africa, and the number of outbreaks increased sharply to a 15-year peak of 765. Almost all H5N1 outbreaks occurred in Asia in the second time period (Fig. 5b). The number of outbreaks in Asia in 5 years was 26 (89.66%), 178 (100%), 98 (100%), 108 (100%), and 46 (90.20%). In the third time period (Fig. 5c), H5N1 broke out mainly in Africa, and the number of H5N1 outbreaks in Africa was very high in 2015 and 2016, with a total of 494 outbreaks in both years. Overall, the outbreak ranking statistics (Fig. 5d) show that Africa has the highest number of outbreaks over a 15-year period followed by Asia, Europe, and finally the Americas. The ratios of outbreaks on these four continents to total outbreaks were 50.39%, 37.15%, 9.70%, and 0.06%, respectively.
Fig. 5.
Global H5N1 outbreaks during 2005–2009 (a), 2010–2014 (b), and 2015–2019 (c) and the total number and percentage of outbreaks by continent (d)
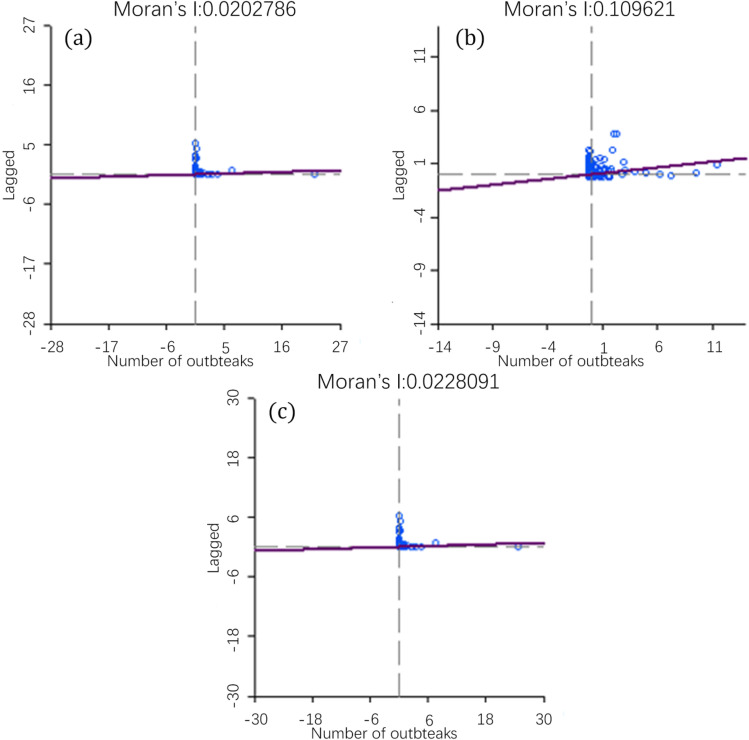
The autocorrelation analysis of the number of H5N1 outbreaks in three periods was performed, and the Moran’s I scatter plot of each time period was obtained (Fig. 6). As shown in Fig. 6, the Moran’s I indices of the three time periods are all greater than 0, indicating that the global H5N1 outbreaks exhibit a positive spatial correlation, and the sites of the outbreaks are characteristic of spatial aggregation. The Moran’s I index of the three time periods is different, indicating that the degree of aggregation is not stable and will change with time. In addition, to ensure the reliability of the autocorrelation results, the significance test of Moran’s I index was performed. The standard statistics Z of 2005–2009, 2010–2014, and 2015–2019 are 1.9883, 4.9683, and 2.0221, respectively, and p values are less than 0.05, indicating that the test result of Moran’s I index is significant.
Fig. 6.
Moran’s I scatter chart of the number of global H5N1 outbreaks in 2005–2009 (a), 2010–2014 (b), and 2015–2019 (c)
To further understand the aggregation phenomenon of H5N1, the multidistance spatial agglomeration is used to analyze the scale of H5N1 aggregation in three periods. The actual K and expected K are calculated by Formula 2. With the increasing spatial scale, the aggregation of H5N1 first increased and then decreased (Fig. 7). The scale range of actual K value greater than expected K value exists in all three periods, and the corresponding scale range is 0–500 km during 2005–2009, 0–7500 km during 2010–2014, and 0–6500 km during 2005–2019. These results indicate that the distribution characteristics change with the change in the time and space scale. Generally, H5N1 breakouts still exhibit a weak aggregation phenomenon at scales close to 5000 km.
Fig. 7.
Multidistance agglomeration analysis of global H5N1 during 2005–2019
Correlation between the outbreaks of H5N1 and environmental factors
In this paper, 12 environmental factors are selected: elevation (DEM), LAI, air pressure (AP), specific humidity (SH), surface radiation (SR), rainfall (RA), snow (SN), air temperature (AT), wind speed (WS), road distance (ROD), railway distance (RAD), and water distance (WAD). Here, the road distance, the railway distance, and the water distance are the nearest distances of the “outbreak” site or “nonoutbreak” site relative to the road, railway, and water area (rivers, lakes, and reservoirs) respectively. Then, these factor values of “outbreak” site and “nonoutbreak” site are substituted into the binary logistic regression model to analyze the relationship between the outbreak of H5N1 and environmental factors. According to the collinearity test results (the resulting figure can be found in supplementary material S1), we find that the tolerance between surface radiation and air temperature is less than 0.1, and the variance inflation factor (VIF) is greater than 10, so the surface radiation is excluded. The remaining 11 factors were analyzed by regression, and then the significantly effective factors were substituted into binary logistic regression for multifactor regression. Based on the multifactor regression results (Table 1), it can be concluded that elevation, rainfall, and snowfall are unrelated factors. Although the air pressure is significant, the odds ratio (OR) value is 1, and the coefficient is 0. Thus, air pressure is regarded as an independent factor. While other factors are significantly related to the outbreak of H5N1, the correlation degree of each factor to the outbreak of H5N1 exhibits the following order: WS > LAI > AT > SH > WAD > ROD > RAD.
Table 1.
Multiple factor regression
| Factors | Coefficient | OR value | OR value (95% CI) | Significance |
|---|---|---|---|---|
| WAD | − 0.015 | 0.985 | 0.983 ~ 0.987 | < 0.001 |
| ROD | − 0.011 | 0.989 | 0.987 ~ 0.991 | < 0.001 |
| RAD | − 0.005 | 0.995 | 0.994 ~ 0.996 | < 0.001 |
| WS | − 0.333 | 0.717 | 0.651 ~ 0.789 | < 0.001 |
| LAI | − 0.184 | 0.832 | 0.573 ~ 0.918 | < 0.001 |
| AT | 0.07 | 1.073 | 1.059 ~ 1.087 | < 0.001 |
| SH | − 0.067 | 0.935 | 0.901 ~ 0.971 | < 0.05 |
| AP | 0 | 1 | 1.000 ~ 1.000 | < 0.001 |
| DEM | – | – | – | 0.845 |
| RA | – | – | – | 0.288 |
| SN | – | – | – | 0.09 |
Global H5N1 outbreak risk prediction
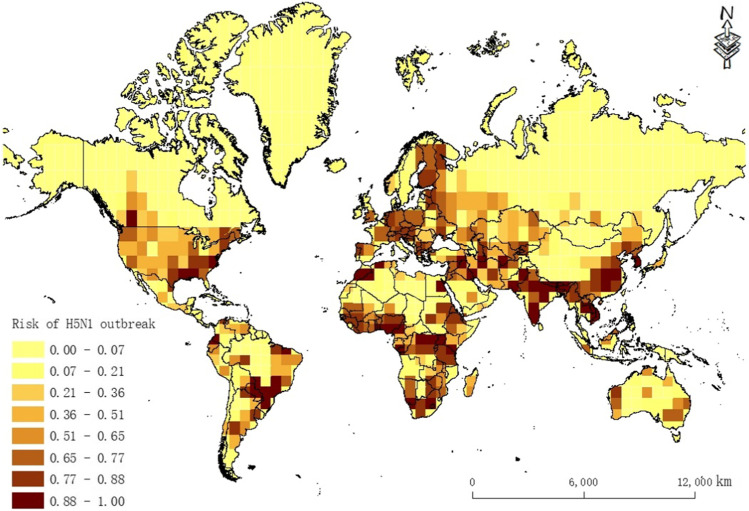
Before prediction, the Omnibus test of model coefficients and Hosmer–Lemeshow test were performed on the model. The p of the Omnibus test of the model coefficient is less than 0.05 (p = 0.02). The p of the Hosmer–Lemeshow test is greater than 0.05 (p = 0.35). Thus, the goodness of fit of the model is high, and the predicted value is very close to the real value. The results of the two test methods indicate that the model in this paper has high reliability. In addition, in this paper, the outbreak risk (probability) is divided into eight categories by the natural breakpoint method, because the natural breakpoint method can set the boundary where the numerical difference is relatively large, and the similar values can be grouped properly. Thus, there is a maximum difference between the data of each group, which can effectively represent the classification of the probability of each prediction site.
As seen from the prediction map (Fig. 8) and the results presented in Fig. 4, with the exception of China, Southeast Asia, South Asia, Nigeria, Ghana, Burkina Faso, Côte d’Ivoire, Egypt, Sudan, Romania, Greece, Germany, and France, where H5N1 has previously occurred, there is a high risk of H5N1 outbreaks in the southeastern part of the USA and Paraguay in South America. A high risk of H5N1 outbreaks is also noted in Uganda, Congo, Tanzania, South Africa, and the western and southeastern regions of Oceania.
Fig. 8.
Prediction of global H5N1 outbreak risk
Discussion
H5N1 virus outbreaks are periodic and repeat every 5 years. The outbreak peak occurs in spring and winter, probably due to the relatively cool climate in these seasons, which increases the survival time of avian influenza virus (Li et al., 2015b; Salaheldin et al., 2018). The outbreak of avian influenza is aggregated on the scale of 0–5000 km, indicating that the H5N1 virus has been able to spread in a larger spatial radius. Human socioeconomic activities in agriculture are widely regarded as the main factor in the short- and medium-range transmission of avian influenza (Yupiana et al., 2010). The virus still has a weak aggregation phenomenon on the scale of close to 5000 km, indicating that the avian influenza virus also has the mechanism of long-distance transmission, and this intercontinental transmission is generally believed to be achieved through the migration of migratory birds. The long-distance poultry trade and illegal poultry smuggling may also lead to the intercontinental spread of avian influenza (Liang et al., 2020; Wu and Perrings, 2018).
The wind speed has a negative effect on the outbreak of H5N1.When the wind speed is high, wind is beneficial to ventilation in farms, markets, and other live poultry farms, thus reducing the outbreak of the H5N1 virus. LAI also has a negative effect on the outbreak of H5N1, which is similar to that noted in the study of the relationship between NDVI and the H5N1 outbreak by Sun et al. (2018). When the humidity is high, the aerosol particles are large and heavy, and the H5N1 virus will fall to the surface faster compared with that noted in dry air conditions when it spreads in the air. Thus, LAI prevents the virus from spreading, so the specific humidity has a negative effect. For example, regions with higher temperatures in spring and winter in Africa have more H5N1 outbreaks than areas with lower temperatures in Central Asia and Europe in spring and winter. This finding is consistent with the results that relatively high temperatures are more likely to lead to H5N1 outbreaks. Dong et al. (2015) obtained similar results when studying the relationship between H7N9 and air temperature. Water area distance, road distance, and railway distance are all related to the outbreak of the H5N1 virus. Xu et al. (2019) reached a similar conclusion when analyzing the impact of H1N1 influenza transmission. In this paper, the influence of water area distance is the greatest followed by road distance and railway distance because poultry breeding bases are generally built near areas with water, which is conducive to the growth of waterfowl, such as ducks and geese. In addition, migratory birds often stop in area with waters, so the influence of water distance is the greatest. In addition, poultry breeding bases are also established in places with traffic, which is conducive to transaction and transportation. The probability of using roads is greater than that of railways, so the influence of highways is greater than that of railways.
This paper uses a large number of factors in addition to using road, railway, water system, air temperature, rainfall, and elevation data, which are commonly used. Environmental factors, such as LAI, air pressure, specific humidity, surface radiation, snow, and wind speed data, are used to analyze the correlation with global H5N1 outbreaks. Environmental data are processed on a monthly scale, and many scholars (Fang et al., 2008; Lau et al., 2018) use binary logistic regression on an annual scale. However, H5N1 outbreaks are seasonal. If the data are processed on an annual scale, the corresponding values of the variables are not timely, which may lead to incorrect correlation analysis of some factors. The previous analysis of H5N1 data does not include the latest data, so it cannot reflect the distribution of the epidemic in recent years. There are also some limitations in this study, such as the failure to report the epidemic situation affecting the accuracy of the analysis results. Although the study analyzed the correlation between the H5N1 outbreak and 12 environmental factors, the epidemic virology is more complex (Awada et al., 2018), and outbreaks are affected by many factors, including the composition of the animal population, production system, virus diversity, and the ability of each region to quickly identify and respond to the epidemic. More relevant factors should be considered in future research.
COVID-19 has spread globally, and many studies have indicated that environmental factors, such as temperature, relative humidity, and PM2.5, play important roles in the spread of COVID-19 (Franch-Pardo et al., 2020; Goswami et al., 2020; Shen et al., 2021). However, to date, studies have attempted to explain the potential impact of environmental factors on the spread of COVID-19 exclusively using statistical analyses, and the spatial distribution characteristics have not been quantitatively combined with the environmental factors. As the analysis of H5N1 shows, patterns of COVID-19 transmission can be analyzed from the perspectives of spatiotemporal distribution and environmental factors given that the heterogeneity of environmental conditions and spatial distribution characteristics may cause differences in the spread of COVID-19. Thus, the source and mechanism of the virus can be determined at different levels.
Conclusion
Through spatial autocorrelation analysis, multidistance spatial distance analysis, and binary logistic regression, this paper analyzes the environmental factors and spatiotemporal distribution characteristics of the H5N1 outbreak from 2005 to 2019 and performs risk prediction. The following conclusions can be drawn: (1) the outbreak cycle of global H5N1 is approximately 5 years, and the seasonal peaks occur in spring and winter, which accounts for 46.72% and 37.55% of the total number of outbreaks in all seasons, respectively. The number of H5N1 outbreaks in spring and winter is not very stable. (2) Global H5N1 outbreaks mainly occur in Africa, Asia, and Europe with Africa having the highest number of outbreaks followed by Asia, Europe, and finally America. The agglomeration phenomenon occurred in three outbreak periods, namely, 2005–2009, 2010–2014, and 2015–2019. From the perspective of multiscale distance agglomeration, the outbreak of H5N1 is agglomerated in the range of 5000 km, indicating that the H5N1 virus has been able to spread in a larger spatial radius. (3) Seven environmental factors are related to the H5N1 outbreak, among which 6 were protective factors, including water area distance (OR = 0.985), road distance (OR = 0.989), railway distance (OR = 0.995), wind speed (OR = 0.717), LAI (OR = 0.832), and specific humidity (OR = 0.935). Air temperature was identified as the risk factor (OR = 1.073). The correlation degree of each factor to the outbreak of H5N1 exhibits the following order: wind speed > LAI > air temperature > specific humidity > water area distance > road distance > railway distance. (4) The global H5N1 outbreak risk forecast is obtained for winter and spring. The forecast shows that an outbreak risk still occurs in the areas where H5N1 outbreaks previously occurred. At present, a high risk of H5N1 outbreaks is noted for the following areas: the southeastern part of the USA; Paraguay in South America; Uganda, Congo, Tanzania, and South Africa in Africa; and the western and southeastern regions of Oceania.
In this paper, the spatial–temporal distribution characteristics of H5N1 were analyzed by spatiotemporal analysis methods and regression models. The related environmental factors of the H5N1 outbreak were explored, and the risk of outbreaks was predicted. In addition, the research method and results of this paper can be used as a reference for research on other infectious diseases, such as COVID-19.
Supplementary material
Supplementary data S1 associated with this article can be found in the online version at https://github.com/996588861/H5N1PaperData.
Author contribution
W. Chen: methodology, writing, formal analysis. X. Zhang: coding, methodology. W. Zhao: editing. L. Yang: data curation. Z. Wang: investigation. H. Bi: validation.
Funding
This study was supported by the National Key R&D Program of China (2020YFC0849100) and the Yue Qi Young Scholar Project, CUMTB.
Data Availability
The datasets used and/or analyzed during the current study are available from the corresponding author on reasonable request.
Declarations
Ethics approval and consent to participate
Not applicable.
Consent for publication
Not applicable.
Competing interests
The authors declare no competing interests.
Footnotes
Publisher's note
Springer Nature remains neutral with regard to jurisdictional claims in published maps and institutional affiliations.
References
- Ahmed SSU, Ersboll AK, Biswas PK, Christensen JP. The space-time clustering of highly pathogenic avian influenza (HPAI) H5N1 outbreaks in Bangladesh. Epidemiology and Infection. 2010;138:843–852. doi: 10.1017/S0950268810000178. [DOI] [PubMed] [Google Scholar]
- Anonymous. Asian H5N1 still going strong at 10 years old. Lancet Infectious Diseases 2007; 7: 175–175. [DOI] [PubMed]
- Awada L, Tizzani P, Noh SM, Ducrot C, Ntsama F, Caceres P, et al. Global dynamics of highly pathogenic avian influenza outbreaks in poultry between 2005 and 2016-focus on distance and rate of spread. Transboundary and Emerging Diseases. 2018;65:2006–2016. doi: 10.1111/tbed.12986. [DOI] [PubMed] [Google Scholar]
- Cai Y, Zhao S, Niu Y, Peng Z, Wang K, He D, et al. Modelling the effects of the contaminated environments on tuberculosis in Jiangsu. China. J. Theor. Biol. 2021;508:110453. doi: 10.1016/j.jtbi.2020.110453. [DOI] [PMC free article] [PubMed] [Google Scholar]
- Dong W, Yang K, Xu QL, Yang YL. A predictive risk model for A (H7N9) human infections based on spatial-temporal autocorrelation and risk factors: China, 2013–2014. International Journal of Environmental Research and Public Health. 2015;12:15204–15221. doi: 10.3390/ijerph121214981. [DOI] [PMC free article] [PubMed] [Google Scholar]
- Durand LO, Glew P, Gross D, Kasper M, Trock S, Kim IK, et al. Timing of influenza A(H5N1) in poultry and humans and seasonal influenza activity worldwide, 2004–2013. Emerg Infect Dis. 2015;21:202–208. doi: 10.3201/eid2102.140877. [DOI] [PMC free article] [PubMed] [Google Scholar]
- Ekong PS, Ducheyne E, Carpenter TE, Owolodun OA, Oladokun AT, Lombin LH, et al. Spatio-temporal epidemiology of highly pathogenic avian influenza (H5N1) outbreaks in Nigeria, 2006–2008. Prev Vet Med. 2012;103:170–177. doi: 10.1016/j.prevetmed.2011.10.001. [DOI] [PubMed] [Google Scholar]
- Fang LQ, de Vlas SJ, Liang S, Looman CWN, Gong P, Xu B, et al. Environmental factors contributing to the spread of H5N1 avian influenza in mainland China. PLoS ONE. 2008;3:2268. doi: 10.1371/journal.pone.0002268. [DOI] [PMC free article] [PubMed] [Google Scholar]
- Franch-Pardo I, Napoletano B, Rosete F, Billa L. Spatial analysis and GIS in the study of COVID-19. Sci. Total Environ. 2020;739:140033. doi: 10.1016/j.scitotenv.2020.140033. [DOI] [PMC free article] [PubMed] [Google Scholar]
- Gierak A, Mietanka K. The impact of selected risk factors on the occurrence of highly pathogenic avian influenza in commercial poultry flocks in Poland. J Vet Res. 2021;65(1):45–52. doi: 10.2478/jvetres-2021-0013. [DOI] [PMC free article] [PubMed] [Google Scholar]
- Goswami K, Bharali S, Hazarika J. Projections for COVID-19 pandemic in India and effect of temperature and humidity. Diabetes & Metabolic Syndrome. 2020;14:801–805. doi: 10.1016/j.dsx.2020.05.045. [DOI] [PMC free article] [PubMed] [Google Scholar]
- Hill EM, House T, Dhingra MS, Kalpravidh W, Morzaria S, Osmani MG, et al. Modelling H5N1 in Bangladesh across spatial scales: model complexity and zoonotic transmission risk. Epidemics. 2017;20:37–55. doi: 10.1016/j.epidem.2017.02.007. [DOI] [PubMed] [Google Scholar]
- Lam Thanh N, Stevenson MA, Firestone SM, Sims LD, Duc Huy C, Van Long N, et al. Spatiotemporal and risk analysis of H5 highly pathogenic avian influenza in Vietnam, 2014–2017. Prev Vet Med. 2020;178:1–10. doi: 10.1016/j.prevetmed.2019.04.007. [DOI] [PubMed] [Google Scholar]
- Lau SYF, Wang XX, Wang M, Liu SL, Zee BCY, Han XR, et al. Identification of meteorological factors associated with human infection with avian influenza A H7N9 virus in Zhejiang Province. China Science of the Total Environment. 2018;644:696–709. doi: 10.1016/j.scitotenv.2018.06.390. [DOI] [PubMed] [Google Scholar]
- Lee K, Yu D, Martinez-Lopez B, Yoon H, Kang S-I, Hong S-K, et al. 2020 Fine-scale tracking of wild waterfowl and their impact on highly pathogenic avian influenza outbreaks in the Republic of Korea, 2014–2015. Scientific Reports; 10 [DOI] [PMC free article] [PubMed]
- Li X-L, Yang Y, Sun Y, Chen W-J, Sun R-X, Liu K, et al. 2015a Risk distribution of human infections with avian influenza H7N9 and H5N1 virus in China. Scientific Reports; 5 [DOI] [PMC free article] [PubMed]
- Li XL, Liu K, Yao HW, Sun Y, Chen WJ, Sun RX, et al. Highly pathogenic avian influenza H5N1 in mainland China. International Journal of Environmental Research and Public Health. 2015;12:5026–5045. doi: 10.3390/ijerph120505026. [DOI] [PMC free article] [PubMed] [Google Scholar]
- Li XW, Yang J, Huang SQ, Zhang T, Chang JY, Xu B. 2016 Environmental factors contributing to avian influenza risk in Poyang Lake region, China. Environmental Earth Sciences; 75
- Li Y, Li M, Li Y, Tian J, Bai X, Yang C, et al. Outbreaks of highly pathogenic avian influenza (H5N6) virus subclade 2.3.4.4h in swans, Xinjiang, western China. Emerg Infect. Dis. 2020;26:2956–2960. doi: 10.3201/eid2612.201201. [DOI] [PMC free article] [PubMed] [Google Scholar]
- Liang W-S, He Y-C, Wu H-D, Li Y-T, Shih T-H, Kao G-S, et al. Ecological factors associated with persistent circulation of multiple highly pathogenic avian influenza viruses among poultry farms in Taiwan during 2015–17. PLoS ONE. 2020;15:1–3. doi: 10.1371/journal.pone.0236581. [DOI] [PMC free article] [PubMed] [Google Scholar]
- Liu CM, Lin SH, Chen YC, Lin CM, Wu T, Chwan-Chuen K, et al. Temperature drops and the onset of severe avian influenza A H5N1 virus outbreaks. PLoS ONE. 2007;2:613–639. doi: 10.1371/journal.pone.0000613. [DOI] [PMC free article] [PubMed] [Google Scholar]
- Liu M, Lu Q, Zhang S, Feng X, Hossain MS. Temporal and spatial characteristics of highly pathogenic avian influenza outbreaks in China during 2004 to 2015. Poult Sci. 2017;96:3113–3121. doi: 10.3382/ps/pex097. [DOI] [PubMed] [Google Scholar]
- Mellor KC, Meyer A, Elkholly DA, Fournie G, Long PT, Inui K, et al. Comparative epidemiology of highly pathogenic avian influenza virus H5N1 and H5N6 in Vietnamese live bird markets: spatiotemporal patterns of distribution and risk factors. Frontiers in Veterinary Science. 2018;5:51. doi: 10.3389/fvets.2018.00051. [DOI] [PMC free article] [PubMed] [Google Scholar]
- Miao D, Dai K, Zhao GP, Li XL, Shi WQ, Zhang JS, et al. Mapping the global potential transmission hotspots for severe fever with thrombocytopenia syndrome by machine learning methods. Emerging Microbes & Infections. 2020;9:817–826. doi: 10.1080/22221751.2020.1748521. [DOI] [PMC free article] [PubMed] [Google Scholar]
- Pinto EP, Pires MA, Matos RS, Zamora R, Souza T. Lacunarity exponent and Moran index: a complementary methodology to analyze AFM images and its application to chitosan films. Phys. A Stat. Mech. Appl. 2021;581:126192. doi: 10.1016/j.physa.2021.126192. [DOI] [Google Scholar]
- Salaheldin AH, Kasbohm E, El-Naggar H, Ulrich R, Scheibner D, Gischke M, et al. Potential biological and climatic factors that influence the incidence and persistence of highly pathogenic H5N1 avian influenza virus in Egypt. Front Microbiol. 2018;9:528. doi: 10.3389/fmicb.2018.00528. [DOI] [PMC free article] [PubMed] [Google Scholar]
- Salvador R, Tanquilut N, Na Lampang K, Chaisowwong W, Pfeiffer D, Punyapornwithaya V. Identification of high-risk areas for the spread of highly pathogenic avian influenza in Central Luzon Philippines. Vet Sci. 2020;7(3):107. doi: 10.3390/vetsci7030107. [DOI] [PMC free article] [PubMed] [Google Scholar]
- Sealy JE, Fournie G, Trang PH, Dang NH, Sadeyen JR, Thanh TL, et al. Poultry trading behaviours in Vietnamese live bird markets as risk factors for avian influenza infection in chickens. Transboundary and Emerging Diseases. 2019;66:2507–2516. doi: 10.1111/tbed.13308. [DOI] [PMC free article] [PubMed] [Google Scholar]
- Shen H, Shen G, Chen Y, Russell AG, Hu Y, Duan X, et al. Increased air pollution exposure among the Chinese population during the national quarantine in 2020. Nat Hum Behav. 2021;5:239–246. doi: 10.1038/s41562-020-01018-z. [DOI] [PubMed] [Google Scholar]
- Sun LQ, Ward MP, Li R, Xia CC, Lynn H, Hu Y, et al. Global spatial risk pattern of highly pathogenic avian influenza H5N1 virus in wild birds: a knowledge-fusion based approach. Prev Vet Med. 2018;152:32–39. doi: 10.1016/j.prevetmed.2018.02.008. [DOI] [PubMed] [Google Scholar]
- Tian HY, Huang SQ, Zhou S, Bi P, Yang ZC, Li XJ, et al. Surface water areas significantly impacted 2014 dengue outbreaks in Guangzhou, China (vol 150, pg 299, 2016) Environ Res. 2017;154:459–460. doi: 10.1016/j.envres.2016.11.006. [DOI] [PubMed] [Google Scholar]
- Walsh MG, Mor SM, Hossain S. Highly pathogenic avian influenza (H5N1) landscape suitability varies by wetland habitats and the degree of interface between wild waterfowl and poultry in India. Viruses-Basel. 2020;12(11):1290. doi: 10.3390/v12111290. [DOI] [PMC free article] [PubMed] [Google Scholar]
- Wu T, Perrings C. The live poultry trade and the spread of highly pathogenic avian influenza: regional differences between Europe, West Africa, and Southeast Asia. PLoS ONE. 2018;13:1–4. doi: 10.1371/journal.pone.0208197. [DOI] [PMC free article] [PubMed] [Google Scholar]
- Xu B, Tian HY, Sabel CE, Xu B. Impacts of road traffic network and socioeconomic factors on the diffusion of 2009 pandemic influenza A (H1N1) in mainland China. International Journal of Environmental Research and Public Health. 2019;16:1223. doi: 10.3390/ijerph16071223. [DOI] [PMC free article] [PubMed] [Google Scholar]
- Yupiana Y, de Vlas SJ, Adnan NM, Richardus JH. Risk factors of poultry outbreaks and human cases of H5N1 avian influenza virus infection in West Java Province. Indonesia International Journal of Infectious Diseases. 2010;14:800–805. doi: 10.1016/j.ijid.2010.03.014. [DOI] [PubMed] [Google Scholar]
- Zhao Y, Guo ZQ, Zhao JH, Liang PF. Spatial-temporal distribution of human brucellosis and its correlation with the number of livestock in Ningxia Hui Autonomous Region, 2012–2018. Zhonghua Liu Xing Bing Xue Za Zhi. 2020;41:872–876. doi: 10.3760/cma.j.cn112338-20190925-00701. [DOI] [PubMed] [Google Scholar]
Associated Data
This section collects any data citations, data availability statements, or supplementary materials included in this article.
Data Availability Statement
The datasets used and/or analyzed during the current study are available from the corresponding author on reasonable request.


