

Abstract
Background
The routine D‐dimer quantification to exclude venous thromboembolism has led to the development of many assays, the usefulness of which depends on their reliability and performance.
Objective
We evaluated the analytical performances of the immunoturbidimetric Yumizen G DDi 2 assay (HORIBA Medical, Montpellier, France) performed on the Yumizen G800 analyzer and compared it with other available D‐dimer assays.
Methods
Within‐run and between‐run imprecision were evaluated using low‐ and high‐level quality‐control plasma samples. Interference due to hemolysis, icterus, lipemia, rheumatoid factor (RF), or heterophilic antibodies (human antimouse antibodies [HAMAs]) was evaluated by spiking plasma samples with hemolysate, bilirubin, Intralipid, RF, or HAMAs. The measurements obtained with the different D‐dimer assays were compared using Passing‐Bablok regression analysis and Bland‐Altman plot method, using fresh citrated plasma samples collected from 66 consecutive routine patients with a wide range of D‐dimer concentrations.
Results
Within‐ and between‐run variation coefficients for the Yumizen G DDi 2 assay ranged from 1.7% to 5.8% and from 2.8% to 5.5%, respectively. Hemolysis and icterus did not have any effect up to 10 g/L hemoglobin and 300 mg/L bilirubin. Lipemia seemed to generate an underestimation of D‐dimer concentration when the Intralipid concentration was >5 g/L. RF and HAMAs did not have any effect. The Passing‐Bablok and Bland‐Altman analyses showed small differences with other available D‐dimer assays, which were more pronounced with increasing values.
Conclusions
Its analytical performances and main technical features indicate that the new Yumizen G DDi 2 assay is suitable for the rapid quantification of D‐dimer in clinical hemostasis laboratories.
Keywords: bilirubin, hemolysis, hemostasis, immunoturbidimetry, thrombosis, venous thromboembolism
Essentials.
D‐dimer quantification is a routine part of the diagnostic pathway for exclusion of thrombosis.
The usefulness of this assay depends on its reliability and performance.
Analytical performance and agreement with other D‐dimer available assays are satisfactory.
The new Yumizen G DDi 2 assay is suitable for the rapid quantification of D‐dimer.
1. INTRODUCTION
Venous thromboembolism (VTE), which includes deep vein thrombosis and pulmonary embolism, represents a major public health problem, with about 10 million cases worldwide per year that are associated with substantial mortality and morbidity. 1 However, VTE diagnosis remains difficult; it is rarely based only on clinical examination and often requires complex and sometimes invasive complementary imaging investigations.
Many studies have demonstrated that plasma D‐dimer measurement can be a very effective and safe parameter for excluding the diagnosis of deep vein thrombosis or pulmonary embolism. 2 , 3 , 4 D‐dimer are fibrin degradation products and reflect concomitant activation of both coagulation and fibrinolysis. During the conversion of fibrinogen to fibrin monomers, the thrombin cleaves fibrinopeptides A and B from fibrinogen. The fibrin monomers then spontaneously form a polymer, and the transglutaminase factor XIII, also activated by the thrombin, stabilizes the initial fibrin polymer. Next, plasmin cleaves fibrin into fibrin degradation products, among which are D‐dimer. The D‐dimer is a metabolite of fibrinolysis that increases as a result of hypercoagulability and hyperfibrinolysis. Therefore, D‐dimer measurement is a sensitive but nonspecific indicator that has been widely used by clinicians to exclude VTE. D‐dimer assays have also been used to assess the risk of VTE recurrence, 5 , 6 to help define the optimal duration of anticoagulant treatment, 7 and to predict the VTE risk in hospitalized patients. 8 , 9
Enzyme‐linked immunosorbent assays have been considered the reference method for D‐dimer measurement for a long time, 10 , 11 but they are not suitable for routine use due to the significant analytical between‐run imprecision, lack of automation, and the time required. 9 An automated enzyme‐linked immunofluorescence assay was then developed that provides faster results (Vidas D‐dimer Exclusion II assay; bioMérieux, Inc., Durham, NC, USA) and is currently the most clinically validated assay for D‐dimer measurement. 3 , 12 , 13 More recently, chemiluminescent assays and latex‐enhanced immunoturbidimetric assays have shown good sensitivity and negative predictive values. 4 , 14 , 15 These assays allow the measurement of D‐dimer concentration simultaneously with other routine coagulation assays on the same analyzer.
Currently, many D‐dimer assays are available that differ in terms of the D‐dimer epitope targeted by the antibody, capture and detection methods, instrumentation required, calibration standards, and result expression. 9 , 16 Due to this heterogeneity, it is recommended to assess the analytical performances of an assay before its implementation in clinical strategies for VTE diagnosis and monitoring.
The objective of this study was to evaluate the analytical performance of the new D‐dimer immunoturbidimetric assay (Yumizen G DDi 2; HORIBA Medical, Montpellier, France) designed for the fully automated Yumizen G800 analyzer and to compare it with other available D‐dimer assays.
2. MATERIALS AND METHODS
2.1. Sample collection
Blood samples from hospitalized patients were collected in tubes containing 0.109 M trisodium citrate (Vacutainer; Becton Dickinson, Franklin Lakes, NJ, USA) with a 21G needle, after discarding the first milliliters of blood. Plasma was obtained by centrifugation at 2250 g at room temperature for 15 minutes, and was analyzed within 4 hours of collection. As the remaining plasma was used for Yumizen G DDi 2 testing, no blood sample was specifically collected for this study. This study was approved by the South‐East VI Ethics Committee (France, AU765).
2.2. Method description ‐ immunoturbidimetry
D‐dimer concentration was measured using the Yumizen G DDi 2 assay and the Yumizen G800 coagulation analyzer (HORIBA Medical) according to the manufacturer’s instructions. This is a fully automated immunoturbidimetric assay for the quantitative determination of D‐dimer, based on the time‐fixed determination of the D‐dimer concentration by photometric measurement of the antigen‐antibody reaction between anti–D‐dimer antibodies carried by latex particles and the D‐dimer molecules present in the plasma sample.
The kit includes the D‐dimer reagent (Yumizen G DDi 2 Buffer and Yumizen G DDi 2 Latex), control plasma samples (G CTRL DDi I and II), and buffer (Yumizen G Imidazol). Two quality controls (low and high concentration) were performed daily. To 20 µL of plasma, 115 µL of Yumizen G DDi 2 Buffer were added and incubated for 120 seconds at 37°C. The degree of agglutination was measured after the addition of 45 µL of Yumizen G DDi 2 Latex in relation to the decrease of transmitted light at 570 nm. Results are available in <3 minutes if no rerun is performed. D‐dimer concentrations >4000 ng/mL fibrinogen‐equivalent units (FEU) are obtained after automatic sample dilution (1:4) in the buffer Yumizen G Imidazol. The ready‐to‐use liquid format minimizes the preparation time, and the reagent is precalibrated, removing the need of a costly and time‐consuming calibration step.
2.3. Analytical evaluation
2.3.1. Precision
Precision was evaluated using manufactured human plasma–based quality controls at low and high concentration (Yumizen G CTRL DDi I and II). Within‐run imprecision was assessed in 30 sequential runs and between‐run imprecision by measuring the same controls in 15 different series twice per day, by using an identical lot of reagents. The final results were reported as a coefficient of variation (CV).
2.3.2. Limit of blank, limit of detection, and limit of quantification
These parameters were assessed according to the Clinical and Laboratory Standards Institute (CLSI) EP17‐A2 standard. 17 The LoB, defined as the highest measurement result that can be reliably measured in a blank sample, was estimated by measuring 30 replicates of a sample without D‐dimer molecules, and calculated with the following formula: LoB = meanblank + 1.645 SDblank. The dilution buffer (Yumizen G Imidazol) was the blank.
The LoD, defined as the lowest D‐dimer concentration likely to be reliably detected by the assay was obtained from 10 measurements in a single run of a plasma sample with a D‐dimer concentration of ≈2×LoB, and was determined with the following formula: LoD = LoB + 1.645 SDsample.
The LoQ, defined as the smallest value with an acceptable level of confidence and known uncertainty, was estimated by measuring 11 samples with mean D‐dimer concentrations from 33 to 333 ng/mL FEU (10 repeated measurements), and a nonlinear relationship calculated between the measurement error (CV%, y axis) and the D‐dimer concentration (ng/mL FEU, x axis).
2.3.3. Linearity
A patient plasma with high D‐dimer concentration (32 700 ng/mL FEU) was serially diluted at fixed ratios (ie, 1:9, 2:8, 3:7, 4:6, 5:5, 6:4, 7:3, 8:2, 9:1) with the Yumizen G IMIDAZOL dilution buffer to cover the most clinically significant range of concentrations. Serial dilutions were analyzed and the theoretical values were calculated from the measured values of the undiluted specimen. Linearity was assessed by linear regression analysis and calculation of the Spearman’s correlation coefficient (r).
2.4. Interference studies
Interference by hemolysis, icterus, and lipemia (HIL) was evaluated to determine their impact on the D‐dimer results. HIL interferences were assessed by adding known increasing concentrations of hemoglobin, bilirubin, and Intralipid 20% to 10 different samples with different D‐dimer levels (including 5 samples with values around the threshold value).
Hemoglobin was obtained by freezing washed and centrifuged erythrocytes. The supernatant was collected to create a hemolysate that was then spiked in the D‐dimer–positive plasma samples. 18 , 19 A control sample with only the diluent (Yumizen G Imidazol), to account for dilution, was also used. A range of hemoglobin concentrations was prepared to obtain samples with 0, 3, 5, 7, and 10 g/L of hemoglobin, according to the measurement obtained on an XN‐10 analyzer (Sysmex Corporation, Kobe, Japan). The interference was evaluated by calculating the bias percentage with the following formula: (Cx –C 0)/(C 0) × 100, where C 0 is the result of the nonhemolyzed sample and Cx is the result of the hemolyzed sample. 18 , 19 , 20
To study bilirubin effect, D‐dimer‐positive plasma samples were spiked with increasing concentrations of commercial bilirubin (143270‐1G; Sigma‐Aldrich, St. Louis, MO, USA) diluted in 0.1 M sodium hydroxide. 19 , 20 According to the Vista 1500 analyzer (Siemens, Berlin, Germany) measurements, the final bilirubin concentrations were 0, 100, 150, 200, and 300 mg/L. Results were calculated as the bias percentage from the control value, as carried out for the hemolysis interference.
Lipemia interference was studied by spiking D‐dimer–positive plasma samples with increasing concentrations of commercial Intralipid 20% (Fresenius Kabi, Bad Homburg vor der Höhe, Germany) to achieve final concentrations of 0, 3, 5, 7, 10 g/L in each aliquot. 19 , 20 Investigations were performed as described for hemoglobin and bilirubin.
As the Yumizen G DDi 2 assay is based on an antihuman D‐dimer monoclonal antibody, the interference by human antimouse antibodies (HAMAs) was tested by spiking 10 D‐dimer–positive plasma samples (including 5 with values around the threshold value) with HAMA‐positive human plasma (Scantibodies Laboratory Inc., Santee, CA, USA) to achieve a final HAMA concentration of 500 ng/mL. To test the interference by rheumatoid factor (RF), 8 D‐dimer–positive plasma samples (including 4 with values around the threshold value) were spiked with samples containing RF (MyBioSources, San Diego, CA, USA) to achieve a final RF concentration of 935 IU/mL. Samples were analyzed before and after spiking with HAMAs or RF. A control sample with diluent alone (Yumizen G Imidazol), to account for dilution, was also used. Results were calculated as the mean difference (percentage) relative to the control value (sample before spiking).
2.5. Comparison study
Comparison studies were carried out using fresh citrated plasma samples collected from 66 consecutive routine patients with a wide range of D‐dimer concentrations. Plasma samples were tested with different analyzer/reagent combinations: Vidas D‐dimer Exclusion II for VIDAS 3 (BioMérieux), STA‐Liatest D‐Di Plus for STA‐R Max (Diagnostica Stago, Parsippany, NJ, USA), Innovance D‐dimer for Sysmex CS‐2100i (Siemens Healthineers, Erlangen, Germany), HemosIL D‐dimer HS500 for ACL TOP 700 (Werfen, Bedford, USA), and Yumizen G800 for Yumizen G DDi 2. All these analyzers are in the same room in the hemostasis laboratory, offering the possibility to evaluate several instrument/reagent combinations using a small amount of plasma by the same specialized staff. Each assay was calibrated with the dedicated calibrators, used with the appropriate quality controls and in accordance with the manufacturer’s instructions. The same unit (ng/mL FEU) and the same usual clinical cutoff value (<500 ng/mL FEU) were used for all assays.
2.6. Statistical analysis
Statistical analyses were performed with Prism software version 8 (GraphPad Software, Inc., La Jolla, CA, USA) and with Stata (StataCorp, College Station, TX, USA) for Passing‐Bablok regression analysis.
For HIL interference, the results of the non‐HIL sample and those of the HIL samples were compared with the Friedman test (normality and homoscedasticity verified with the Bartlett test), followed by the appropriate multiple comparison post hoc tests (Dunn test). For HAMA and RF interference, the results of the samples with and without HAMA/RF were compared with the Wilcoxon test for paired data. P values <.005 were considered statistically significant. For all interferences, the calculated mean bias was compared with the desirable bias obtained from the online database created and managed by Ricos et al. 21 , 22 The acceptability threshold was 8.82%. 21 , 22
D‐dimer results obtained with the Yumizen G DDi2 reagent and the other analyzer/reagent combinations were compared with the Friedman test (normality and homoscedasticity verified with the Bartlett test), followed by the appropriate multiple comparison post hoc tests (Dunn test). Passing‐Bablok regression analysis, in addition to Bland‐Altman analysis was used for statistical analysis of method comparisons. The Passing‐Bablok analysis provides the linear equation y = a + b × x, where a is the constant (systematic difference between the methods) and b is the slope (proportional difference between the two methods). The results are interpreted as follows. If 0 is in the confidence interval (CI) for the constant, the null hypothesis (ie, no systematic difference) cannot be rejected. When the CI for the slope includes 1, the null hypothesis (ie, no proportional difference) cannot be rejected.
The mean bias and the 95% CIs were calculated with the Bland‐Altman plot method. Correlations were evaluated with the Spearman rank correlation coefficients.
3. RESULTS
3.1. Analytical evaluation
The within‐run and between‐run imprecision results of the Yumizen G DDi 2 assay are summarized in Table 1. The within‐run imprecision ranged between 1.7% for the high control sample (mean value, 1044 ng/mL FEU) and 5.8% for the low control sample (mean value, 330 ng/mL FEU, close to the threshold value). The between‐run imprecision was assessed with another quality control batch and ranged between 2.8% (mean value, 2015 ng/mL FEU) and 5.5% (mean value, 500 ng/mL FEU).
TABLE 1.
Imprecision of the Yumizen G DDi 2 assay
| n | Mean value (ng/mL FEU) | SD (ng/mL FEU) | CV (%) | CV (%) manufacturer | ||
|---|---|---|---|---|---|---|
| Within‐run | CTRL DDi I | 30 | 330 | 19 | 5.8 | 6.4 |
| CTRL DDi II | 30 | 1044 | 18 | 1.7 | 4.2 | |
| Between‐run | CTRL DDi I | 32 | 500 | 27 | 5.5 | 3.5 |
| CTRL DDi II | 32 | 2015 | 55 | 2.8 | 4.0 |
Using the CLSI approach, the LoB and LoD were 52 ng/mL FEU and 64 ng/mL FEU, respectively. The LoQ at 10% CV was estimated at 112 ng/mL FEU (Figure 1). The assay linearity was excellent up to 32 700 ng/mL FEU, as attested by the linear regression analysis (y = −0.9754x − 173.8) and the coefficient of correlation (r = .998; P < .0001) (Figure 2).
FIGURE 1.
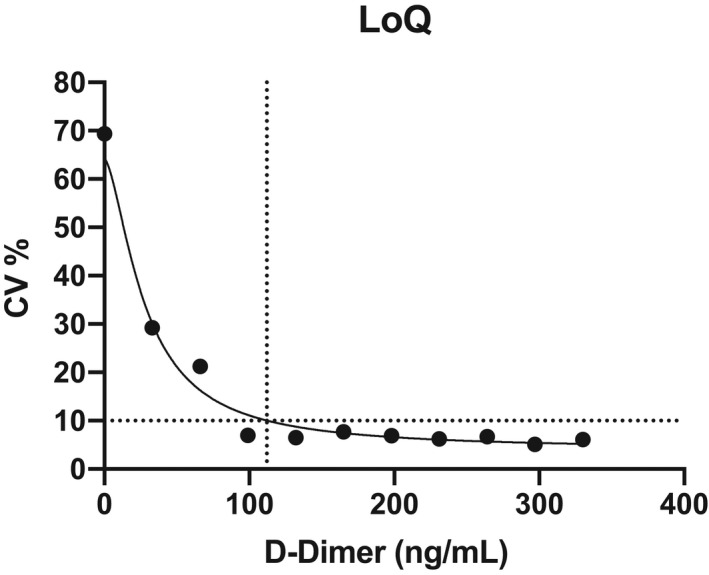
Estimation of the LoQ at 10% CV; the figure shows the nonlinear relationship calculated between the error of measurement (CV%, y axis) and the D‐dimer concentration (ng/mL FEU, x axis). CV, coefficient of variation; LoQ, smallest value with an acceptable level of confidence and known uncertainty
FIGURE 2.
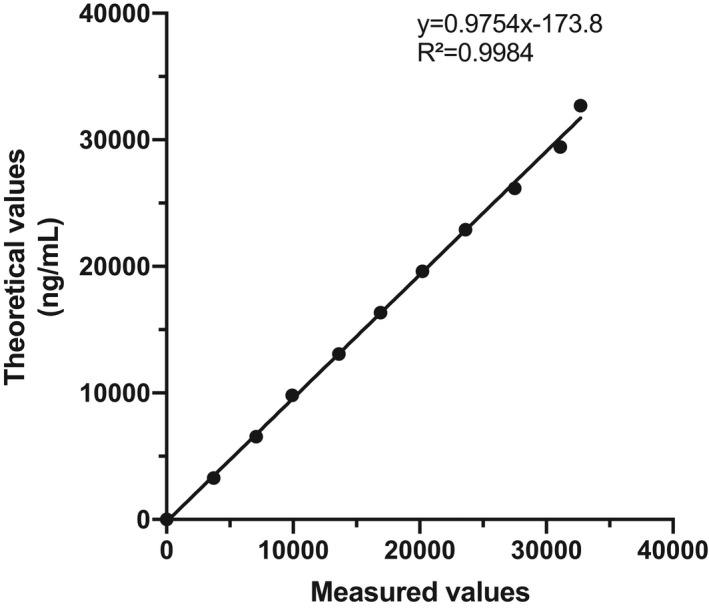
Linearity of the Yumizen G DDi 2 assay on the Yumizen G800 analyzer
3.2. Interference study
Hemolysis did not have any impact on D‐dimer measurement up to hemoglobin concentrations of 10 g/L (P = .11). The 10 samples tested had an acceptable bias (Figure 3A). Particularly, in samples with D‐dimer values around the threshold value, the bias did not exceed 5%, whatever the hemoglobin concentration.
FIGURE 3.
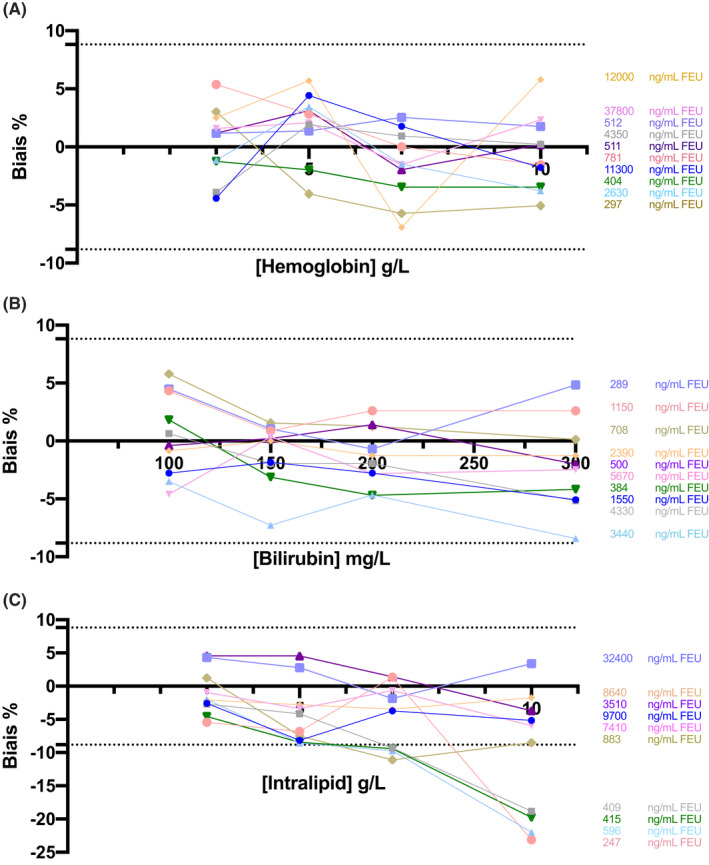
Bias (%) in D‐dimer measurement in function of hemoglobin (A), bilirubin (B) and lipid (C) levels. Dotted lines represent the limit of acceptable bias. Each color corresponds to a plasma sample, and the different points correspond to the different concentrations of hemoglobin, bilirubin, and intralipid spiked in the samples. The D‐dimer concentrations of the different samples are indicated on the right side. FEU, fibrinogen‐equivalent units
Icterus did not exert any analytical interference up to the highest bilirubin concentration tested (300 mg/L) (P = .07) with a bias <5% for plasma samples with D‐dimer concentrations around the threshold value (Figure 3B).
No significant bias was observed up to the highest lipid concentration tested (10 g/L) when using plasma samples with high D‐dimer values (>1500 ng/mL FEU). Conversely, lipemia induced a significant bias at lipid concentration >5 g/L and led to D‐dimer level underestimation (P = .006) when plasma samples with D‐dimer around the 500 ng/mL FEU threshold were used (Figure 3C).
HAMAs (500 ng/mL) and RF (935 IU/mL) did not influence D‐dimer measurement (P = .92 and P = .38, respectively) in samples with D‐dimer concentrations around or higher than the threshold value (Figure 4A and 4B). The mean difference relative to the control value did not exceed the acceptability threshold of 8.82%.
FIGURE 4.
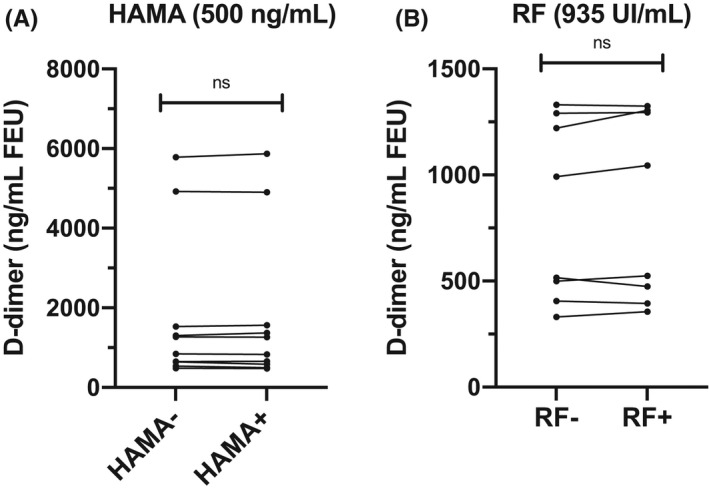
Effect of HAMAs (A) and RF (B) at different plasma D‐dimer concentrations. HAMAs, heterophilic human antimouse antibodies; ns, not significant; RF, rheumatoid factor
3.3. Comparison study
For comparison between Vidas D‐dimer Exclusion II/Vidas analyzer versus the Yumizen G DDi 2 assay/Yumizen G800 combination, a small constant difference was revealed by Passing‐Bablok regression analysis, with an equation y = −167.8 + 1.1x (intercept 95% CI, −252.5 to −64.1; slope 95% CI, 0.9‐1.3) (Figure 5A), with D‐dimer values slightly lower with the Vidas D‐dimer Exclusion II/Vidas analyzer compared with the Yumizen G DDi 2 assay/Yumizen G800 combination (P = .0003). The Bland‐Altman analysis of D‐dimer values (ng/mL FEU) showed a good concordance, with a mean bias of 81.4 (95% CI, −149.6 to 312.4), limit of agreement of −1746 and 1908, and discordant results for six samples with D‐dimer concentrations >2200 ng/mL FEU (Figure 5B).
FIGURE 5.
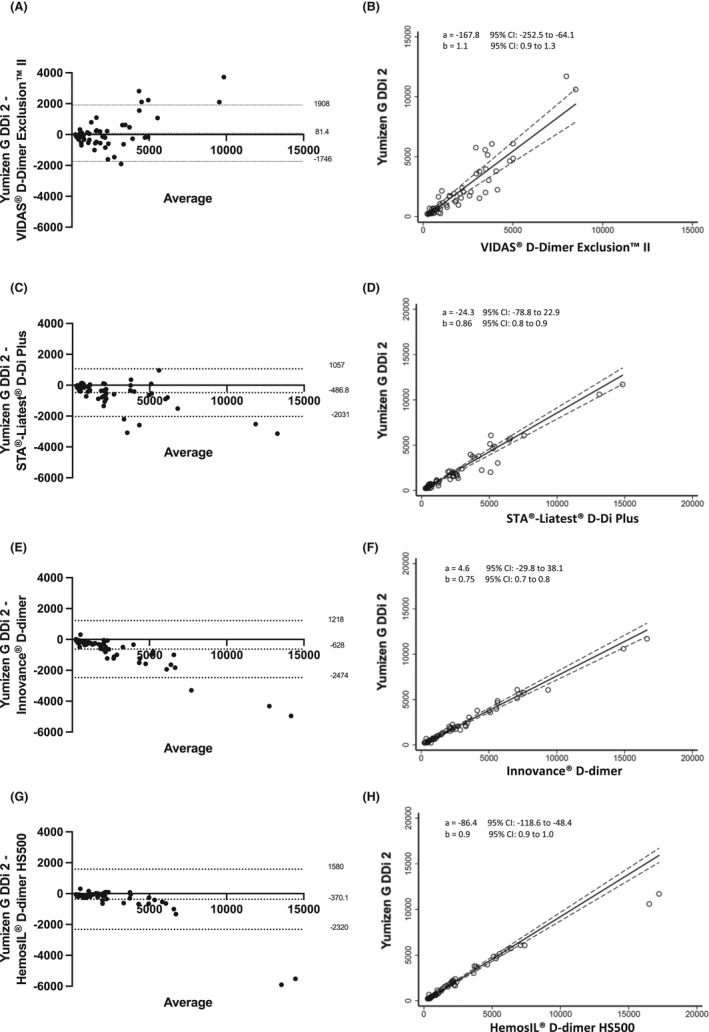
Bland‐Altman plots of all the D‐dimer values obtained with the Yumizen G DDi 2 assay/Yumizen G800 analyzer and: (A) Vidas D‐dimer Exclusion II/Vidas, (C) STA Liatest Ddi plus/STA‐R Max, (E) Innovance D‐dimer/CS 2100i, (G) HemosIL D‐dimer/ACL TOP 700. The x axis represents the mean of the measurements, and the y axis represents the difference between the measurements obtained with the two systems. Continuous and dotted lines represent the bias and the lower and upper limits of agreement with the 95% confidence intervals, respectively. Passing‐Bablok regression analysis are shown as B, D, F, H, respectively
For samples with values <1000 ng/mL FEU, no significant difference was revealed by Passing‐Bablok regression analysis with an equation y = −9.5 + 0.8x (intercept 95% CI, −116.3 to 107.2; slope 95% CI, 0.5‐1.0) (Figure 6A), confirmed by the Bland‐Altman analysis with a mean bias of 117.7 (95% CI, −494.0‐258.6). The latter showed three discordant D‐dimer results (ng/mL FEU): 686, 335, and 263 with the Yumizen G DDi 2 assay versus 355, 873, and 962 with the Vidas D‐dimer Exclusion II assay, respectively (Figure 6B). None of these three patients developed thrombosis.
FIGURE 6.
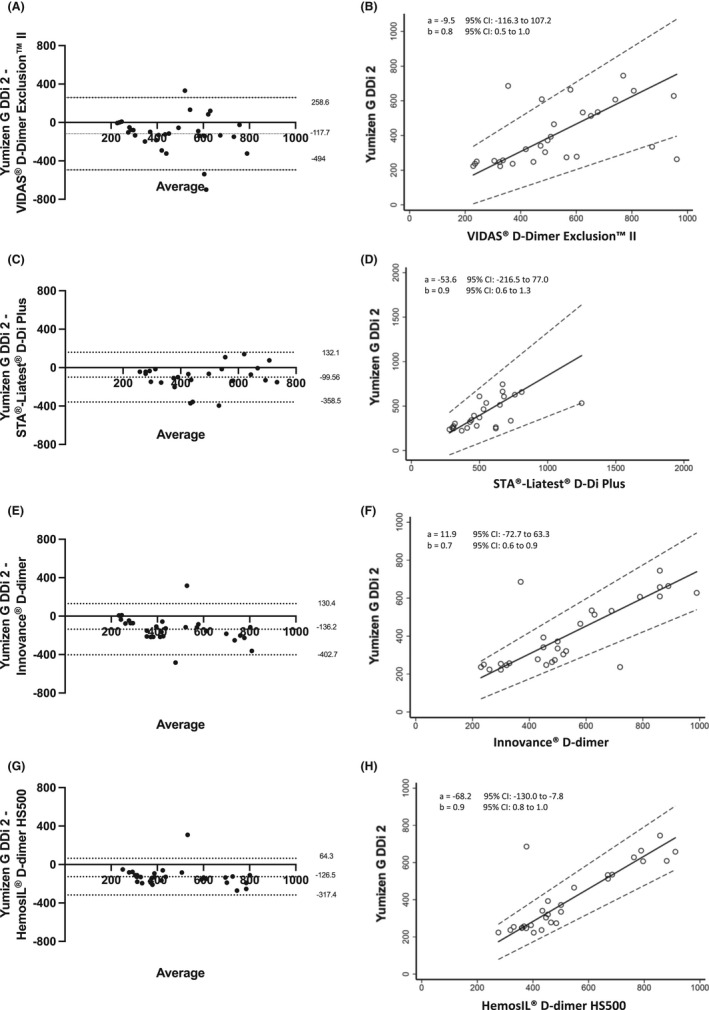
Bland‐Altman plots of the D‐dimer values <1000 ng/mL FEU obtained with the Yumizen G DDi 2 assay/Yumizen G800 analyzer and (A) Vidas D‐dimer Exclusion II/Vidas, (C) STA Liatest DDi plus/STA‐R Max, (E) Innovance D‐dimer /CS 2100i, (G) HemosIL D‐dimer/ACL TOP 700. Values >1000 ng/mL FEU were excluded from the Bland‐Altman plots to improve data visualization. The x axis represents the mean of the measurements, and the y axis represents the difference between the measurements obtained with the two systems. Continuous and dotted lines represent the bias and the lower and upper limits of agreement with the 95% confidence intervals, respectively. Passing‐Bablok regression analysis are shown as B, D, F, H, respectively
Small proportional difference was revealed by Passing‐Bablok regression analysis between D‐dimer values (ng/mL FEU) obtained with the STA Liatest DDi plus/STA‐R Max and with the Yumizen G DDi 2/Yumizen G800 combination with an equation y = −24.3 + 0.86x (intercept 95% CI, −78.8‐22.9; slope 95% CI, 0.8‐0.9) (Figure 5C). D‐dimer values were slightly higher with the STA Liatest DDi plus assay (P < .0001) with a mean bias of −487 (95% CI, −689 to −285) and limit of agreement of −2031 and 1057. The Bland‐Altman analysis highlighted five discordant results (samples with D‐dimer concentration >2000 ng/mL FEU) (Figure 5D).
Focusing on values <1000 ng/mL, no significant difference between these two reagent/analyzer combinations was evidenced by Passing‐Bablok regression analysis with an equation y = −53.6 + 0.9x (intercept 95% CI, −216.5 to 77.0; slope 95% CI, 0.6‐1.3) (Figure 6C). The Bland‐Altman analysis also showed a good agreement with a mean bias of −99.56 (95% CI, −358 to 159), three values were discordant with no thromboembolic event occurring in these patients (248, 335, and 263 ng/mL FEU with the Yumizen G DDi 2 assay vs 620, 730, and 620 ng/mL FEU with the STA Liatest DDi plus assay) (Figure 6D).
The Innovance® D‐dimer/CS 2100i combination yielded higher D‐dimer values than the Yumizen G DDi 2 reagent/Yumizen G800 combination (P < .0001), evidenced by the Passing‐Bablok regression analysis with an equation y = 4.6 + 0.75x (intercept 95% CI, −29.8 to 38.1; slope 95% CI, 0.7‐0.8) (Figure 5E) and the Bland‐Altman analysis with a mean bias of −628 (95% CI, −861 to −395), limit of agreement of −2474 and 942. Results were considered discordant for two samples with D‐dimer concentration >5000 ng/mL FEU (Figure 5F).
When only values <1000 ng/mL were considered, the Passing‐Bablok regression analysis showed also proportional difference between these two assays with y = 11.9 + 0.7x (intercept 95% CI, −72.7 to 63.3; slope 95% CI, 0.6‐0.9) (Figure 6E), while the Bland‐Altman analysis showed a good agreement with a mean bias of −136.2 (95% CI, −402.7 to 130.4). Two values were discordant (686 and 237 ng/mL FEU with the Yumizen G DDi 2 assay vs 370 and 720 ng/mL FEU with the Innovance D‐dimer assay); neither of these two patients developed thrombosis (Figure 6F).
The Passing‐Bablok regression analysis showed constant difference between D‐dimer values obtained with the HemosIL D‐dimer/ACL TOP 700 and with the Yumizen G DDi 2/Yumizen G800 combination with y = −86.4 + 0.9x (intercept 95% CI, −118.6 to −48.4; slope 95% CI, 0.9‐1.0) (Figure 5G). D‐dimer values were higher with the HemosIL D‐dimer/ACL TOP 700 (P < .0001), with a mean bias of −370 (95% CI, −617 to –124) and limit of agreement of −2320 and 1580. The Bland‐Altman analysis showed discordant values for two samples with high D‐dimer concentrations >10 000 ng/mL FEU (Figure 5H).
The same pattern was observed when only values <1000 ng/mL were considered; the Passing‐Bablok regression analysis showed constant difference between these two assays with y = −68.2 + 0.9x (intercept 95% CI, −130.0 to −7.8; slope 95% CI, 0.8‐1.0) (Figure 6G), while the Bland‐Altman analysis showed a good agreement with a mean bias of −126.5 (95% CI, −317.4 to 64.3). One D‐dimer value was discordant (686 ng/mL FEU with the Yumizen G DDi 2 assay versus 377 ng/mL FEU with the HemosIL D‐dimer assay), without a thromboembolic event (Figure 6H).
The Spearman rank correlation analysis showed strong correlations between the D‐dimer concentrations obtained with the Yumizen G DDi 2/Yumizen G800 and the other reagent/analyzer combinations: r = .93 for Yumizen G DDi 2 versus VIDAS D‐Dimer Exclusion II (P < .0001), r = .97 versus STA Liatest DDi plus (P < .0001), r = .99 versus Innovance D‐dimer (P < .0001) and r = .98 versus HemoSil DDimer HS500 (P < .0001).
4. DISCUSSION
D‐dimer measurement is one of the most commonly requested tests in the hemostasis laboratory, mainly to exclude thromboembolism. Recently, various immunoturbidimetric D‐dimer assays have been marketed for routine laboratory practice. Most of these assays are fully automated and allow D‐dimer measurement simultaneously with other routine coagulation assays, which is convenient for daily use. However, due to differences in the technologies on which these assays are based, the analytical performance of each new assay needs to be evaluated before implementation.
This study describes the analytical performance of the Yumizen G DDi2 D‐dimer immunoturbidimetric assay performed with the Yumizen G800 analyzer. The CV values of within‐ and between‐day imprecision (below the data reported by the manufacturer, except the between‐day imprecision in the normal range) were in accordance with the specifications by Ricos and colleagues. 21 , 22 The assay imprecision for plasma samples close to the threshold of 500 ng/mL FEU was satisfactory and comparable to what reported earlier for the VIDAS D‐Dimer Exclusion II assay. 12 The method is fully automated, uses a small amount of sample, and has a short sample turnaround time. The assay linearity was very good for a broad range of concentrations, up to 20 000 ng/mL FEU with automatic dilution and extended to 32700 ng/mL FEU with manual redilution, which was larger than the measurement range announced by the manufacturer. The lower and upper detection limits (112 and 32 700 ng/mL FEU) were similar to those reported for the other available assays (Table 2). This wide linear range allows the direct measurement of most clinical samples without the need for manual dilution and thus decreases the sample turnaround time.
TABLE 2.
Characteristics of the available D‐dimer assays and interferences
| Lower and upper detection limits (ng/mL FEU) with on‐board dilution | Hemoglobin (g/L) | Bilirubin (mg/L) | Lipids (g/L) | Rheumatoid factor (UI/mL) | HAMAs (ng/mL) | |
|---|---|---|---|---|---|---|
| VIDAS D‐Dimer Exclusion II | 45–50 000 | >4.8 | >313 | >30 | >400 | 500 |
| STA‐Liatest D‐Di Plus | 270–20 000 | >3 | >200 | No manufacturer’s data | >1000 | Can lead to overestimation |
| Innovance D‐dimer | 170–35 200 | >2 | >600 | >6 | >1330 | Decrease or increase |
| HemosIL D‐dimer HS500 | 215–12 800 | >5 | >180 | >13.3 | >1400 | Can lead to overestimation |
| Yumizen G DDi 2 | 112–32 700 (Figures 1 and 2) | >10 (Figure 3A) | >300 (Figure 3B) | >5 (Figure 3C) | 935 (Figure 4A) | >500 (Figure 4B) |
Abbreviations: FEU, fibrinogen‐equivalent units; HAMAs, heterophilic human antimouse antibodies.
Clinically significant interferences due to hemolysis, icterus, and lipemia are a common issue in immunoassays. 23 , 24 , 25 In this study, no significant impact of hemolysis was found up to hemoglobin concentrations of 10 g/L, which was higher compared with the manufacturers’ data (Table 2) and previous studies on other assays. For instance, a recent study performed with the STA‐Liatest D‐Di Plus reagent on a STAR MAX 2 analyzer found that D‐dimer values started to increase from 6 g/L of hemoglobin. 26 No impact of icterus was observed up to 300 mg/L of bilirubin, as reported for the VIDAS D‐Dimer Exclusion II reagent and in agreement with Mastella et al, 27 who found no significant change in D‐dimer concentrations up to 300 mg/L of bilirubin. Conversely, lipid concentrations higher than 5 g/L led to an analytical interference, with a negative bias. Similarly, Jensen et al showed that plasma samples with low D‐dimer concentrations (<750 ng/mL FEU) are the most affected by lipemia (with the HemosIL D‐dimer HS 500 assay and the ACL TOP 550 analyzer). 28 Conversely, no interference was observed below 10 g/L of Intralipid for the plasma samples with higher D‐dimer concentrations.
The occurrence of interfering heterophilic antibodies (eg, HAMAs and RF) with antibody of D‐dimer assays has been reported in the literature and is responsible for false‐negative or false‐positive results with meaningful clinical implications. 29 , 30 , 31 , 32 No interference of HAMAs (up to 500 ng/mL) and RF (up to 935 UI/mL) was detected, supporting the safety of the D‐dimer results obtained with the Yumizen G DDi 2 reagent, RF levels rarely exceeding 1000 UI/mL in clinical practice. 33 There are few data in the literature concerning HAMA concentrations in clinical practice, plasma samples being usually treated with a specific heterophilic blocking reagent when HAMA interference was suspected, instead of measuring HAMA concentration. 30 , 31 , 32 , 34
Good correlation was observed between Yumizen G DDi 2 and all the other immunoassays tested in this study, with correlation coefficients between 0.93 and 0.99. Method comparison studies were performed using the currently proposed D‐dimer reference method, Vidas D‐dimer Exclusion II. High comparability was evidenced when comparing the Yumizen G DDi 2 assay with this assay, as shown by the Passing‐Bablok linear regression and the Bland‐Altman analysis, even when considering only values <1000 ng/mL FEU. D‐dimer concentrations were slightly lower with the Yumizen G DDi 2 assay than with the STA Liatest DDi Plus, Innovance D‐dimer, and HemosIL D‐dimer assays. Some discordant D‐dimer values were observed around the usual clinical decision threshold with each of the combinations, but none of the involved patients developed thrombosis. Our results are in line with the previously published statement that the major drawback of D‐dimer assays is the high variability observed between commercial immunoassays. This persisting variability might be explained by the heterogeneity in antibody specificity (preference for high‐ or low‐molecular‐weight fibrin degradation products) or complexity of the targeted analyte, and by the lack of international certified internal controls or calibrators. 9 , 35 , 36
This study presents some limitations. Different approaches exist to test HIL interferences. Spiking plasmas with hemolysate, lipemic, or icteric preparations may fail to show the same effects as naturally hemolyzed, icteric, or lipemic patient samples. However, our investigations can provide a good estimate of the interferences and are in accordance with the CLSI guidelines. Unlike many other studies, quantifications and assay comparison were performed with fresh plasma samples to avoid the potential impact of freezing and to reproduce the real‐life conditions of D‐dimer measurement in emergency situations. Finally, results of this study should be clinically validated to prove the accuracy of this D‐dimer assay when used for the diagnostic workup of patients with VTE, or in risk stratification for recurrence after unprovoked VTE.
In conclusion, our study found that the analytical performances of the Yumizen G DDi 2 assay are satisfactory. The automated Yumizen G800 rapidity and random access testing are additional advantages of this method for routine use in clinical hemostasis laboratories.
RELATIONSHIP DISCLOSURE
The reagents used were provided by HORIBA Medical. VF, AT, and BP have nothing to disclose. AL and TS reports payment for presentation by HORIBA Medical. LT reports support for attending meetings by HORIBA Medical.
AUTHOR CONTRIBUTIONS
AL, TS, and LT designed the study. VF and AT performed all D‐dimer assays. BP supervised the statistical analyses. AL and TS critically reviewed the manuscript. LT carried out all data management, analyzed the data, and wrote the manuscript.
Talon L, Fourneyron V, Trapani A, Pereira B, Sinegre T, Lebreton A. Analytical performance of a new immunoturbidimetric D‐dimer assay and comparison with available assays. Res Pract Thromb Haemost. 2022;6:e12660. doi: 10.1002/rth2.12660
Handling Editor: Dr Johnny Mahlangu
Funding information
None.
REFERENCES
- 1. Raskob GE, Angchaisuksiri P, Blanco AN, et al. Thrombosis: a major contributor to global disease burden. Arterioscler Thromb Vasc Biol. 2014;34:2363‐2371. [DOI] [PubMed] [Google Scholar]
- 2. Bounameaux H, de Moerloose P, Perrier A, Reber G. Plasma measurement of D‐dimer as diagnostic aid in suspected venous thromboembolism: an overview. Thromb Haemost. 1994;71:1‐6. [PubMed] [Google Scholar]
- 3. van der Graaf F, van den Borne H, van der Kolk M, de Wild PJ, Janssen GW, van Uum SH. Exclusion of deep venous thrombosis with D‐dimer testing–comparison of 13 D‐dimer methods in 99 outpatients suspected of deep venous thrombosis using venography as reference standard. Thromb Haemost. 2000;83:191‐198. [PubMed] [Google Scholar]
- 4. Di Nisio M, Squizzato A, Rutjes AWS, Büller HR, Zwinderman AH, Bossuyt PMM. Diagnostic accuracy of D‐dimer test for exclusion of venous thromboembolism: a systematic review. J Thromb Haemost. 2007;5:296‐304. [DOI] [PubMed] [Google Scholar]
- 5. Bjøri E, Johnsen HS, Hansen J‐B, Braekkan SK. D‐dimer at venous thrombosis diagnosis is associated with risk of recurrence. J Thromb Haemost. 2017;15:917‐924. [DOI] [PubMed] [Google Scholar]
- 6. Avnery O, Martin M, Bura‐Riviere A, et al. D‐dimer levels and risk of recurrence following provoked venous thromboembolism: findings from the riete registry. J Intern Med. 2020;287:32‐41. [DOI] [PubMed] [Google Scholar]
- 7. Rodger MA, Le Gal G, Anderson DR, et al. Validating the HERDOO2 rule to guide treatment duration for women with unprovoked venous thrombosis: multinational prospective cohort management study. BMJ. 2017;356:j1065. [DOI] [PMC free article] [PubMed] [Google Scholar]
- 8. Gibson C, Spyropoulos A, Cohen A, et al. The IMPROVEDD VTE risk score: incorporation of D‐dimer into the IMPROVE score to improve venous thromboembolism risk stratification. TH Open. 2017;01:e56‐65. [DOI] [PMC free article] [PubMed] [Google Scholar]
- 9. Favresse J, Lippi G, Roy P‐M, et al. D‐dimer: preanalytical, analytical, postanalytical variables, and clinical applications. Crit Rev Clin Lab Sci. 2018;55:548‐577. [DOI] [PubMed] [Google Scholar]
- 10. Linkins L‐A, Takach Lapner S. Review of D‐dimer testing: good, bad, and ugly. Int J Lab Hem. 2017;39:98‐103. [DOI] [PubMed] [Google Scholar]
- 11. Riley RS, Gilbert AR, Dalton JB, Pai S, McPherson RA. Widely used types and clinical applications of D‐dimer assay. Lab Med. 2016;47:90‐102. [DOI] [PubMed] [Google Scholar]
- 12. Pittet JL, de Moerloose P, Reber G, et al. VIDAS D‐dimer: fast quantitative ELISA for measuring D‐dimer in plasma. Clin Chem. 1996;42:410‐415. [PubMed] [Google Scholar]
- 13. Mountain D, Jacobs I, Haig A. The VIDAS D‐dimer test for venous thromboembolism: a prospective surveillance study shows maintenance of sensitivity and specificity when used in normal clinical practice. Am J Emerg Med. 2007;25:464‐471. [DOI] [PubMed] [Google Scholar]
- 14. Waser G, Kathriner S, Wuillemin WA. Performance of the automated and rapid STA Liatest D‐dimer on the STA‐R analyzer. Thromb Res. 2005;116:165‐170. [DOI] [PubMed] [Google Scholar]
- 15. Lippi G, Salvagno GL, Rossi L, Montagnana M, Franchini M, Guidi GC. Analytical performances of the D‐dimer assay for the Immulite 2000 automated immunoassay analyser. Int J Lab Haematol. 2007;29:415‐420. [DOI] [PubMed] [Google Scholar]
- 16. Adam SS, Key NS, Greenberg CS. D‐dimer antigen: current concepts and future prospects. Blood. 2009;113:2878‐2887. [DOI] [PubMed] [Google Scholar]
- 17. Clinical and Laboratory Institute (CLSI) . Evaluation of Detection Capability for Clinical Laboratory Measurement Procedures; approved guideline (2nd edn). CLSI Document EP17‐A2; 2012. https://clsi.org/standards/products/method‐evaluation/documents/ep17/ (accessed December 9, 2020) [Google Scholar]
- 18. Block DR, Ouverson LJ, Wittwer CA, Saenger AK, Baumann NA. An approach to analytical validation and testing of body fluid assays for the automated clinical laboratory. Clin Biochem. 2018;58:44‐52. [DOI] [PubMed] [Google Scholar]
- 19. Clinical and Laboratory Institute (CLSI) . Hemolysis, Icterus, and Lipemia/Turbidity Indices as Indicators of Interference in Clinical Laboratory Analysis; approved guideline. CLSI Document C56‐A; 2012. https://clsi.org/standards/products/clinical‐chemistry‐and‐toxicology/documents/c56/ (accessed January 22, 2021) [Google Scholar]
- 20. Nougier C, Jousselme E, Sobas F, Pousseur V, Négrier C. Effects of hemolysis, bilirubin, and lipemia interference on coagulation tests detected by two analytical systems. Int J Lab Hematol. 2020;42:88‐94. [DOI] [PubMed] [Google Scholar]
- 21. Ricós C, Alvarez V, Cava F, et al. Current databases on biological variation: pros, cons and progress. Scand J Clin Lab Invest. 1999;59:491‐500. [DOI] [PubMed] [Google Scholar]
- 22. Desirable specifications for total error, imprecision, and bias, derived from intra‐ and inter‐individual biologic variation. n.d. https://WwwWestgardCom/Biodatabase1htmhttps://www.westgard.com/biodatabase1.htm (accessed December 11, 2020)
- 23. Carraro P, Servidio G, Plebani M. Hemolyzed specimens: a reason for rejection or a clinical challenge? Clin Chem. 2000;46:306‐307. [PubMed] [Google Scholar]
- 24. Lippi G, Salvagno GL, Favaloro EJ, Guidi GC. Survey on the prevalence of hemolytic specimens in an academic hospital according to collection facility: opportunities for quality improvement. Clin Chem Lab Med. 2009;47:616‐618. [DOI] [PubMed] [Google Scholar]
- 25. Salvagno GL, Lippi G, Bassi A, Poli G, Guidi GC. Prevalence and type of pre‐analytical problems for inpatients samples in coagulation laboratory. J Eval Clin Pract. 2008;14:351‐353. [DOI] [PubMed] [Google Scholar]
- 26. Hedeland Y, Gustafsson CM, Touza Z, Ridefelt P. Hemolysis interference in 10 coagulation assays on an instrument with viscosity‐based, chromogenic, and turbidimetric clot detection. Int J Lab Hematol. 2019;42:341‐349. [DOI] [PubMed] [Google Scholar]
- 27. Mastella AK, de Carvalho JAM, Stein CS, Bochi GV, Moresco RN. Interference of icterus on plasma D‐dimer levels measured using immunoturbidimetric assays. Blood Coag Fibrinol. 2021;32:162‐163. [DOI] [PubMed] [Google Scholar]
- 28. Jensen AK, Christensen GL, Dalgård A, Jørgensen NR. Estimation of lipemia interference with automated HIL‐test on D‐dimer ACL TOP 50 series analysis – reveals a higher cut‐off than manufacturer’s recommendations. Scand J Clin Lab Invest. 2019;80:1‐4. [DOI] [PubMed] [Google Scholar]
- 29. Robier C, Edler E, Klescher D, Neubauer M. False‐positive D‐dimer result in a latex‐enhanced immunoassay caused by interfering human anti‐mouse antibodies. Clin Chem Lab Med. 2014;52:e253‐e255. [DOI] [PubMed] [Google Scholar]
- 30. Rouvière JA, Devignes J, de Maistre E, Kennel A, Chabot F, Lecompte T. Incohérence entre deux méthodes de dosage des D‐dimères : un cas d’interférence d’anticorps humain anti‐souris. Ann Biol Clin. 2008;66:441‐446. [DOI] [PubMed] [Google Scholar]
- 31. Lippi G, Ippolito L, Tondelli MT, Favaloro EJ. Interference from heterophilic antibodies in D‐dimer assessment. A case report. Blood Coagul Fibrinolysis. 2014;25:277‐279. [DOI] [PubMed] [Google Scholar]
- 32. Wu Y, Xiao Y‐X, Huang T‐Y, et al. What makes D‐dimer assays suspicious‐heterophilic antibodies? J Clin Lab Anal. 2019;33:e22687. [DOI] [PMC free article] [PubMed] [Google Scholar]
- 33. Nielsen SF, Bojesen SE, Schnohr P, Nordestgaard BG. Elevated rheumatoid factor and long term risk of rheumatoid arthritis: a prospective cohort study. BMJ. 2012;345:e5244. [DOI] [PMC free article] [PubMed] [Google Scholar]
- 34. Sun H‐X, Ge H, Xu Z‐Q, Sheng H‐M. Clinical laboratory investigation of a patient with an extremely high D‐dimer level: a case report. World J Clin Cases. 2020;8:3560‐3566. [DOI] [PMC free article] [PubMed] [Google Scholar]
- 35. Thachil J, Tang N, Gando S, et al. ISTH interim guidance on recognition and management of coagulopathy in COVID‐19. J Thromb Haemost. 2020;18:1023‐1026. [DOI] [PMC free article] [PubMed] [Google Scholar]
- 36. Bevan S, Longstaff C. Is it possible to make a common reference standard for D‐dimer measurements? Communication from the ISTH SSC Subcommittee on Fibrinolysis. J Thromb Haemost. 2022;2:498‐507. [DOI] [PMC free article] [PubMed] [Google Scholar]