

Abstract
Background
As paediatric cancer survivors are living into adulthood, they suffer from the age‐related, accelerated decline of functional skeletal muscle tissue, termed sarcopenia. With ionizing radiation (radiotherapy) at the core of paediatric cancer therapies, its direct and indirect effects can have lifelong negative impacts on paediatric growth and maintenance of skeletal muscle. Utilizing our recently developed preclinical rhabdomyosarcoma mouse model, we investigated the late effects of paediatric radiation treatment on skeletal muscles from late adolescent (8 weeks old) and middle‐aged (16 months old) mice.
Methods
Paediatric C57BL/6J male mice (3 weeks old) were injected with rhabdomyosarcoma cells into their right hindlimbs, and then fractionated irradiation (3 × 8.2 Gy) was administered to those limbs at 4 weeks old to eliminate the tumours. Radiation‐alone and tumour‐irradiated mice were assessed at either 8 weeks (3 weeks post‐irradiation) or 16 months (14 months post‐irradiation) of age for muscle physiology, myofibre characteristics, cell loss, histopathology, fibrosis, inflammatory gene expression, and fibrotic gene expression.
Results
Mice that received only paediatric radiation demonstrated reduced muscle mass (−17%, P < 0.001), muscle physiological function (−25%, P < 0.01), muscle contractile kinetics (−25%, P < 0.05), satellite cell number (−45%, P < 0.05), myofibre cross‐sectional area (−30%, P < 0.0001), and myonuclear number (−17%, P < 0.001). Paediatric radiation increased inflammatory gene expression, increased fibrotic gene expression, and induced extracellular matrix protein deposition (fibrosis) with tumour elimination exacerbating some phenotypes. Paediatric tumour‐eliminated mice demonstrated exacerbated deficits to function (−20%, P < 0.05) and myofibre size (−17%, P < 0.001) in some muscles as well as further increases to inflammatory and fibrotic gene expression. Examining the age‐related effects of paediatric radiotherapy in middle‐aged mice, we found persistent myofibre atrophy (−20%, P < 0.01), myonuclear loss (−18%, P < 0.001), up‐regulated inflammatory and fibrotic signalling, and lifelong fibrosis.
Conclusions
The results from this paediatric radiotherapy model are consistent and recapitulate the clinical and molecular features of accelerated sarcopenia, musculoskeletal frailty, and radiation‐induced fibrosis experienced by paediatric cancer survivors. We believe that this preclinical mouse model is well poised for future mechanistic insights and therapeutic interventions that improve the quality of life for paediatric cancer survivors.
Keywords: Sarcopenia, Ageing, Development, Stem cell, Regeneration, Musculoskeletal, Rhabdomyosarcoma, Radiation, DNA damage, Cancer survivorship, Frailty, Physiology
Introduction
Survival after paediatric cancer treatment has improved remarkably, where ~80% of children will survive >5 years from initial diagnosis. 1 Ionizing radiation therapy or radiotherapy effectively eliminates proliferative cancer cells and comprises over 50% of cancer treatments. 2 However, multifarious direct and indirect effects of radiotherapy can negatively impact tissue growth and maintenance especially in actively growing populations. 3 , 4 , 5 , 6 Longitudinal studies of paediatric cancer survivors demonstrate evidence of accelerated ageing and skeletal muscle decline or sarcopenia, which is typically associated with the geriatric population. 7 About 67% of adult survivors of paediatric cancers experience musculoskeletal frailties, 8 which are characterized by diminished physiological function, muscle loss, 7 reduced strength, 9 increased fatigability, fibrosis, and exercise intolerance, all of which negatively impact quality of life. 10 Musculoskeletal impairments are common amongst patients with sarcomas, particularly rhabdomyosarcomas (RMSs), which afflict about 350 new individuals under 20 years old in the USA annually. 1 , 11 Therefore, investigating the delayed, adverse effects of radiotherapy on physiological skeletal muscle health will illuminate potential interventions.
Exposure to ionizing radiation provokes an injury response that releases cytokines and chemotactic mediators that recruit immune cells to the irradiated tissue site, which subsequently promotes excessive deposition of extracellular matrix (ECM) proteins. 12 Radiation alters the tissue's microenvironment, dysregulates the immune response, leads to cell loss, and induces fibrosis, which can chronically impair normal tissue function. 3 , 4 , 5 , 12 Chronic accumulation of ECM proteins is termed ‘fibrosis’ and affects roughly 70% of adult survivors of paediatric sarcomas. 7 The underlying cellular and molecular mechanisms of radiation‐induced pro‐inflammatory and pro‐fibrotic signalling are being actively investigated in the lung, 13 liver, 14 and kidney. 15 , 16 Amongst these cytokines expressed after radiation are transforming growth factor‐β1 (TGF‐β1), C–C chemokine receptor type 2 (CCR2), and its associated ligands such as CCL2. 17 Chronic TGF‐β1 expression promotes fibroblast proliferation and myofibroblast differentiation, where these cells produce collagens and ECM proteins such as fibronectin (FN1). 18 Additionally, CCR2‐expressing immune cells are induced in irradiated pulmonary tissues 12 and colocalize to fibrotic areas. 16 , 19 ECM accumulation within and around the skeletal muscles is problematic as the ECM provides critical scaffolding, growth factor sequestration, and adhesion points for proper muscle growth, development, and regeneration. 20 Therefore, disruptions to the myofibre and ECM could lead to attenuated muscle function.
In this study, we examined how skeletal muscle tissues are impacted by paediatric radiation treatment alone and in the context of tumour elimination. Utilizing our recently established preclinical mouse model of paediatric cancer elimination and survivorship, 4 we assessed skeletal muscle 3 weeks post‐irradiation (3wpi) and 14 months post‐irradiation (14mpi). We demonstrated numerous deficits in paediatric irradiated skeletal muscles, some of which are exacerbated after tumour elimination. Genome‐wide RNA sequencing detected significant up‐regulation of inflammatory and fibrotic signalling transcriptional pathways in paediatric irradiated muscles. Consistent with these observations, there was an induction of fibrotic ECM deposition in paediatric irradiated muscles, which strongly correlated with reduced skeletal muscle function at 3wpi. Finally, at 14mpi, we demonstrate that blunted myofibre growth, diminished myonuclear accretion, inflammatory and pro‐fibrotic gene expression, and accumulation of ECM persist into adulthood and throughout life.
Methods
Experimental animal statement
This study was carried out in strict accordance with the recommendations in the Guide for the Care and Use of Laboratory Animals of the National Institutes of Health. All procedures involving animals were approved by the Institutional Animal Care and Use Committee at the University of Rochester called the University Committee on Animal Resources.
Rhabdomyosarcoma tumour implantation mouse model
C57BL/6 syngeneic, bioluminescent M3‐9‐M murine RMS cell lines transgenic for hepatocyte growth factor overexpression and heterozygous for mutated p53 with a luciferase reporter were previously derived and characterized. 4 , 21 Briefly, 3‐week‐old male C57BL/6J mice were anaesthetized and injected with 100 000 RMS tumour cells contained within Matrigel (Corning) into the lateral portion of the right gastrocnemius muscle. RMS tumours were allowed to grow for 6 days before irradiation, were self‐contained within the Matrigel matrix, and do not penetrate mature muscle fibres. 4 RMS tumour growth, recession, and elimination were tracked with the In Vivo Imaging System based on bioluminescence as previously described. 4 Any mice with residual RMS tumour regrowth, recurrence, or presence based upon necropsy, muscle histological dissection, or In Vivo Imaging System bioluminescent signature were euthanized and not included in the study. The gastrocnemius muscle is not amenable to fixed single muscle fibre disassociation or to be removed from the mouse and tested for their muscle function within the ex vivo vertical water bath muscle physiology experimental setup (Aurora Scientific) due to their girth, mass, and need for constant oxygenation and vascular blood supply. Thus, the extensor digitorum longus (EDL) and soleus (SOL) muscles were utilized in our study design as both are contained within the irradiation field, similar to each other in muscle mass and myofibre number, differ in myofibre‐type distributions, differ in metabolic profiles, differ in satellite cell number, amenable to fixed single‐fibre analysis, and perfect for the ex vivo vertical water bath muscle physiology testing equipment.
Radiation
All radiation was delivered using a small animal radiation research platform as previously described. 4 , 5 Briefly, mice were anaesthetized, and fractionated radiation of three doses at 8.2 Gy was administered ~6 days after RMS implantation locally to the lower right limb. Note that standard clinical regimens for individuals afflicted with high‐grade RMS utilize extended fractionation schedules for total radiation doses of 35–60 Gy. 4 Our regimen was conducted using an α/ ration of 3, and within the clinical regimen range. 4 We have previously tested the 3 × 8.2 Gy regimen, 4 , 5 which leads to successful RMS tumour elimination (~95%), mouse survival rate, and similar skeletal muscle decline. 4 Furthermore, the 3 × 8.2 Gy hypo‐fractionated regimen circumvents constraints due to radiation platform availability and the brief period of murine juvenile growth (3–6 weeks old). 5
Ex vivo muscle force generation assessment
Muscle force generation capacity was analysed for the EDL and SOL muscles using the Aurora Scientific muscle contraction system as previously described. 22 , 23 , 24 Physiological cross‐sectional area (CSA) was calculated as (muscle weight [mg])∕(1.056 * (0.44 or 0.70) * length [mm]), where 1.056 = muscle density (g/cm3), 0.44 = EDL angular factor, and 0.71 = SOL angular factor.
Fixed single‐myofibre preparation and analyses
Fixed EDL and SOL single‐myofibre size, myonuclear number, and myonuclear domain (MND) analyses were performed as previously described. 4 , 5 , 22 Myofibres were imaged and analysed with ImageJ software. Myofibre CSA was measured along at least three points per single myofibre. Myonuclear number was counted per millimetre length (MN/mm) of myofibre. MND was calculated by dividing myofibre volume (myofibre length * average CSA) by number of myonuclei. All sample imaging and quantifications were randomized and performed blinded to experimental group.
Tissue processing, cryosectioning, and immunofluorescence
Muscles were processed as previously described. 22 , 23 , 24 Primary antibody incubation was performed for 2 h at room temperature or overnight at 4°C followed by secondary antibody incubation for 1 h at room temperature. DAPI staining was performed to identify cell and myonuclei. All slides were mounted with Fluoromount‐G (SouthernBiotech). Sections were imaged at ×4, ×10, and ×20 magnifications on the Echo Revolve microscope, at least three sections per slide were analysed per sample in ImageJ, and sample analyses were performed in a blinded manner to experimental group. Muscles stained with antibodies for collagen type 4 (COL‐4), fibronectin‐1 (FN1), and laminin‐α2 (LAMA2) were imaged with the same exposure times, gain, and threshold values. The area of each ECM protein was quantified relative to the total muscle area within the field of view in ImageJ.
Antibodies
The following antibodies were used: laminin‐α2 (rat, 1:1500, Sigma‐Aldrich, L0663), DAPI (1:3000), BA‐D5 (MyHC‐I, mouse IgG2b, 1:40, Developmental Studies Hybridoma Bank DSHB), SC‐71 (MyHC‐IIA, mouse IgG1, 1:40, DSHB), BF‐F3 (MyHC‐IIB, mouse IgM, 1:40, DSHB), collagen type IV (COL‐4, rabbit polyclonal, 1:500, Abcam ab6586), fibronectin‐1 (FN1, rabbit polyclonal, 1:500, Sigma ab2033), Alexa Fluor 405‐conjugated goat anti‐mouse IgG2b (1:1500, Thermo Fisher Scientific, A‐21141), Alexa Fluor 488‐conjugated goat anti‐mouse IgM (1:1500, Thermo Fisher Scientific, A‐21042), Alexa Fluor 594‐conjugated goat anti‐mouse IgG1 (1:1500, Thermo Fisher Scientific, A‐21125), AlexaFluor 488‐conjugated goat anti‐mouse IgG (1:1500, Life Technologies, A‐11001), AlexaFluor 488‐conjugated goat anti‐rabbit IgG (1:1500, Life Technologies, A‐11034), and AlexaFluor 647‐conjugated goat anti‐rat IgG (1:1500, Life Technologies, A‐21247).
Fluorescence‐activated cell sorting analysis
For fluorescence‐activated cell sorting (FACS) analyses, skeletal muscles were dissociated, and satellite cells and mesenchymal progenitor/fibro‐adipogenic progenitor cells were analysed as previously described. 23 , 25 Briefly, satellite cells were characterized as CD45−, Sca1−, and CD31− (BD Biosciences; BioLegend), and VCAM+, CXCR4, and β1Integrin+ (BioLegend), mesenchymal progenitor/fibro‐adipogenic progenitor cells were characterized as CD45−, CD31−, and Sca1+ (BD Biosciences; BioLegend). FACS experiments were performed with single stain, FMO, and appropriate control conditions.
Masson's trichrome stain
After cryosectioning, tissue sections were fixed in 4% PFA for 1 h, fixed overnight in Bouin's solution, rehydrated, incubated for 5 min in Weigert's haematoxylin, incubated in Biebrich scarlet‐acid fuchsin solution, rehydrated, incubated in phosphomolybdic acid solution, incubated in aniline blue solution, washed, incubated in 1% glacial acetic acid, washed, dehydrated using ethanol, mounted, and coverslipped.
RNA extraction and reverse transcription–real‐time PCR
RNA isolation and reverse transcription–quantitative polymerase chain reaction (RT‐qPCR) were performed as previously described. 22 Briefly, muscles were flash frozen in TRIzol reagent (Life Technologies) upon dissection and homogenized, and RNA was isolated using RNeasy Plus Mini Kit (Qiagen) according to the manufacturer's protocols. Then, cDNA was synthesized using qScript cDNA SuperMix (Quantabio). RT‐qPCR was performed on a StepOnePlus Real‐Time PCR machine (Applied Biosystems) using SYBR Green FastMix (Quantabio). Relative mRNA transcript levels from each experiment were performed in triplicate, standardized to its own internal gapdh gene expression, then to the control condition using the 2−∆∆CT analysis method and in accordance with MIQE guidelines. 26 We found gapdh gene expression to be stable across experimental conditions. Primers are provided in Supporting Information, Table S2.
RNA‐sequencing library construction and next‐generation sequencing
RNA‐sequencing library construction and next‐generation sequencing were performed as previously described. 5 , 22 Briefly, total RNA concentration was determined with the NanoDrop 1000 spectrophotometer (NanoDrop), and RNA quality was assessed with the Agilent Bioanalyzer. Illumina compatible library construction was performed using the TruSeq Total Stranded RNA Sample Preparation Kit (Illumina) following the manufacturer's protocols as previously described. 5 , 22 Raw reads generated from the Illumina HiSeq 2500 sequencer were demultiplexed using bcl2fastq Version 2.19.0 and prepared for data processing and next‐generation sequencing. Differential expression analysis and data normalization were performed using DESeq2 1.14.1 with an adjusted P‐value threshold of 0.05 within an RStudio environment.
Statistical analyses
Statistical analyses were performed with GraphPad Prism 9 using unpaired t‐tests with Welch's corrections, and one‐way or two‐way ANOVA followed by Tukey's multiple comparisons test. Error bars are standard error of the mean. For simple and multivariate linear regression analyses, positive correlations (+r 2) have positive linear slopes, negative correlations (−r 2) have negative linear slopes, dotted lines represent 95% confidence intervals, r 2 and R 2 represent goodness of fit, and statistical significance was determined as P < 0.05.
Results
Decreased skeletal muscle physiological function after paediatric radiotherapy
We have previously characterized a murine model of paediatric radiation‐induced muscle growth inhibition in the presence or absence of RMS tumour elimination 4 , 5 ; however, whether these phenotypes are associated with deficits in skeletal muscle function is unknown. To assess if paediatric radiotherapy alone, and in the context of tumour elimination, affects skeletal muscle function, we evaluated the physiology of fast‐contracting EDL and slow‐contracting SOL muscles at 3wpi under the following conditions: 0Gy control (CTL), contralateral limb (Rad CL), irradiated‐alone limb (Rad RL), contralateral limb to the RMS eliminated limb (RMS Rad CL), and the right irradiated limb of the RMS eliminated limb (RMS Rad RL) (Figure 1A). Representative EDL and SOL tetanic force traces at 150 Hz stimulation demonstrated reduced force generation at 3wpi that was accompanied by a reduction in muscle mass (Figure 1B–1E). Indirect stimulation at increasing, summating electrical frequencies, and quantification at 150 Hz demonstrated that paediatric radiation led to a reduction in absolute and specific force in the EDL (Figures 1F–1I and S2A) and SOL (Figures 1J–1M and S2B) muscles. Furthermore, other physiological characteristics such as impulse, activation rate, and relaxation rate were significantly affected by paediatric radiation in the EDL (Figures S1A–S1D, S1I, S1J, and S2C) and SOL (Figures S1E–S1H, S1K, S1L, and S2D) muscles. Importantly, deficits to muscle physiological function were driven by paediatric radiotherapy and modestly exacerbated by RMS tumour elimination only in the SOL muscles.
Figure 1.
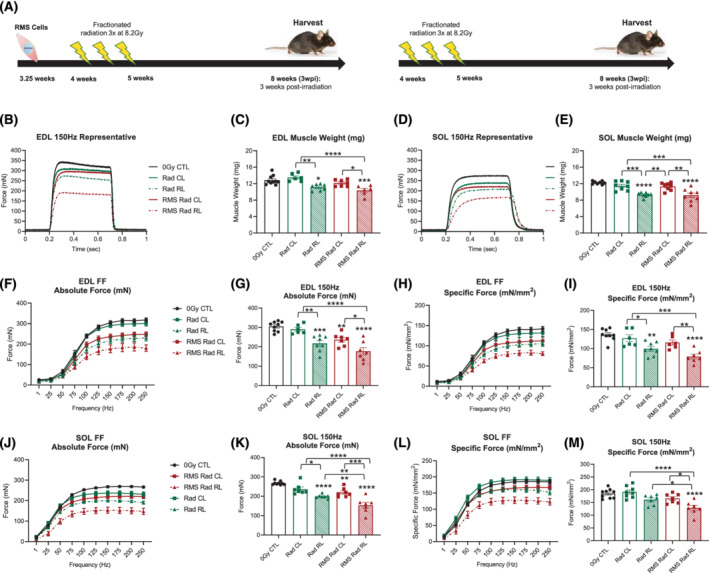
Decreased skeletal muscle physiological function after paediatric radiotherapy. (A) Schematic representing paediatric irradiation paradigm to eliminate rhabdomyosarcoma (RMS) tumour cells. Representative absolute force tetanic traces at 150 Hz frequency for the EDL (B) and SOL (D) muscles. Muscle mass deficits in the EDL (C) and SOL (E). (F–I) Absolute and specific force frequency curves and bar graphs for the EDL muscle. (J–M) Absolute and specific force frequency curves and bar graphs for the SOL muscle. One‐way ANOVA with Tukey's multiple comparisons test. * P < 0.05, ** P < 0.01, *** P < 0.001, and **** P < 0.0001 compared with 0Gy control (0Gy CTL), or as otherwise indicated by lines noting comparisons. Data reported as mean ± standard error of mean (SEM). N = 6–9 mice per experimental group. CL, contralateral limb; RL, irradiated limb.
The EDL and SOL muscles are composed of a heterogeneous distribution of myofibres with distinct myosin heavy chain (MyHC) isoforms and contractile kinetics. 27 The fast‐contracting EDL muscles contain a greater proportion of myofibres that express the fastest MyHC isoforms IIB and IIX, whereas myofibres in the slower‐contracting SOL muscle primarily express the slower IIA and I MyHC isoforms. 27 RMS Rad CL and RMS Rad RL EDL muscles expressed significantly greater proportions of type IIB (Figure S3A and S3C). These modest myofibre‐type shifts in the RMS tumour‐eliminated EDL muscles were not sufficient to elicit detectable changes in these muscles' contractile kinetics based upon time to peak force (Figure S1I), activation or contraction speed (Figure S1C), nor end‐to‐peak ratio (Figure S1J). The SOL muscles demonstrated no significant changes in myofibre‐type distributions across any experimental group (Figure S3B, S3E, and S3F). Thus, the modest shift in myofibre type does not sufficiently explain the physiological functional deficits within the EDL and SOL muscles after paediatric radiation and tumour elimination.
Paediatric radiotherapy blunts expansion of myofibre size, myonuclear number, and myonuclear domain
Skeletal muscle size and strength are predictably and positively correlated; therefore, smaller muscles tend to yield weaker forces especially in those experiencing sarcopenia. 8 Thus, we measured individual myofibre CSA, volume, myonuclear number, and MND after paediatric radiation and tumour elimination (Figures 2, S4, and S5). Comparing EDL myofibre CSA and volumes (Figures 2A–2C, S4A, and S4B), we observed significant deficits to myofibre size after paediatric radiotherapy, which were not exacerbated by tumour elimination (Figure S5A). Although SOL myofibre CSA and volume were also reduced with irradiation, in contrast to the EDL, RMS tumour elimination modestly exacerbated these losses (Figures 2G, 2H, S3F, S3G, and S5B).
Figure 2.
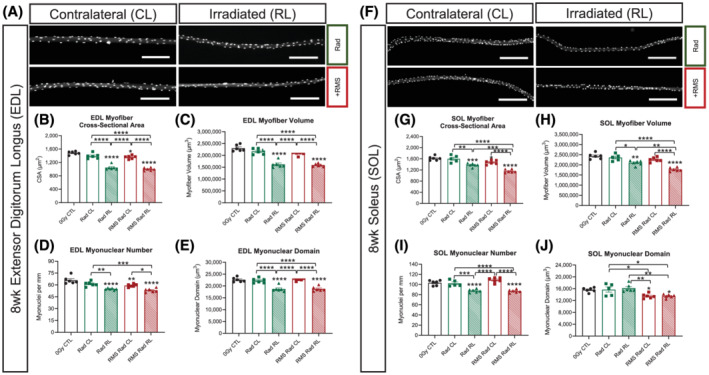
Paediatric radiotherapy blunts expansion of myofibre size, myonuclear number, and myonuclear domain. (A) Representative images of contralateral, irradiated, and RMS EDL single myofibres. Scale bar = 200 μm. (B) EDL myofibre average cross‐sectional area (CSA). (C) EDL myofibre volume (CSA × Length). (D) EDL myonuclei per mm of myofibre length. (E) EDL myonuclear domain [(CSA × Length)∕(Total MN)]. (F) Representative images of contralateral, irradiated, and RMS SOL single myofibres. Scale bar = 200 μm. (G) SOL myofibre average cross‐sectional area (CSA). (H) SOL myofibre volume (CSA × Length). (I) SOL myonuclei per mm of myofibre length. (J) SOL myonuclear domain [(CSA × Length)∕(Total MN)]. One‐way ANOVA with Tukey's multiple comparisons test. * P < 0.05, ** P < 0.01, *** P < 0.001, and **** P < 0.0001 compared with 0Gy CTL, or as otherwise indicated by lines noting comparisons. N = 6 mice per experimental group, and each data point represents an average of at least 50 myofibres per muscle. Data reported as mean ± standard error of mean (SEM).
Consistent with previous reports, paediatric radiotherapy led to a reduction in myonuclear number in the EDL and SOL with no further loss in the context of tumour elimination (Figure 2D and 2I). 5 , 22 We found significant perturbations to MND (ratio of sarcoplasm/myonucleus) after paediatric radiotherapy and tumour elimination dependent upon muscle type. In EDL muscles, paediatric radiotherapy caused a reduction in MND with no further deficit in the context of RMS tumour elimination (Figures 2E and S4D). In contrast, reduced MND was only observed in RMS Rad CL and RMS Rad RL SOL myofibres (Figures 2J and S4I). To highlight the relationship between absolute muscle strength and size, we performed simple linear regression analyses on the EDL (Figure 3A and 3B) and SOL (Figure 3C and 3D) myofibres. By plotting EDL and SOL muscles' absolute force generation capacities (Figure 1) with their myofibre sizes (Figure 2), we demonstrate a significant, linear, and muscle type‐specific effect of paediatric radiotherapy (Figure 3).
Figure 3.
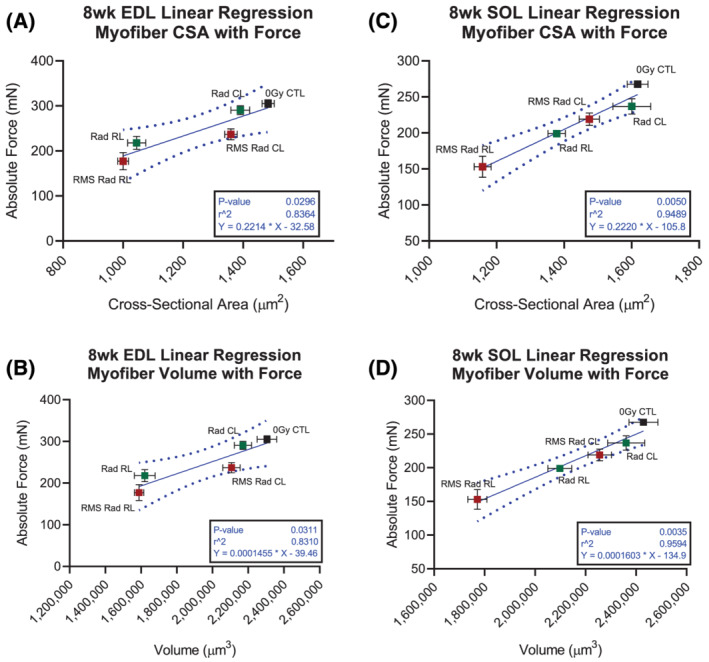
Absolute strength deficits after paediatric radiotherapy are significantly, negatively, and tightly correlated with myofibre size. Linear regression analyses displaying correlation between myofibre CSA and absolute force generation in the EDL (A) and SOL (C) muscles. Linear regression analyses displaying correlation between myofibre volume and absolute force generation in the EDL (B) and SOL (D) muscles. Each data point represents one experimental group. Each points' x‐coordinates are from n = 6 mice and obtained from 50 myofibres per EDL and SOL muscle. Each data points' y‐coordinates are from n = 6–9 mice and obtained from their corresponding absolute force generation physiology curves. Horizontal and vertical error bars are standard error margin (SEM). Dotted lines represent 95% confidence intervals of the linear regression models.
Finally, to determine if deficits in myofibre growth as a consequence of paediatric radiotherapy are associated with a loss in resident skeletal muscle stem cell (satellite cell) and mesenchymal/fibro‐adipogenic progenitor cell content, we performed FACS (Figure S6). Consistent with previous observations, we observed a loss of satellite cells after paediatric radiotherapy (Figure S6A and S6B). 3 , 4 , 5 In contrast, paediatric radiotherapy did not have a significant effect on mesenchymal/fibro‐adipogenic progenitor cell content (Figure S6C and S6D).
Up‐regulated inflammatory and fibrotic gene expression after paediatric radiotherapy
To evaluate transcriptomic changes in skeletal muscle across our experimental groups, we performed RNA‐sequencing analysis. We previously published the transcriptomic effects of paediatric radiation alone (GSE160064), 5 but now, we focused on comparisons with RMS tumour‐eliminated mice. First, comparing RMS Rad RL with 0Gy CTL, we identified 910 significantly (false discovery rate <0.05) differentially expressed genes (DEGs), where 140 DEGs were significant between RMS Rad RL and Rad RL gastrocnemius muscles (Figures 4A and S7 and Table S1). Broadly assessing inflammatory response signalling by Gene Ontology (GO: 0006954), we found 36 DEGs comparing Rad RL with 0Gy CTL, 83 DEGs comparing RMS Rad RL with 0Gy CTL, and 10 DEGs comparing RMS Rad RL with Rad RL (Figures 4B and S8A). Amongst the top up‐regulated inflammatory response genes was CCR2 (Ccr2) between Rad RL vs. 0Gy CTL (adjusted P‐value: 1.5 × 10⁻¹²) and RMS Rad RL vs. 0Gy CTL (adjusted P‐value: 2.82 × 10⁻¹²) (Figures 4B and S8B and Table S1). Consistent with this, RT‐qPCR analysis revealed Ccr2, and its associated chemokine ligands Ccl2, Ccl7, and Ccl8 were up‐regulated after paediatric radiotherapy (Figure 4B).
Figure 4.
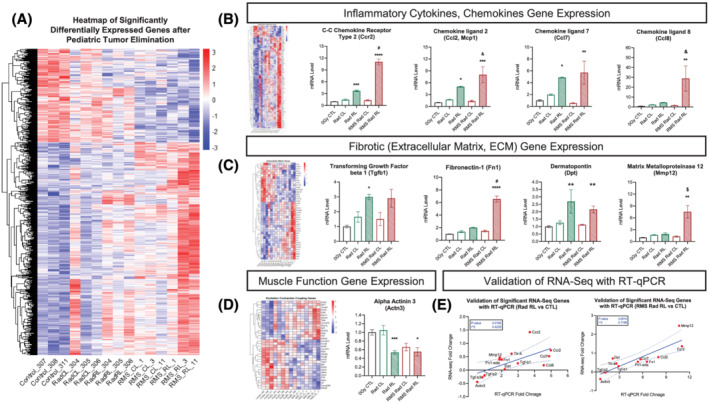
Transcriptomic analyses reveal up‐regulated inflammatory and fibrotic gene expression after paediatric radiotherapy. RNA‐sequencing heat map (A) displaying 910 significantly differentially expressed (DE) genes (false discovery rate, P‐adjusted <0.05) between 8‐week‐old, 0Gy CTL, Rad CL, Rad RL, RMS Rad CL, and RMS Rad RL. N = 3 animals per experimental group, where up‐regulated genes are shown in red and down‐regulated genes in blue. Heat maps of inflammatory response genes (GO: 0006954, B), extracellular matrix genes (GO: 0044420, C), and muscle contraction genes (GO: 0006936, 0006941, D). Simple linear regression correlation plots (E) significantly validating RNA sequencing with RT‐qPCR gene expression data. N = 3–5 mice per group. Two‐way ANOVA with Tukey's multiple comparisons test. * P < 0.05, ** P < 0.01, *** P < 0.001, and **** P < 0.0001 compared with CL of the same animal. & P < 0.05, $ P < 0.01, # P < 0.001, and % P < 0.0001 compared with Rad CL or RL. Data reported as mean ± standard error margin (SEM).
Subjecting these DEGs to Ingenuity Pathway Analysis (Figure S8A–S8C), we found significantly activated canonical upstream regulators of interferon‐γ (ifng, Z‐score: 7.355), interleukin‐1β (il‐1b, Z‐score: 4.399), interleukin‐6 (il‐6, Z‐score: 3.859), interleukin‐4 (il4, Z‐score: 3.827), and TGF‐β1 (tgfb1, Z‐score: 2.612). As a master regulator of fibrosis and identified in our significant upstream regulators, TGF‐β1's downstream ECM gene targets were investigated by Gene Ontology (GO: 0031012). We discovered 16 DEGs comparing Rad RL with 0Gy CTL, 42 DEGs comparing RMS Rad RL with 0Gy CTL, and 8 DEGs between RMS Rad RL and Rad RL related to ECM modifications with fibronectin‐1 (Fn1) as the top up‐regulated ECM gene (Figures 4C and S8B and Table S1). Assessment of Tgf‐b1 and Fn1 expression by RT‐qPCR revealed Tgf‐b1 up‐regulation to be driven by paediatric radiotherapy, and Fn1 up‐regulation was exacerbated by RMS tumour elimination (Figure 4C). Utilizing simple linear regression analyses, we significantly validated and correlated the gene expression fold change of each gene from its RNA sequencing (Figure 4E, y‐axis) with that from its RT‐qPCR (Figure 4E, x‐axis). To control for the effects of potential injury from the injection site, we performed mock injections (Matrigel only) prior to paediatric irradiation and then performed RT‐qPCR on Ccr2, Ccl2, Ccl7, Ccl8, Tgf‐b1, and Fn1 at 8 weeks of age. We found a negligible effect of the injection procedure on Ccr2, Ccl2, Ccl7, Ccl8, Tgf‐b1, and Fn1 expression (Figure S8D).
Skeletal muscle fibrosis after paediatric radiotherapy
A common side effect of radiotherapy is radiation‐induced fibrosis, which occurs as a late effect in ~70% of sarcoma patients. 7 In order to investigate this, we stained EDL and SOL muscles for fibronectin‐1 (FN1), laminin‐α2 (LAMA2), and collagen type 4 (COL‐4) proteins, which are ECM components of the myofibre endomysium. Focusing on FN1 deposition for the EDL and SOL muscles, we observed increased FN1 in response to paediatric radiation (Figure 5A and 5D). This increase occurred in both muscle types regardless of tumour elimination. Evaluating the basement membrane protein LAMA2, there were increases only in the RMS Rad RL EDL and SOL muscles (Figure 5B and 5E). Therefore, increased LAMA2 deposition occurred in both muscle types as a consequence of RMS tumour elimination. Examining the endomysial protein COL‐4, we found increases in the RMS Rad RL SOL muscles (Figure 5F). Additionally, there was a trending increase of COL‐4 in the RMS Rad RL EDL muscles (Figure 5C).
Figure 5.
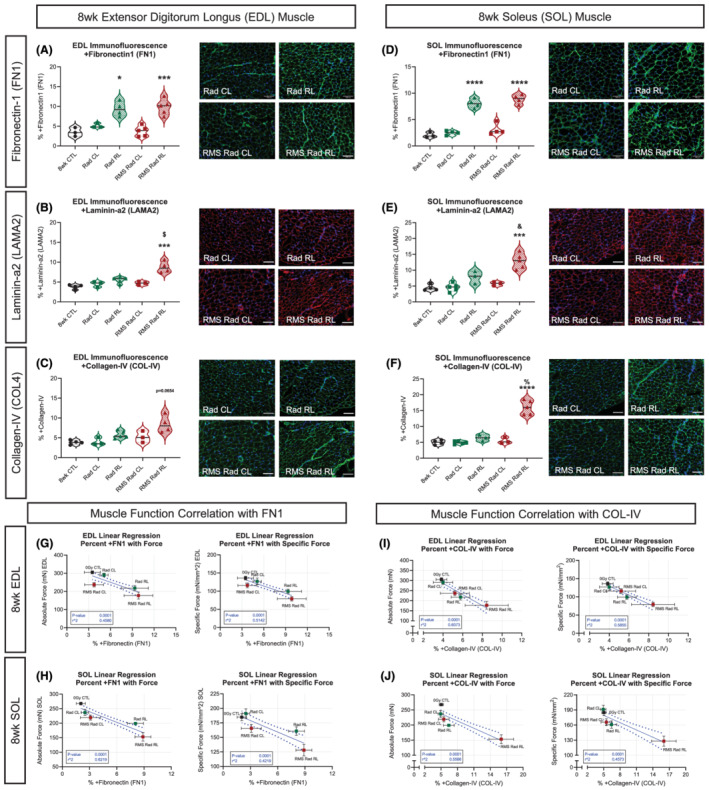
Skeletal muscle fibrosis after paediatric radiotherapy. Quantifications of representative immunofluorescent images of EDL (A–C) and SOL (D–F) muscles stained for fibronectin‐1 (FN1) (A, D), laminin‐α2 (LAMA2) (B, E), and collagen‐IV (COL‐IV) (C, F); N = 3–5 with n = 3–5 technical replicates, scale bar = 100 μm. Simple linear regression analyses for EDL (G, I) and SOL (H, J) muscle absolute and specific force generation in correlation with the extracellular matrix (ECM) proteins FN1 (G, H) and COL‐IV (I, J). Each data point represents one experimental group. Each data points' y‐coordinates are from n = 6–9 mice and obtained from their corresponding absolute and specific force generation physiology curves. Each points' x‐coordinates are from n = 3–5 mice and obtained from their corresponding % of FN1 and COL‐IV ECM proteins. Horizontal and vertical error bars are standard error of mean (SEM). Dotted lines represent 95% confidence intervals of the linear regression models. Two‐way ANOVA with Tukey's multiple comparisons test. * P < 0.05, ** P < 0.01, *** P < 0.001, and **** P < 0.0001 compared with CL of the same animal. & P < 0.05, $ P < 0.01, # P < 0.001, and % P < 0.0001 compared with Rad CL or RL. Data reported as mean ± standard error margin (SEM).
Perturbations to the organization between endomysium, perimysium, and epimysium can lead to compromised muscle function. As muscle ECM increases within the muscle, its ability to radially expand during active muscle shortening becomes compromised, therefore resulting in less mechanical work. 28 To highlight the relationship between muscle force generation capacity and ECM, we performed simple linear regression analyses between the EDL (Figure 5G and 5I) and SOL (Figure 5H and 5J) muscles with FN1 and COL‐4. We find that absolute and specific forces are negatively correlated with increased FN1 and COL‐4 (Figure 5G–5J).
Paediatric radiotherapy and tumour elimination result in lifelong decreases in myofibre size and myonuclear number
In order to investigate the long‐term effects of paediatric irradiation and RMS tumour elimination, we aged mice to 14mpi (Figure S9A). Aged EDL and SOL muscle masses were persistently reduced in the RMS Rad RL limbs compared with their contralateral limbs (Figure 6A and 6F). Comparing the aged RMS EDL and SOL myofibre CSAs and volumes, we found persistently reduced myofibre size at 14mpi (Figure 6B, 6C, 6G, and 6H). Enumerating myonuclear number (MN/mm) for the aged RMS EDL and SOL myofibres revealed lifelong reductions to both muscles at 14mpi (Figure 6D and 6I). Finally, we found significantly and persistently attenuated MND only in the aged EDL muscles within the RMS tumour‐eliminated limbs (Figure 6E and 6J).
Figure 6.
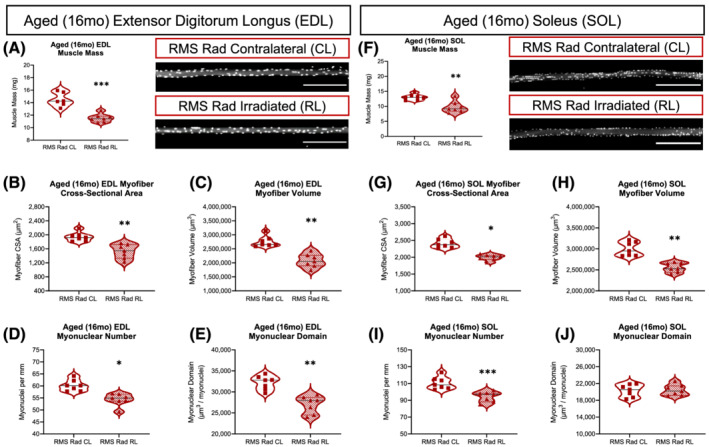
Paediatric radiotherapy and tumour elimination results in lifelong, age‐related decreases in muscle mass, myofibre size, and myonuclear number. Average muscle mass of the aged EDL (A) and SOL (F) muscles. Representative images of RMS Rad CL and RMS Rad RL from aged EDL and SOL muscles (scale bar = 300 μm). Average myofibre cross‐sectional area (CSA) of the aged EDL (B) and SOL (G) myofibres. Average myofibre volume (CSA × Length) of the aged EDL (C) and SOL (H) myofibres. Average number of myonuclei per mm (MN) of myofibre length of the aged EDL (D) and SOL (I) myofibres. Average myonuclear domain [(CSA × Length)∕(Total MN)] of the aged EDL (E) and SOL (J) myofibres. N = 7 mice per experimental group with each data point representing an average of at least 50 myofibres per muscle. Statistical analyses performed using two‐tailed t‐test with Welch's corrections.
Next, we statistically analysed the aged RMS myofibres with previously published Aged‐Rad myofibres. 5 We found that paediatric radiotherapy was the primary source of variation driving lifelong deficits to CSA, volume, and myonuclear number (Figure S9B and S9C). In contrast to EDL, paediatric RMS tumour elimination was a source of variation associated with lifelong deficits to MND in SOL myofibres (Figure S9B and S9C). Notably, RMS tumour‐eliminated mice had less body mass (Figure S10A) than irradiated‐alone mice as well as exacerbated paediatric radiotherapy‐induced deficits to tibialis anterior (TA) mass (Figure S10B).
Because similar group effects are observed at 3wpi as at 14mpi in terms of myofibre size (CSA and VOL) and muscle mass, we explored how multivariate linear regression analysis could predict absolute force generation capacity in the aged (16 months, 14mpi) EDL and SOL muscles. To do this, we fit and calibrated our multivariate linear regression equation (Figure S11A) based upon the 8‐week‐old (8wk) myofibre size (Figure 2), muscle mass (Figure 1), and absolute force (Figure 1) data. The independent variables of 8wk myofibre CSA (χ1), 8wk myofibre volume (VOL, χ2), and 8wk muscle mass (mg, χ3) were used to predict 8wk muscle absolute force (Υ). Regression model accuracy, robustness, and goodness of fit (r 2) is evidenced by plotting the measured 8wk absolute force values against the model predicted absolute force values for the EDL (Figure S11B) and SOL (Figure S11E). Inputting the aged myofibre CSAs (χ1), myofibre volumes (χ2), and muscle masses (χ3) from each respective experimental group into our multivariate model, we are able to predict absolute force for the aged EDL (Figure S11C) and SOL (Figure S11F) muscles. Based upon our predicted absolute force values for the aged EDL and SOL muscles, we anticipate that the functional deficits observed at 3wpi are likely to persist at 14mpi.
Loss of type 2B glycolytic myofibres after paediatric radiotherapy and tumour elimination
In conditions of muscle loss, such as in cancer cachexia, ageing, microgravity, and neuromuscular disorders, myofibre‐type shifts from fast to slow or slow to fast can occur. 29 To further determine the age‐related effects of paediatric radiation and RMS tumour elimination, we measured EDL and SOL myofibre‐type distributions, percentages, and numbers at 14mpi (Figure 7). In RMS tumour‐eliminated mice, aged RMS Rad CL EDL muscles expressed a greater proportion of the fast‐twitch myosin type IIB (Figure 7A and 7C) approaching 80% with significantly lower proportions of type 2A and 2X. Surprisingly, the aged RMS Rad RL EDL muscles demonstrated no difference in myofibre types compared with the paediatric irradiation‐alone groups, and a loss of type 2B myofibres relative to aged RMS Rad CL EDL muscles. This was accompanied by a significant reduction in myofibre number in aged RMS Rad RL EDL muscles (Figure 7D). The aged SOL muscles demonstrated no significant changes in myofibre‐type distributions nor myofibre number across any experimental group (Figure 7E and 7F). Overall, paediatric radiotherapy and tumour elimination led to an age‐related preferential loss of glycolytic type 2B myofibres in the fast‐contracting EDL muscles.
Figure 7.
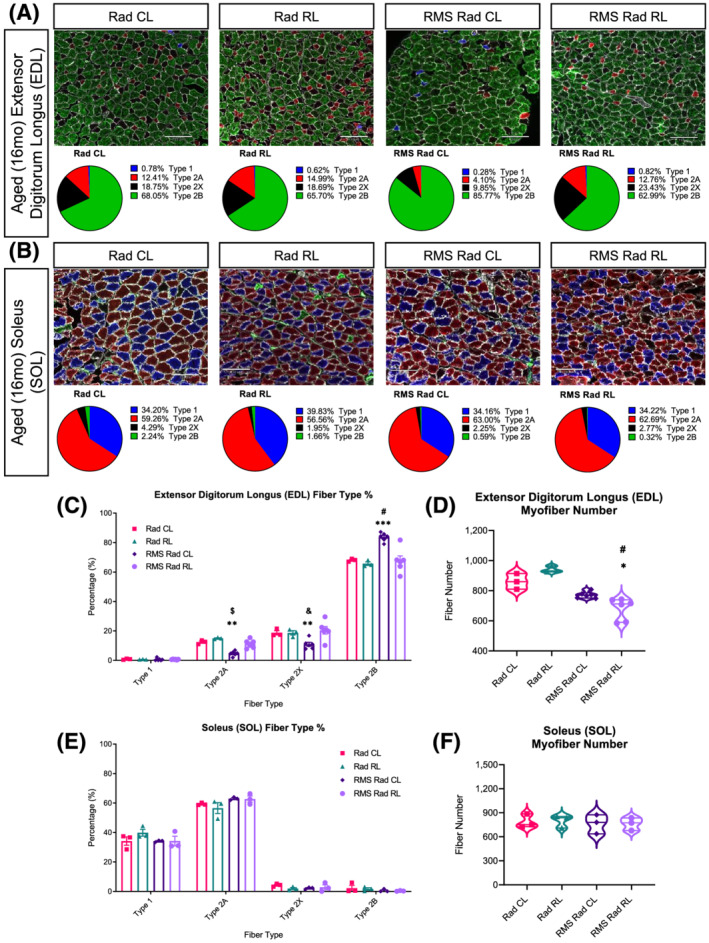
Loss of type 2B glycolytic myofibres in the aged EDL muscles after paediatric radiotherapy and tumour elimination. Representative images of myosin heavy chain (MyHC) isoform or myofibre type for the aged EDL (A, top row) and SOL (B, top row) muscle cross sections; scale bar = 130 μm. Pie charts of each myofibre‐type percentage for the aged EDL (A, bottom row) and SOL (B, bottom row) muscles. Quantifications of total myofibre number for the EDL (D) and SOL (F) muscles. Bar charts comparing fibre‐type percentages between Rad CL, Rad RL, RMS Rad CL, and RMS Rad RL for aged EDL (C) and SOL (E) muscles. Unstained myofibres, indicated as black, were considered MyHC‐2x. N = 3–6 mice for EDL and SOL with n = 3–5 technical replicates per mouse. Two‐way ANOVA with Tukey's multiple comparisons test. * P < 0.05, ** P < 0.01, *** P < 0.001, and **** P < 0.0001 compared with CL of the same mouse. & P < 0.05, $ P < 0.01, # P < 0.001, and % P < 0.0001 compared with Rad CL or RL. Data reported as mean ± standard error of mean (SEM).
Paediatric radiotherapy results in lifelong, persistent skeletal muscle fibrosis
Because myofibre atrophy, type adaptations, and accumulation of ECM proteins (fibrosis) are pathological characteristics of sarcopenia, we sought to investigate the age‐related effects of fibrosis in our model. Immunofluorescent staining revealed persistent FN1 deposition in the radiated‐alone and tumour‐eliminated EDL and SOL muscles at 14mpi (Figure 8A and 8D). Similar analysis revealed persistent increases in LAMA2 and COL‐4 only in response to paediatric RMS tumour irradiation (Figure 8B, 8C, 8E, and 8F). Expanding upon our observations, we histologically stained aged EDL and SOL muscles with Masson's trichrome to visualize collagen accumulation (blue) (Figure 8G). This demonstrated significant, persistent intramuscular, collagenous fibrotic tissue within paediatric radiated muscles at 14mpi (Figure 8H and 8I). Finally, we performed RT‐qPCR on our aged muscles revealing chronic, low‐level inflammatory chemokine and persistent fibrotic gene expression driven by paediatric radiotherapy (Figure 8J). In conclusion, we demonstrated that paediatric radiotherapy leads to chronic, lifelong expression and accumulation of radiation‐induced muscle fibrosis, which can worsen with age.
Figure 8.
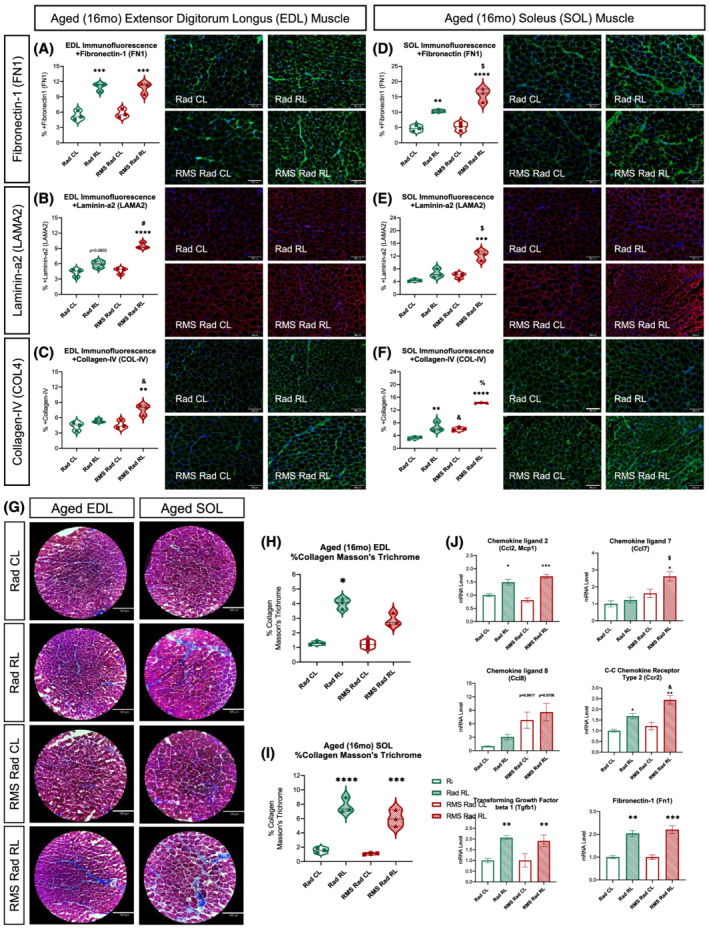
Paediatric radiotherapy results in lifelong, persistent skeletal muscle fibrosis. Quantifications from representative immunofluorescent images of aged [16 months (16mo)] EDL (A–C) and SOL (D–F) muscles stained with primary antibodies for fibronectin‐1 (A, D), laminin‐α2 (B, E), and collagen‐IV (C, F), respectively; N = 3 with n = 3–5 technical replicates, scale bar = 100 μm. Representative images of Masson's trichrome (G) histochemical stain; N = 3 with n = 3–5 technical replicates, scale bar = 180 μm. Quantifications of the per cent collagen (blue) per muscle area from the Masson's trichrome stains on the aged (16mo) EDL (H) and SOL (I) muscles. RT‐qPCRs (J) from aged (16mo) Rad CL, Rad RL, RMS Rad CL, and RMS Rad RL gastrocnemius muscles. N = 3 mice per group. Two‐way ANOVA with Tukey's multiple comparisons test. * P < 0.05, ** P < 0.01, *** P < 0.001, and **** P < 0.0001 compared with CL of the same animal. & P < 0.05, $ P < 0.01, # P < 0.001, and % P < 0.0001 compared with Rad CL or RL. Data reported as mean ± standard error of mean (SEM).
Discussion
The importance of the cellular mechanisms responsible for juvenile muscle growth cannot be understated; therefore, cytotoxic therapies such as radiotherapy can have prolonged detrimental consequences into and throughout adulthood. 3 , 4 , 5 , 22 Paediatric cancer survivors living into adulthood present with indications of skeletal muscle decline and musculoskeletal frailty, consistent with sarcopenia, which are typically observed in the elderly. For example, survivors of sarcomas such as RMS are at increased risk of chronic health conditions, early mortality, reduced strength, and poor exercise tolerance. 9 Therefore, our murine model provides the first insights into the late effects of paediatric radiotherapy in the context of tumour elimination and survivorship 3wpi and 14mpi after the last radiation dose.
Previously, we found that paediatric radiotherapy alone leads to lifelong deficits in myofibre growth associated with a loss of satellite cells. 5 Here, further characterization revealed that paediatric radiotherapy is sufficient to induce functional decline and persistent fibrosis; however, some of these phenotypes were exacerbated after RMS tumour elimination particularly in the slow‐contracting SOL muscle. Muscle fibre type‐specific differences in disease progression are observed in muscular dystrophies, cancer cachexia, microgravity, and ageing. 29 Potential mechanisms for the exacerbated effects observed in SOL muscles after paediatric radiotherapy and tumour elimination could be due to its higher mitochondrial content, denser capillarization and endothelial cells, greater satellite cell number, higher myonuclear content, and reliance on oxidative metabolism. 3 , 5 , 22 , 27 Ionizing radiation directly damages DNA and produces free radicals that can negatively affect cellular components including proteins, nucleic acids, and lipids, which could disproportionally affect the SOL muscle. 30 In the fast‐contracting EDL muscle, loss of type 2B myofibres was a feature of ageing after paediatric radiotherapy and tumour elimination. Although the mechanism for this loss is unclear, denervation atrophy is accompanied by loss of type 2B myofibres. 24 Thus, paediatric radiotherapy could lead to the disruption of type 2B neuromuscular junctions that coupled with deficiencies in satellite cells may contribute to the eventual reduction in type 2B myofibre content. 5 , 23 , 24
Radiation‐induced fibrosis is a complex cellular and molecular interplay between cytokines, chemokines, oxidative stress, and damage‐associated molecular patterns produced by irradiated cells and infiltrating leucocytes and lymphocytes, which lead to a perpetual cascade of pro‐inflammatory factors. 31 Some of these pro‐inflammatory factors enriched at the irradiation site are the CCR2 ligands such as CCL2. A feature of radiation‐induced fibrosis is an association with abnormal CCR2+ monocyte activity connected to elevated TGF‐β1 expression. 12 , 32 , 33 , 34 Indeed, persistent and elevated expression of CCL2 is observed in the weeks following radiation in mice. 5 , 12 , 35 Furthermore, inhibition of CCL2–CCR2 signalling can protect from radiation‐induced vascular dysfunction, endothelial cell loss, tumour metastasis, and TGF‐β1‐mediated fibrosis through regulation of CCR2+ monocyte recruitment and activity. 34 , 36 , 37 Notably, we observed persistent up‐regulation of Tgf‐b1 expression in skeletal muscles 3 weeks and 14 months after paediatric radiotherapy that was associated with fibrosis and elevated Ccl2 expression. TGF‐β1 promotes fibro‐adipogenic progenitor proliferation, fibroblast proliferation, and myofibroblast differentiation from multiple sources. 18 , 31 Furthermore, TGF‐β1 can function as an inhibitor of myogenic differentiation and skeletal muscle regeneration. 38 Curiously, we found that paediatric radiotherapy is associated with a reduction in satellite cells, however, with no change in mesenchymal/fibro‐adipogenic progenitor content. One limitation is that our FACS strategy does not account for mesenchymal/fibro‐adipogenic progenitor heterogeneity and fate transitions. 39 Thus, it will be of interest to determine the relationship between CCL2–CCR2 and TGF‐β1 signalling in the regulation of cellular interactions leading to fibrosis, and the inhibition of skeletal muscle growth and/or regeneration after paediatric radiotherapy. 3 , 5 , 25 , 38
In conclusion, our novel mouse model of paediatric radiotherapy‐induced sarcopenia provides a powerful tool to study late effects of cancer treatments in a growing population of paediatric cancer survivors of increasingly frail musculoskeletal health. We have previously examined the near‐term consequences of paediatric radiotherapy with the chemotherapeutic vincristine in our model of RMS tumour elimination. 4 The combination of paediatric radiotherapy and vincristine with tumour elimination exacerbated some deficits in myofibre growth in a muscle type‐specific manner; however, the long‐term consequences, fibrosis, inflammation, and whether observed phenotypes are primarily treatment related were not examined. 4 Although normal tissue damage may be inevitable after paediatric cancer treatments, therapeutic interventions such as stimulation of remaining satellite cell function, opportune anti‐inflammatory and/or anti‐fibrotic strategies offer hope to improve muscular function and mitigate musculoskeletal frailty. In the future, our preclinical mouse model of paediatric radiotherapy with other cancer treatments will allow us to investigate the cellular and molecular culprits responsible for musculoskeletal deficiencies consistent with accelerated sarcopenia with the goal to improve the quality of life for paediatric cancer survivors.
Ethics statement
The authors of this manuscript certify that they comply with the ethical guidelines for authorship and publishing in the Journal of Cachexia, Sarcopenia and Muscle. 40
Conflict of interest
None declared.
Funding
This work was supported by University of Rochester Wilmot Cancer Institute pilot funding (J.P.W. and J.V.C.), Wilmot Cancer Institute predoctoral fellowship grant (J.G.K.), and the National Institutes of Health (N.I.H) Grants R01AG051456 and R01CA220467 (J.V.C.). NIH Shared and High‐End Instrumentation Award 1S10OD021548‐01 (J.P.W.).
Supporting information
Figure S1: Skeletal muscle contractile kinetics.
Physiologic cross‐sectional area (P‐CSA) for the EDL (A) and SOL (E) muscles. From the 150 Hz tetanic absolute force curves, impulse (mN*sec) was calculated as the integral of isometric force over time for the EDL (B) and SOL (F) muscles. Activation rate (+mN/sec) was calculated as the most linear region of the contraction curve before maximum force for the EDL (C) and SOL (G) muscles. Relaxation rate (‐mN/sec) was calculated as the most negative linear region after cessation of the electrical stimulus for the EDL (D) and SOL (H) muscles. Additionally, time to peak force (I, K) and the ratio of peak force to end force (J, L) were calculated for the EDL and SOL muscles, respectively. Two‐way ANOVA with Tukey's multiple comparisons test. *P < 0.05, **P < 0.01, ***P < 0.001, ****P < 0.0001 compared to contralateral (CL) muscle of the same mouse. &P < 0.05, $P < 0.01, #P < 0.001, %P < 0.0001 compared to Rad CL or RL. Data reported as mean +/− standard error margin. N = 6–9 mice per experimental group. P‐CSA calculated as (muscle weight [mg]) / (1.056*(0.44 or 0.70)*length[mm]), where 1.056 = muscle density [g/cm^3], 0.44 = EDL angular factor, 0.71 = SOL angular factor.
Figure S2: Detailed statistical analyses of skeletal muscle functional outcomes.
Extensor digitorum longus (EDL, A) and soleus (SOL, B) skeletal muscle mass, absolute force, and specific force from each experimental group with detailed statistics from their two‐way ANOVA with Tukey's multiple comparisons tests. 8‐week‐old extensor digitorum longus (EDL, C) and soleus (SOL, D) skeletal muscle contractile kinetics (impulse, activation rate, and relaxation rate) from each experimental group with detailed statistics from their two‐way ANOVA with Tukey's multiple comparisons tests. NS = not significant.
Figure S3: Myofiber types after pediatric radiotherapy.
Representative images of myosin heavy chain (MyHC) isoform or myofiber type for EDL (A, top row) and SOL (B, top row) muscle cross‐sections. Pie charts of each myofiber type percentage were quantified in ImageJ for EDL (A, bottom row) and SOL (B, bottom row) muscles. Scale bar = 100 μm. N = 4–5 mice for EDL and SOL with n = 3–5 technical replicates per mouse. Bar charts comparing fiber type percentages between controls, contralateral to the irradiated limb (Rad CL), the irradiated limb (Rad RL), contralateral to the RMS limb (RMS Rad CL), and the irradiated RMS limb (RMS Rad RL) for the EDL (C) and SOL (E) muscles. Unstained myofibers, indicated as black, were considered MyHC 2X. Bar charts comparing overall myofiber number for the EDL (D) and SOL (F). Two‐way ANOVA with Tukey's multiple comparisons test. *P < 0.05, **P < 0.01, ***P < 0.001, ****P < 0.0001 compared to contralateral (CL) of the same mouse. &P < 0.05, $P < 0.01, #P < 0.001, %P < 0.0001 compared to Rad CL or RL. Data reported as mean +/− standard error margin (SEM).
Figure S4: Frequency distributions for myofiber size, volume, myonuclear number, and myonuclear domain.
Frequency distribution plots for the EDL and SOL, respectively, assessing myofiber cross‐sectional areas (CSA) (A, F), myofiber volumes (CSAxLength) (B, G), myonuclei per mm of myofiber length (C, H), myonuclear domains ((CSAxLength)/ (Total MN)) (D, I), and myofiber lengths measured (E, J). Two‐way ANOVA with Tukey's multiple comparisons test. *P < 0.05, **P < 0.01, ***P < 0.001, ****P < 0.0001 compared to CL. &P < 0.05, $P < 0.01, #P < 0.001, %P < 0.0001 compared to RMS CL or RMS RL. N = 6 mice per experimental group and each data point represents an average of at least 50 myofibers per muscle.
Figure S5: Detailed statistical analyses of 8‐week‐old myofiber characteristics.
Extensor digitorum longus (EDL) myofibers (A) from each experimental group with detailed statistics from their two‐way ANOVA with Tukey's multiple comparisons tests. Soleus (SOL) myofibers (B) from each experimental group with detailed statistics from their two‐way ANOVA with Tukey's multiple comparisons tests. N = 6 mice per experimental group and each data point represents an average of at least 50 myofibers per muscle.
Figure S6: FACS analysis of satellite cells and mesenchymal progenitor/fibro‐adipogenic progenitor cells.
Representative FACS histograms of % live (A) satellite cells (CD45‐, CD31‐, Sca1‐, β1Int+, VCAM+, CXCR4+), and (C) mesenchymal progenitor/fibro‐adipogenic progenitor cells (CD45‐, CD31‐, Sca1+). Quantifications of (B) satellite cells, and (D) mesenchymal progenitor/fibro‐adipogenic progenitor cell content (n = 4–5 mice per condition). Two‐way ANOVA with Tukey's multiple comparisons test. *P < 0.05, **P < 0.01, ***P < 0.001, ****P < 0.0001 compared to CL of the same animal. Data reported as mean +/− standard error of mean (SEM). (E) Gating strategy; the cell suspension was gated for DAPI (live/dead) and discriminated for doublets prior to gating analysis of satellite cells (SCs; CD45‐, CD31‐, Sca‐1‐, Int‐β1+, VCAM+, CXCR4+), activated, and mesenchymal progenitor/fibro‐adipogenic progenitors (FAPs; CD45‐, CD31‐, Sca‐1+).
Figure S7: Volcano plots from RNA‐sequencing data.
Principal component analysis (PCA) of normalized counts (A) shown in two dimensions (2D) between 8‐week‐old, non‐irradiated, 0Gy CTL, Rad CL, Rad RL, RMS Rad CL, and the RMS Rad RL. PCA reveals clustering of the samples by contralateral, irradiation, and irradiation elimination of an RMS tumor. Volcano plots (B‐I) demonstrating the magnitude of fold change between experimental groups of significantly, differentially expressed genes (DEGs). Significance of differentially expressed (DE) genes determined by false discovery rate (FDR), p‐adjusted < 0.05. Green dots represent significantly downregulated genes, while red dots represent significantly upregulated genes as indicated by the x‐axis of Log2 fold‐change. Black dots represent genes that are not significant (FDR, p‐value > 0.05).
Figure S8: Predicted activated upstream regulators from Ingenuity Pathway Analysis (IPA) and control for RMS injection procedure.
Venn diagram (A) comparing the gene overlap of the top 5 most activated cytokines from the RNA‐sequencing analyses, where shared genes (B) are listed to the right. Predicted, activated, upstream regulators were calculated in Ingenuity Pathway Analysis (IPA) software (C) using the significant DEGs from the RNA‐sequencing analyses. To assess the effects of the RMS injection procedure on gastrocnemius (GAST) muscles (D), 20‐30 μL of only Matrigel was injected into the right GAST, then irradiated 6 days later. Control mice received no injection and only irradiation to the right limb, all mice were harvested at 8 weeks of age. Relative mRNA expression levels were measured by RT‐qPCR on GAST muscles from Rad CL, Rad RL ‐ inject, Rad CL, Rad RL + inject. N = 3 mice per group. Two‐way ANOVA with Tukey's multiple comparisons test. *P < 0.05, **P < 0.01, ***P < 0.001, ****P < 0.0001 compared to CL of the same mouse. &P < 0.05, $P < 0.01, #P < 0.001, %P < 0.0001 compared to Rad RL ‐ inject. Data reported as mean +/− standard error of mean (SEM).
Figure S9: Detailed statistical analyses of aged (16mo) myofibers.
(A) Schematic representing the aging paradigm after pediatric irradiation to eliminate implanted RMS tumors. Male mice were irradiated at 4 weeks of age with and without RMS tumor cell implantation then aged to 16 months old. (B) Aged 16‐months‐old EDL myofibers from each experimental group with detailed statistics from their two‐way ANOVA with Tukey's multiple comparisons tests. (C) Aged 16‐months‐old SOL myofibers from each experimental group with detailed statistics from their two‐way ANOVA with Tukey's multiple comparisons tests. Aged radiation alone myofibers derived and statistically analyzed from Bachman et al. 2020 [5]. N = 5–7 mice per experimental group and each data point represents an average of at least 50 myofibers per muscle.
Figure S10: Pediatric radiotherapy results in lifelong, age‐related decreases in TA muscle mass and body mass.
Violin plots representing the body masses (A) of mice that received irradiation at 4 weeks of age, with and without RMS tumor elimination, then aged to 16 months old. Statistics performed as two‐tailed t‐test with Welch's corrections. Violin plots representing the tibialis anterior (TA) muscle masses (B) with N = 6–7 mice per experimental group. Two‐way ANOVA with Tukey's multiple comparisons test. *P < 0.05, **P < 0.01, ***P < 0.001, ****P < 0.0001 compared to CL of same mouse. &P < 0.05, $P < 0.01, #P < 0.001, %P < 0.0001 compared to Rad CL or RL. Aged radiation alone body mass and muscle mass (green) derived and statistically analyzed from Bachman et al. 2020 [5].
Figure S11: Multivariate linear regression model to predict age‐related effects of pediatric radiotherapy and tumor elimination on EDL and SOL muscle strength.
From the 8‐week‐old EDL and SOL data, a multivariate linear regression model based upon the independent x‐variables of 8wk myofiber cross‐sectional area (CSA; χ1), 8wk myofiber volume (χ2), and 8wk muscle mass (χ3) was derived (G) to predict the y‐variable of absolute muscle force (mN). The multivariate linear regression model was calibrated by plotting the measured 8wk absolute force values (Figure 1) against the model predicted absolute force values for the EDL (A) and SOL (D). Blue dotted lines represent 95% confidence intervals of the linear regression models. After inputting the aged (16mo, 14mpi) myofiber cross‐sectional areas (CSA; χ1), 16mo myofiber volumes (χ2), and 16mo muscle masses (χ3) from each respective experimental group, the regression equation predicted absolute force (mN) values for the aged 16‐month‐old EDL (B) and SOL (E) muscles. Two‐way ANOVA with Tukey's multiple comparisons test was conducted on the predicted absolute force values from the aged EDL (C) and SOL (F) muscles. *P < 0.05, **P < 0.01, ***P < 0.001, ****P < 0.0001 compared to CL of same mouse. &P < 0.05, $P < 0.01, #P < 0.001, %P < 0.0001 compared to Rad CL or RL.
Table S1: List of significantly differentially expressed genes (DEG) between each experimental group related to Figure 4.
RNA‐sequencing data listing significantly differentially expressed (DE) genes (false discovery rate FDR, p‐adjusted < 0.05) between 8 week old, non‐irradiated, 0Gy controls (CTL), contralateral to the irradiated limb (Rad CL), the irradiated limb (Rad RL), contralateral to the RMS limb (RMS Rad CL), and the irradiated RMS limb (RMS Rad RL).
Table S2: Primer list for RT‐qPCR related to Figures 4 and 8.
List of forward and reverse primers for each murine gene assessed by RT‐qPCR including NCBI accession number.
Kallenbach J. G., Bachman J. F., Paris N. D., Blanc R. S., O'Connor T., Furati E., Williams J. P., and Chakkalakal J. V. (2022) Muscle‐specific functional deficits and lifelong fibrosis in response to paediatric radiotherapy and tumour elimination, Journal of Cachexia, Sarcopenia and Muscle, 13, 296–310, 10.1002/jcsm.12902
References
- 1. Robison LL, Hudson MM. Survivors of childhood and adolescent cancer: life‐long risks and responsibilities. Nat Rev Cancer 2014;14:61–70. [DOI] [PMC free article] [PubMed] [Google Scholar]
- 2. Baskar R, Lee KA, Yeo R, Yeoh KW. Cancer and radiation therapy: current advances and future directions. Int J Med Sci 2012;9:193–199. [DOI] [PMC free article] [PubMed] [Google Scholar]
- 3. Bachman JF, Chakkalakal JV. Insights into muscle stem cell dynamics during postnatal development. FEBS J 2021. 10.1111/febs.15856 [DOI] [PMC free article] [PubMed] [Google Scholar]
- 4. Paris ND, Kallenbach JG, Bachman JF, Blanc RS, Johnston CJ, Hernady E, et al. Chemoradiation impairs myofiber hypertrophic growth in a pediatric tumor model. Sci Rep 2020;10:19501. [DOI] [PMC free article] [PubMed] [Google Scholar]
- 5. Bachman JF, Blanc RS, Paris ND, Kallenbach JG, Johnston CJ, Hernady E, et al. Radiation‐induced damage to prepubertal Pax7+ skeletal muscle stem cells drives lifelong deficits in myofiber size and nuclear number. iScience 2020;23. 10.1016/j.isci.2020.101760 [DOI] [PMC free article] [PubMed] [Google Scholar]
- 6. Paulino AC, Constine LS, Rubin P, Williams JP. Normal tissue development, homeostasis, senescence, and the sensitivity to radiation injury across the age spectrum. Semin Radiat Oncol 2010;20:12–20. [DOI] [PubMed] [Google Scholar]
- 7. Paulino AC. Late effects of radiotherapy for pediatric extremity sarcomas. Int J Radiat Oncol Biol Phys 2004;60:265–274. [DOI] [PubMed] [Google Scholar]
- 8. Janssen I, Heymsfield SB, Ross R. Low relative skeletal muscle mass (sarcopenia) in older persons is associated with functional impairment and physical disability. J Am Geriatr Soc 2002;50:889–896. [DOI] [PubMed] [Google Scholar]
- 9. Ness KK, Howell CR, Bjornard KL. Frailty and quality of life in adult survivors of childhood cancer. Expert Rev Qual Life Cancer Care 2017;2:79–85. [DOI] [PMC free article] [PubMed] [Google Scholar]
- 10. Rayar M, Webber CE, Nayiager T, Sala A, Barr RD. Sarcopenia in children with acute lymphoblastic leukemia. J Pediatr Hematol Oncol 2013;35:98–102. [DOI] [PubMed] [Google Scholar]
- 11. Armstrong GT, Stovall M, Robison LL. Long‐term effects of radiation exposure among adult survivors of childhood cancer: results from the childhood cancer survivor study. Radiat Res 2010;174:840–850. [DOI] [PMC free article] [PubMed] [Google Scholar]
- 12. Groves AM, Johnston CJ, Williams JP, Finkelstein JN. Role of infiltrating monocytes in the development of radiation‐induced pulmonary fibrosis. Radiat Res 2018;189:300–311. [DOI] [PMC free article] [PubMed] [Google Scholar]
- 13. Beach TA, Johnston CJ, Groves AM, Williams JP, Finkelstein JN. Radiation induced pulmonary fibrosis as a model of progressive fibrosis: contributions of DNA damage, inflammatory response and cellular senescence genes. Exp Lung Res 2017;43:134–149. [DOI] [PMC free article] [PubMed] [Google Scholar]
- 14. Wang S, Hyun J, Youn B, Jung Y. Hedgehog signaling regulates the repair response in mouse liver damaged by irradiation. Radiat Res 2013;179:69–75. [DOI] [PubMed] [Google Scholar]
- 15. Unthank JL, Ortiz M, Trivedi H, Pelus LM, Sampson CH, Sellamuthu R, et al. Cardiac and renal delayed effects of acute radiation exposure: organ differences in vasculopathy, inflammation, senescence and oxidative balance. Radiat Res 2019;191:383–397. [DOI] [PMC free article] [PubMed] [Google Scholar]
- 16. Braga TT, Correa‐Costa M, Silva RC, Cruz MC, Hiyane MI, da Silva JS, et al. CCR2 contributes to the recruitment of monocytes and leads to kidney inflammation and fibrosis development. Inflammopharmacology 2018;26:403–411. [DOI] [PubMed] [Google Scholar]
- 17. Park SH, Kim JY, Kim JM, Yoo BR, Han SY, Jung YJ, et al. PM014 attenuates radiation‐induced pulmonary fibrosis via regulating NF‐kB and TGF‐b1/NOX4 pathways. Sci Rep 2020;10:16112. [DOI] [PMC free article] [PubMed] [Google Scholar]
- 18. Contreras O, Cruz‐Soca M, Theret M, Soliman H, Tung LW, Groppa E, et al. Cross‐talk between TGF‐beta and PDGFR alpha signaling pathways regulates the fate of stromal fibro‐adipogenic progenitors. J Cell Sci 2019;132. 10.1242/jcs.232157 [DOI] [PubMed] [Google Scholar]
- 19. Brody SL, Gunsten SP, Luehmann HP, Sultan DH, Hoelscher M, Heo GS, et al. Chemokine receptor 2‐targeted molecular imaging in pulmonary fibrosis. Am J Respir Crit Care Med 2020;203:78–89. [DOI] [PMC free article] [PubMed] [Google Scholar]
- 20. Csapo R, Gumpenberger M, Wessner B. Skeletal muscle extracellular matrix—what do we know about its composition, regulation, and physiological roles? A narrative review. Front Physiol 2020;11:253. [DOI] [PMC free article] [PubMed] [Google Scholar]
- 21. Meadors JL, Cui Y, Chen QR, Song YK, Khan J, Merlino G, et al. Murine rhabdomyosarcoma is immunogenic and responsive to T‐cell‐based immunotherapy. Pediatr Blood Cancer 2011;57:921–929. [DOI] [PMC free article] [PubMed] [Google Scholar]
- 22. Bachman JF, Klose A, Liu W, Paris ND, Blanc RS, Schmalz M, et al. Prepubertal skeletal muscle growth requires Pax7‐expressing satellite cell‐derived myonuclear contribution. Development 2018;145. 10.1242/dev.167197 [DOI] [PMC free article] [PubMed] [Google Scholar]
- 23. Liu W, Klose A, Forman S, Paris ND, Wei‐LaPierre L, Cortes‐Lopez M, et al. Loss of adult skeletal muscle stem cells drives age‐related neuromuscular junction degeneration. elife 2017;6. 10.7554/eLife.26464 [DOI] [PMC free article] [PubMed] [Google Scholar]
- 24. Liu W, Wei‐LaPierre L, Klose A, Dirksen RT, Chakkalakal JV. Inducible depletion of adult skeletal muscle stem cells impairs the regeneration of neuromuscular junctions. elife 2015;4. 10.7554/eLife.09221 [DOI] [PMC free article] [PubMed] [Google Scholar]
- 25. Blanc RS, Kallenbach JG, Bachman JF, Mitchell A, Paris ND, Chakkalakal JV. Inhibition of inflammatory CCR2 signaling promotes aged muscle regeneration and strength recovery after injury. Nat Commun 2020;11:4167. [DOI] [PMC free article] [PubMed] [Google Scholar]
- 26. Bustin SA, Benes V, Garson JA, Hellemans J, Huggett J, Kubista M, et al. The MIQE guidelines: minimum information for publication of quantitative real‐time PCR experiments. Clin Chem 2009;55:611–622. [DOI] [PubMed] [Google Scholar]
- 27. Schiaffino S, Reggiani C. Fiber types in mammalian skeletal muscles. Physiol Rev 2011;91:1447–1531. [DOI] [PubMed] [Google Scholar]
- 28. Azizi E, Deslauriers AR, Holt NC, Eaton CE. Resistance to radial expansion limits muscle strain and work. Biomech Model Mechanobiol 2017;16:1633–1643. [DOI] [PMC free article] [PubMed] [Google Scholar]
- 29. Ciciliot S, Rossi AC, Dyar KA, Blaauw B, Schiaffino S. Muscle type and fiber type specificity in muscle wasting. Int J Biochem Cell Biol 2013;45:2191–2199. [DOI] [PubMed] [Google Scholar]
- 30. Zhao W, Robbins ME. Inflammation and chronic oxidative stress in radiation‐induced late normal tissue injury: therapeutic implications. Curr Med Chem 2009;16:130–143. [DOI] [PubMed] [Google Scholar]
- 31. Ejaz A, Greenberger JS, Rubin PJ. Understanding the mechanism of radiation induced fibrosis and therapy options. Pharmacol Ther 2019;204:107399. 10.1016/j.pharmthera.2019.107399 [DOI] [PubMed] [Google Scholar]
- 32. Anscher MS. Targeting the TGF‐β1 pathway to prevent normal tissue injury after cancer therapy. Oncologist 2010;15:350–359. [DOI] [PMC free article] [PubMed] [Google Scholar]
- 33. Williams JP, Calvi L, Chakkalakal JV, Finkelstein JN, O'Banion MK, Puzas E. Addressing the symptoms or fixing the problem? Developing countermeasures against normal tissue radiation injury. Radiat Res 2016;186:1–16. [DOI] [PMC free article] [PubMed] [Google Scholar]
- 34. Wiesemann A, Ketteler J, Slama A, Wirsdörfer F, Hager T, Röck K, et al. Inhibition of radiation‐induced Ccl2 signaling protects lungs from vascular dysfunction and endothelial cell loss. Antioxid Redox Signal 2018;30:213–231. [DOI] [PubMed] [Google Scholar]
- 35. Johnston CJ, Williams JP, Okunieff P, Finkelstein JN. Radiation‐induced pulmonary fibrosis: examination of chemokine and chemokine receptor families. Radiat Res 2002;157:256–265. [DOI] [PubMed] [Google Scholar]
- 36. Moravan MJ, Olschowka JA, Williams JP, O'Banion MK. Brain radiation injury leads to a dose‐ and time‐dependent recruitment of peripheral myeloid cells that depends on CCR2 signaling. J Neuroinflammation 2016;13:30. [DOI] [PMC free article] [PubMed] [Google Scholar]
- 37. Mondini M, Loyher PL, Hamon P, Gerbe de Thore M, Laviron M, Berthelot K, et al. CCR2‐dependent recruitment of Tregs and monocytes following radiotherapy is associated with TNFα‐mediated resistance. Cancer Immunol Res 2019;7:376–387. [DOI] [PubMed] [Google Scholar]
- 38. Girardi F, Taleb A, Ebrahimi M, Datye A, Gamage DG, Peccate C, et al. TGFβ signaling curbs cell fusion and muscle regeneration. Nat Commun 2021;12:750. [DOI] [PMC free article] [PubMed] [Google Scholar]
- 39. Scott RW, Arostegui M, Schweitzer R, Rossi FMV, Underhill TM. Hic1 defines quiescent mesenchymal progenitor subpopulations with distinct functions and fates in skeletal muscle regeneration. Cell Stem Cell 2019;25:797–813.e9. [DOI] [PMC free article] [PubMed] [Google Scholar]
- 40. von Haehling S, Morley JE, Coats AJS, Anker SD. Ethical guidelines for publishing in the Journal of Cachexia, Sarcopenia and Muscle: update 2019. J Cachexia Sarcopenia Muscle 2019;10:1143–1145. [DOI] [PMC free article] [PubMed] [Google Scholar]
Associated Data
This section collects any data citations, data availability statements, or supplementary materials included in this article.
Supplementary Materials
Figure S1: Skeletal muscle contractile kinetics.
Physiologic cross‐sectional area (P‐CSA) for the EDL (A) and SOL (E) muscles. From the 150 Hz tetanic absolute force curves, impulse (mN*sec) was calculated as the integral of isometric force over time for the EDL (B) and SOL (F) muscles. Activation rate (+mN/sec) was calculated as the most linear region of the contraction curve before maximum force for the EDL (C) and SOL (G) muscles. Relaxation rate (‐mN/sec) was calculated as the most negative linear region after cessation of the electrical stimulus for the EDL (D) and SOL (H) muscles. Additionally, time to peak force (I, K) and the ratio of peak force to end force (J, L) were calculated for the EDL and SOL muscles, respectively. Two‐way ANOVA with Tukey's multiple comparisons test. *P < 0.05, **P < 0.01, ***P < 0.001, ****P < 0.0001 compared to contralateral (CL) muscle of the same mouse. &P < 0.05, $P < 0.01, #P < 0.001, %P < 0.0001 compared to Rad CL or RL. Data reported as mean +/− standard error margin. N = 6–9 mice per experimental group. P‐CSA calculated as (muscle weight [mg]) / (1.056*(0.44 or 0.70)*length[mm]), where 1.056 = muscle density [g/cm^3], 0.44 = EDL angular factor, 0.71 = SOL angular factor.
Figure S2: Detailed statistical analyses of skeletal muscle functional outcomes.
Extensor digitorum longus (EDL, A) and soleus (SOL, B) skeletal muscle mass, absolute force, and specific force from each experimental group with detailed statistics from their two‐way ANOVA with Tukey's multiple comparisons tests. 8‐week‐old extensor digitorum longus (EDL, C) and soleus (SOL, D) skeletal muscle contractile kinetics (impulse, activation rate, and relaxation rate) from each experimental group with detailed statistics from their two‐way ANOVA with Tukey's multiple comparisons tests. NS = not significant.
Figure S3: Myofiber types after pediatric radiotherapy.
Representative images of myosin heavy chain (MyHC) isoform or myofiber type for EDL (A, top row) and SOL (B, top row) muscle cross‐sections. Pie charts of each myofiber type percentage were quantified in ImageJ for EDL (A, bottom row) and SOL (B, bottom row) muscles. Scale bar = 100 μm. N = 4–5 mice for EDL and SOL with n = 3–5 technical replicates per mouse. Bar charts comparing fiber type percentages between controls, contralateral to the irradiated limb (Rad CL), the irradiated limb (Rad RL), contralateral to the RMS limb (RMS Rad CL), and the irradiated RMS limb (RMS Rad RL) for the EDL (C) and SOL (E) muscles. Unstained myofibers, indicated as black, were considered MyHC 2X. Bar charts comparing overall myofiber number for the EDL (D) and SOL (F). Two‐way ANOVA with Tukey's multiple comparisons test. *P < 0.05, **P < 0.01, ***P < 0.001, ****P < 0.0001 compared to contralateral (CL) of the same mouse. &P < 0.05, $P < 0.01, #P < 0.001, %P < 0.0001 compared to Rad CL or RL. Data reported as mean +/− standard error margin (SEM).
Figure S4: Frequency distributions for myofiber size, volume, myonuclear number, and myonuclear domain.
Frequency distribution plots for the EDL and SOL, respectively, assessing myofiber cross‐sectional areas (CSA) (A, F), myofiber volumes (CSAxLength) (B, G), myonuclei per mm of myofiber length (C, H), myonuclear domains ((CSAxLength)/ (Total MN)) (D, I), and myofiber lengths measured (E, J). Two‐way ANOVA with Tukey's multiple comparisons test. *P < 0.05, **P < 0.01, ***P < 0.001, ****P < 0.0001 compared to CL. &P < 0.05, $P < 0.01, #P < 0.001, %P < 0.0001 compared to RMS CL or RMS RL. N = 6 mice per experimental group and each data point represents an average of at least 50 myofibers per muscle.
Figure S5: Detailed statistical analyses of 8‐week‐old myofiber characteristics.
Extensor digitorum longus (EDL) myofibers (A) from each experimental group with detailed statistics from their two‐way ANOVA with Tukey's multiple comparisons tests. Soleus (SOL) myofibers (B) from each experimental group with detailed statistics from their two‐way ANOVA with Tukey's multiple comparisons tests. N = 6 mice per experimental group and each data point represents an average of at least 50 myofibers per muscle.
Figure S6: FACS analysis of satellite cells and mesenchymal progenitor/fibro‐adipogenic progenitor cells.
Representative FACS histograms of % live (A) satellite cells (CD45‐, CD31‐, Sca1‐, β1Int+, VCAM+, CXCR4+), and (C) mesenchymal progenitor/fibro‐adipogenic progenitor cells (CD45‐, CD31‐, Sca1+). Quantifications of (B) satellite cells, and (D) mesenchymal progenitor/fibro‐adipogenic progenitor cell content (n = 4–5 mice per condition). Two‐way ANOVA with Tukey's multiple comparisons test. *P < 0.05, **P < 0.01, ***P < 0.001, ****P < 0.0001 compared to CL of the same animal. Data reported as mean +/− standard error of mean (SEM). (E) Gating strategy; the cell suspension was gated for DAPI (live/dead) and discriminated for doublets prior to gating analysis of satellite cells (SCs; CD45‐, CD31‐, Sca‐1‐, Int‐β1+, VCAM+, CXCR4+), activated, and mesenchymal progenitor/fibro‐adipogenic progenitors (FAPs; CD45‐, CD31‐, Sca‐1+).
Figure S7: Volcano plots from RNA‐sequencing data.
Principal component analysis (PCA) of normalized counts (A) shown in two dimensions (2D) between 8‐week‐old, non‐irradiated, 0Gy CTL, Rad CL, Rad RL, RMS Rad CL, and the RMS Rad RL. PCA reveals clustering of the samples by contralateral, irradiation, and irradiation elimination of an RMS tumor. Volcano plots (B‐I) demonstrating the magnitude of fold change between experimental groups of significantly, differentially expressed genes (DEGs). Significance of differentially expressed (DE) genes determined by false discovery rate (FDR), p‐adjusted < 0.05. Green dots represent significantly downregulated genes, while red dots represent significantly upregulated genes as indicated by the x‐axis of Log2 fold‐change. Black dots represent genes that are not significant (FDR, p‐value > 0.05).
Figure S8: Predicted activated upstream regulators from Ingenuity Pathway Analysis (IPA) and control for RMS injection procedure.
Venn diagram (A) comparing the gene overlap of the top 5 most activated cytokines from the RNA‐sequencing analyses, where shared genes (B) are listed to the right. Predicted, activated, upstream regulators were calculated in Ingenuity Pathway Analysis (IPA) software (C) using the significant DEGs from the RNA‐sequencing analyses. To assess the effects of the RMS injection procedure on gastrocnemius (GAST) muscles (D), 20‐30 μL of only Matrigel was injected into the right GAST, then irradiated 6 days later. Control mice received no injection and only irradiation to the right limb, all mice were harvested at 8 weeks of age. Relative mRNA expression levels were measured by RT‐qPCR on GAST muscles from Rad CL, Rad RL ‐ inject, Rad CL, Rad RL + inject. N = 3 mice per group. Two‐way ANOVA with Tukey's multiple comparisons test. *P < 0.05, **P < 0.01, ***P < 0.001, ****P < 0.0001 compared to CL of the same mouse. &P < 0.05, $P < 0.01, #P < 0.001, %P < 0.0001 compared to Rad RL ‐ inject. Data reported as mean +/− standard error of mean (SEM).
Figure S9: Detailed statistical analyses of aged (16mo) myofibers.
(A) Schematic representing the aging paradigm after pediatric irradiation to eliminate implanted RMS tumors. Male mice were irradiated at 4 weeks of age with and without RMS tumor cell implantation then aged to 16 months old. (B) Aged 16‐months‐old EDL myofibers from each experimental group with detailed statistics from their two‐way ANOVA with Tukey's multiple comparisons tests. (C) Aged 16‐months‐old SOL myofibers from each experimental group with detailed statistics from their two‐way ANOVA with Tukey's multiple comparisons tests. Aged radiation alone myofibers derived and statistically analyzed from Bachman et al. 2020 [5]. N = 5–7 mice per experimental group and each data point represents an average of at least 50 myofibers per muscle.
Figure S10: Pediatric radiotherapy results in lifelong, age‐related decreases in TA muscle mass and body mass.
Violin plots representing the body masses (A) of mice that received irradiation at 4 weeks of age, with and without RMS tumor elimination, then aged to 16 months old. Statistics performed as two‐tailed t‐test with Welch's corrections. Violin plots representing the tibialis anterior (TA) muscle masses (B) with N = 6–7 mice per experimental group. Two‐way ANOVA with Tukey's multiple comparisons test. *P < 0.05, **P < 0.01, ***P < 0.001, ****P < 0.0001 compared to CL of same mouse. &P < 0.05, $P < 0.01, #P < 0.001, %P < 0.0001 compared to Rad CL or RL. Aged radiation alone body mass and muscle mass (green) derived and statistically analyzed from Bachman et al. 2020 [5].
Figure S11: Multivariate linear regression model to predict age‐related effects of pediatric radiotherapy and tumor elimination on EDL and SOL muscle strength.
From the 8‐week‐old EDL and SOL data, a multivariate linear regression model based upon the independent x‐variables of 8wk myofiber cross‐sectional area (CSA; χ1), 8wk myofiber volume (χ2), and 8wk muscle mass (χ3) was derived (G) to predict the y‐variable of absolute muscle force (mN). The multivariate linear regression model was calibrated by plotting the measured 8wk absolute force values (Figure 1) against the model predicted absolute force values for the EDL (A) and SOL (D). Blue dotted lines represent 95% confidence intervals of the linear regression models. After inputting the aged (16mo, 14mpi) myofiber cross‐sectional areas (CSA; χ1), 16mo myofiber volumes (χ2), and 16mo muscle masses (χ3) from each respective experimental group, the regression equation predicted absolute force (mN) values for the aged 16‐month‐old EDL (B) and SOL (E) muscles. Two‐way ANOVA with Tukey's multiple comparisons test was conducted on the predicted absolute force values from the aged EDL (C) and SOL (F) muscles. *P < 0.05, **P < 0.01, ***P < 0.001, ****P < 0.0001 compared to CL of same mouse. &P < 0.05, $P < 0.01, #P < 0.001, %P < 0.0001 compared to Rad CL or RL.
Table S1: List of significantly differentially expressed genes (DEG) between each experimental group related to Figure 4.
RNA‐sequencing data listing significantly differentially expressed (DE) genes (false discovery rate FDR, p‐adjusted < 0.05) between 8 week old, non‐irradiated, 0Gy controls (CTL), contralateral to the irradiated limb (Rad CL), the irradiated limb (Rad RL), contralateral to the RMS limb (RMS Rad CL), and the irradiated RMS limb (RMS Rad RL).
Table S2: Primer list for RT‐qPCR related to Figures 4 and 8.
List of forward and reverse primers for each murine gene assessed by RT‐qPCR including NCBI accession number.