

Abstract
Background
Sarcopenia is defined as the loss of muscle mass and strength. Despite the seriousness of this disease, a single diagnostic criterion has not yet been established. Few studies have reported the prevalence of sarcopenia globally, and there is a high level of heterogeneity between studies, stemmed from the diagnostic criteria of sarcopenia and the target population. The aims of this systematic review and meta‐analysis were (i) to identify and summarize the diagnostic criteria used to define sarcopenia and severe sarcopenia and (ii) to estimate the global and region‐specific prevalence of sarcopenia and severe sarcopenia by sociodemographic factors.
Methods
Embase, MEDLINE, and Web of Science Core Collections were searched using relevant MeSH terms. The inclusion criteria were cross‐sectional or cohort studies in individuals aged ≥18 years, published in English, and with muscle mass measured using dual‐energy x‐ray absorptiometry, bioelectrical impedance, or computed tomography (CT) scan. For the meta‐analysis, studies were stratified by diagnostic criteria (classifications), cut‐off points, and instruments to assess muscle mass. If at least three studies reported the same classification, cut‐off points, and instrument to measure muscle mass, they were considered suitable for meta‐analysis. Following this approach, 6 classifications and 23 subgroups were created. Overall pooled estimates with inverse‐variance weights obtained from a random‐effects model were estimated using the metaprop command in Stata.
Results
Out of 19 320 studies, 263 were eligible for the narrative synthesis and 151 for meta‐analysis (total n = 692 056, mean age: 68.5 years). Using different classifications and cut‐off points, the prevalence of sarcopenia varied between 10% and 27% in the studies included for meta‐analysis. The highest and lowest prevalence were observed in Oceania and Europe using the European Working Group on Sarcopenia in Older People (EWGSOP) and EWGSOP2, respectively. The prevalence ranged from 8% to 36% in individuals <60 years and from 10% to 27% in ≥60 years. Men had a higher prevalence of sarcopenia using the EWGSOP2 (11% vs. 2%) while it was higher in women using the International Working Group on Sarcopenia (17% vs. 12%). Finally, the prevalence of severe sarcopenia ranged from 2% to 9%.
Conclusions
The prevalence of sarcopenia and severe sarcopenia varied considerably according to the classification and cut‐off point used. Considering the lack of a single diagnostic for sarcopenia, future studies should adhere to current guidelines, which would facilitate the comparison of results between studies and populations across the globe.
Keywords: Sarcopenia, Prevalence, Systematic review, Meta‐analysis
Introduction
Sarcopenia refers to the gradual loss of skeletal muscle mass and strength that, although it is usually associated with advanced ageing, is now recognized to start before 60 years. 1 , 2 In 1989, Rosenberg defined sarcopenia as loss of muscle mass, from the Greek words sarx (flesh) and penia (loss) after comparing the lean body mass of the thigh of an older woman to a younger woman. 3 Three decades later, sarcopenia is defined as the loss of both muscle mass and strength 1 and has been formally recognized as a muscle disease in the International Classification of Disease (ICD‐10: M62 [84]). 4
Sarcopenia is known to be more prevalent in older populations, 5 but the decline in muscle mass starts from ~40 years onwards. 1 Therefore, the adverse effects of sarcopenia on quality of life, health care demand, morbidity, and mortality can affect both middle‐aged and older‐aged adults. 1 , 2 , 6 The pathophysiology of sarcopenia is complex and results from biological alterations in the structure of the muscles, hormonal imbalances, and external influences such as energy intake deficiencies. 7 In addition to older‐aged adults, underweight people, women, and people with other chronic conditions are more likely to develop sarcopenia and the adverse health outcomes associated with this condition. 8
Despite the seriousness of this disease, a single diagnostic criterion has not yet been established. Several attempts to standardize the operational diagnostic criterion and cut‐off points for sarcopenia have been proposed, most of which have used combinations of measures of muscle mass, muscle strength, and gait speed. Among them, the most used definitions are the European Working Group on Sarcopenia in Older People [EWGSOP (2010)], 5 the revised EWGSOP2 (2019), 1 the Asian Working Group for Sarcopenia (AWGS), 9 the International Working Group on Sarcopenia (IWGS), 10 the Foundation for the National Institute of Health (FNIH), 11 as well as definitions using muscle mass only as a single criterion (e.g. Newman and Baumgartner definitions). 12 , 13 However, within these definitions, the cut‐off values applied along with the method used to estimate those values—bioelectrical impedance (BIA) or dual‐energy x‐ray absorptiometry (DXA)—differ between diagnostic criteria and are highly conditional on the researcher's available resources. This makes it harder to reach a standardized and homogeneous estimate of disease prevalence. To our knowledge, an estimation of the global prevalence is lacking. Some previous systematic reviews and meta‐analyses estimated the prevalence of sarcopenia; nevertheless, this prevalence was estimated in healthy older adults only, 14 or community‐dwelling older people, 15 , 16 or only using two diagnostic criteria for sarcopenia. 17 Additionally, there are no studies that have specifically reported the prevalence of severe sarcopenia.
Here, we report the results of a systematic review and meta‐analysis to determine the prevalence of sarcopenia addressing the limitations of previous studies. Therefore, the aims of this study were (i) to identify and summarize the diagnostic criteria used to define sarcopenia and severe sarcopenia and (ii) to estimate the global and region‐specific prevalence of sarcopenia and severe sarcopenia by sociodemographic factors.
Methods
This systematic review and meta‐analysis was performed according to the Preferred Reporting Items for Systematic Review and Meta‐Analysis (PRISMA) guidelines 2020. 18 The protocol is available on PROSPERO (ID protocol: CRD42019141290).
Data sources and search strategy
A systematic search was undertaken in August 2019 using the following databases: MEDLINE, Embase, CENTRAL, and Web of Science Core Collections. Relevant MeSH terms and Boolean phases were used for the search: sarcopenia, muscle mass, grip strength, and gait speed without time restriction and in humans only. The complete search strategy for each database is shown in the Supporting Information.
Study selection
Cross‐sectional or cohort studies that included individuals aged ≥18 years with data available on sarcopenia, severe sarcopenia, or other combinations of physical capability markers called sarcopenia, published in English, and those in which muscle mass was measured using DXA, BIA, or computed tomography (CT) scan were included. Studies reporting only incidence rather than the prevalence (e.g. follow‐up studies not reporting baseline data), using other study designs (e.g. randomized control trials), using other instruments to measure muscle mass (e.g. calf circumference, SARC‐F, or mid‐upper arm circumference), conducted in hospitalized people (or undergoing surgery or recovering from a fall), receiving cancer treatment (chemotherapy or radiotherapy), or with a particular disease (e.g. Alzheimer's disease, HIV, cognitive impairment, sclerosis, or rheumatoid arthritis) were excluded (Figure 1).
Figure 1.

Preferred Reporting Items for Systematic Review and Meta‐Analysis (PRISMA) flow diagram.
Data extraction
All titles and abstracts were screened for suitability by two reviewers (F. P.‐R. and V. B.) according to the inclusion and exclusion criteria using Covidence. 19 If the study was deemed suitable, it progressed to the retrieval of the full text. If, after a review of the full text, the article was still considered suitable for the analysis, then it progressed to data extraction. These processes were conducted by the same researchers (F. P.‐R. and V. B.). Studies with multiple reports were linked, and the larger cohort was used. Additionally, if some information was missing (e.g. cut‐off points used) or there was ambiguity (e.g. different numbers reported throughout the text and tables), the lead author was contacted for clarification. If the lead authors did not reply after three attempts over the period of 8 weeks, the article was removed from the analyses (Figure 1).
Data from eligible articles were extracted using a standardized form. The form included lead author, year of publication, study design, country, sample size, age, sex, the diagnostic criterion of sarcopenia and severe sarcopenia (if any) used (criteria and cut‐off points used to define it), and the prevalence of sarcopenia and/or severe sarcopenia (if any).
Methodological quality assessment
All studies included were further assessed using the risk of bias tool for prevalence studies. This instrument was created by Hoy et al. to assess population‐based prevalence studies. 20 The tool has 10 questions and evaluates both external (Questions 1 to 4) and internal (Questions 5 to 10) validity. Hoy et al. designed two answers: ‘yes’, to indicate low risk; and ‘no’, to indicate high risk. For the current systematic review, we additionally included an ‘unclear’ option when the information was not available to make a judgement for a particular item. Additionally, each study was assigned an overall risk of study bias as ‘low’, ‘moderate’, or ‘high’ (Question 11 in the Hoy et al. assessment tool). Studies with ≥8 questions scored as low risk were considered to be of ‘low risk’, those with 6–7 questions scored as low risk were considered to be of ‘moderate risk’, and those with ≤5 questions scored as low risk were considered to be of ‘high risk’. This method has been used in previous systematic reviews. 21 , 22 Each article was scored independently by two reviewers (F. P.‐R. and V. B.), and scores were compared. When there was a disagreement, a consensus was achieved.
Meta‐analysis
All studies were stratified by the sarcopenia diagnostic criteria (classifications) as well as by the cut‐off points and instrument used to measure muscle mass (subgroups). If a subgroup contained at least three studies that applied the same cut‐off for all physical capability markers and used the same instrument to measure muscle mass, these were considered suitable for meta‐analysis. In total, 6 sarcopenia classifications and 23 subgroups were identified according to their cut‐off points. The classifications and subgroups within classifications are shown in Table 1.
Table 1.
Classifications and cut‐off points used to define sarcopenia in meta‐analysis
| Classification | Sarcopenia | Severe sarcopenia | |||
|---|---|---|---|---|---|
| Definition | Muscle mass (instrument) | Grip strength | Gait speed | ||
| EWGSOP2 | Sarcopenia was defined as low grip strength and a low muscle mass. |
Men <7.0 kg/m2 Women <6.0 kg/m2 a (DXA) |
Men <27 kg Women <16 kg |
Men and women <0.8 m/s | Was defined as the combination of sarcopenia plus slow gait speed. |
| EWGSOP | Sarcopenia was defined as the combination of low muscle mass plus low grip strength or slow gait speed. |
Men <8.87 kg/m2 Women <6.42 kg/m2 (BIA) |
Men <30 kg Women <20 kg |
Men and women <0.8 m/s | In some studies, when the three physical capabilities were together, the reviewers defined the combination as severe sarcopenia while in other, it was defined as per sarcopenia but with a lower cut‐off point for muscle mass. |
|
Men <7.26 kg/m2 Women <5.5 kg/m2 (DXA) | |||||
|
Men <7.26 kg/m2 Women <5.45 kg/m2 (DXA) | |||||
|
Men <7.23 kg/m2 Women <5.67 kg/m2 (DXA) | |||||
|
Men <8.31 kg/m2 Women <6.68 kg/m2 (BIA) | |||||
|
Men <10.75 kg/m2 Women <6.75 kg/m2 (BIA) | |||||
| AWGS | Sarcopenia was defined following the same approach of the EWGSOP. |
Men 7.0 kg/m2 Women <5.4 kg/m2 (DXA) |
Men <26 kg Women <18 kg |
Men and women <0.8 m/s | Similar than the EWGSOP. |
|
Men <7.0 kg/m2 Women <5.7 kg/m2 (BIA) | |||||
| IWGS | Sarcopenia was defined as the combination of low muscle mass and slow gait speed. |
Men <7.23 kg/m2 Women <5.67 kg/m2 (DXA) |
— | Men and women <1.0 m/s | — |
|
Men <7.23 kg/m2 Women <5.67 kg2 (BIA) | |||||
| FNIH | Sarcopenia was defined as low muscle mass and low grip strength. |
Men <0.789 or <19.75 kg Women <0.512 or <15.02 kg (DXA) |
Men <26 kg Women <16 kg |
Men and women <0.8 m/s | Was defined as the combination of sarcopenia plus slow gait speed. |
|
Men <0.789 or <19.75 kg Women <0.512 or <15.02 kg (BIA) | |||||
| Muscle mass | Sarcopenia was defined as low muscle mass only. |
Men <7.26 kg/m2 Women <5.45 kg/m2 (DXA) |
— | — | Severe sarcopenia as defined using the same approach, but employing a lower cut‐off point for muscle mass. |
|
Men <7.25 kg/m2 Women <5.67 kg/m2 (DXA) | |||||
|
Men <10.75 kg/m2 Women <6.75 kg/m2 (BIA) | |||||
|
Men <8.87 kg/m2 Women <6.42 kg/m2 (BIA) | |||||
|
Men <0.789 Women <0.512 (DXA) | |||||
|
Men <0.789 Women <0.512 (BIA) | |||||
|
Men <37% Women <27.6% (BIA) | |||||
|
Men <6.87 kg/m2 Women <5.46 kg/m2 (DXA) | |||||
|
Men <7.23 kg/m2 Women <5.67 kg/m2 (DXA) | |||||
|
Men <7.26 kg/m2 Women <5.5 kg/m2 (DXA) | |||||
AWGS, Asian Working Group for Sarcopenia; BIA, bioelectrical impedance; DXA, dual‐energy x‐ray absorptiometry; EWGSOP, European Working Group on Sarcopenia in Older People; EWGSOP2, European Working Group on Sarcopenia in Older People 2; FNIH, Foundation for the National Institute of Health; IWGS, International Working Group on Sarcopenia.
At the time of the search, these studies did not have the newly updated cut‐off of 5.5 kg/m2 for women for the EWGSOP2.
The metaprop command in Stata was used to calculate the overall pooled estimates with inverse‐variance weights obtained from random‐effect meta‐analysis models. 23 For subgroup analyses, heterogeneity was assessed using the I 2 statistic (which ranges from 0% to 100%). When one study reported more than one cut‐off point to define sarcopenia based on the same classification (e.g. two different cut‐off points to define muscle mass in the EWGSOP), only one of the studies was kept to estimate the overall prevalence of that classification. The latter was carried out only for the subgroups within the EWGSOP and muscle mass classifications. Finally, the prevalence was estimated by region (Europe, Asia, Africa, North America, South America, and Oceania) and, where possible, by sex. Following the World Health Organization (WHO) definition of ageing, studies were also meta‐analysed based on age categories (≥60 and <60 years). A meta‐regression analysis by age was also performed for all studies and by classification. Stata 16 statistical software (StataCorp LP) was used to perform all analyses.
Results
Search results
The initial search identified 19 320 records. After removing duplicates (n = 5920), 13 400 titles and abstracts were screened. Of these, 1122 were selected for a full‐text review for the eligibility assessment (Figure 1). Following the application of the inclusion and exclusion criteria, 859 further studies were removed. Therefore, 263 studies were finally included in this systematic review for narrative synthesis (Figure 1).
Quality assessment
Using the modified version of the Hoy et al. quality assessment tool, 20 the higher or unclear risks were observed in Questions 1 to 4, that is, those relating to the external validity of the study. Question 1—which refers to the representativeness of the sample to the national population in relation to relevant variables such as age or sex—had the highest proportion of ‘higher risk’ studies with only 3.4% of studies graded ‘low risk’ for this item (Figure 2). On the other hand, questions regarding internal validity (Questions 5 to 10) showed lower risk of bias; 89.4–100% of the studies were graded ‘low risk’ for these questions. Because of these discrepancies between external and internal validity, we identified that 75.7% of the studies had a moderate (67.3%) or high (8.4%) overall risk of bias (Figure 2). Therefore, according to Hoy et al., ‘further research is likely to have an important impact on our confidence in the estimate and may change the estimate’. 20 Studies were not excluded due to their quality assessment score. More information on each study according to their quality assessment is available in Supporting Information, Table S1.
Figure 2.

Overall quality assessment of studies included. Studies were assessed using a modified version of Hoy et al. The questions were as follows: (1) Was the study's target population a close representation of the national population in relation to relevant variables, for example, age, sex, and occupation? (2) Was the sampling frame a true or close representation of the target population? (3) Was some form of random selection used to select the sample, OR was a census undertaken? (4) Was the likelihood of non‐response bias minimal? (5) Were data collected directly from the subjects (as opposed to proxy)? (6) Was an acceptable case definition used in the study? (7) Was the study instrument that measured the parameter of interest (e.g. prevalence of low back pain) shown to have reliability and validity (if necessary)? (8) Was the same mode of data collection used for all subjects? (9) Was the length of the shortest prevalence period for the parameter of interest appropriate? (10) Were the numerator(s) and denominator(s) for the parameter of interest appropriate? Summary item on the overall risk of study bias (overall).
Characteristics of studies—narrative synthesis
A total of 263 studies were included in this systematic review, corresponding to 692 056 individuals (there were also data available on 317 578 women and 319 184 men) with a mean age of 68.5 years (references 1 to 263 in the Supporting Information). Overall, 207 studies were cross‐sectional, 53 were cohort studies, and 3 used both designs. Studies were conducted between 2000 and 2019. Most of the studies were carried out in Europe or Asia, while only four studies originated from Africa. BIA was the instrument most often used to assess muscle mass (137 studies), followed by DXA (121 studies) and CT scan (11 studies). In six studies, more than one method to assess muscle mass was used. Height was the principal method used to correct muscle mass while weight was used in 23 studies only. The overall prevalence of sarcopenia ranged from 0.2% to 86.5% according to the classification used (0.3–91.2% in women and 0.4–87.7% in men). The most commonly used classifications were the EWGSOP (prevalence range: 0.4–57.4%) and AWGS (prevalence range: 0.3–53.0%), used in 95 and 55 studies, respectively. Among measures of muscle mass only, skeletal muscle mass corrected for height squared was the most frequently reported approach (79 studies). The prevalence using this approach ranged from 0.2% to 86.5%. Severe sarcopenia was estimated in 34 studies only, with prevalence ranging from 0.2% to 45.0% in women and from 0.2% to 17.1% in men (overall prevalence range: 0.2–34.4%). More information for each study and the cut‐off points used is available in Tables S2 and S3, respectively.
Meta‐analysis
A total of 151 of the 263 studies were suitable for meta‐analysis. The average age in these studies was 71.5 years (10% of the population was younger than 60 years and 10% older than 80 years). The individual prevalence by classification and subgroups within the classifications is available in Supporting Information, Figures S1–S12, while a summary of the prevalence of these classifications by different sociodemographic characteristics is shown in Figures 3, 4, 5, 6, 7. The overall prevalence of sarcopenia ranged from 10% [95% confidence interval (CI): 2.0–17.0%] using the EWGSOP2 to 27% (95% CI: 23.0–31.0%) using the overall muscle mass definition (Figure 3). The prevalence for each classification was as follows: EWGSOP2: 10% (95% CI: 2.0–17%); AWGS: 18% (95% CI: 14–23%) using DXA and 14% (95% CI: 11–16%) using BIA; IWGS: 11% (95% CI: 6.0–16.0%) using DXA and 20% (4.0–37.0%) using BIA; and FNIH: 10% (95% CI: 7.0–12.0%) using DXA and 15% (8.0–22.0%) using BIA (Figures S1a–S6a). For the EWGSOP and muscle mass, two prevalence figures are reported. The first includes all studies grouped by different cut‐off points and the second excluding studies that reported more than one cut‐off point to define sarcopenia (for that classification). Using the first approach, the prevalence of sarcopenia ranged from 15% (95% CI: 7.0–24%) to 29% (95% CI: 21–36%) for the EWGSOP and from 9% (95% CI: 4.0–14.0%) to 45% (95% CI: 3.0–86.0%) for muscle mass (Figures S1a.2 and S6a.2). Excluding these studies, the overall prevalence did not change (Figures S2a.1 and S6a.1). The latter approach was kept for the other analyses (prevalence by region, age, and sex).
Figure 3.
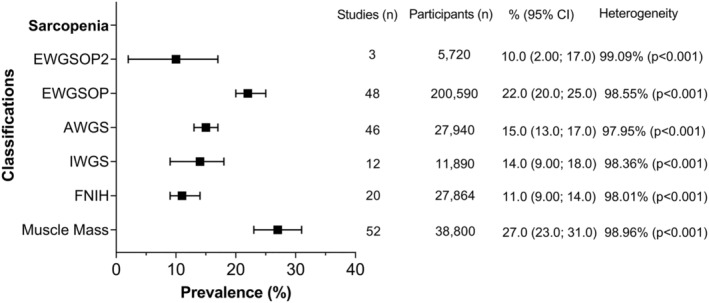
Overall prevalence of sarcopenia according to the classification used. Data presented as prevalence (%) with their respectively 95% confidence intervals (CIs) by classification used. Overall pooled estimates with inverse‐variance weights obtained from a random‐effects model were estimated for the analyses using metaprop in Stata. Heterogeneity was assessed using the I 2 statistic (ranged from 0% to 100%). %, estimated prevalence; AWGS, Asian Working Group for Sarcopenia; EWGSOP, European Working Group on Sarcopenia in Older People; EWGSOP2, European Working Group on Sarcopenia in Older People 2; FNIH, Foundation for the National Institute of Health; IWGS, International Working Group on Sarcopenia.
Figure 4.

Overall prevalence of sarcopenia by classification and region of origin. Data presented as prevalence (%) by classification used. Overall pooled estimates with inverse‐variance weights obtained from a random‐effects model were estimated for the analyses using metaprop in Stata. AWGS, Asian Working Group for Sarcopenia; EWGSOP, European Working Group on Sarcopenia in Older People; EWGSOP2, European Working Group on Sarcopenia in Older People 2; FNIH, Foundation for the National Institute of Health; IWGS, International Working Group on Sarcopenia.
Figure 5.
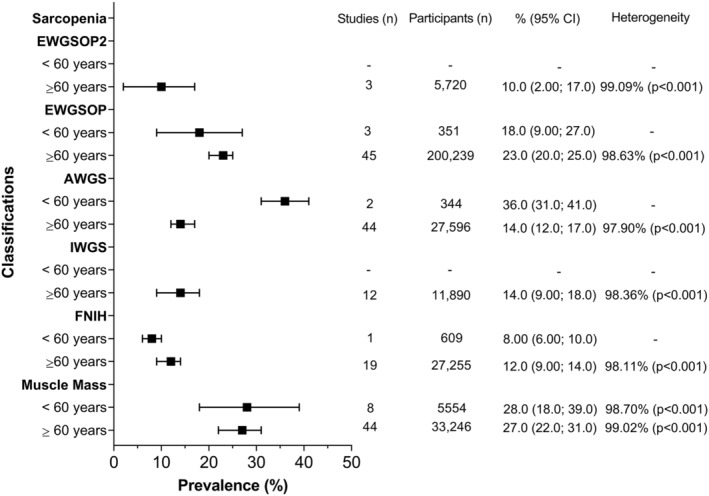
Overall prevalence of sarcopenia by classification and age. Data presented as prevalence (%) with their respectively 95% confidence intervals (CIs) by classification used. Overall pooled estimates with inverse‐variance weights obtained from a random‐effects model were estimated for the analyses using metaprop in Stata. Heterogeneity was assessed using the I 2 statistic (ranged from 0% to 100%). Due to the low numbers of studies with people younger than 60 years, it was impossible to estimate heterogeneity for the EWGSOP, AWGS, and FNIH classifications. %, estimated prevalence; AWGS, Asian Working Group for Sarcopenia; EWGSOP, European Working Group on Sarcopenia in Older People; EWGSOP2, European Working Group on Sarcopenia in Older People 2; FNIH, Foundation for the National Institute of Health; IWGS, International Working Group on Sarcopenia.
Figure 6.

Overall prevalence of sarcopenia by classification and sex. Data presented as prevalence (%) with their respectively 95% confidence intervals (CIs) by classification used. Overall pooled estimates with inverse‐variance weights obtained from a random‐effects model were estimated for the analyses using metaprop in Stata. Heterogeneity was assessed using the I 2 statistic (ranged from 0% to 100%). Due to the low numbers of studies with data available for women, it was impossible to estimate heterogeneity for the EWGSOP2. %, estimated prevalence; AWGS, Asian Working Group for Sarcopenia; EWGSOP, European Working Group on Sarcopenia in Older People; EWGSOP2, European Working Group on Sarcopenia in Older People 2; FNIH, Foundation for the National Institute of Health; IWGS, International Working Group on Sarcopenia.
Figure 7.

Overall prevalence of severe sarcopenia. Data presented as prevalence (%) with their respectively 95% confidence intervals (CIs) by classification used. Overall pooled estimates with inverse‐variance weights obtained from a random‐effects model were estimated for the analyses using metaprop in Stata. Heterogeneity was assessed using the I 2 statistic (ranged from 0% to 100%). Due to the low numbers of studies, it was impossible to estimate heterogeneity in some cases. Panel (A) shows the overall prevalence of severe sarcopenia by classification, while panel (B) the overall prevalence by classification and sex. %, estimated prevalence; AWGS, Asian Working Group for Sarcopenia; EWGSOP, European Working Group on Sarcopenia in Older People; EWGSOP2, European Working Group on Sarcopenia in Older People 2; FNIH, Foundation for the National Institute of Health; IWGS, International Working Group on Sarcopenia.
When the analyses were stratified by region and type of classification or sarcopenia (Figure 4), the highest prevalence was observed in Oceania using the EWGSOP (40%) followed by South America using muscle mass (35%) while the lowest prevalence was observed in Europe using the EWGSOP2 (1%) and Oceania using the FNIH (5%). Europe and Asia were the regions with more information available regarding prevalence by classification, while in Africa, the prevalence was estimated only using FNIH (13%). More information regarding each classification by region is available in Figures S1b–S6b.
Studies were also classified according to the mean age of the participants as ≥60 and <60 years. Only four classifications of sarcopenia (EWGSOP, AWGS, FNIH, and muscle mass) contributed to estimate the prevalence in individuals younger than 60 years, which ranged from 8% to 36%. The prevalence for individuals older than 60 years was estimated from studies using all six classifications for sarcopenia, producing a range from 10% to 27% (Figure 5). More information regarding the prevalence of sarcopenia by age categories according to each classification and subgroup is available in Figures S1c–S6c. Meta‐regression analysis showed that the overall prevalence increased by increasing age in years; however, this was not statistically significant (P = 0.718, Figure S7). More information for each classification is available in Figure S7a–S7f.
Those studies that reported subgroup analyses by sex contributed to pooled estimates derived in women and men. The overall prevalence by sex according to each classification is shown in Figure 6, while the individual prevalence for each classification and subgroup is available in Figures S1d–S6d for women and S1e–S6e for men. In brief, the prevalence of sarcopenia was higher in men compared with women when the EWGSOP2 (11.0% vs. 2%) and muscle mass (35% vs. 27%) were used for classification. Women classified using the IWGS had a higher prevalence of sarcopenia than men (17% vs. 12%) while the prevalence by sex was similar using the EWGSOP, AWGS, and FNIH.
Finally, 24 studies included in the meta‐analysis also reported results for severe sarcopenia using five out of the six main classifications (there were no published estimates using IWGS). According to the classification used, the prevalence of severe sarcopenia ranged from 2% to 9% (Figure 7). When the studies were stratified by region and classification, the prevalence was higher in European studies using the EWGSOP (12%) while Asian and Oceanic studies reported the lowest overall prevalence using the AWGS, FNIH, and EWGSOP (3%) (Figure S9a–S9d). In terms of sex, severe sarcopenia was measured using four out of the five classifications. Women reported a higher prevalence compared with men using the EWGSOP and muscle mass, while, using the AWGS and EWGSOP2, the prevalence was similar (Figure 7). Finally, the prevalence by age categories was estimated only for muscle mass as studies using the other classifications reported for people older than 60 years only (Figure S12). More information about severe sarcopenia by classification and subgroup analysis is available in Figures S8–S12.
Discussion
Sarcopenia is a progressive and complex disease associated with a higher burden of morbidity and mortality. 1 , 2 , 6 In this study, a comprehensive systematic review of the published literature was performed, and data were extracted for the estimation of the overall prevalence of sarcopenia and severe sarcopenia. Including 263 studies that met the inclusion criteria, the narrative synthesis highlighted that the overall prevalence of sarcopenia ranged between 0.2% and 86.5% according to the classification used. This review revealed that the two most commonly reported classifications were the EWGSOP and the AWGS. Additionally, many studies estimated sarcopenia solely by muscle mass adjusted for height squared. The meta‐analysis included six major classifications of sarcopenia—within 23 subgroups with different cut‐off points and instrument to assess muscle mass—and estimated that the overall prevalence of sarcopenia ranged from 10%, using the EWGSOP2, to 27%, using the overall muscle mass definition. Moreover, even though previous systematic reviews and meta‐analysis have reported the prevalence of sarcopenia in specific regions or communities, 14 , 15 , 16 , 24 , 25 this is the first study that reports the prevalence of severe sarcopenia. From 34 studies with severe sarcopenia data, the prevalence of severe sarcopenia ranged from 0.2% to 34.4% in the narrative review while the pooled estimate from the meta‐analysis ranged from 2.0% to 9.0%. The revised EWGSOP2 emphasizes that severe sarcopenia should be based on the combination of sarcopenia plus a low physical performance, such as slow gait speed. 1 Therefore, considering that slow gait speed has been identified as an independent risk factor for all‐cause mortality 26 , 27 and that a previous work demonstrated that the combination of slow gait speed and low grip strength, followed by severe sarcopenia, had the highest risk effect over all‐cause mortality, cardiovascular disease, and respiratory disease, 6 further study of severe sarcopenia should be encouraged.
Sarcopenia used to be recognized as an ageing‐related disease. 5 Nowadays, it is known that the decrease in muscle mass function and quality start at ~40 years and that sarcopenia often appears earlier in life. 1 , 2 However, studies in this field still tend to focus on older people. In fact, only 10% of the studies included in the meta‐analysis estimated the prevalence in people younger than 60 years. Considering that previous research has demonstrated a higher risk of adverse health outcome in middle‐aged individuals with sarcopenia, 6 this age group merits further research. This systematic review and meta‐analysis also revealed that research on sarcopenia in Africa is very limited. Because 16% of the world's population lives in Africa (more than 1.4 billion) 28 and many Africans have poor access to good nutrition and health care, 29 future studies on sarcopenia are required in order to fully understand the burden of disease in this region.
Across the available studies, there are wide variations in the estimated prevalence of sarcopenia due to the different diagnostic criteria used, differences in the methods used to measure muscle mass, differences in the cut‐off points applied, and heterogeneous study populations. These could all contribute to the vast amount of heterogeneity identified among studies. Few systematic reviews and meta‐analyses have been attempted to investigate the prevalence of sarcopenia across the globe. 14 , 15 , 16 Shafiee et al. reported the overall prevalence in healthy older adults only. Based on 35 studies, the overall prevalence of sarcopenia was 10% in both sexes. 14 Our meta‐analysis did not estimate the overall prevalence due to the difference in the cut‐off points and instruments within classifications. Moreover, we did not limit our inclusion criteria to healthy adults only as people with sarcopenia often suffer from other chronic conditions. Recently, Papadopoulou et al. estimated the worldwide prevalence of sarcopenia, but the study focused on different environmental settings—community, nursing homes, and hospitalized people. 15 Based on 41 studies in total, the authors found that nursing homes residents and hospitalized patients were more likely to be sarcopenic. The prevalence of sarcopenia was 11% and 9% in community‐dwelling men and women, respectively; 51% and 31% in men and women in nursing homes, respectively; and 23% and 24% in hospitalized men and women, respectively. 15 However, for that meta‐analysis, only three diagnostic tools were applied for the diagnosis of sarcopenia. In the same line, Mayhew et al. reported the prevalence of sarcopenia only in community‐dwelling older adults. 16 Reviewing 109 studies, they identified that the prevalence of sarcopenia in this population ranged from 9.9% to 40.4% depending on the diagnostic criterion used. In contrast to Mayhew et al., we did not restrict our inclusion criteria to only community‐dwelling older adults because sarcopenia is documented to begin earlier in life.
Sarcopenia leads to a worse quality of life and higher economic burden and health care cost. 30 Although sarcopenia has been recognized as a disease in the ICD since 2016, 4 few studies have examined the overall prevalence in representative samples of the populations, such as National Health Surveys. As a result, the quality assessment in this systematic review and meta‐analysis concluded that ‘further work is likely to have an important impact on our confidence in the estimate’. Nevertheless, even if more studies become available for inclusion in this meta‐analysis, the external validity will not improve unless they are conducted on a representative sample of the population. Furthermore, the lack of a universal and standardized diagnostic criterion for sarcopenia still remains one of the main challenges and priorities. The latter has made it difficult to conduct robust studies on sarcopenia, but it is even more difficult to compare or harmonize the results across studies. It also impacts on the ability to produce uniform guidelines for the prevention and treatment of sarcopenia. Sarcopenia can be partially reversed with the correct intervention and treatment. 31 Therefore, even if different cut‐off points exist across the globe due to differences in ethnicity or sex, definitions should use the same physical capability markers to diagnose sarcopenia. Achieving a consensual diagnostic criterion would facilitate the comparison of results across studies and help translate the results into clinical practice beyond the research field.
Strengths and limitations
This work was conducted in accordance with the PRISMA guidelines 2020. 18 Study selection, data extraction, and the assessment of quality were carried out by two independent reviewers. 32 In addition, articles included for meta‐analysis, and then classified by classification and subgroups, were comparable or identical in terms of the definition of sarcopenia used, the instrument to measure muscle mass, the methods used for the adjustment of muscle mass, and the cut‐off points for each criterion. In fact, each subgroup had to have at least three articles using the same methodology—both in the instrument used to measure muscle mass, the adjustment, and cut‐off point—for a pooled estimate to be derived. Moreover, if one study reported more than one prevalence using different cut‐off points for the same main classification (different subgroups), only one prevalence was kept to avoid having the same population in the analyses more than one.
However, there are some limitations. Firstly, the search included all studies published up to August 2019. More recent studies have not been included. While this might impact the overall prevalence of all classifications and subgroups by cut‐off points, the biggest impact is likely to be on prevalence estimated using EWGSWOP2 1 as well as the AWGS that updated its sarcopenia definition and its cut‐off points in March 2020. 33 Secondly, although our systematic review and meta‐analysis included populations from different regions, the restriction to English articles may have systematically excluded studies conducted in regions such as Latin America, Asia, Africa, and Oceania, generating a potential language selection bias. Moreover, we could not reliably assess publication bias because of the small number of studies per sarcopenia classification and the high heterogeneity among studies. Based on current recommendations, at least 10 studies are needed to examine reporting bias using funnel plots and, if the heterogeneity is high, the minimum number of studies may be substantially more than 10. 34 As for many of our analyses, the number of studies included was below 10, and the heterogeneity was high; we did not perform funnel plots. Thirdly, other sociodemographic characteristics such as ethnicity or area of residence were not assessed due to the lack of information in the majority of the studies. Fourthly, receiving no reponses from the corresponding authors, 24 articles were removed due to missing information or ambiguities in reporting the main study findings. The inclusion of those studies might change the prevalence of some classifications. However, as the corresponding authors did not provide the requested data, more bias could be introduced by including them in our study. Finally, the heterogeneity among studies was higher than 90%; therefore, pooled estimates should be interpreted with caution. While this represents ‘considerable heterogeneity’, previous meta‐analyses of prevalence have reported similar results, 35 mainly due to the variability of the results among studies. The wide variety among classifications and cut‐off points used to define sarcopenia may explain the huge heterogeneity identified. Yet, our meta‐analysis still provides relevant information regarding the burden of sarcopenia, providing a summarized estimate that can be used to calculate baseline risk for the total population as well as by sex and region. 35
In conclusion, we found that using different classification systems and cut‐off points, the prevalence of sarcopenia ranged from 0.2% to 86.5% in the narrative review and from 10% to 27% in the meta‐analysis. The prevalence of severe sarcopenia was estimated, but fewer studies could be included. Similarly, few studies reported prevalence in individuals younger than 60 years. The prevalence by sex was different according to the classification used. EWGSOP and AWGS were the classification systems most commonly used, and muscle mass was most commonly reported as muscle mass adjusted for height squared. Most information was available on European and Asian populations, and least on African. Deriving robust pooled estimates is hindered by the lack of a single classification system. Reaching a consensual diagnostic criterion would facilitate not only research but also the translation of research findings into clinical practice.
Funding
F.P.‐R. receives financial support from the Chilean Government for doing her PhD (ANID‐Becas Chile 2018—72190067).
Conflict of interest
None to declare.
Copyright
The corresponding author has the right to grant on behalf of all authors and does grant on behalf of all authors, a worldwide licence to the publishers and its licensees in perpetuity, in all forms, formats, and media (whether known now or created in the future), to (i) publish, reproduce, distribute, display, and store the contribution; (ii) translate the contribution into other languages, create adaptations, reprints, include within collections, and create summaries, extracts, and/or abstracts of the contribution; (iii) create any other derivative work(s) based on the contribution; (iv) exploit all subsidiary rights in the contribution; (v) the inclusion of electronic links from the contribution to third‐party material wherever it may be located; and (vi) licence any third party to do any or all of the above.
Transparency
The lead author (the manuscript's guarantor) affirms that the manuscript is an honest, accurate, and transparent account of the study being reported; that no important aspects of the study have been omitted; and that any discrepancies from the study as planned (and, if relevant, registered) have been explained
Supporting information
Figure S1a. Prevalence of sarcopenia using the EWGSOP2.
Figure S1b. Prevalence of sarcopenia using the EWGSOP2 by region of origin.
Figure S1c. Prevalence of sarcopenia using the EWGSOP2 by age categories.
Figure S1d. Prevalence of sarcopenia using the EWGSOP2 in women.
Figure S1e. Prevalence of sarcopenia using the EWGSOP2 in men.
Figure S2a.1. Prevalence of sarcopenia using the EWGSOP (excluding those who reported the prevalence more than once using different cut‐off points).
Figure S2a.2. Prevalence of sarcopenia using the EWGSOP (all cut‐off points).
Figure S2b. Prevalence of sarcopenia using the EWGSOP by region of origin (excluding those who reported the prevalence more than once using different cut‐off points).
Figure S2c. Prevalence of sarcopenia using the EWGSOP by age categories (excluding those who reported the prevalence more than once using different cut‐off points).
Figure S2d.1. Prevalence of sarcopenia using the EWGSOP in women (excluding those who reported the prevalence more than once using different cut‐off points).
Figure S2d.2. Prevalence of sarcopenia using the EWGSOP in women (all cut‐off points).
Figure S2e.1. Prevalence of sarcopenia using the EWGSOP in men (excluding those who reported the prevalence more than once using different cut‐off points).
Figure S2e.2. Prevalence of sarcopenia using the EWGSOP in men (all cut‐off points).
Figure S3a. Prevalence of sarcopenia using the AWGS.
Figure S3b. Prevalence of sarcopenia using the AWGS by region of origin.
Figure S3c. Prevalence of sarcopenia using the AWGS by age categories.
Figure S3d. Prevalence of sarcopenia using the AWGS in women.
Figure S3e. Prevalence of sarcopenia using the AWGS in men.
Figure S4a. Prevalence of sarcopenia using the IWGS.
Figure S4b. Prevalence of sarcopenia using the IWGS by region of origin.
Figure S4c. Prevalence of sarcopenia using the IWGS by age categories.
Figure S4d. Prevalence of sarcopenia using the IWGS in women.
Figure S4e. Prevalence of sarcopenia using the IWGS in men.
Figure S5a. Prevalence of sarcopenia using the FNIH.
Figure S5b. Prevalence of sarcopenia using the FNIH by region of origin.
Figure S5c. Prevalence of sarcopenia using the FNIH by age categories.
Figure S5d. Prevalence of sarcopenia using the FNIH in women.
Figure S5e. Prevalence of sarcopenia using the FNIH in men.
Figure S6.a.1. Prevalence of sarcopenia using muscle mass (excluding those who reported the prevalence more than once using different cut‐off points).
Figure S6.a.2. Prevalence of sarcopenia using muscle mass (all cut‐off points).
Figure S6b. Prevalence of sarcopenia using muscle mass by region of origin (excluding those who reported the prevalence more than once using different cut‐off points).
Figure S6c. Prevalence of sarcopenia using muscle mass by age categories (excluding those who reported the prevalence more than once using different cut‐off points).
Figure S6d.1 Prevalence of sarcopenia using muscle mass in women (excluding those who reported the prevalence more than once using different cut‐off points)
Figure S6d.2 Prevalence of sarcopenia using muscle mass in women (all cut‐off points).
Figure S6e.1 Prevalence of sarcopenia using muscle mass in men (excluding those who reported the prevalence more than once using different cut‐off points)
Figure S6e.2. Prevalence of sarcopenia using muscle mass in men (all cut‐off points).
Figure S7. Overall meta‐regression by age.
Figure S7a. Meta‐regression by age using the EWGSOP2.
Figure S7b. Meta‐regression by age using the EWGSOP.
Figure S7c. Meta‐regression by age using the AWGS.
Figure S7d. Meta‐regression by age using the IWGS.
Figure S7e. Meta‐regression by age using the FNIH.
Figure S7f. Meta‐regression by age using muscle mass.
Figure S8. Prevalence of severe sarcopenia using different classifications.
Figure 9a. Prevalence of severe sarcopenia using the EWGSOP2.
Figure S9b. Prevalence of severe sarcopenia using the EWGSOP.
Figure S9c. Prevalence of severe sarcopenia using the AWGS.
Figure S9d. Prevalence of severe sarcopenia using the FNIH.
Figure S9e. Prevalence of severe sarcopenia using muscle mass.
Figure S10. Prevalence of severe sarcopenia in women.
Figure S11. Prevalence of severe sarcopenia using in men.
Figure S12. Prevalence of severe sarcopenia by age categories and muscle mass.
Table S1. Supporting Information
Acknowledgements
The authors of this manuscript certify that they comply with the ethical guidelines for editorship and publishing in the Journal of Cachexia, Sarcopenia and Muscle. 36
Petermann‐Rocha F., Balntzi V., Gray S. R., Lara J., Ho F. K., Pell J. P., and Celis‐Morales C. (2022) Global prevalence of sarcopenia and severe sarcopenia: a systematic review and meta‐analysis, Journal of Cachexia, Sarcopenia and Muscle, 13, 86–99, 10.1002/jcsm.12783
Systematic review PROSPERO registration number: CRD4201914129.
References
- 1. Cruz‐Jentoft AJ, Bahat G, Bauer J, Boirie Y, Bruyère O, Cederholm T, et al. Sarcopenia: revised European consensus on definition and diagnosis. Age Ageing 2019;48:16–31. [DOI] [PMC free article] [PubMed] [Google Scholar]
- 2. Cruz‐Jentoft AJ, Sayer AA. Sarcopenia. Lancet 2019;393:2636–2646. [DOI] [PubMed] [Google Scholar]
- 3. Rosenberg IH. Sarcopenia: origins and clinical relevance. J Nutr 1997;127:990S–991S. [DOI] [PubMed] [Google Scholar]
- 4. Falcon LJ, Harris‐Love MO. Sarcopenia and the new ICD‐10‐CM code: screening, staging, and diagnosis considerations. Fed Pract 2017;34:24–32. [PMC free article] [PubMed] [Google Scholar]
- 5. Cruz‐Jentoft AJ, Baeyens JP, Bauer JM, Boirie Y, Cederholm T, Landi F, et al. Sarcopenia: European consensus on definition and diagnosis: report of the European Working Group on Sarcopenia in Older People. Age Ageing 2010;39:412–423. [DOI] [PMC free article] [PubMed] [Google Scholar]
- 6. Petermann‐Rocha F, Ho FK, Welsh P, Mackay D, Brown R, Gill JMR, et al. Physical capability markers used to define sarcopenia and their association with cardiovascular and respiratory outcomes and all‐cause mortality: a prospective study from UK Biobank. Maturitas 2020;138:69–75. [DOI] [PubMed] [Google Scholar]
- 7. Morley JE. Anorexia, sarcopenia, and aging. Nutrition 2001;17:660–663. [DOI] [PubMed] [Google Scholar]
- 8. Petermann‐Rocha F, Chen M, Gray SR, Ho FK, Pell JP, Celis‐Morales C. Factors associated with sarcopenia: a cross‐sectional analysis using UK Biobank. Maturitas 2020;133:60–67. [DOI] [PubMed] [Google Scholar]
- 9. Chen LK, Liu LK, Woo J, Assantachai P, Auyeung TW, Bahyah KS, et al. Sarcopenia in Asia: consensus report of the Asian Working Group for Sarcopenia. J Am Med Dir Assoc 2014;15:95–101. [DOI] [PubMed] [Google Scholar]
- 10. Fielding RA, Vellas B, Evans WJ, Bhasin S, Morley JE, Newman AB, et al. Sarcopenia: an undiagnosed condition in older adults. Current consensus definition: prevalence, etiology, and consequences. International Working Group on Sarcopenia. J Am Med Dir Assoc 2011;12:249–256. [DOI] [PMC free article] [PubMed] [Google Scholar]
- 11. Studenski SA, Peters KW, Alley DE, Cawthon PM, McLean RR, Harris TB, et al. The FNIH sarcopenia project: rationale, study description, conference recommendations, and final estimates. J Gerontol A Biol Sci Med Sci 2014;69:547–558. [DOI] [PMC free article] [PubMed] [Google Scholar]
- 12. Baumgartner RN, Koehler KM, Gallagher D, Romero L, Heymsfield SB, Ross RR, et al. Epidemiology of sarcopenia among the elderly in New Mexico. Am J Epidemiol 1998;147:755–763. [DOI] [PubMed] [Google Scholar]
- 13. Newman AB, Kupelian V, Visser M, Simonsick E, Goodpaster B, Nevitt M, et al. Sarcopenia: alternative definitions and associations with lower extremity function. J Am Geriatr Soc 2003;51:1602–1609. [DOI] [PubMed] [Google Scholar]
- 14. Shafiee G, Keshtkar A, Soltani A, Ahadi Z, Larijani B, Heshmat R. Prevalence of sarcopenia in the world: a systematic review and meta‐analysis of general population studies. J Diabetes Metab Disord 2017;16:21. [DOI] [PMC free article] [PubMed] [Google Scholar]
- 15. Papadopoulou SK, Tsintavis P, Potsaki P, Papandreou D. Differences in the prevalence of sarcopenia in community‐dwelling, nursing home and hospitalized individuals. A systematic review and meta‐analysis. J Nutr Health Aging 2020;24:83–90. [DOI] [PubMed] [Google Scholar]
- 16. Mayhew AJ, Amog K, Phillips S, Parise G, McNicholas PD, de Souza RJ, et al. The prevalence of sarcopenia in community‐dwelling older adults, an exploration of differences between studies and within definitions: a systematic review and meta‐analyses. Age Ageing 2019;48:48–56. [DOI] [PubMed] [Google Scholar]
- 17. Cruz‐Jentoft AJ, Landi F, Schneider SM, Zúñiga C, Arai H, Boirie Y, et al. Prevalence of and interventions for sarcopenia in ageing adults: a systematic review. Report of the International Sarcopenia Initiative (EWGSOP and IWGS). Age Ageing 2014;43:748–759. [DOI] [PMC free article] [PubMed] [Google Scholar]
- 18. Page MJ, McKenzie JE, Bossuyt PM, Boutron I, Hoffmann TC, Mulrow CD, et al. The PRISMA 2020 statement: an updated guideline for reporting systematic reviews. BMJ 2021;372:n71. [DOI] [PMC free article] [PubMed] [Google Scholar]
- 19. Covidence . Covidence systematic review software, Veritas Health Innovation, Melbourne, Australia. Available at www.covidence.org
- 20. Hoy D, Brooks P, Woolf A, Blyth F, March L, Bain C, et al. Assessing risk of bias in prevalence studies: modification of an existing tool and evidence of interrater agreement. J Clin Epidemiol 2012;65:934–939. [DOI] [PubMed] [Google Scholar]
- 21. Harrisson SA, Stynes S, Dunn KM, Foster NE, Konstantinou K. Neuropathic pain in low back‐related leg pain patients: what is the evidence of prevalence, characteristics, and prognosis in primary care? A systematic review of the literature. J Pain 2017;18:1295–1312. [DOI] [PubMed] [Google Scholar]
- 22. Aminde LN, Dzudie A, Kengne AP. Prevalent diabetes mellitus in patients with heart failure and disease determinants in sub‐Saharan Africans having diabetes with heart failure: a protocol for a systematic review and meta‐analysis. BMJ Open 2016;6:e010097. [DOI] [PMC free article] [PubMed] [Google Scholar]
- 23. Nyaga VN, Arbyn M, Aerts M. Metaprop: a Stata command to perform meta‐analysis of binomial data. Arch Public Health 2014;72:39. [DOI] [PMC free article] [PubMed] [Google Scholar]
- 24. Diz JB, Leopoldino AA, Moreira BS, Henschke N, Dias RC, Pereira LS, et al. Prevalence of sarcopenia in older Brazilians: a systematic review and meta‐analysis. Geriatr Gerontol Int 2017;17:5–16. [DOI] [PubMed] [Google Scholar]
- 25. Pamoukdjian F, Bouillet T, Lévy V, Soussan M, Zelek L, Paillaud E. Prevalence and predictive value of pre‐therapeutic sarcopenia in cancer patients: a systematic review. Clin Nutr 2018;37:1101–1113. [DOI] [PubMed] [Google Scholar]
- 26. Ganna A, Ingelsson E. 5 year mortality predictors in 498,103 UK Biobank participants: a prospective population‐based study. Lancet 2015;386:533–540. [DOI] [PubMed] [Google Scholar]
- 27. Welsh CE, Celis‐Morales CA, Ho FK, Brown R, Mackay DF, Lyall DM, et al. Grip strength and walking pace and cardiovascular disease risk prediction in 406,834 UK Biobank participants. Mayo Clin Proc 2020;95:879–888. [DOI] [PubMed] [Google Scholar]
- 28. Nations U . Population. https://www.un.org/en/sections/issues‐depth/population/index‐2.html
- 29. WHO . Health inequities in the African Region of the World Health Organization: magnitudes, trends and sources. 2010. https://apps.who.int/iris/bitstream/handle/10665/112856/9789290231660.pdf?sequence=1&isAllowed=y
- 30. Bruyère O, Beaudart C, Ethgen O, Reginster J‐Y, Locquet M. The health economics burden of sarcopenia: a systematic review. Maturitas 2019;119:61–69. [DOI] [PubMed] [Google Scholar]
- 31. Rolland Y, Vellas B. In Fillit HM, Rockwood K, Woodhouse K, eds. Chapter 73—Sarcopenia. Philadelphia: W.B. Saunders; 2010. p 587–593. [Google Scholar]
- 32. Higgins JP, Thomas J, Chandler J, Cumpston M, Li T, Page MJ, et al. Cochrane Handbook for Systematic Reviews of Interventions. Hoboken, NJ: John Wiley & Sons; 2019. [DOI] [PMC free article] [PubMed] [Google Scholar]
- 33. Chen LK, Woo J, Assantachai P, Auyeung TW, Chou MY, Iijima K, et al. Asian Working Group for Sarcopenia: 2019 consensus update on sarcopenia diagnosis and treatment. J Am Med Dir Assoc 2020;21:300–307, e2. [DOI] [PubMed] [Google Scholar]
- 34. Sterne JAC, Sutton AJ, Ioannidis JPA, Terrin N, Jones DR, Lau J, et al. Recommendations for examining and interpreting funnel plot asymmetry in meta‐analyses of randomised controlled trials. BMJ 2011;343:d4002. [DOI] [PubMed] [Google Scholar]
- 35. Borges Migliavaca C, Stein C, Colpani V, Barker TH, Munn Z, Falavigna M, et al. How are systematic reviews of prevalence conducted? A methodological study. BMC Med Res Methodol 2020;20:96. [DOI] [PMC free article] [PubMed] [Google Scholar]
- 36. von Haehling S, Morley JE, Coats AJS, Anker SD. Ethical guidelines for publishing in the Journal of Cachexia, Sarcopenia and Muscle: update 2019. J Cachexia Sarcopenia Muscle 2019;10:1143–1145. [DOI] [PMC free article] [PubMed] [Google Scholar]
Associated Data
This section collects any data citations, data availability statements, or supplementary materials included in this article.
Supplementary Materials
Figure S1a. Prevalence of sarcopenia using the EWGSOP2.
Figure S1b. Prevalence of sarcopenia using the EWGSOP2 by region of origin.
Figure S1c. Prevalence of sarcopenia using the EWGSOP2 by age categories.
Figure S1d. Prevalence of sarcopenia using the EWGSOP2 in women.
Figure S1e. Prevalence of sarcopenia using the EWGSOP2 in men.
Figure S2a.1. Prevalence of sarcopenia using the EWGSOP (excluding those who reported the prevalence more than once using different cut‐off points).
Figure S2a.2. Prevalence of sarcopenia using the EWGSOP (all cut‐off points).
Figure S2b. Prevalence of sarcopenia using the EWGSOP by region of origin (excluding those who reported the prevalence more than once using different cut‐off points).
Figure S2c. Prevalence of sarcopenia using the EWGSOP by age categories (excluding those who reported the prevalence more than once using different cut‐off points).
Figure S2d.1. Prevalence of sarcopenia using the EWGSOP in women (excluding those who reported the prevalence more than once using different cut‐off points).
Figure S2d.2. Prevalence of sarcopenia using the EWGSOP in women (all cut‐off points).
Figure S2e.1. Prevalence of sarcopenia using the EWGSOP in men (excluding those who reported the prevalence more than once using different cut‐off points).
Figure S2e.2. Prevalence of sarcopenia using the EWGSOP in men (all cut‐off points).
Figure S3a. Prevalence of sarcopenia using the AWGS.
Figure S3b. Prevalence of sarcopenia using the AWGS by region of origin.
Figure S3c. Prevalence of sarcopenia using the AWGS by age categories.
Figure S3d. Prevalence of sarcopenia using the AWGS in women.
Figure S3e. Prevalence of sarcopenia using the AWGS in men.
Figure S4a. Prevalence of sarcopenia using the IWGS.
Figure S4b. Prevalence of sarcopenia using the IWGS by region of origin.
Figure S4c. Prevalence of sarcopenia using the IWGS by age categories.
Figure S4d. Prevalence of sarcopenia using the IWGS in women.
Figure S4e. Prevalence of sarcopenia using the IWGS in men.
Figure S5a. Prevalence of sarcopenia using the FNIH.
Figure S5b. Prevalence of sarcopenia using the FNIH by region of origin.
Figure S5c. Prevalence of sarcopenia using the FNIH by age categories.
Figure S5d. Prevalence of sarcopenia using the FNIH in women.
Figure S5e. Prevalence of sarcopenia using the FNIH in men.
Figure S6.a.1. Prevalence of sarcopenia using muscle mass (excluding those who reported the prevalence more than once using different cut‐off points).
Figure S6.a.2. Prevalence of sarcopenia using muscle mass (all cut‐off points).
Figure S6b. Prevalence of sarcopenia using muscle mass by region of origin (excluding those who reported the prevalence more than once using different cut‐off points).
Figure S6c. Prevalence of sarcopenia using muscle mass by age categories (excluding those who reported the prevalence more than once using different cut‐off points).
Figure S6d.1 Prevalence of sarcopenia using muscle mass in women (excluding those who reported the prevalence more than once using different cut‐off points)
Figure S6d.2 Prevalence of sarcopenia using muscle mass in women (all cut‐off points).
Figure S6e.1 Prevalence of sarcopenia using muscle mass in men (excluding those who reported the prevalence more than once using different cut‐off points)
Figure S6e.2. Prevalence of sarcopenia using muscle mass in men (all cut‐off points).
Figure S7. Overall meta‐regression by age.
Figure S7a. Meta‐regression by age using the EWGSOP2.
Figure S7b. Meta‐regression by age using the EWGSOP.
Figure S7c. Meta‐regression by age using the AWGS.
Figure S7d. Meta‐regression by age using the IWGS.
Figure S7e. Meta‐regression by age using the FNIH.
Figure S7f. Meta‐regression by age using muscle mass.
Figure S8. Prevalence of severe sarcopenia using different classifications.
Figure 9a. Prevalence of severe sarcopenia using the EWGSOP2.
Figure S9b. Prevalence of severe sarcopenia using the EWGSOP.
Figure S9c. Prevalence of severe sarcopenia using the AWGS.
Figure S9d. Prevalence of severe sarcopenia using the FNIH.
Figure S9e. Prevalence of severe sarcopenia using muscle mass.
Figure S10. Prevalence of severe sarcopenia in women.
Figure S11. Prevalence of severe sarcopenia using in men.
Figure S12. Prevalence of severe sarcopenia by age categories and muscle mass.
Table S1. Supporting Information