

Abstract
There is no consensus on the prevalence of sarcopenia or its impact on mortality in end‐stage renal disease patients undergoing dialysis. This review aimed to summarize the diagnostic criteria of sarcopenia and its prevalence and impact on the mortality of end‐stage renal disease patients undergoing dialysis. Embase, MEDLINE, PubMed, and Cochrane Library were searched from inception to 8 May 2021 to retrieve eligible studies that assessed muscle mass by commonly used instruments, such as dual‐energy X‐ray absorptiometry, bioelectrical impedance analysis, magnetic resonance imaging, and body composition monitor. Two assessment tools matched to study designs were employed to evaluate study quality. Pooled sarcopenia prevalence was calculated with 95% confidence interval (CI), and heterogeneity was estimated using the I 2 test. Associations of sarcopenia with mortality were expressed as hazard ratio (HR) and 95% CI. The search identified 3272 studies, and 30 studies (6162 participants, mean age from 47.5 to 77.5 years) were analysed in this review. The risk of bias in the included studies was low to moderate. Twenty‐two studies defined sarcopenia based on low muscle mass (LMM) plus low muscle strength and/or low physical performance, while eight studies used LMM alone. Muscle mass was assessed by different instruments, and a wide range of cut‐off points were used to define LMM. Overall, sarcopenia prevalence was 28.5% (95% CI 22.9–34.1%) and varied from 25.9% (I 2 = 94.9%, 95% CI 20.4–31.3%; combined criteria) to 34.6% (I 2 = 98.1%, 95% CI 20.9–48.2%; LMM alone) (P = 0.247 between subgroups). The statistically significant differences were not found in the subgroups of diagnostic criteria (P > 0.05) and dialysis modality (P > 0.05). Additionally, the sarcopenia prevalence could not be affected by average age [regression coefficient 0.004 (95% CI: −0.005 to 0.012), P = 0.406] and dialysis duration [regression coefficient 0.002 (95% CI −0.002 to 0.005), P = 0.327] in the meta‐regression. The pooled analyses showed that combined criteria of sarcopenia were related to a higher mortality risk [HR 1.82 (I 2 = 26.3%, 95% CI 1.38–2.39)], as was LMM [HR 1.61 (I 2 = 26.0%, 95% CI 1.31–1.99)] and low muscle strength [HR 2.04 (I 2 = 80.4%, 95% CI 1.19–3.5)]. Although there are substantial differences in diagnostic criteria, sarcopenia is highly prevalent in dialysis patients and is linked to increased mortality. The standardization of sarcopenia diagnostic criteria would be beneficial, and future longitudinal studies are needed to investigate the prevalence and prognostic value of sarcopenia in dialysis patients.
Keywords: Sarcopenia, Dialysis, Diagnosis, Prevalence, Mortality
Introduction
With the development of renal replacement therapies, including peritoneal dialysis (PD), haemodialysis (HD), kidney transplantation, and continuous renal replacement therapy (which is often used for acute renal failure), patients with end‐stage renal disease (ESRD) are routinely choosing treatment by PD, HD, and kidney transplantation to prolong their lifespan. 1 Because of the shortage of donor kidneys, PD and HD are increasingly chosen by patients with ESRD.
Existing literature suggests that sarcopenia is common among ESRD patients undergoing dialysis. Firstly, metabolic disorders and inflammation induced by kidney failure result in the development of sarcopenia. The former include nutritional deficiency, insulin resistance, diabetic nephropathy, acid–base imbalance, and electrolyte disorder. 2 The inflammatory processes mainly comprise the continuous release of pro‐inflammatory cytokines and oxidation stress damage. 3 Secondly, dialysis procedures stimulate protein degradation and reduce protein synthesis; these responses persist following dialysis, which might lead to loss of muscle mass. 4 , 5
In patients undergoing dialysis, sarcopenia appears to confer adverse health outcomes, for example, functional decline, physical falls, hospitalization, and even death. 6 Despite sarcopenia contributing to the poor prognosis of patients undergoing dialysis, the real clinical impact, especially related mortalities, has not been analysed. Furthermore, as the prevalence of sarcopenia in patients on dialysis has a wide range, its true impact on mortality is difficult to accurately ascertain.
One of the most important factors leading to the large variability in sarcopenia prevalence is the availability of different diagnostic criteria. There are more than four international recommended criteria, such as the diagnostic criteria developed by the European Working Group on Sarcopenia in Older People (EWGSOP), 7 , 8 Asian Working Group for Sarcopenia (AWGS), 9 , 10 Foundation for the National Institutes of Health Sarcopenia Project, 11 and International Working Group on Sarcopenia. 12
Future intervention researches for sarcopenia in dialysis patients need an accurate estimate of prevalence. However, the prevalence of sarcopenia is affected by the large variability in diagnostic criteria and characteristics of patients and varies too widely (4 13 –68% 14 ) to use for comparison. Therefore, we performed this review to provide a comprehensive picture of the diagnostic criteria and prevalence of sarcopenia in those treated by dialysis and interpret its predictive value in terms of overall mortality. We also conducted subgroup analysis and meta‐regression (e.g. dialysis modality, age, and duration of dialysis) with an attempt to identify dialysis patients with high risk of sarcopenia; this endeavour could guide the selection of preventions for sarcopenia in dialysis patients.
Methodology
Inclusion and exclusion criteria
When performing this review, we followed the Preferred Reporting Items for Systematic Reviews and Meta‐Analyses 2020 statement (PRISMA 2020) principles, 15 which is an updated set of guidelines from PRISMA 2009. 16 To be included, a study was required to meet five specific criteria: (i) conducted on adults with ESRD who received dialysis treatment; (ii) provided prevalence data for sarcopenia in patients undergoing dialysis; (iii) defined sarcopenia as the presence of low muscle mass (LMM) plus low muscle strength (LMS), and/or low physical performance (LPP), or LMM alone; (iv) detected muscle mass with instruments commonly used previous to the study, for example, dual‐energy X‐ray absorptiometry, bioelectrical impedance analysis, magnetic resonance imaging, and bioelectrical impedance spectroscopy; and (v) study types were cross‐sectional or retrospective or prospective.
Studies were excluded based on the following criteria: (i) sarcopenia diagnostic criteria were not reported; (ii) animal studies, reports, editorials, reviews, comments, or conference abstracts; and (iii) published in languages other than English.
Outcomes
The main outcomes of this review were (i) the methods used to diagnose sarcopenia, including diagnostic items, techniques for measurement, and sarcopenia threshold values, and (ii) sarcopenia prevalence in patients treated with dialysis and (iii) the impact of combined criteria (LMM plus LMS and/or LPP), LMM, LMS, and LPP on mortality in dialysis patients.
Study databases and searching strategy
Using Ovid SP, we systematically screened relevant articles published up to 8 May 2021 from the databases Embase, MEDLINE, PubMed, and Cochrane Library without language restrictions. The detailed search strategy is shown in Supporting Information, Table S1. We also screened the citations included in the articles found in the database search for additional pertinent studies.
Study selection
Two reviewers (X. S. and T. L.) screened the title and abstract of each search result independently while following the eligibility criteria to select possible studies for inclusion. Then, X. S. and T. L. separately reviewed the full text of these studies and decided on the final studies for inclusion. Lastly, X. S. and T. L. independently screened the citations used in the included papers to identify other studies meeting the search criteria. Any disagreement in study selection was resolved by discussing with a third, independent, reviewer (J. Y.). When the data used in two or more studies came from the same cohort, those with the largest sample size were included in the analysis.
Data extraction
Two reviewers (X. S. and Y. Z.) extracted the data independently using standardized templates suitable for research objectives. A third assessor (J. Y.) reviewed the data‐extraction steps, and any disagreements were discussed and resolved. The following variables were collected using a data collection form: name of the first author, publication date, country, study design, sample size, proportion of men, mean age, dialysis method, duration of dialysis, diagnostic method for sarcopenia, skeletal muscle mass assessment technique, prevalence of sarcopenia, and sarcopenia diagnostic criteria. Meanwhile, if possible, the hazard ratio (HR) and 95% confidence interval (CI) for the overall mortality associated with the combined criteria (LMM plus LMS and/or LPP), LMM, LMS, and LPP were extracted.
Assessing the risk of bias in the selected studies
The risk of bias in the studies selected for the review was separately estimated by X. S. and Y. Z. using the National Institutes of Health Quality Assessment Tool for Observational Cohort and Cross‐Sectional Studies—a validated procedure that assesses the quality of cohort and cross‐sectional studies 17 that includes 14 items that are applied to estimate selection, information, and measurement biases as well as confounding. Additionally, we selected a tool that was designed specifically for assessing the risk of bias in prevalence studies and has been proved to have high interrater agreement. 18 Ten items were used to address three domains of potential bias: measurement, selection, and analysis. A score of 8 or more was defined as low risk, 6 or 7 was considered moderate risk, and 5 or less was a high risk of bias. The arbitrator (J. Y.) was called upon to resolve disagreements among the reviewers.
Data analyses
Statistical analyses were carried out with STATA/MP (Version 14.0, StataCorp, College Station, TX, USA), and forest plots were created to visualize the results. Heterogeneity was estimated by the I 2 test, with I 2 cut‐off values of 25%, 50%, and 75% respectively representing low, medium, and high heterogeneity. 19 We applied a random‐effects model to calculate the pooled sarcopenia prevalence with a 95% CI when the I 2 index was interpreted as suggesting high heterogeneity; otherwise, the fixed‐effects model was used. In studies that evaluated sarcopenia by multiple diagnostic criteria, the prevalence most resembling the EWGSOP (2010) recommendation was pooled in the meta‐analysis. Additionally, to ascertain the impact of sarcopenia on mortality, the HR and 95% CI of the combined criteria (LMM plus LMS and/or LPP), LMM, LMS, and LPP were retrieved for meta‐analysis if possible. When we could extract HR and 95% CI from both univariate and multivariate analyses, the data from multivariate analyses were retrieved for meta‐analysis. Moreover, when both crude and adjusted HR and 95% CI were reported, adjusted HR and 95% CI were selected for data synthesis.
To investigate the possible reasons for heterogeneity, we performed subgroup analyses and meta‐regression on diagnostic criteria, dialysis modality, average age, and duration of dialysis. Sensitivity analysis was conducted to evaluate the quality and congruity of the results by deleting one study at a time. Publication bias was evaluated with the Egger test 20 and Begg test 21 (P < 0.05).
Results
Study selection
Figure 1 depicts the flow chart of the literature selection process. In all, 3272 records were collated from the database search. After removing duplicates, 2402 titles and abstracts were screened, resulting in 65 relevant studies for full‐text screening, which resulted in 29 of these studies being included in our review. We also found an additional article after screening the reference lists of these 29 studies. The reasons used to exclude some articles subsequent to the full‐text screening were shown in the flow chart and Table S2. Finally, we selected 30 articles, involving 6162 participants, that satisfied with all inclusion criteria for the systematic review and meta‐analysis.
Figure 1.
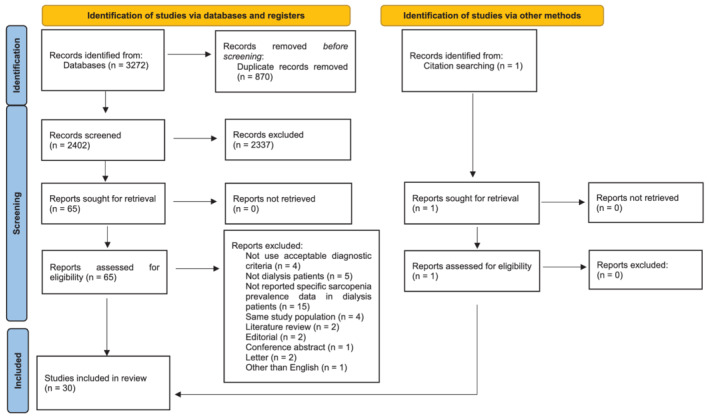
The flow chart of the literature selection.
Study characteristics
The characteristics of the included studies are summarized in Table 1. The 30 13 , 14 , 22 , 23 , 24 , 25 , 26 , 27 , 28 , 29 , 30 , 31 , 32 , 33 , 34 , 35 , 36 , 37 , 38 , 39 , 40 , 41 , 42 , 43 , 44 , 45 , 46 , 47 , 48 , 49 studies enrolled 6162 individuals who were included in the qualitative analysis. All of the included studies were published after 2013. Of these, 11 adopted a cross‐sectional design, 6 reported retrospective data, and 13 were prospective cohort studies. Twenty studies were conducted in HD populations, and 10 were conducted in PD populations. The mean age of the study participants ranged from 47.5 to 77.5 years, and the mean duration of dialysis ranged from 3 to 91.7 months. The included patients were sampled from a diversity of populations, including 14 studies conducted in Asia, 8 in America, and 8 in Europe (Table 1).
Table 1.
Characteristics of the included studies and main findings
| First author and year | Country | Study design | Sample size | Male, n (%) | Female, n (%) | Mean age (years) a | Dialysis method | Duration of dialysis (months) a | Prevalence of sarcopenia | Criteria (assessment method to detect sarcopenia) | HGS measure hand | Muscle mass measure time | Sarcopenia diagnostic criteria | ||
|---|---|---|---|---|---|---|---|---|---|---|---|---|---|---|---|
| Total, n (%) | Male, n (%) | Female, n (%) | |||||||||||||
| Lamarca (2014) 22 | Brazil | Cross‐sectional | 102 | 75 | 27 | 70.7 | HD | 27 | 13 (12.7%) | — | — |
LMM (BIA) LMS (HGS) |
Non‐fistula hand | After dialysis | EWGSOP (2010) |
| Isoyama (2014) 23 | Brazil | Prospective cohort | 330 | 203 | 127 | 53 | HD | — | 66 (20.0%) | — | — |
LMM (DXA) LMS (HGS) |
Dominant hand or non‐fistula hand | After dialysis | EWGSOP (2010) |
| Ren (2016) 24 | China | Prospective observational | 131 | 80 | 51 | 49.4 | HD | 71.3 | 18 (13.7%) | 12 (15.0%) | 6 (11.8%) |
LMM (BIA) LMS (HGS) |
Non‐fistula hand | Before dialysis | EWGSOP (2010) |
| Bataille (2017) 25 | France | Cross‐sectional | 111 | 65 | 46 | 77.5 | HD | 28.4 | 35 (31.5%) | 25 (38.5%) | 10 (21.7%) |
LMM (BIA) LMS (HGS) |
Dominant hand | — | EWGSOP (2010) |
| Greenhall (2017) 26 | UK | Retrospective | 490 | — | — | 55.3 | PD | 3 | 172 (35.1%) | — | — | LMM (BIA) | — | — | Othersb |
| Jin (2017) 27 | China | Prospective cohort | 117 | 57 | 60 | 60.8 | PD | 13.5 | 10 (8.6%) | — | — | LMM (BIA) | — | With peritoneal dialysate | Othersb |
| Kamijo (2018) 28 | Japan | Prospective cohort | 119 | 84 | 35 | 66.8 | PD | — | 13 (10.9%) | 11 (13.1%) | 2 (5.7%) |
LMM (BIA) LMS (HGS) LPP (10mGS) |
Dominant hand | — | AWGS (2014) |
| Kang (2017) 29 | Korea | Prospective cohort | 631 | 341 | 290 | 53.2 | PD | — | 303 (48.0%) | 175 (51.3%) | 128 (44.1%) | LMM (DXA) | — | After drained out peritoneal dialysate | Othersb |
| Kittiskulnam (2017) 30 | USA | Prospective cohort | 645 | 378 | 267 | 56.7 | HD | 33.6 | 90 (14.0%) | 53 (14.0%) | 37 (13.9%) |
LMM (BIS) LMS (HGS) LPP (4.6mGS) |
Non‐fistula hand | Before dialysis | EWGSOP (2010) |
| Malhotra (2017) 31 | USA | Retrospective | 122 | 76 | 46 | 47.5 | HD | 31 | 58 (47.5%) | 47 (61.8%) | 11 (23.9%) | LMM (DXA) | Non‐dialysis day | Othersb | |
| Abro (2018) 32 | UK | Retrospective | 155 | 95 | 60 | 63.0 | PD | 9 | 17 (11.0%) | — | — |
LMM (BIA) LMS (HGS) |
Dominant hand | After drained out peritoneal dialysate | EWGSOP (2010) |
| As'habi (2018) 33 | Iran | Cross‐sectional | 79 | 35 | 44 | — | PD | — | 9 (11.4%) | 8 (22.9%) | 1 (2.3%) |
LMM (BIA) LMS (HGS) LPP (4mGS) |
— | After drained out peritoneal dialysate | EWGSOP (2010) |
| Dierkes (2018) 34 | Norway | Cross‐sectional | 24 | 17 | 7 | 63 | HD | 48 | 10 (41.7%) | — | — |
LMM (BIA) LMS (HGS) |
— | After dialysis | EWGSOP (2010) |
| Giglio (2018) 35 | Brazil | Prospective observational | 170 | 111 | 59 | 70 | HD | 34.8 | 62 (36.5%) | 52 (46.8%) | 10 (16.9%) |
LMM (DXA) + formula LMS (HGS) |
Non‐fistula hand | After dialysis | EWGSOP (2010) |
| Lin (2018) 36 | China | Cross‐sectional | 120 | 63 | 57 | 63.33 | HD | 56.52 | 20 (16.7%) | 10 (15.9%) | 10 (17.5%) |
LMM (BIA) LMS (HGS) LPP (5mGS) |
Non‐fistula hand | — | EWGSOP (2010) |
| Yoowannakul (2018) 37 | UK | Retrospective | 600 | 373 | 227 | 66.3 | HD | 30.9 | 228 (38%) | 154 (41.3%) | 74 (32.6%) |
LMM (BIA) LMS (HGS) |
Dominant hand | After dialysis | EWGSOP (2010) |
| Yoowannakul (2018) 38 | UK | Retrospective | 434 | 239 | 195 | 56 | PD | 3 | 205 (47.2%) | 132 (55.2%) | 73 (37.4%) | LMM (BIA) | — | After drained out peritoneal dialysate | Othersb |
| Chiang (2019) 39 | USA | Prospective cohort | 440 | 440 | — | 56.16 | HD | 32.4 | 75 (17.0%) | 75 (17.0%) | — |
LMM (BIS) LMS (HGS) |
Both hands | Before dialysis | EWGSOP (2010) |
| Guida (2019) 43 | Italy | Cross‐sectional | 88 | 59 | 29 | 53.4 | PD | 15.9 | 39 (44.3%) | 22 (37.3%) | 17 (58.6%) | LMM (BIA) | — | After drained out peritoneal dialysate | Othersb |
| Kim (2019) 40 | Korea | Prospective observational | 142 | 81 | 61 | 59.8 | HD | 50.23 | 47 (33.1%) | 24 (29.6%) | 23 (37.7%) |
LMM (BIS) LMS (HGS) |
Non‐fistula hand | — | EWGSOP (2010) |
| Lin (2020) 41 | China | Prospective cohort | 126 | 65 | 61 | 63.2 | HD | 55.4 | 17 (13.5%) | 9 (13.8%) | 8 (13.1%) |
LMM (BIS) LMS (HGS) LPP (6mGS) |
Non‐fistula hand | Before dialysis | EWGSOP (2010) |
| Mori (2019) 42 | Japan | Prospective cohort | 308 | 185 | 123 | 58.06 | HD | 77.3 | 124 (40.3%) | 69 (37.3%) | 55 (44.7%) |
LMM (DXA) LMS (HGS) |
Both hands | After dialysis | AWGS (2014) |
| da Silva (2019) 13 | Brazil | Cross‐sectional | 50 | 24 | 26 | 55.74 | PD | 9.5 | 2 (4.0%) | — | — |
LMM (DXA) LMS (HGS) LPP (4mGS) |
— | — | EWGSOP (2010) |
| Kim (2020) 46 | Korea | Retrospective | 160 | 109 | 51 | 55.1 | PD | 21.8 | 22 (13.8%) | — | — |
LMM (BIS) LMS (HGS) |
Dominant hand | — | Othersb |
| Medeiros (2020) 44 | Brazil | Cross‐sectional | 92 | — | — | 63.3 | HD | — | 50 (54.3%) | — | — |
LMM (BIA) LMS (HGS) LPP (4mGS) |
Non‐fistula hand | After dialysis | EWGSOP (2010) |
| Slee (2020) 45 | UK | Cross‐sectional | 87 | 63 | 24 | 61.68 | HD | 65.9 | 38 (43.7%) | — | — |
LMM (BIA) LMS (HGS) |
— | After dialysis | EWGSOP (2010) |
| Song (2020) 47 | Korea | Prospective observational | 88 | 50 | 38 | 60.6 | HD | 50.8 | 36 (40.9%) | — | — | LMM (BIS) | Non‐fistula hand | — | Othersb |
| Matsuzawa (2021) 14 | Japan | Cross‐sectional | 50 | 29 | 21 | 77.5 | HD | 38.5 | 34 (68%) | 21 (72.4%) | 13 (61.9%) |
LMM (BIA) LMS (HGS) LPP (4mGS) |
Both hands | After dialysis | AWGS (2019) |
| Miyazaki (2021) 48 | Japan | Cross‐sectional | 20 | 14 | 6 | 76.5 | HD | 91.7 | 11 (55%) | — | — |
LMM (DXA) LMS (HGS) LPP (6mGS) |
— | — | AWGS (2019) |
| Takata (2021) 49 | Japan | Prospective observational | 131 | 88 | 43 | 66.9 | HD | — | 8 (6.1%) | 4 (4.5%) | 4 (9.3%) | LMM (BIA) | — | — | Othersb |
AWGS, Asian Working Group for Sarcopenia; BIA, bioelectrical impedance analysis; BIS, bioelectrical impedance spectroscopy; DXA, dual‐energy X‐ray absorptiometry; EWGSOP, European Working Group on Sarcopenia in Older People; HGS, handgrip strength; LMM, lower muscle mass; LMS, lower muscle strength; LPP, lower physical performance.
Mean or median as reported.
Sarcopenia diagnostic criteria other than EWGSOP (2010), EWGSOP (2019), AWGS (2014), and AWGS (2019).
Risk of bias in the included studies
The overall quality of included studies was moderate when assessed by the National Institutes of Health Quality Assessment Tool for Observational Cohort and Cross‐Sectional Studies 17 (full details in Figure S1). Similarly, when appraised by prevalence studies assessment, 16 studies classed as moderate risk of bias studies and 14 classed as low risk of bias studies 18 (Figure S2).
Diagnostic method and prevalence of sarcopenia in dialysis patients
Table 2 summarized the commonly used diagnostic criteria of sarcopenia. Twenty‐two studies defined sarcopenia by LMM plus LMS and/or LPP, 17 of them defined sarcopenia by EWGSOP criteria, and 4 of them defined sarcopenia by AWGS criteria. Eight studies used only LMM to diagnose sarcopenia. Different measurement methods and cut‐off values were utilized to identify LMM, LMS, and LPP in these studies (Table 3). Muscle mass assessments were conducted with dual‐energy X‐ray absorptiometry (17 studies), bioelectrical impedance analysis (8 studies), and bioelectrical impedance spectroscopy (5 studies), and more than 10 cut‐off points were used to identify LMM. Muscle strength was assessed by handgrip dynamometry; the cut‐off points for identifying LMS varied from 16 to 20.7 kg in women and 26 to 36.6 kg in men. Physical performance was detected by walk tests with different walking distance, ranging from 4 to 10 m; the cut‐off points for identifying LPP were a gait speed <0.8 or <1.0 m/s.
Table 2.
Diagnostic criteria of sarcopenia
| Low muscle mass (ASM) | Low muscle strength (HGS) | Lower physical performance (GS) | Sarcopenia diagnosis | |
|---|---|---|---|---|
| AWGS (2014) |
ASM/height2 <7.0 kg/m2 for men and <5.4 kg/m2 for women by using DXA ASM/height2 <7.0 kg/m2 for men and <5.7 kg/m2 for women by using BIA |
HGS < 26 kg for men and <18 kg for women | Usual gait speed <0.8 m/s for both sexes | Sarcopenia: LMM plus LMS and/or LPP |
| AWGS (2019) |
ASM/height2 <7.0 kg/m2 for men and <5.4 kg/m2 for women by using DXA ASM/height2 <7.0 kg/m2 for men and <5.7 kg/m2 for women by using BIA |
HGS < 28 kg for men and <18 kg for women | Usual gait speed <1.0 m/s for both sexes |
Possible sarcopenia: LMS or LPP Sarcopenia: LMM plus LMS or LPP Severe sarcopenia: LMM plus LMS and LPP |
| EWGSOP (2010) | ASM/height2 <7.26 kg/m2 for men and <5.5 kg/m2 for women | HGS < 30 kg for men and <20 kg for women | Usual gait speed ≤0.8 m/s for both sexes |
Pre‐sarcopenia: LMM Sarcopenia: LMM plus LMS or LPP Severe sarcopenia: LMM plus LMS and LPP |
| EWGSOP (2019) | ASM/height2 <7.0 kg/m2 for men and <5.5 kg/m2 for women | HGS < 27 kg for men and <16 kg for women | Usual gait speed ≤0.8 m/s for both sexes |
Possible sarcopenia: LMS Sarcopenia: LMM plus LMS Severe sarcopenia: LMM plus LMS and LPP |
| FINH | ALM/BMI < 0.789 for men and <0.512 for women | HGS < 26 kg for men and <16 kg for women | — | Sarcopenia: LMM plus LMS |
| IWGS | ASM/height2 <7.23 kg/m2 for men and <5.67 kg/m2 for women | — | Usual gait speed <1.0 m/s for both sexes | Sarcopenia: LMM plus LPP |
ALM/BMI, appendicular lean mass/body mass index; ASM, appendicular skeletal muscle; AWGS, Asian Working Group for Sarcopenia; BIA, bioelectrical impedance analysis; DXA, dual‐energy X‐ray absorptiometry; EWGSOP, European Working Group on Sarcopenia in Older People; FNIH, Foundation for the National Institutes of Health Sarcopenia Project; GS, gait speed; HGS, handgrip strength; IWGS, International Working Group on Sarcopenia; LMM, lower muscle mass; LMS, lower muscle strength; LPP, lower physical performance.
Table 3.
The details of diagnostic criteria and cut‐off points of each study
| Low muscle mass | References | |
|---|---|---|
| BIA | 1. EWGSOP (2010) Janssen et al. (2004) 69 : SMI < 10.76 kg/m2 for men and <6.76 kg/m2 for women | Ren et al. (2016), 24 Lin et al. (2018), 36 As'habi et al. (2018), 33 Lin et al. (2020), 41 Medeiros et al. (2020), 44 Slee et al. (2020), 45 Malhotra et al. (2017), 31 Greenhall et al. (2017) 26 |
| 2. EWGSOP (2010) Chien et al. (2008) 70 : MMI < 8.87 kg/m2 for men and <6.42 kg/m2 for women | Bataille et al. (2017), 25 Dierkes et al. (2018) 34 | |
| 3. EWGSOP (2010) Newman et al. (2003) 71 : ASMI < 7.23 kg/m2 for men and <5.67 kg/m2 for women | Yoowannakul et al. (2018), 37 Abro et al. (2018) 32 | |
| 4. EWGSOP (2010) Baumgartner et al. (1998) 72 : SMI ≥ 2 SD below sex‐specific means of healthy young adults | Yoowannakul et al. (2018) 38 | |
| 5. EWGSOP (2010) 73 : LBMI > 2 SD below means of young individuals (men: <15.9 kg/m2; women: <12.8 kg/m2) | Lamarca et al. (2014) | |
| 6. EWGSOP (2010) Janssen et al. (2002) 74 : SM/BW < 37% for men and <28% for women | Guida et al. (2019) 43 | |
| 7. AWGS (2014 or 2019) 9 , 10 : SMI < 7.0 kg/m2 for men and 5.7 kg/m2 for women | Jin et al. (2017), 27 Kamijo et al. (2018), 28 Matsuzawa et al. (2021), 14 Takata et al. (2021) 49 | |
| DXA | 1. EWGSOP (2010) Baumgartner et al. (1998) 72 : ASMI < 7.3 kg/m2 in men and <5.5 kg/m2 in women | Isoyama et al. (2014), 23 Giglio et al. (2018), 35 da Silva et al. (2019) 13 |
| 2. AWGS (2014) 9 : SMI < 7.0 kg/m2 for men and 5.4 kg/m2 for women | Mori et al. (2019), 42 Miyazaki et al. (2021) 48 | |
| 3. FNIH 11 : ALM/BMI < 0.789 for men and <0.512 for women | Kang et al. (2017) 29 | |
| BIS | 1. EWGSOP (2010) Janssen et al. (2004) 69 : muscle mass of ≥2 SD below sex‐specific means of healthy young adults | Kittiskulnam et al. (2017), 30 Chiang et al. (2019), 39 Kim et al. (2019) 40 |
| 2. Marcelli et al. (2015) 75 : LTI below the 10th percentile of a reference population | Kim et al. (2020), 46 Song et al. (2020) 47 | |
| Low muscle strength | References | |
|---|---|---|
| HGS | 1. EWGSOP (2010) Lauretani et al. (2003) 76 : HGS < 30 kg for men and <20 kg for women | Isoyama et al. (2014), 23 Ren et al. (2016), 24 Bataille et al. (2017), 25 Dierkes et al. (2018), 34 Giglio et al. (2018), 35 Yoowannakul et al. (2018), 37 Lin et al. (2018), 36 Abro et al. (2018), 32 Kim et al. (2019), 40 da Silva et al. (2019), 13 Lin et al. (2020), 41 Medeiros et al. (2020), 44 Slee et al. (2020), 45 Song et al. (2020) 47 |
| 2. AWGS (2014) 9 : HGS < 26 kg for men and <18 kg for women | Kamijo et al. (2018), 28 As'habi et al. (2018), 33 Chiang et al. (2019), 39 Mori et al. (2019) 42 | |
| 3. AWGS (2019) 10 : HGS < 28 kg for men and <18 kg for women | Miyazaki et al. (2021) 48 | |
| 4. FINH 11 : HGS < 26 kg for men and <16 kg for women | Kittiskulnam et al. (2017) 30 | |
| 5. Kim et al. (2018) 77 : HGS < 28.9 kg in men and <16.8 kg in women | Kim et al. (2020) 46 | |
| 6. Schlüssel et al. (2008) 78 : HGS < 10th percentile of young individuals (men: right <36.6 kg and left <34.7 kg; women: right <20.7 kg and left <20.1 kg) | Lamarca et al. (2014) 22 | |
| Lower physical performance | References | |
|---|---|---|
| 4mGS | 1. AWGS (2014) and EWGSOP (2010) Lauretani et al. 76 : GS < 0.8 m/s | As'habi et al. (2018), 33 da Silva et al. (2019), 13 Medeiros et al. (2020), 44 Matsuzawa et al. (2021) 14 |
| 4.6mGS | 1. FNIH 11 : walking speed <0.8 m/s | Kittiskulnam et al. (2017) 30 |
| 5mGS | 1. EWGSOP (2010) GS < 1.0 m/s | Lin et al. (2018) 36 |
| 6mGS | 1. EWGSOP (2010) GS < 0.8 m/s | Lin et al. (2020), 41 Miyazaki et al. (2021) 48 |
| 10mGS | 1. AWGS (2014) GS < 0.8 m/s | Kamijo et al. (2018) 28 |
ALM/BMI, appendicular lean mass/body mass index; ASMI, appendicular skeletal muscle index; AWGS, Asian Working Group for Sarcopenia; BIA, bioelectrical impedance analysis; BIS, bioelectrical impedance spectroscopy; DXA, dual‐energy X‐ray absorptiometry; EWGSOP, European Working Group on Sarcopenia in Older People; FNIH, Foundation for the National Institutes of Health Sarcopenia Project; GS, gait speed; HGS, handgrip strength; LBMI, lean body mass index; LTI, lean tissue index; MMI, muscle mass index; SD, standard deviation 79 ; SM/BW, skeletal muscle/body weight; SMI, skeletal muscle mass index.
In the 30 studies included, sarcopenia prevalence wide ranged from 4% to 68% (Table 1), and the pooled estimated prevalence was 28.5% (I 2 = 96.7%, 95% CI 22.9–34.1%; Figure 2).
Figure 2.
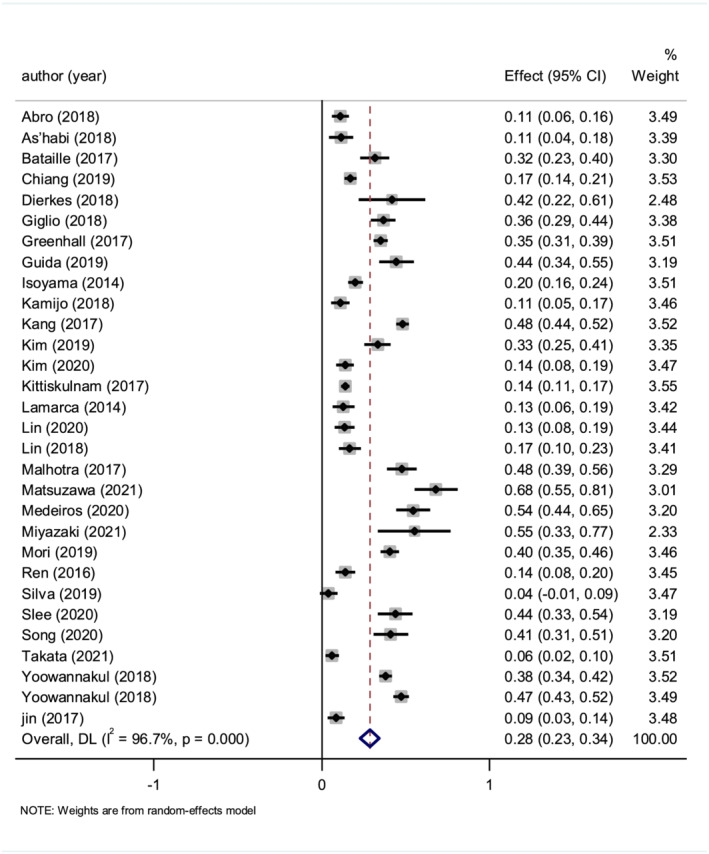
The pooled estimate prevalence of sarcopenia in dialysis patients.
Subgroup analysis: sarcopenia definition, diagnostic criteria, and dialysis modality
The prevalence of sarcopenia in studies only using LMM [34.6% (I 2 = 98.1%, 95% CI 20.9–48.2%, 8 studies, 2101 cases)] were seemly higher than those defining sarcopenia using combined criteria [LMM plus LMS and/or LPP, 25.9% (I 2 = 94.9%, 95% CI 20.4–31.3%, 22 studies, 4061 cases)]; however, the difference did not exhibit statistical significance (P = 0.247, Figure S3). Additionally, the prevalence of sarcopenia defined by EWGSOP criteria [23.4% (I 2 = 94.2%, 95% CI 17.8–29.0%, 17 studies, 3404 cases)] was lower than the prevalence defined by AWGS criteria [42.6% (I 2 = 96.9%, 95% CI 18.7–66.6%, 4 studies, 497 cases)] and other criteria [32.2% (I 2 = 98.0%, 95% CI 19.6–44.8%, 9 studies, 2261 cases)]; however, the difference was not statistically significant (P = 0.165, Figure S3). Similarly, the prevalence of sarcopenia was revealed to be higher in HD populations [31% (I 2 = 95.5%, 95% CI 24.7–37.3%, 20 studies, 3839 cases)] than PD populations [23.4% (I 2 = 98.0%, 95% CI 11.9–34.9%, 10 studies, 2323 cases)]; however, the difference was not statistically significant (P = 0.255, Figure S3).
Meta‐regression: average age and duration of dialysis
The pooled data on average age showed that it did not affect sarcopenia prevalence in the meta‐regression [regression coefficient 0.004 (95% CI: −0.005 to 0.012), P = 0.406, 29 studies, 6083 cases] (Figure S4). Additionally, the effect size could not be predicted using the duration of dialysis in the meta‐regression [regression coefficient 0.002 (95% CI −0.002 to 0.005), P = 0.327, 24 studies, 4780 cases] (Figure S5).
Impact of combined criteria (low muscle mass plus low muscle strength and/or low physical performance), low muscle mass, and low muscle strength on mortality
Data from 10 studies were available to meta‐analyse mortality (Table 4). Patients who were diagnosed with sarcopenia by combined criteria (LMM plus LMS and/or LPP) had, on average, a higher risk of mortality than those without sarcopenia [HR 1.82 (I 2 = 26.3%, 95% CI 1.38–2.39), 6 studies, 1683 cases, Figure S6] and those diagnosed via LMM [HR 1.61 (I 2 = 26%, 95% CI 1.31–1.99), 8 studies, 2319 cases, Figure S7]. The fixed‐effect model was chosen because of the consistency between studies for the earlier associations. Moreover, patients with LMS were also confirmed to have a higher risk of mortality [HR 2.04 (I 2 = 80.4%, 95% CI 1.19–3.5), 6 studies, 1566 cases, Figure S8] than those possessing normal muscle strength. For the relationship between LMS and the risk of mortality, the random‐effects model was chosen, as suitable for the high between‐study heterogeneity (I 2 = 80.4%).
Table 4.
The impact of sarcopenia on mortality in dialysis patients
| First author and year | Univariate HR (95% CI) | Multivariate HR (95% CI) without adjustment | Multivariate HR (95% CI) with adjustment | Adjustment factors | Follow‐up time (months) a |
|---|---|---|---|---|---|
| Isoyama (2014) 23 |
Combined criteriab: 1.93 (1.01–3.71) LMM: 1.23 (0.56–2.67) LMS: 1.98 (1.01–3.87) |
Age, sex, diabetes, CVD, cholesterol, haemoglobin, GFR, and hs‐CRP | 29 | ||
| Kamijo (2018) 28 |
LMM: 1.9 (0.74–4.89) LMS: 0.95 (0.77–1.17) |
Age, gender, walking speed, SMI, grip strength, and CFS | 19.6 | ||
| Kang (2017) 29 | LMM: 1.74 (1.35–2.24) | LMM: 1.71 (1.28–2.26) | 48 | ||
| Kittiskulnam (2017) 30 |
Combined criteriab: 1.65 (0.88–3.08) LMM: 1.70 (0.94–3.05) LMS: 1.68 (1.01–2.79) LPP: 2.25 (1.36–3.74) |
Age, sex, race, co‐morbidities (diabetes mellitus, congestive heart failure, and coronary artery disease), and serum albumin | 22.8 | ||
| Malhotra (2017) 31 | LMM: 0.41 (0.15–1.1) | Age, gender, and sarcopenia obesity definitions | 44 | ||
| Giglio (2018) 35 |
Combined criteria b : 2.02 (1.14–3.57) LMM: 1.49 (0.79–2.82) LMS: 2.03 (1.09–3.79) |
Combined criteriab: 2.09 (1.05–4.20) LMM: 1.60 (0.73–3.53) LMS: 1.84 (0.92–3.68) |
Age, gender, dialysis, vintage, and diabetes mellitus | 36 | |
| Kim (2019) 40 |
Combined criteriab: 6.99 (1.84–26.58) LMM: 2.77 (1.1–6.97) LMS: 5.65 (1.99–16.04) |
Age, gender, BMI, Kt/V, albumin, diabetes, dialysis vintage, hs‐CRP, and previous history of coronary artery disease and cerebrovascular disease | 51.6 | ||
| Mori (2019) 42 | Combined criteriab: 1.31 (0.81–2.1) | 76 | |||
| Kim (2020) 46 |
LMM: 1.98 (0.6–6.48) LMS: 2.97 (0.91–7.1) |
Age, gender, BMI, dialysis duration, diabetes, serum level of albumin, CAD, and PAOD | 24 | ||
| Song (2020) 47 | Combined criteriab: 2.72 (1.11–6.63) | Age, gender, BMI, diabetes, CAD, CVD, PAOD, and dialysis vintage | 62.4 |
BMI, body mass index; CAD, coronary artery disease; CFS, Clinical Frailty Scale; CI, confidence interval; CVD, cerebrovascular disease; GFR, glomerular filtration rate; HR, hazard ratio; hs‐CRP, high‐sensitivity C‐reactive protein; Kt/V, fractional clearance index for urea; LMM, lower muscle mass; LMS, lower muscle strength; LPP, lower physical performance; PAOD, peripheral artery occlusive disease; SMI, skeletal muscle index.
Mean or median as reported.
Combined criteria: LMM and either LMS or LPP.
Publication bias and sensitivity analyses
No publication bias was detected in articles describing the prevalence of sarcopenia in patients on dialysis (Egger test: P = 0.092; Begg test: P = 0.054). Sensitivity analysis detected that the pooled prevalence of sarcopenia was not significantly affected by any individual study (Figure S9).
Discussion
This review describes the sarcopenia prevalence in patients on dialysis and how it was affected by the various definitions of sarcopenia. The varied prevalence of sarcopenia may partly be explained by the variability of the definitions. However, there were no statistical differences between the different diagnostic items and different dialysis methods. Moreover, age and dialysis duration were not found to affect the prevalence of sarcopenia. Additionally, the pooled analyses indicated that combined criteria of sarcopenia (LMM plus LMS and/or LPP), LMM, and LMS in dialysis patients were all explicitly associated with an increased risk of mortality.
Because of exposure to long‐term conditions of oxidation stress and metabolic dysregulation, together with loss of nutrients into the dialysate, protein‐energy wasting (PEW) 50 , 51 presents universally in patients undergoing dialysis. Sarcopenia is both the main diagnostic criterion of PEW and an important manifestation of PEW, and its incidence is higher in dialysis patients. At present, the mechanism of sarcopenia in dialysis patients is not completely clear, but some mechanisms already explored include (i) chronic low‐grade inflammation: firstly, kidney function deteriorates, then oxidative stress is activated, uraemic toxins accumulate, and abnormally high levels of reactive oxygen species 52 and uraemic toxins stimulate the occurrence of inflammatory reactions. 53 Secondly, the decline of renal function results in a reduced capacity to excrete inflammatory factors, which leads to the persistence of the inflammatory response 3 ; therefore, inflammatory cytokines, for example, tumour necrosis factor‐α, and interleukin‐6 and interleukin‐1, are often significantly increased in patients with ESRD, 54 , 55 , 56 which increases the degradation and decreases the synthesis of muscle protein, resulting in muscle atrophy. 57 (ii) Changes in hormone levels: an imbalance of hormone levels, presenting as decreasing levels of growth hormone, sex hormones (especially testosterone), insulin, and insulin‐like growth factor‐1, 58 and increasing parathyroid hormone, 59 glucocorticoids, and angiotensin II, 60 and their interaction with the corresponding hormone receptor cause decreased protein synthesis and increased protein decomposition, eventually leading to the emergence of sarcopenia. 2 , 5 (iii) Changes in living status: reductions in appetite due to metabolic waste accumulation and some prescribed drugs, the imbalance of appetite‐regulating hormones, dietary restrictions, and gastrointestinal fullness may all lead to insufficient protein intake. 61 Meanwhile, restricted activity during and fatigue after dialysis shortens the time taken for physical activity, which impairs muscle function. (iv) Protein loss during dialysis: both HD and PD procedures stimulate protein degradation and reduce protein synthesis, and these responses persist following dialysis, 4 , 5 also leading to loss of muscle mass. Of note, the mechanism of sarcopenia in dialysis patients is complicated and remains an aspect of research that merits consideration in the future.
Sarcopenia definitions used in diagnosing dialysis patients include LMM alone or combined criteria (LMM plus LMS and/or LPP), such as EWGSOP criteria, AWGS criteria, Foundation for the National Institutes of Health criteria, and International Working Group on Sarcopenia criteria. When only LMM was assessed, the pooled prevalence was estimated at 34.6%, while assessed combined criteria (LMM plus LMS and/or LPP) lowered it to 25.9%. The prevalence of sarcopenia presented an increasing trend in studies that used LMM alone, although the difference was not statistically significant. However, this merged result was lacking robustness caused by the high heterogeneity and small sample size of some studies among the included literature. For example, in two included articles that both diagnosed sarcopenia by combined criteria (LMM plus LMS and/or LPP), one reported the prevalence of sarcopenia in dialysis as 4%, 13 while the value in the other was 68%, 14 and both only involved 50 cases. The random‐effects model was applied in response to the high heterogeneity between the studies; however, the differences between the two groups became statistically significant when we implemented the fixed‐effects model, and this further proved that the merged result was not satisfactorily robust and the conclusion lacked reliability. At the same time, there was no statistical evidence of a difference between PD and HD populations, but sarcopenia seemed to be more prevalent in HD patients than PD patients. The present studies show that, compared with HD, PD has some advantages in preserving muscle mass and muscle function. Firstly, younger patients with ESRD who are in better physical condition are more likely to choose PD, as they are likely to have muscles of a better status. Secondly, compared with HD patients, PD‐treated patients have well‐preserved residual renal function and fewer complications. 62 Additionally, PD is associated with better cognitive function 63 and life quality 62 than HD. All of these advantages of PD result in the conservation of muscle mass and muscle function.
Although sarcopenia has been traditionally seen as a condition associated with age, controversially, the age of the patients failed to demonstrate any clear influence on sarcopenia prevalence in our systematic review, implicating the importance of screening sarcopenia even in young dialysis patients. Of course, this relationship requires verification in studies with large dialysis cohorts. Moreover, the regression analysis suggested that the duration of dialysis had no significant effect on the incidence of sarcopenia. This result might relate to the fact that most of the included studies were interested in patients during the maintaining dialysis stage, whose physical condition tends to be relatively steady. As shown in the studies, physical function was in obvious decline for 3 months and mortality rates were consistently higher in the first 4 months after starting dialysis. However, the physical condition of dialysis patients is relatively steady in the maintaining dialysis stage, in which prolonged dialysis times may not have a significant effect on their physical condition. 64 , 65
In the general population, obesity is linked to a higher risk of cardiovascular disease and mortality. However, some studies found that elevated body mass index (BMI) was associated with improved survival in dialysis patients, which was described as the ‘obesity paradox’. 66 , 67 , 68 The reason for this contradiction may lie in the decrease in BMI in dialysis patients that signifies the development or progression of sarcopenia, PEW, and cachexia, which have a clear association with poor prognoses in dialysis patients. The pooled analyses of 10 studies showed that the combined criteria of sarcopenia (LMM plus LMS and/or LPP) as well as LMM alone and LMS alone are strong mortality predictors. Compared with LMM, LMS was more robustly associated with mortality. Underpinning this, LMS is considered a component of severe sarcopenia. Because only one of the 10 studies measured LPP, we could not apply a meta‐analysis. However, this study indicated that the risk of death in dialysis patients with LPP is significantly increased. Therefore, for some settings in which it is difficult to measure multiple items of sarcopenia, such as ICUs, one or two of the items can have prognostic value.
To our best knowledge, this systematic review is the first to compare the diagnostic methods and prevalence of sarcopenia in dialysis patients. The study provides an up‐to‐date and accurate estimation of sarcopenia prevalence among the dialysis population, which is necessary in the calculation of sample size for future intervention studies in this arena. Additionally, in the randomized placebo‐controlled trials, the prevalence of the placebo group can compare with this meta‐analysis to ensure the placebo group has the expected prevalence. Meanwhile, understanding baseline patient characteristics that increase sarcopenia is critical for balanced randomization in interventional trials to prevent sarcopenia. Although the subgroup analysis did not find statistically significant population characteristics that increased the risk of sarcopenia, it was found that HD had a higher tendency to suffer from sarcopenia than PD. Moreover, it was found that sarcopenia was consistently associated with mortality in dialysis patients, which reinforces that the widespread and early clinical implementation of sarcopenia screening should help identify those at an increased risk of future health issues and help direct preventive therapies. For dialysis patients with sarcopenia, we should not only treat their medical disorders but also intervene in the progression of their sarcopenia to improve their prognoses and reduce their family and social healthcare burdens.
As with most studies, the design of this review was not without some limitations. Firstly, we only included literature released in English publications, which might have lent a selective bias to this review. Secondly, there was significant heterogeneity between the included studies in terms of the diagnostic methods, measurement approaches, and diagnostic thresholds, and so forth. Secondly, most of the included studies were cross‐sectional and had small cohorts, which can also lead to some between‐study heterogeneity. It is crucial, therefore, that future studies employ not only standardized methods of sarcopenia diagnosis but also adequate sample sizes to improve the quality of the original research. Thirdly, despite extracting adjusted estimates for multivariate analyses from the contributing studies, residual bias and confounding remain a possibility. Finally, although this review included studies from different continents (Asia, Europe, North America, and South America), data from Africa were not available, which limits its worldwide applicability.
Conclusions
Sarcopenia is an important clinical condition shown to be prevalent in a clinically significant proportion of dialysis patients that is associated with a higher mortality risk. However, the clinical heterogeneity caused by the different diagnostic criteria, assessment procedures, and diagnostic thresholds for sarcopenia is substantial. Effective diagnostic criteria are key to the expeditious identification of sarcopenia in patients, and future longitudinal studies are needed to optimize management strategies aiming to improve individuals' lives and reduce family and social healthcare burdens.
Author contributions
X.S. and J.Y. were involved in the study design, study protocol development, all analyses, and the management of all aspects of the systematic review. All co‐authors were involved in the literature search and participated in screening, full‐text reviewing, and data extracting. J.Y. provided advice on the analyses and aided in their interpretation. X.S. contributed to the writing of the final manuscript, and all co‐authors approved the final version for submission.
Conflict of interest
None declared.
Funding
This study was supported by grants from Chinese National Science & Technology Pillar Program (2020YFC2005600/02); Sichuan Province Science and Technology Support Program (2019YFS0277 and 2021YFS0136); 1·3·5 Project for Disciplines of Excellence—Clinical Research Incubation Project, West China Hospital, Sichuan University (19HXFH012); 1·3·5 Project for Disciplines of Excellence, West China Hospital, Sichuan University (ZYJC21005); and National Clinical Research Center for Geriatrics, West China Hospital, Sichuan University (Z20191003 and Z2018B13).
Supporting information
Table S1. Search strategy by Embase, Medline, Pubmed, and Cochrane library via Ovid SP.
Table S2. The reasons for the exclusion of full‐text articles.
Figure S1. Risk of bias of the included studies using the National Institutes of Health Quality Assessment Tool for Observational Cohort and Cross‐Sectional Studies.
Figure S2. Risk of bias of the included studies using assessment tool explicitly for prevalence studies.
Figure S3. Prevalence of sarcopenia in dialysis patients according to different sarcopenia definition, diagnostic criteria, and dialysis modality.
Figure S4. Meta‐regression of the effect of average age on sarcopenia prevalence.
Figure S5. Meta‐regression of the effect of dialysis duration on sarcopenia prevalence.
Figure S6. Impact of combined criteria of sarcopenia (LMM plus LMS and/or LPP) on mortality in dialysis patients.
Figure S7. Impact of LMM on mortality in dialysis patients.
Figure S8. Impact of LMS on mortality in dialysis patients.
Figure S9. Sensitivity analysis.
Acknowledgement
We thank Dr Chenkai Wu for providing editorial assistance to the manuscript.
Shu X., Lin T., Wang H., Zhao Y., Jiang T., Peng X., and Yue J. (2022) Diagnosis, prevalence, and mortality of sarcopenia in patients undergoing dialysis: a systematic review and meta‐analysis, Journal of Cachexia, Sarcopenia and Muscle, 13, 145–158, 10.1002/jcsm.12890
References
- 1. Robinson BM, Akizawa T, Jager KJ, Kerr PG, Saran R, Pisoni RL. Factors affecting outcomes in patients reaching end‐stage kidney disease worldwide: differences in access to renal replacement therapy, modality use, and haemodialysis practices. Lancet 2016;388:294–306. [DOI] [PMC free article] [PubMed] [Google Scholar]
- 2. Fahal IH. Uraemic sarcopenia: aetiology and implications. Nephrol Dial Transplant 2014;29:1655–1665. [DOI] [PubMed] [Google Scholar]
- 3. Stenvinkel P, Alvestrand A. Inflammation in end‐stage renal disease: sources, consequences, and therapy. Semin Dial 2002;15:329–337. [DOI] [PubMed] [Google Scholar]
- 4. Rajakaruna G, Caplin B, Davenport A. Peritoneal protein clearance rather than faster transport status determines outcomes in peritoneal dialysis patients. Perit Dial Int 2015;35:216–221. [DOI] [PMC free article] [PubMed] [Google Scholar]
- 5. Wang XH, Mitch WE. Mechanisms of muscle wasting in chronic kidney disease. Nat Rev Nephrol 2014;10:504–516. [DOI] [PMC free article] [PubMed] [Google Scholar]
- 6. Sabatino A, Cuppari L, Stenvinkel P, Lindholm B, Avesani CM. Sarcopenia in chronic kidney disease: what have we learned so far? J Nephrol 2021;34:1347–1372. [DOI] [PMC free article] [PubMed] [Google Scholar]
- 7. Cruz‐Jentoft AJ, Baeyens JP, Bauer JM, Boirie Y, Cederholm T, Landi F, et al. Sarcopenia: European consensus on definition and diagnosis: Report of the European Working Group on Sarcopenia in Older People. Age Ageing 2010;39:412–423. [DOI] [PMC free article] [PubMed] [Google Scholar]
- 8. Braun T. Sarcopenia: revised European consensus on definition and diagnosis. Phys Ther 2019;15:92. [Google Scholar]
- 9. Chen L‐K, Liu L‐K, Woo J, Assantachai P, Auyeung T‐W, Bahyah KS, et al. Sarcopenia in Asia: consensus report of the Asian Working Group for Sarcopenia. J Am Med Dir Assoc 2014;15:95–101. [DOI] [PubMed] [Google Scholar]
- 10. Chen LK, Woo J, Assantachai P, Auyeung TW, Chou MY, Iijima K, et al. Asian Working Group for Sarcopenia: 2019 consensus update on sarcopenia diagnosis and treatment. J Am Med Dir Assoc 2020;21:300–7 e2. [DOI] [PubMed] [Google Scholar]
- 11. Studenski SA, Peters KW, Alley DE, Cawthon PM, McLean RR, Harris TB, et al. The FNIH Sarcopenia Project: rationale, study description, conference recommendations, and final estimates. J Gerontol A Biol Sci Med Sci 2014;69:547–558. [DOI] [PMC free article] [PubMed] [Google Scholar]
- 12. Fielding RA, Vellas B, Evans WJ, Bhasin S, Morley JE, Newman AB, et al. Sarcopenia: an undiagnosed condition in older adults. Current consensus definition: prevalence, etiology, and consequences. J Am Med Dir Assoc 2011;12:249–256. [DOI] [PMC free article] [PubMed] [Google Scholar]
- 13. da Silva MZC, Vogt BP, do Carmo Reis NS, Teixeira Caramori JC. Update of the European consensus on sarcopenia: what has changed in diagnosis and prevalence in peritoneal dialysis? Eur J Clin Nutr 2019;73:1209–1211. [DOI] [PubMed] [Google Scholar]
- 14. Matsuzawa R, Yamamoto S, Suzuki Y, Imamura K, Harada M, Matsunaga A, et al. The clinical applicability of ultrasound technique for diagnosis of sarcopenia in hemodialysis patients. Clin Nutr 2021;40:1161–1167. [DOI] [PubMed] [Google Scholar]
- 15. Page MJ, McKenzie JE, Bossuyt PM, Boutron I, Hoffmann TC, Mulrow CD, et al. The PRISMA 2020 statement: an updated guideline for reporting systematic reviews. PLoS Med 2021;18:e1003583‐e. [DOI] [PMC free article] [PubMed] [Google Scholar]
- 16. Liberati A, Altman DG, Tetzlaff J, Mulrow C, Gotzsche PC, Ioannidis JPA, et al. The PRISMA statement for reporting systematic reviews and meta‐analyses of studies that evaluate health care interventions: explanation and elaboration. J Clin Epidemiol 2009;62:e1–e34. [DOI] [PubMed] [Google Scholar]
- 17. Quality assessment tool for observational cohort and cross‐sectional studies. 2015. https://www.nhlbi.nih.gov/health‐topics/study‐quality‐assessment‐tools
- 18. Hoy D, Brooks P, Woolf A, Blyth F, March L, Bain C, et al. Assessing risk of bias in prevalence studies: modification of an existing tool and evidence of interrater agreement. J Clin Epidemiol 2012;65:934–939. [DOI] [PubMed] [Google Scholar]
- 19. Higgins JPT, Thompson SG, Deeks JJ, Altman DG. Measuring inconsistency in meta‐analyses. Br Med J 2003;327:557–560. [DOI] [PMC free article] [PubMed] [Google Scholar]
- 20. Egger M, Smith GD, Schneider M, Minder C. Bias in meta‐analysis detected by a simple, graphical test. Bmj‐British Med J 1997;315:629–634. [DOI] [PMC free article] [PubMed] [Google Scholar]
- 21. Begg CB, Mazumdar M. Operating characteristics of a rank correlation test for publication bias. Biometrics 1994;50:1088–1101. [PubMed] [Google Scholar]
- 22. Lamarca F, Carrero JJ, Rodrigues JCD, Bigogno FG, Fetter RL, Avesani CM. Prevalence of sarcopenia in elderly maintenance hemodialysis patients: the impact of different diagnostic criteria. J Nutr Health Aging 2014;18:710–717. [DOI] [PubMed] [Google Scholar]
- 23. Isoyama N, Qureshi AR, Avesani CM, Lindholm B, Barany P, Heimburger O, et al. Comparative associations of muscle mass and muscle strength with mortality in dialysis patients. Clin J Am Soc Nephrol 2014;9:1720–1728. [DOI] [PMC free article] [PubMed] [Google Scholar]
- 24. Ren HQ, Gong DH, Jia FY, Xu B, Liu ZH. Sarcopenia in patients undergoing maintenance hemodialysis: incidence rate, risk factors and its effect on survival risk. Ren Fail 2016;38:364–371. [DOI] [PubMed] [Google Scholar]
- 25. Bataille S, Serveaux M, Carreno E, Pedinielli N, Darmon P, Robert A. The diagnosis of sarcopenia is mainly driven by muscle mass in hemodialysis patients. Clin Nutr 2017;36:1654–1660. [DOI] [PubMed] [Google Scholar]
- 26. Greenhall GHB, Davenport A. Screening for muscle loss in patients established on peritoneal dialysis using bioimpedance. Eur J Clin Nutr 2017;71:70–75. [DOI] [PubMed] [Google Scholar]
- 27. Jin S, Lu Q, Su C, Pang D, Wang T. Shortage of appendicular skeletal muscle is an independent risk factor for mortality in peritoneal dialysis patients. Perit Dial Int 2017;37:78–84. [DOI] [PubMed] [Google Scholar]
- 28. Kamijo Y, Kanda E, Ishibashi Y, Yoshida M. Sarcopenia and frailty in PD: impact on mortality, malnutrition, and inflammation. Perit Dial Int 2018;38:447–454. [DOI] [PubMed] [Google Scholar]
- 29. Kang SH, Cho KH, Park JW, Do JY. Low appendicular muscle mass is associated with mortality in peritoneal dialysis patients: a single‐center cohort study. Eur J Clin Nutr 2017;71:1405–1410. [DOI] [PubMed] [Google Scholar]
- 30. Kittiskulnam P, Chertow GM, Carrero JJ, Delgado C, Kaysen GA, Johansen KL. Sarcopenia and its individual criteria are associated, in part, with mortality among patients on hemodialysis. Kidney Int 2017;92:238–247. [DOI] [PMC free article] [PubMed] [Google Scholar]
- 31. Malhotra R, Deger SM, Salat H, Bian A, Stewart TG, Booker C, et al. Sarcopenic obesity definitions by body composition and mortality in the hemodialysis patients. J Ren Nutr 2017;27:84–90. [DOI] [PMC free article] [PubMed] [Google Scholar]
- 32. Abro A, Delicata LA, Vongsanim S, Davenport A. Differences in the prevalence of sarcopenia in peritoneal dialysis patients using hand grip strength and appendicular lean mass: depends upon guideline definitions. Eur J Clin Nutr 2018;72:993–999. [DOI] [PubMed] [Google Scholar]
- 33. As'habi A, Najafi I, Tabibi H, Hedayati M. Prevalence of sarcopenia and dynapenia and their determinants in Iranian peritoneal dialysis patients. Iran J Kidney Dis 2018;12:53–60. [PubMed] [Google Scholar]
- 34. Dierkes J, Dahl H, Welland NL, Sandnes K, Saele K, Sekse I, et al. High rates of central obesity and sarcopenia in CKD irrespective of renal replacement therapy—an observational cross‐sectional study. BMC Nephrol 2018;19:259. [DOI] [PMC free article] [PubMed] [Google Scholar]
- 35. Giglio J, Kamimura MA, Lamarca F, Rodrigues J, Santin F, Avesani CM. Association of sarcopenia with nutritional parameters, quality of life, hospitalization, and mortality rates of elderly patients on hemodialysis. J Ren Nutr 2018;28:197–207. [DOI] [PubMed] [Google Scholar]
- 36. Lin YL, Liou HH, Lai YH, Wang CH, Kuo CH, Chen SY, et al. Decreased serum fatty acid binding protein 4 concentrations are associated with sarcopenia in chronic hemodialysis patients. Clin Chim Acta 2018;485:113–118. [DOI] [PubMed] [Google Scholar]
- 37. Yoowannakul S, Tangvoraphonkchai K, Vongsanim S, Mohamed A, Davenport A. Differences in the prevalence of sarcopenia in haemodialysis patients: the effects of gender and ethnicity. J Hum Nutr Diet 2018;31:689–696. [DOI] [PubMed] [Google Scholar]
- 38. Yoowannakul S, Davenport A. Estimation of lean body mass by creatinine kinetics increases the prevalence of muscle wasting in peritoneal dialysis patients compared to bioimpedance. Eur J Clin Nutr 2018;72:1455–1457. [DOI] [PubMed] [Google Scholar]
- 39. Chiang JM, Kaysen GA, Segal M, Chertow GM, Delgado C, Johansen KL. Low testosterone is associated with frailty, muscle wasting and physical dysfunction among men receiving hemodialysis: a longitudinal analysis. Nephrol Dial Transplant 2019;34:802–810. [DOI] [PMC free article] [PubMed] [Google Scholar]
- 40. Kim JK, Kim SG, Oh JE, Lee YK, Noh JW, Kim HJ, et al. Impact of sarcopenia on long‐term mortality and cardiovascular events in patients undergoing hemodialysis. Korean J Intern Med 2019;34:599–607. [DOI] [PMC free article] [PubMed] [Google Scholar]
- 41. Lin YL, Liou HH, Wang CH, Lai YH, Kuo CH, Chen SY, et al. Impact of sarcopenia and its diagnostic criteria on hospitalization and mortality in chronic hemodialysis patients: a 3‐year longitudinal study. J Formos Med Assoc 2020;119:1219–1229. [DOI] [PubMed] [Google Scholar]
- 42. Mori K, Nishide K, Okuno S, Shoji T, Emoto M, Tsuda A, et al. Impact of diabetes on sarcopenia and mortality in patients undergoing hemodialysis. BMC Nephrol 2019;20:1–7. [DOI] [PMC free article] [PubMed] [Google Scholar]
- 43. Guida B, Trio R, Di Maro M, Memoli A, Di Lauro T, Belfiore A, et al. Prevalence of obesity and obesity‐associated muscle wasting in patients on peritoneal dialysis. Nutr Metab Cardiovas 2019;29:1390–1399. [DOI] [PubMed] [Google Scholar]
- 44. Medeiros MCW, Bandeira F, Henriques M, Silva NR, Farias MEB, Farias L. Serum sclerostin, body composition, and sarcopenia in hemodialysis patients with diabetes. Int J Nephrol 2020:4596920. [DOI] [PMC free article] [PubMed] [Google Scholar]
- 45. Slee A, McKeaveney C, Adamson G, Davenport A, Farrington K, Fouque D, et al. Estimating the prevalence of muscle wasting, weakness, and sarcopenia in hemodialysis patients. J Ren Nutr 2020;30:313–321. [DOI] [PubMed] [Google Scholar]
- 46. Kim C, Kim JK, Lee HS, Kim SG, Song YR. Longitudinal changes in body composition are associated with all‐cause mortality in patients on peritoneal dialysis. Clin Nutr 2020;30:30. [DOI] [PubMed] [Google Scholar]
- 47. Song YR, Kim JK, Lee HS, Kim SG, Choi EK. Serum levels of protein carbonyl, a marker of oxidative stress, are associated with overhydration, sarcopenia and mortality in hemodialysis patients. BMC Nephrol 2020;21:281. [DOI] [PMC free article] [PubMed] [Google Scholar]
- 48. Miyazaki S, Iino N, Koda R, Narita I, Kaneko Y. Brain‐derived neurotrophic factor is associated with sarcopenia and frailty in Japanese hemodialysis patients. Geriatr Gerontol Int 2021;21:27–33. [DOI] [PubMed] [Google Scholar]
- 49. Takata T, Motoe A, Tanida K, Taniguchi S, Ida A, Yamada K, et al. Feasibility of computed tomography‐based assessment of skeletal muscle mass in hemodialysis patients. J Nephrol 2021;34:465–471. [DOI] [PubMed] [Google Scholar]
- 50. Obi Y, Qader H, Kovesdy CP, Kalantar‐Zadeh K. Latest consensus and update on protein‐energy wasting in chronic kidney disease. Curr Opin Clin Nutr Metab Care 2015;18:254–262. [DOI] [PMC free article] [PubMed] [Google Scholar]
- 51. Fouque D, Kalantar‐Zadeh K, Kopple J, Cano N, Chauveau P, Cuppari L, et al. A proposed nomenclature and diagnostic criteria for protein‐energy wasting in acute and chronic kidney disease. Kidney Int 2008;73:391–398. [DOI] [PubMed] [Google Scholar]
- 52. Zhang L, Pan J, Dong Y, Tweardy DJ, Dong Y, Garibotto G, et al. Stat3 activation links a C/EBPδ to myostatin pathway to stimulate loss of muscle mass. Cell Metab 2013;18:368–379. [DOI] [PMC free article] [PubMed] [Google Scholar]
- 53. Watanabe H, Enoki Y, Maruyama T. Sarcopenia in chronic kidney disease: factors, mechanisms, and therapeutic interventions. Biol Pharm Bull 2019;42:1437–1445. [DOI] [PubMed] [Google Scholar]
- 54. Schaap LA, Pluijm SMF, Deeg DJH, Harris TB, Kritchevsky SB, Newman AB, et al. Higher inflammatory marker levels in older persons: associations with 5‐year change in muscle mass and muscle strength. J Gerontol A Biol Sci Med Sci 2009;64:1183–1189. [DOI] [PMC free article] [PubMed] [Google Scholar]
- 55. Mak RH, Ikizler TA, Kovesdy CP, Raj DS, Stenvinkel P, Kalantar‐Zadeh K. Wasting in chronic kidney disease (vol 2, pg 9, 2011). J Cachexia Sarcopeni 2011;2:119. [DOI] [PMC free article] [PubMed] [Google Scholar]
- 56. Axelsson J, Heimburger O, Stenvinkel P. Adipose tissue and inflammation in chronic kidney disease. Contrib Nephrol 2006;151:165–174. [DOI] [PubMed] [Google Scholar]
- 57. Carrero JJ, Stenvinkel P, Cuppari L, Ikizler TA, Kalantar‐Zadeh K, Kaysen G, et al. Etiology of the protein‐energy wasting syndrome in chronic kidney disease: a consensus statement from the International Society of Renal Nutrition and Metabolism (ISRNM). J Ren Nutr 2013;23:77–90. [DOI] [PubMed] [Google Scholar]
- 58. Frost RA, Lang CH. Multifaceted role of insulin‐like growth factors and mammalian target of rapamycin in skeletal muscle. Endocrinol Metab Clin North Am 2012;41:297–322. [DOI] [PMC free article] [PubMed] [Google Scholar]
- 59. Kir S, Komaba H, Garcia AP, Economopoulos KP, Liu W, Lanske B, et al. PTH/PTHrP receptor mediates cachexia in models of kidney failure and cancer. Cell Metab 2016;23:315–323. [DOI] [PMC free article] [PubMed] [Google Scholar]
- 60. Morgan SA, Sherlock M, Gathercole LL, Lavery GG, Lenaghan C, Bujalska IJ, et al. 11 β‐Hydroxysteroid dehydrogenase type 1 regulates glucocorticoid‐induced insulin resistance in skeletal muscle. Diabetes 2009;58:2506–2515. [DOI] [PMC free article] [PubMed] [Google Scholar]
- 61. Iorember FM. Malnutrition in chronic kidney disease. Front Pediatr 2018;6:161. [DOI] [PMC free article] [PubMed] [Google Scholar]
- 62. Merkus MP, Jager KJ, Dekker FW, Boeschoten EW, Stevens P, Krediet RT, et al. Quality of life in patients on chronic dialysis: self‐assessment 3 months after the start of treatment. The Necosad Study Group. Am J Kidney Dis 1997;29:584–592. [DOI] [PubMed] [Google Scholar]
- 63. Neumann D, Mau W, Wienke A, Girndt M. Peritoneal dialysis is associated with better cognitive function than hemodialysis over a one‐year course. Kidney Int 2018;93:430–438. [DOI] [PubMed] [Google Scholar]
- 64. Tamura MK, Covinsky KE, Chertow GM, Yaffe K, Landefeld CS, McCulloch CE. Functional status of elderly adults before and after initiation of dialysis. N Engl J Med 2009;361:1539–1547. [DOI] [PMC free article] [PubMed] [Google Scholar]
- 65. Robinson BM, Zhang J, Morgenstern H, Bradbury BD, Ng LJ, McCullough KP, et al. Worldwide, mortality risk is high soon after initiation of hemodialysis. Kidney Int 2014;85:158–165. [DOI] [PMC free article] [PubMed] [Google Scholar]
- 66. Kalantar‐Zadeh K, Abbott KC, Salahudeen AK, Kilpatrick RD, Horwich TB. Survival advantages of obesity in dialysis patients. Am J Clin Nutr 2005;81:543–554. [DOI] [PubMed] [Google Scholar]
- 67. Naderi N, Kleine C‐E, Park C, Hsiung J‐T, Soohoo M, Tantisattamo E, et al. Obesity paradox in advanced kidney disease: from bedside to the bench. Prog Cardiovasc Dis 2018;61:168–181. [DOI] [PMC free article] [PubMed] [Google Scholar]
- 68. Park J, Ahmadi S‐F, Streja E, Molnar MZ, Flegar KM, Gillen D, et al. Obesity paradox in end‐stage kidney disease patients. Prog Cardiovasc Dis 2014;56:415–425. [DOI] [PMC free article] [PubMed] [Google Scholar]
- 69. Janssen I, Baumgartner RN, Ross R, Rosenberg IH, Roubenoff R. Skeletal muscle cutpoints associated with elevated physical disability risk in older men and women. Am J Epidemiol 2004;159:413–421. [DOI] [PubMed] [Google Scholar]
- 70. Chien M‐Y, Huang T‐Y, Wu Y‐T. Prevalence of sarcopenia estimated using a bioelectrical impedance analysis prediction equation in community‐dwelling elderly people in Taiwan. J Am Geriatr Soc 2008;56:1710–1715. [DOI] [PubMed] [Google Scholar]
- 71. Newman AB, Kupelian V, Visser M, Simonsick E, Goodpaster B, Nevitt M, et al. Sarcopenia: alternative definitions and associations with lower extremity function. J Am Geriatr Soc 2003;51:1602–1609. [DOI] [PubMed] [Google Scholar]
- 72. Baumgartner RN, Koehler KM, Gallagher D, Romero L, Heymsfield SB, Ross RR, et al. Epidemiology of sarcopenia among the elderly in New Mexico. Am J Epidemiol 1998;147:755–763. [DOI] [PubMed] [Google Scholar]
- 73. Kelly TL, Wilson KE, Heymsfield SB. Dual energy X‐ray absorptiometry body composition reference values from NHANES. Plos One 2009;4:e7038. [DOI] [PMC free article] [PubMed] [Google Scholar]
- 74. Janssen I, Heymsfield SB, Ross R. Low relative skeletal muscle mass (sarcopenia) in older persons is associated with functional impairment and physical disability. J Am Geriatr Soc 2002;50:889–896. [DOI] [PubMed] [Google Scholar]
- 75. Marcelli D, Usvyat LA, Kotanko P, Bayh I, Canaud B, Etter M, et al. Body composition and survival in dialysis patients: results from an international cohort study. Clin J Am Soc Nephrol 2015;10:1192–1200. [DOI] [PMC free article] [PubMed] [Google Scholar]
- 76. Lauretani F, Russo CR, Bandinelli S, Bartali B, Cavazzini C, Di Iorio A, et al. Age‐associated changes in skeletal muscles and their effect on mobility: an operational diagnosis of sarcopenia. J Appl Physiol 2003;95:1851–1860. [DOI] [PubMed] [Google Scholar]
- 77. Kim CR, Jeon YJ, Kim MC, Jeong T, Koo WR. Reference values for hand grip strength in the South Korean population. PLoS ONE 2018;13:e0195485. [DOI] [PMC free article] [PubMed] [Google Scholar]
- 78. Schlüssel MM, dos Anjos LA, de Vasconcellos MT, Kac G. Reference values of handgrip dynamometry of healthy adults: a population‐based study. Clin Nutr 2008;27:601–607. [DOI] [PubMed] [Google Scholar]
- 79. von Haehling S, Morley JE, Coats AJS, Anker SD. Ethical guidelines for publishing in the Journal of Cachexia, Sarcopenia and Muscle: update 2019. J Cachexia Sarcopenia Muscle 2019;10:1143–1145. [DOI] [PMC free article] [PubMed] [Google Scholar]
Associated Data
This section collects any data citations, data availability statements, or supplementary materials included in this article.
Supplementary Materials
Table S1. Search strategy by Embase, Medline, Pubmed, and Cochrane library via Ovid SP.
Table S2. The reasons for the exclusion of full‐text articles.
Figure S1. Risk of bias of the included studies using the National Institutes of Health Quality Assessment Tool for Observational Cohort and Cross‐Sectional Studies.
Figure S2. Risk of bias of the included studies using assessment tool explicitly for prevalence studies.
Figure S3. Prevalence of sarcopenia in dialysis patients according to different sarcopenia definition, diagnostic criteria, and dialysis modality.
Figure S4. Meta‐regression of the effect of average age on sarcopenia prevalence.
Figure S5. Meta‐regression of the effect of dialysis duration on sarcopenia prevalence.
Figure S6. Impact of combined criteria of sarcopenia (LMM plus LMS and/or LPP) on mortality in dialysis patients.
Figure S7. Impact of LMM on mortality in dialysis patients.
Figure S8. Impact of LMS on mortality in dialysis patients.
Figure S9. Sensitivity analysis.