

Abstract
The amygdala primarily evolved as a danger detector that regulates emotional behaviours and learning. However, it is also engaged in stress responses as well as olfactory/pheromonal and reproductive functions. All of these functions are processed by a set of nuclei which are derived from different telencephalic sources (pallial and subpallial) and have a unique cellular structure and specific connections. It is unclear how these individual anatomical and functional units evolved to fit the amygdala to the specific needs of various mammals. Thus, this study provides quantitative data regarding volumes, neuron density and neuron numbers in the main amygdala nuclei of the common shrew, guinea pig, rabbit, fox and pig – species from across the mammalian phylogeny which differ in brain complexity and ecology. The results show that the volume of the amygdala and its individual nuclei scale with negative allometry relative to brain mass (an allometric coefficient below one). However, in relation to the whole amygdala volume, volumes and volumetric percentages of the lateral (LA) and basomedial (BM) nuclei scale with positive allometry, for the medial (ME) and lateral olfactory tract (NLOT) nuclei these parameters scale with negative allometry while the values of these parameters for the basolateral (BL), central (CE) and cortical (CO) nuclei scale with isometry. Moreover, density of neurons scales with strong negative allometry relative to both brain mass and amygdala volume with values of allometric coefficient below zero across studied species. This value for BL is significantly lower than that for the whole amygdala, for ME it is significantly higher while values for NLOT, CE, CO, LA and BM are quite similar to the value for whole amygdala. Finally, neuron numbers in the whole amygdala and its individual nuclei scale with negative allometry in relation to brain mass. However, in relation to the number of neurons in the whole amygdala, neuron numbers and percentages of neurons for LA and BM scale with positive allometry, for BL and NLOT they scale with negative allometry while the values of these parameters for CE, CO and ME scale with isometry. In conclusion, all of these results indicate that each of the nuclei studied displays a different and unique pattern of evolution in relation to brain mass or the whole amygdala volume. These patterns do not match with the various classical concepts of amygdala parcellation; however, in some way, they reflect diversity revealed by the expression of homeobox genes in various embryological studies.
Keywords: amygdala, comparative neuroanatomy, mammalian evolution, neuron density, neuron number, stereology, volume
We studied the evolutionary trajectories of the individual amygdala nuclei in the common shrew, guinea pig, rabbit, fox and pig. The results indicate that each of these nuclei displays different and unique pattern of development during phylogeny. These unique patterns do not match well with the classical divisions of the amygdala into basolateral, central and corticomedial regions or similar other anatomical concepts, however, in some way they reflect the diversity revealed by the expression of homeobox genes such as Emx‐1, Dlx‐2, Pax‐6 etc in various embryological studies.
1. INTRODUCTION
The fact that the amygdala is a key mediator of animal and human behaviour (Janak & Tye, 2015; Linsambarth et al., 2017) has raised great interest in understanding its complexity. This complexity comes from multinuclear organization, diversity of nuclear input and output connections, variety of cell types and neurotransmitters used, as well as the dual (i.e. pallial and sub‐pallial) origin of amygdala regions (McDonald, 2020; Medina et al., 2004; Pitkänen et al., 2000; Puelles, 2017; Sah et al., 2003; Schröder et al., 2020; Swanson & Petrovich, 1998). This complexity has also made the amygdala a subject of intense investigation and debate in terms of content and evolutionary development since it is a much more complicated structure than was previously thought (Bupesh et al., 2011; Garcia‐Calero et al., 2020; Medina et al., 2004; Remedios et al., 2007).
The amygdala comprises about 13 different nuclei and cortical regions demarcated additionally into several subdivisions (Sah et al., 2003; Schröder et al., 2020; Swanson & Petrovich, 1998). It includes several large and frequently investigated regions, such as the lateral (LA), basolateral (BL), basomedial (BM), cortical (CO), central (CE) and medial nuclei (ME), as well as some smaller and less well‐studied components, that is, the nucleus of the lateral olfactory tact (NLOT), the nucleus of the accessory olfactory tract (BAOT), anterior amygdaloid area (AAA), intra‐amygdaloid portion of the stria terminalis (BSTiA), intercalated nucleus (I) and amygdalohippocampal area (AHA) (Sah et al., 2003; Schröder et al., 2020; Swanson & Petrovich, 1998). All of these structures have been categorized and grouped by various researchers according to various concepts (Krettek & Price, 1978; LeDoux, 2007; Pabba, 2013; Richardson, 1973; Równiak & Bogus‐Nowakowska, 2020; Schröder et al., 2020; Stephan et al., 1987); however, in the context of amygdala evolution, the studies of Swanson and Petrovich (1998), Puelles et al. (2000), Martínez‐García et al. (2002), Medina et al. (2004) and Garcia‐Calero et al. (2020) are especially interesting.
Almost all of the studies describe the region in the amygdala called the basolateral amygdala, which comprises LA, BL and BM (LeDoux, 2007; McDonald, 2020; Muller et al., 2005; Prager et al., 2016; Sah et al., 2003; Schröder et al., 2020; Swanson & Petrovich, 1998). This is not surprising, as these nuclei form a compact nuclear complex and are organized in a very similar way. For example, they have similar cellular structure (Równiak et al., 2003), are inter‐connected (Pitkänen et al., 2000) and, although the cells do not exhibit a laminar or columnar organization, their morphology, synaptology, electrophysiology and pharmacology are remarkably similar to those of their counterparts in the cerebral cortex (McDonald, 2020). In addition, basolateral nuclei are characterized by very rich bidirectional connections with various areas of the neocortex (including frontal and temporal cortices) and hippocampal formation, as well as by mostly unidirectional connections with the various striatal regions and selected thalamic nuclei (Pitkänen et al., 2000). In contrast, this region is almost devoid of any connections with the hypothalamus and brainstem (Pitkänen et al., 2000). At present, the basolateral nuclei are considered the main sensory gateway for non‐olfactory cues in the amygdala and the main region for emotional processing and emotional learning (LeDoux, 2003; Pape & Pare, 2010; Sah et al., 2003). It is worth noting that although there is convincing evidence that all components of the basolateral amygdala are pallial derivatives, the exact origin of this region has been under debate. The origin may be the embryonic claustrum, the lateral pallium or the ventral pallium (Martínez‐García et al., 2002; Medina et al., 2004; Puelles, 2017; Puelles et al., 2000; Swanson & Petrovich, 1998).
Another large region in the amygdala, which is defined in many studies, is the centromedial amygdala, which is composed primarily of CE and ME, however, BSTiA, I and AAA are also often included (Han & De Vries, 1999; Stephan et al., 1987; Swanson & Petrovich, 1998). All of these amygdala nuclei are a part of the extended amygdala (Bupesh et al., 2011; Newman, 1999) and are usually grouped due to their subpallial origin and similarity in neurotransmitter contents (Garcia‐Calero et al., 2020; Martínez‐García et al., 2002; Puelles et al., 2000; Swanson & Petrovich, 1998). CE is considered a specialized autonomic‐projecting motor region of the striatum (Swanson & Petrovich, 1998) and is characterized by very selective efferent projections to the autonomic and visceral brainstem and hypothalamic centres (Pitkänen et al., 2000) which evoke species‐specific emotional sensations and behaviours being the “essence of emotion” (LeDoux, 2000). As CE receives convergent information from almost all nuclei of the amygdala (Pitkänen et al., 2000), without sending information back to any of them, it is also considered to be the primary effector region of the amygdala (LeDoux, 2003; Sah et al., 2003). However, the other centromedial nuclei seem to be different functionally from CE as they are engaged in other functional systems of the amygdala (Swanson & Petrovich, 1998). For example, although ME is regarded as a part of the centromedial amygdala (striatal‐like) due to the medial location, origin and similarity in the neurotransmitter content (Martínez‐García et al., 2002; Puelles et al., 2000; Swanson & Petrovich, 1998), there is sufficient evidence, such as cellular structure, cortex‐like (laminar) organization and specialized connections (Kevetter & Winans, 1981a, 1981b; Pitkänen et al., 2000) which place ME among olfactory structures.
There is also a neuroanatomical concept called the corticomedial amygdala which usually includes ME, CO, NLOT and BAOT and which represents the vomeronasal and olfactory regions of the amygdala (Kevetter & Winans, 1981a, 1981b; LeDoux, 2007; Richardson, 1973; Równiak & Bogus‐Nowakowska, 2020), however, it has a dual embryological origin (Swanson & Petrovich, 1998). A part of it is formed by ME which has mainly a subpallial origin (Bupesh et al., 2011; Puelles et al., 2000; Swanson & Petrovich, 1998). Another part includes CO, NLOT and BAOT and is composed of derivatives of the olfactory cortex (ventral and lateral pallium) forming the caudal end of the piriform lobe (Moreno & González, 2007; Puelles et al., 2000; Swanson & Petrovich, 1998). The corticomedial amygdala, consisting of ME, CO, and NLOT, was often analysed as a consistent concept in various neuroanatomical studies (Crosby & Humphrey, 1944; Kevetter & Winans, 1981a; Równiak & Bogus‐Nowakowska, 2020) as all of these three regions have laminated cellular arrangement more or less similar to the piriform cortex, are interconnected, and have strong bidirectional connections with the main and accessory olfactory bulbs (Kevetter & Winans, 1981a, 1981b; Pitkänen et al., 2000). At present, the corticomedial amygdala is considered the main sensory gateway for olfactory and vomeronasal cues and it is the main region in the amygdala for processing reproductive and defensive behaviours (Gutiérrez‐Castellanos et al., 2010; Hong et al., 2014; Maras & Petrulis, 2008; Sah et al., 2003).
Finally, there are embryological studies using homeobox gene expression patterns which do not corroborate the concepts of the amygdala parcellation described above. For example, according to Martínez‐García et al. (2002) LA, BM, I and CO form one large region with ventropallial origin while BL is lateropallial. Puelles et al. (2000) traced quite a similar region, however, they suggested that LA has a ventropallial origin, BL is lateropallial but BM is rather subpallial, not pallial. Similarly within the centromedial amygdala, according to Martínez‐García et al. (2002) and Puelles et al. (2000), CE is a striatal‐like region while ME is rather considered to be a pallidal‐like territory. Moreover, recent studies on NLOT, which is commonly treated as a single three‐layered structure, indicated that layer II is a derivative of the dorsal pallium and is substantially different from ventropallial layers I and III (Remedios et al., 2007). Thus, even a single amygdala nucleus may have a mixed embryological origin.
Taken together, the amygdala is a set of nuclei which are derived from different telencephalic sources and which have a specific cellular structure, connections and neurotransmitter content to process non‐olfactory and olfactory cues and generate coherent and relevant emotional responses to important environmental stimuli (Swanson & Petrovich, 1998). However, the importance of various cues differs across mammalian species and the emotional responses generated by the amygdala are also species‐specific. Thus, the question is how these nuclei have changed across the mammalian phylogeny to match the amygdala to the specific needs of different species. To answer this question, the volume, neuron density and neuron number in LA, BL, BM, CE, ME, CO and NLOT were evaluated and compared in representatives of five different orders of placental mammals with different degrees of brain complexity.
2. MATERIAL AND METHODS
2.1. Experimental animals
The present studies were carried out on 30 series of 50‐μm‐thick, Nissl‐stained, paraffin sections from the brain collection of the Department of Animal Anatomy and Physiology of the University of Warmia and Mazury in Olsztyn. These sections were derived from five species: the common shrew (Sorex araneus, Eulipotyphla), domestic guinea pig (Cavia porcellus, Rodentia), rabbit (Oryctolagus cuniculus, Lagomorpha), red fox (Vulpes, Carnivora) and domestic pig (Sus scrofa, Artiodactyla). Each of these species was analysed using six adult individuals. The average brain masses of these species were already reported in a previous study (Równiak & Bogus‐Nowakowska, 2020).
All of the series of histological preparations were created according to a standardized and consistent Nissl procedure. Briefly, each brain was preserved in 10% buffered formalin for at least three months prior to further processing. The whole brains of the shrews, guinea pigs and rabbits as well as left and right hemispheres from the foxes and pigs were then dehydrated in a graded series of ethanol, embedded in paraffin and coronally sectioned with the thickness of 50 μm by using a Leica microtome. Finally, these sections were processed for routine Nissl staining (sections were deparaffinized, fully rehydrated prior to the staining, stained with a 0.1% solution of cresyl violet brought to pH 4 with glacial acetic acid, dehydrated again in alcohol, cleared in xylene and coverslipped with Canadian balsam).
Stained sections were analysed with a calibrated image analysis system composed of a microscope (BX51, Olympus) coupled with a digital camera (CC‐12, Soft Imaging System) and a computer equipped with morphometric software such as Cell‐F software (Olympus) and Reconstruct software (http://synapses.clm.utexas.edu/) (Fiala, 2005; Fiala & Harris, 2001). The sequence of the successive operations in a single animal was described in detail below.
2.2. Delineation of the amygdala
The anatomical boundaries of the amygdala and its various nuclei can be reliably defined across the studied species in Nissl stained sections, which was demonstrated in several of our previous papers (Równiak, 2013; Równiak & Bogus‐Nowakowska, 2020; Równiak et al., 2004). In the present study, the effect of such delineation in five studied species was visualized in 3‐D format to show the relationships among the individual amygdala nuclei (Figures 1 and 2).
FIGURE 1.
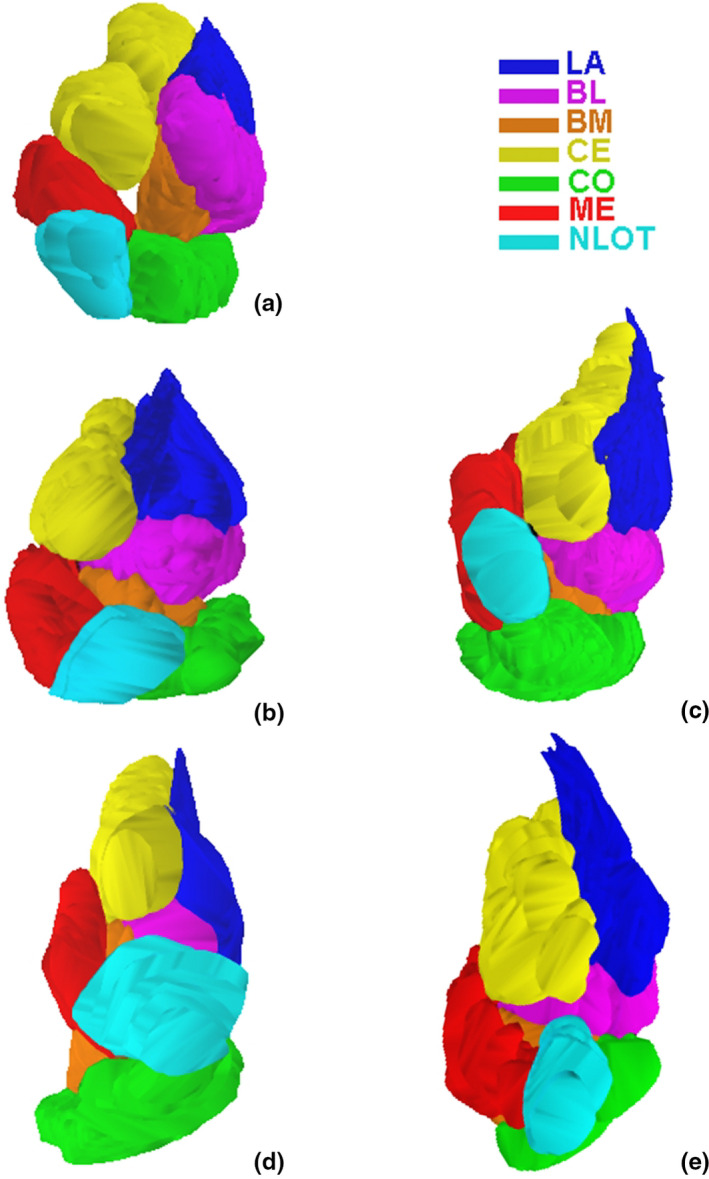
Three‐dimensional reconstruction of the main amygdala nuclei in anterior view in the common shrew (a), guinea pig (b), rabbit (c), fox (d) and pig (e). LA ‐ lateral nucleus, BL ‐ basolateral nucleus, BM ‐ basomedial nucleus, CO ‐ cortical nucleus, CE ‐ central nucleus, ME ‐ medial nucleus, NLOT‐ nucleus of the lateral olfactory tract
FIGURE 2.
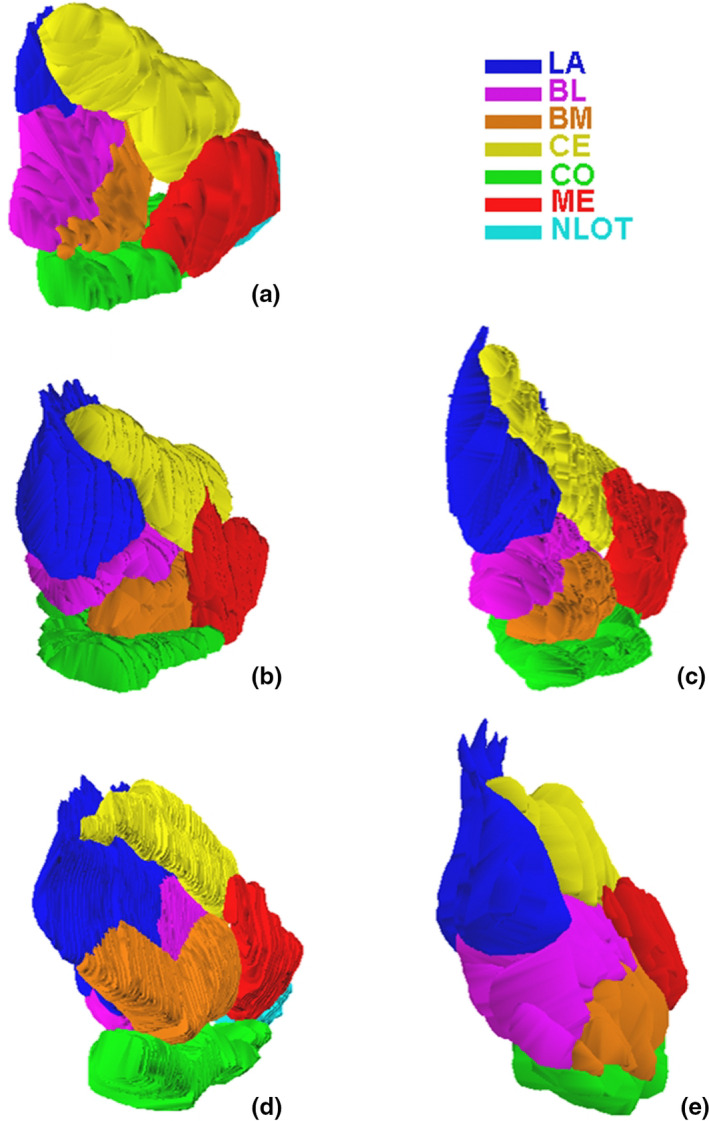
Three‐dimensional reconstruction of the main amygdala nuclei in postero‐lateral view in the common shrew (a), guinea pig (b), rabbit (c), fox (d) and pig (e). LA ‐ lateral nucleus, BL ‐ basolateral nucleus, BM ‐ basomedial nucleus, CO ‐ cortical nucleus, CE ‐ central nucleus, ME ‐ medial nucleus, NLOT‐ nucleus of the lateral olfactory tract
2.3. Stereological analyses
Volume measurements and neuron counts were performed using an Olympus BX51 microscope equipped with a microcator as well as Reconstruct and Cell‐F software.
2.3.1. Volume measurements
Volumetric measurements of the individual amygdala nuclei were generated by the calibrated Reconstruct software during the process of 3‐D reconstruction. This process was described in detail in a previous paper (Równiak & Bogus‐Nowakowska, 2020), but some details are provided in the present study for the reader's convenience. Briefly, sections were viewed at low magnification through a 10‐fold (common shrew and guinea pig) or 4‐fold (rabbit, fox and pig) objective using an Olympus BX51 microscope. The partial microscopic images of a single section were digitally recorded using a CCD camera and then subsequently joined together to form larger areas comprising the whole amygdala and adjoining areas with various characteristic points (so‐called “digital slices”). For the common shrew, every “digital slice” in the series was analysed. For the guinea pig and rabbit, every second “digital slice” was considered. For the fox and pig, every fourth “digital slice” was taken into account. All of the “digital slices” recorded from a single animal were then imported into the Reconstruct software, where they were transformed into one multi‐sliced 3‐D image (a so‐called “stack”) and aligned (superimposed) according to Generalized Procrustes Analysis (GPA) (Bookstein, 1986; Rohlf, 1999; Rohlf & Slice, 1990). After alignment, on each digital slice in the stack, the boundaries of the seven individual amygdaloid nuclei were manually outlined (contoured) with seven different colours by a mouse‐driven cursor, and all contours with the same colour received a unique name (LA, BL, BM, etc.). The definite stack was then composed of the serially aligned raw images and contours, that is, the outlined nuclei of the amygdala incorporated. In the last step, the Reconstruct software transformed the 2‐D contours into 3‐D slabs and, on the basis of these slabs, it generated a surface reconstruction of each the individual amygdala nuclei using the Boissonnat (1988) method (Figures 1 and 2). In order to evaluate the volume of a single amygdaloid nucleus (Vo), the volumes of 3‐D slabs (Vn) with the same name and colour were totalled using the Cavalieri formula (West & Gundersen, 1990).
Each 3‐D slab contributes the product of its enclosed area (as computed in the Trace List) times the section thickness:
2.3.2. Estimation of neuron density
The numerical density of cells in a single amygdaloid nucleus was estimated using the optical dissector method described in detail by West and Gundersen, (1990). According to a systematic random scheme, the optical dissector sampling was performed on optical sections (obtained with an ×40 objective), onto which the unbiased counting frame of a known area (347.6 µm × 260.7 µm) was superimposed. Only the neurons with distinct nuclei and which did not intersect the forbidden boundary lines of the counting frame were included in counts. To obtain the best accuracy, at least 2000 neurons in each of the amygdaloid nuclei per specimen (animal) were counted. The average density of neurons in the amygdala of the species, demonstrated in the present study, was the mean from values obtained from the seven individual amygdaloid nuclei.
2.3.3. Estimation of neuron number
The total number of neurons in a single nucleus was calculated by multiplying estimates of the nuclear volume by the numerical density in it (West & Gundersen, 1990).
where Vo is the total volume of the structure and N/mm3 is the neuron density in this structure. The total number of neurons in the whole amygdala was achieved by adding the neuron numbers from seven single amygdaloid nuclei.
2.4. Allometric data evaluation
The morphometric parameters such as volume, neuron density and neuron number in the individual amygdala nuclei in the five studied species were analysed in relation to the total brain mass, the total amygdala volume or the neuron number in the whole amygdala (Figures 3, 4, 5, 6, 7, 8). Since values of the morphometric parameters of different amygdala nuclei increase with different slopes with respect to the brain mass or the amygdala volume or the number of amygdala neurons, the data were analysed using the allometric equation:
Where x is the brain mass/amygdala volume/amygdala neuron number, y is the morphometric parameter value of a single nucleus, log b is the intercept of the line on the y‐axis and α is the slope of the line (the allometric coefficient) which captures the differential growth ratio between the morphometric parameter values of a single nucleus and the brain mass/amygdala volume/amygdala neuron number.
FIGURE 3.
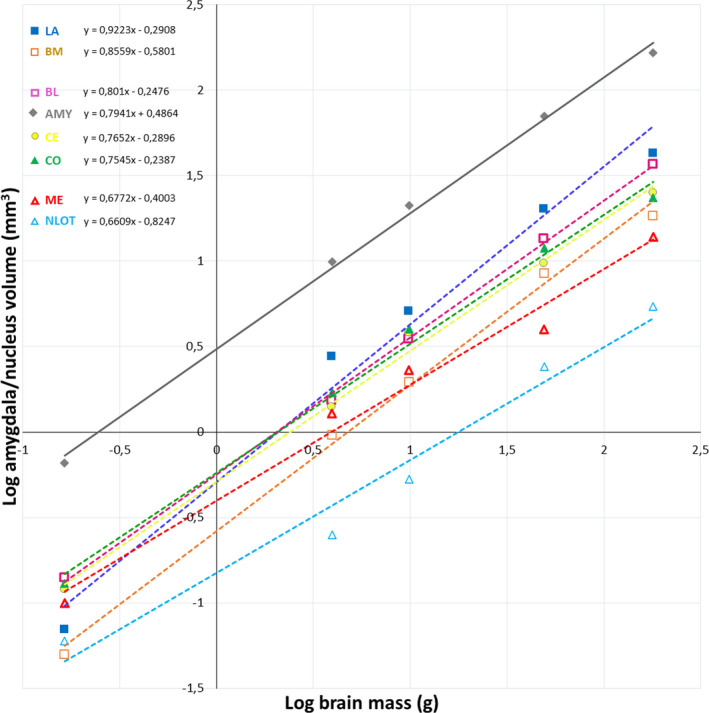
Volumes of the whole amygdala and its individual nuclei plotted against the brain mass. AMY – whole amygdala, LA ‐ lateral nucleus, BL ‐ basolateral nucleus, BM ‐ basomedial nucleus, CE ‐ central nucleus, CO ‐ cortical nucleus, ME ‐ medial nucleus, NLOT‐ nucleus of the lateral olfactory tract
FIGURE 4.
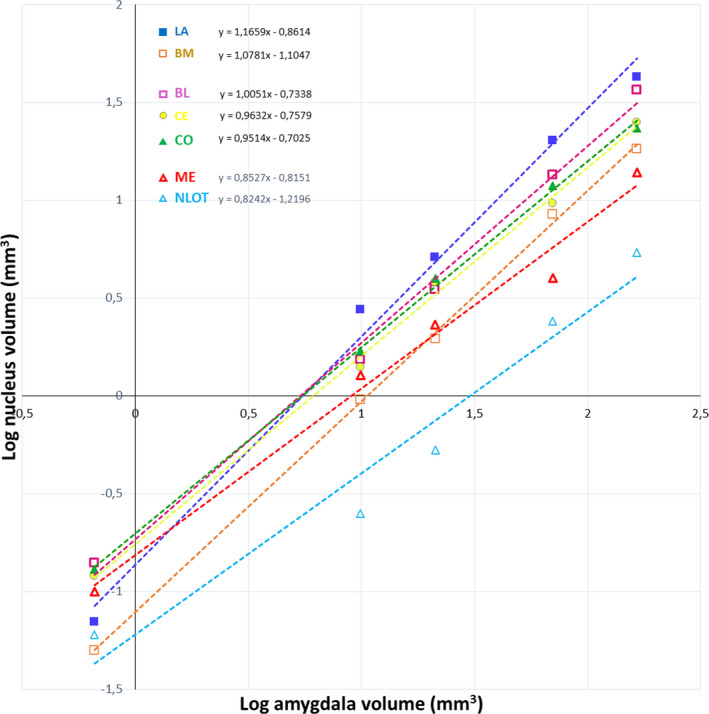
Volumes of the individual amygdala nuclei plotted against the whole amygdala volume. LA ‐ lateral nucleus, BL ‐ basolateral nucleus, BM ‐ basomedial nucleus, CE ‐ central nucleus, CO ‐ cortical nucleus, ME ‐ medial nucleus, NLOT‐ nucleus of the lateral olfactory tract
FIGURE 5.
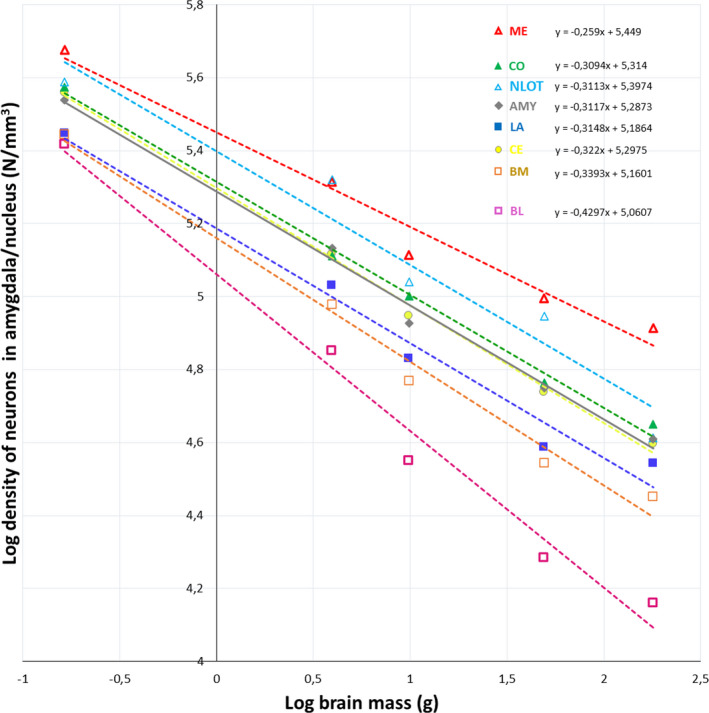
Neuron density in the whole amygdala and its individual nuclei plotted against the brain mass. AMY – whole amygdala, LA ‐ lateral nucleus, BL ‐ basolateral nucleus, BM ‐ basomedial nucleus, CE ‐ central nucleus, CO ‐ cortical nucleus, ME ‐ medial nucleus, NLOT‐ nucleus of the lateral olfactory tract
FIGURE 6.
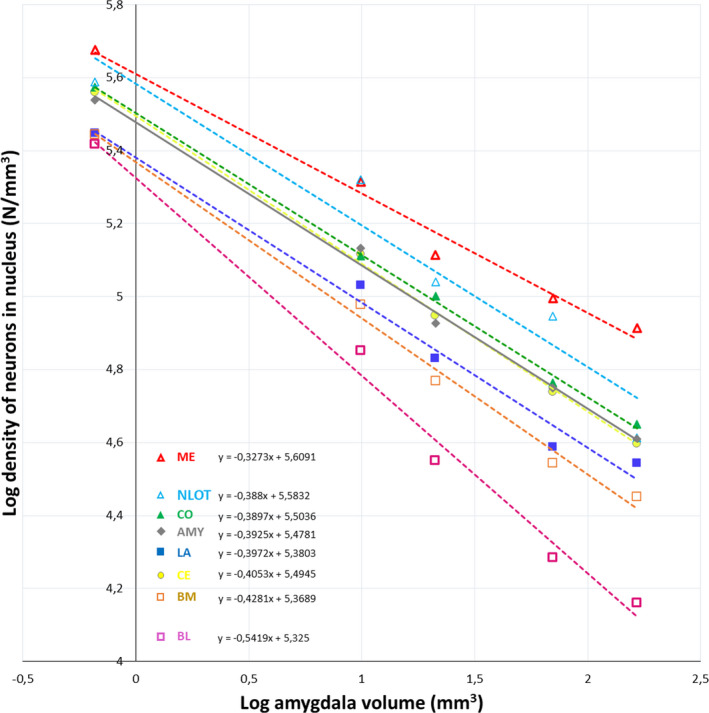
Neuron density in the individual amygdala nuclei plotted against the whole amygdala volume. LA ‐ lateral nucleus, BL ‐ basolateral nucleus, BM ‐ basomedial nucleus, CE ‐ central nucleus, CO ‐ cortical nucleus, ME ‐ medial nucleus, NLOT‐ nucleus of the lateral olfactory tract
FIGURE 7.
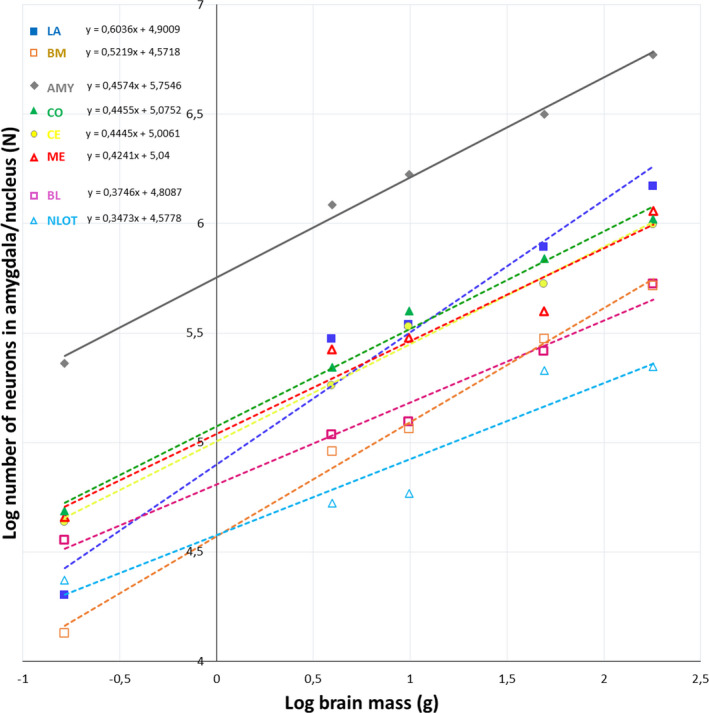
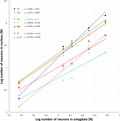
Neuron numbers in the whole amygdala and its individual nuclei plotted against the brain mass. AMY – whole amygdala, LA ‐ lateral nucleus, BL ‐ basolateral nucleus, BM ‐ basomedial nucleus, CE ‐ central nucleus, CO ‐ cortical nucleus, ME ‐ medial nucleus, NLOT‐ nucleus of the lateral olfactory tract
FIGURE 8.
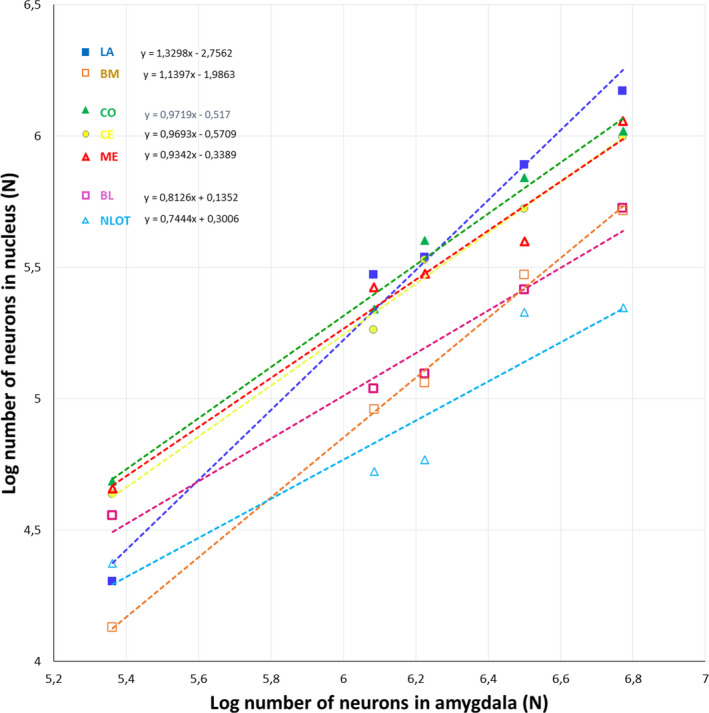
Neuron numbers in individual amygdala nuclei plotted against neuron number in the whole amygdala. LA ‐ lateral nucleus, BL ‐ basolateral nucleus, BM ‐ basomedial nucleus, CE ‐ central nucleus, CO ‐ cortical nucleus, ME ‐ medial nucleus, NLOT‐ nucleus of the lateral olfactory tract
2.5. Statistical analysis
Variables such as percentage of volume and percentage of neurons were analysed statistically (Tables S2A,B and S5A,B). The non‐parametric method was used throughout the analysis and all calculations were performed using Statistica 6.0 (TIBCO Software Inc.,). The differences between five species (common shrew, guinea pig, rabbit, fox and domestica pig) per each of seven nuclei were calculated assuming that the statistical significance α = 0.05, and statistical power (1‐β) was equal to 0.95. The data from percentage of volumes and neurons were averaged and examined for normal distribution by Shapiro–Wilk tests and the examined homogeneity of variance was used. A one‐way ANOVA test was used and if significant variation was present, post hoc Tukey test was applied. The data are expressed as ANOVAs (F‐statistics and p values) and post hoc Tukey (error between MS and p values). The level of significance was set at p ≤ 0.05*, p ≤ 0.01**, p ≤ 0.001***.
3. RESULTS
3D volumetric representations and relationships among various amygdala nuclei in the studied species are visualized in Figures 1 and 2. The morphometric data concerning the individual amygdala nuclei in five studied species are demonstrated in Figures 3, 4, 5, 6, 7, 8 and in the Tables S1–S5. It is important to note that the anterior view of the amygdala seen in the 3D reconstructions (Figure 1C) as well as data on the volumes, neuron density and neuron numbers in the entire amygdala and individual amygdaloid nuclei for the common shrew, guinea pig and rabbit were previously published and are available in some papers (Równiak et al., 2004, 2005, 2007), whereas data on these parameters from the fox and pig have never been presented before. Data of the common shrew, guinea pig and rabbit were used in the present study only for comparisons with data on the fox and pig.
3.1. Volume
Volumetric comparisons of the amygdala and its individual nuclei in the common shrew, guinea pig, rabbit, fox and pig revealed that in relation to brain mass all of them scale with negative allometry (Figure 3). When volumes and volumetric percentages of the individual amygdala nuclei are analysed in relation to the whole amygdala volume, they can be categorized into three different groups: those that scale with positive allometry (LA and BM), those that scale with negative allometry (ME and NLOT) and those with an allometric coefficient not significantly different from isometry (BL, CE and CO) (Figure 4 and Table S2).
Statistical analysis demonstrated that the percentages of LA volume (F(4, 25) = 496.85, p < 0.001***) differed significantly in most of the animals tested (MS = 0.647, p < 0.01**) except for these values in the amygdala of the guinea pig and fox (MS = 0.647, p = 0.154) (Table S2A,B). The percentages of BM volume (F(4, 25) = 80.94, p < 0.001***) did not differ only in the guinea pig and rabbit (MS = 0.233, p = 0.238). Furthermore, the percentages of ME volume (F(4, 25) = 346.10, p < 0.001***) differed significantly in all animals tested (MS = 0.219, p < 0.001***). These percentages for NLOT (F(4, 25) = 1629.14, p < 0.001***) did not differ only in the guinea pig and rabbit (MS = 0.030, p = 0.563), but also in the fox and pig (MS = 0.030, p = 0.142). Finally, the percentages of BL volume (F(4, 25) = 80.94, p < 0.001***) differed significantly in most of the animals tested (MS = 0.576, p < 0.05*), except for these values in the guinea pig and rabbit (MS = 0.576, p = 0.088). These percentages for CE (F(4, 25) = 54.95, p < 0.001***) in the guinea pig did not differ significantly from the corresponding values in the fox (MS = 0.461, p = 0.434) or the domestic pig (MS = 0.461, p = 0.064). They also did not differ in the common shrew and rabbit (MS = 0.461, p = 0.972). The percentages of CO volume (F(4, 25) = 36.39, p < 0.001***) did not differ in the common shrew and rabbit (MS = 0.712, p = 0.154), or the guinea pig and fox (MS = 0.712, p = 0.733).
3.2. Neuron density
The density of neurons in the whole amygdala and individual nuclei scale with strong negative allometry in relation the brain mass and have values of allometric coefficient in a range from −0.26 to −0.43 (Figure 5). When neuron density in the individual nuclei is analysed in relation to the whole amygdala volume they also scale with negative allometry and they can be categorized into three different groups: nuclei with values of allometric coefficient significantly lower than value for whole amygdala (BL), nuclei with values that are significantly higher (ME) and nuclei with values that are quite similar to value for whole amygdala (NLOT, CE, CO, LA and BM) (Figure 6).
3.3. Neuron number
The neuron numbers of the whole amygdala and individual nuclei scale allometrically with the brain mass and have regression slopes ranging from 0.60 to 0.35, indicating a negative allometric relationship for all species studied (Figure 7). When neuron numbers and percentages of neurons in the individual amygdala nuclei are analysed in relation to the neuron number in the whole amygdala, they can be categorized into three different groups: those that scale with positive allometry (LA and BM), those scaling with negative allometry (BL and NLOT) and those with an allometric coefficient not significantly different from isometry (CE, CO and ME) (Figure 8 and Table S5).
Statistical comparisons of the percentages of neurons revealed that these percentages in LA (F(4, 25) = 309.59, p < 0.001***) differed significantly (MS = 0.929, p < 0.001***), except these values in the amygdala of the guinea pig and fox (MS = 0.929, p = 0.684), the guinea pig and pig (MS = 0.929, p = 0.313) as well as the fox and pig (MS = 0.929, p = 0.533) (Table S5A,B). These percentages in BM (F(4, 25) = 62.75, p < 0.001***) did not differ in the guinea pig and rabbit (MS = 0.202, p = 0.071), or the fox and pig (MS = 0.202, p = 0.063). Moreover, the percentages of neurons in BL (F(4, 25) = 136.75, p < 0.001***) did not differ significantly in the amygdala of the guinea pig and fox (MS = 0.467, p = 0.181), the guinea pig and pig (MS = 0.467, p = 0.992), or the rabbit and fox (MS = 0.467, p = 0.154). These percentages in NLOT (F(4, 25) = 687.56, p < 0.001***) did not differ only in the guinea pig and fox (MS = 0.069, p = 0.114), or the rabbit and pig (MS = 0.069, p = 0.153). Finally, the percentage of neurons in CE (F(4, 25) = 26.58, p < 0.001***) differed significantly (MS = 0.950, p < 0.05*), except for the values in the amygdala of the guinea pig and fox (MS = 0.950, p = 0.184), guinea pig and pig (MS = 0.950, p = 0.151), as well as the fox and pig (MS = 0.950, p = 0.99). These percentages in CO (F(4, 25) = 35.01, p < 0.001***) did not differ in the common shrew and fox (MS = 1.164, p = 0.893), or the guinea pig and pig (MS = 1.164, p = 0.314). The percentages of neurons in ME (F(4, 25) = 48.27, p < 0.001**) did not differ in the common shrew and pig (MS = 0.931, p = 0.364), or the rabbit and pig (MS = 0.931, p = 0.063).
4. DISCUSSION
To the best of the authors' knowledge, the present study, for the first time, provides quantitative information on the morphological characteristics of the main amygdala nuclei in five mammalian species representing five different mammalian orders. The results show that the volume of the amygdala and its individual nuclei scale with negative allometry in relation to brain mass. However, in relation to whole amygdala volume, volumes and volumetric percentages of LA and BM scale with positive allometry, these values for ME and NLOT scale with negative allometry while the values of these parameters for BL, CE and CO scale with isometry. Moreover, density of neurons scales with strong negative allometry relative to both brain mass and amygdala volume with values of allometric coefficient below zero across studied species. This value for BL is significantly lower than that for whole amygdala, for ME it is significantly higher while values for NLOT, CE, CO, LA and BM are quite similar to value for whole amygdala. Finally, neuron numbers in the whole amygdala and its individual nuclei scale with negative allometry in relation to brain mass. However, in relation to the number of neurons in the whole amygdala, neuron numbers and percentages of neurons for LA and BM scale with positive allometry, for BL and NLOT they scale with negative allometry while the values of these parameters for CE, CO and ME scale with isometry. These results clearly indicate that each of the nuclei studied displays a different and unique pattern of evolution in relation to brain mass or whole amygdala volume, and this diversity contributes to the unique structure of the amygdala in various mammalian species. These unique patterns do not match well with the classical divisions of the amygdala into basolateral, central and corticomedial regions or similar anatomical concepts (Breathnach & Goldby, 1954; Krettek & Price, 1978; LeDoux, 2007), however, in some way, they reflect the diversity revealed by the expression of homeobox genes such us Emx‐1, Dlx‐2, Pax‐6 etc. in embryological studies (Martínez‐García et al., 2002; Medina et al., 2004; Moreno & González, 2007).
The present results demonstrate that volumes of the amygdala and its individual nuclei scale with negative allometry relative to the brain mass. However, in relation to the whole amygdala volume, the volumes and volumetric percentages of LA and BM scale with positive allometry. These values for ME and NLOT scale with negative allometry while these parameters for BL, CE and CO scale with isometry. Thus, these results coincide well with the general impression of Crosby and Humphrey (1944) who reported that when the amygdala of the common shrew and human are compared, "… the lateral, basal and accessory basal nuclei occupy a proportionately much larger part of the human amygdaloid area. On the contrary, the medial nucleus and nucleus of the lateral olfactory tract … are relatively considerably reduced in man. The cortical and the central amygdaloid nuclei are fairly constant in proportionate size in the two forms.” Moreover, similar volumetric tendency was also described by Stephan et al. (1987), however, there are some details in these data which are different from the results of the present study and Crosby and Humphrey (1944). For example, those authors reported that changes in the relative size from insectivores to humans show a definite tendency to increase in the small‐celled components of the basolateral amygdala (LA and BM) while the size increase of the large‐celled part of the basal nucleus, that is, BL, is less than that. Moreover, these studies indicated that NLOT becomes distinctly reduced. However, the authors emphasized the fairly constant volume of ME in all studied species. There are also other comparative studies which partially corroborate the present results. For example, (Chareyron et al., 2011) compared the rat, monkey and human amygdala, and reported that LA, BL and BM are much larger in the monkey and human than in the rat while CE and ME become substantially reduced in this series. Breathnach and Goldby (1954) reported that in the porpoise and sheep the volumes of the basolateral nuclei are well‐developed, and they reach almost 60% of the amygdala volume, which is very similar to the values found in the pig and fox in the present study. Interestingly, these four animals represent different clades and have large gyrencephalic brains with well‐developed neocortex. Thus, similarity in the proportionate size of the basolateral amygdala observed across these four species may be an example of evolutionary convergence.
The present results and all other volumetric studies (Chareyron et al., 2011; Crosby & Humphrey, 1944; Stephan et al., 1987) clearly show that the amygdala did not evolve as a single structure but was substantially reorganized during mammalian phylogeny. The mechanisms of such reorganization are still under debate at present (Finlay et al., 2001). One of the concepts, mosaic‐like evolution, proposes that brain structures with major anatomical and functional links evolve together independently of evolutionary changes in other unrelated structures (Barton & Harvey, 2000). This concept allows to describe why volumes of LA, BM and even BL scale with positive allometry, the volume of CE displays isometry, and volumes of ME and NLOT scale with negative allometry across studied species when they are arranged with the increasing brain mass. For example, relative enlargement of LA, BL and BM parallels size progression of the neocortex (Frahm et al., 1982) with which they are strongly anatomically and functionally linked via extensive connection (Pitkänen et al., 2000; Swanson & Petrovich, 1998). Similarly, a relative reduction of ME and NLOT parallels a regression course of the olfactory bulbs (Baron et al., 1983) with which they are strongly linked (Pitkänen et al., 2000; Swanson & Petrovich, 1998). Finally, CE has strong links with visceral and autonomic brain centres (Swanson & Petrovich, 1998) which are essential for all animals and, thus, presumed to be conserved throughout the evolution (Stephan et al., 1987), and the relative size of CE follows the same pattern. Another concept suggests that special selection of particular brain areas for specific functions (mosaic‐like changes) does occur, but it is a minor factor compared to the large‐scale covariance of the whole brain. Thus, there are developmental constraints and linked regularities in the development and evolution of mammalian brains (Finlay et al., 2001; Herculano‐Houzel et al., 2014; Montgomery et al., 2016). These constraints are probably responsible for the fact that ME in the porpoise and ME and NLOT in the fin‐whale, are quite well‐developed in volume although both animals are anosmic (Breathnach & Goldby, 1954).
The present results also show that neuron density scales with strong negative allometry relative to both brain mass and amygdala volume with values of allometric coefficient below zero across studied species. This value for BL is significantly lower than that for whole amygdala, for ME it is significantly higher while values for NLOT, CE, CO, LA and BM are quite similar to value for whole amygdala. The phenomenon of reduced neuron density with increased size of the brain has been previously described in the amygdala (Chareyron et al., 2011; Równiak & Bogus‐Nowakowska, 2020) and some other brain regions (Herculano‐Houzel et al., 2014). For example, according to Chareyron et al. (2011) in LA there were in the order of 99,000 neurons per mm3 in the rat, 42,000 neurons per mm3 in the monkey and 9000 neurons per mm3 in humans. Moreover, neuron density was between 2.36 (LA), 3.73 (BL) and 2.71 (BM) times lower in monkeys than in rats. It is worth mentioning that according to Herculano‐Houzel et al. (2014), neuron density is an important factor in neuronal scaling rules. These rules determine and diversify the neuron number in the same brain structures of various species. For example, according to this concept, with increasing brain size, the number of neurons in the cortex, cerebellum, olfactory regions and rest of the brain (brainstem with striatum) enlarge due to different scaling rules, which are the same for all mammalian clades and which comprise new neuron allocation mechanisms and neuron density decrease rates when the brain enlarges.
Importantly, there are also exceptions from the common rules in various clades. For example, in Eulipotyphla, the olfactory bulb (Herculano‐Houzel et al., 2014), and possibly other related structures such as NLOT (present results), clearly have higher neuronal densities than animals from other clades due to a modification that led to a smaller average neuronal size in all these regions (enabling higher neuronal densities). In contrast, in artiodactyls, the brainstem, striatum and olfactory bulb (and probably related structures) clearly have lower neuronal densities than animals from any other clades due to a modification in the other direction that led to larger average neuronal size (including soma, dendrites and axons) and, in this way, disrupt density rules common for other clades (Herculano‐Houzel et al., 2014). These scaling rules explain, for example, why the shrew NLOT is especially densely populated by very small neurons and why NLOT in the fox and pig have almost the same number of neurons although NLOT volume in the pig is twice as much. They also may constitute a mechanism that provides remarkable similarity of the amygdala in the fox and pig in terms of percentages of neuron numbers in most of the nuclei (they differ significantly only for CO and ME). However, these neuronal scaling rules do not explain the mechanisms of volumetric scaling of the amygdala nuclei during mammalian phylogeny. For example, the amygdala in the guinea pig and rabbit displays primarily remarkable volumetric similarity as volumetric percentages of BL, BM, CO, ME and NLOT are almost the same in both species. Similarities among the percentages of neuron numbers are less evident.
Finally, the present results show that neuron numbers in the whole amygdala and its individual nuclei scale with negative allometry in relation to brain mass. However, in relation to the number of neurons in the whole amygdala, neuron numbers and percentages of neurons for LA and BM scale with positive allometry, for BL and NLOT they scale with negative allometry while the values of these parameters for CE, CO and ME scale with isometry. Similar remodelling of the amygdala with increasing brain size was previously described comparing the rat, monkey and humans (Chareyron et al., 2011) and humans with various other primate species (Barger et al., 2012; Carlo et al., 2010). Interestingly, the diversity of evolutionary trajectories of the amygdala nuclei regarding neuron number coincide, to some extent, with the homeobox gene expressions in embryological studies (Martínez‐García et al., 2002; Medina et al., 2004; Moreno & González, 2007; Puelles et al., 2000; Puelles, 2017). However, mosaic‐like mechanisms also probably have a very significant impact in most cases (Barton & Harvey, 2000). For example, the volumes and neuron numbers in LA and BM scale with positive allometry in relation to the amygdala volume. Interestingly, both of these regions have a ventropallial origin (Martínez‐García et al., 2002; Medina et al., 2004; Moreno & González, 2007) but also extensive connections with the neocortex (Pitkänen et al., 2000; Swanson & Petrovich, 1998) which is very progressive during mammalian phylogeny (Frahm et al., 1982). A large part of CO is also a ventropallial derivative (Moreno & González, 2007). However, although the volume and neuron number in this region do not display enlargement with the increasing amygdala size, they are quite stable across studied species in spite of rather weak connections with the neocortex and very extensive links with regressive olfactory regions (Pitkänen et al., 2000; Swanson & Petrovich, 1998). Interestingly, recent comparative studies in tetrapods suggest that LA, BM and CO could together form a single multimodal region in the amygdala which integrates non‐olfactory and olfactory cues to create coherent responses (Moreno & González, 2007).
Although CE and ME have subpallial origin (Martínez‐García et al., 2002; Moreno & González, 2007; Puelles et al., 2000), CE is considered a striatal‐like territory while ME is a palidal‐like structure (Martínez‐García et al., 2002). Moreover, although both regions have quite different connections (Swanson & Petrovich, 1998), they are stable across the studied species in terms of the neuron number. CE has strong connections with the brain autonomic and visceral centres (Swanson & Petrovich, 1998), which are conserved during phylogeny (Stephan et al., 1987), and CE is also stable in volume. ME, which has extensive links with olfactory regions (Swanson & Petrovich, 1998), becomes relatively smaller in volume with the increasing amygdala size. This leaves BL and NLOT which display reduced neuron numbers with the increasing amygdala size. BL most probably has a lateropallial origin (Martínez‐García et al., 2002; Medina et al., 2004; Moreno & González, 2007) and especially extensive connections with the striatal and pallidal regions (Pitkänen et al., 2000). It is quite stable in volume, but the total number of neurons is reduced. NLOT is probably strongly reduced across studied species in both the volume and neuron number due to connections restricted mostly to the main olfactory bulb (Pitkänen et al., 2000), which is reduced during mammalian phylogeny (Baron et al., 1983, 1987). Surprisingly, according to recent studies, NLOT is the only derivative of the dorsal pallium in the amygdala (Remedios et al., 2007), a region which is a source of neocortex (Puelles et al., 2000). It is noteworthy that the simplified model described above is much more complex. For example, CO is actually formed by two components: ventral and lateral pallium (Medina et al., 2004; Moreno & González, 2007). Moreover, in NLOT, which is commonly treated as a single three‐layered structure, layer II is a derivative of dorsal pallium while layers I and III are ventropallial (Remedios et al., 2007). Finally, multiple telencephalic and extratelencephalic embryonic domains contribute neurons to ME (Bupesh et al., 2011).
One issue more is worth discussing. The present work is an extension of the previous paper (Równiak & Bogus‐Nowakowska, 2020) in which the volume, cell density and cell number were analysed in the major subdivisions of the amygdala. These subdivisions, that is, the basolateral amygdala (BLC), corticomedial amygdala (CMC) and central amygdala (CC), were characterized to show how these regions evolved during mammalian phylogeny in the common shrew, guinea pig, rabbit, fox and pig. The analysis revealed, among others, that the volume and neuron number of the BLC scale with positive allometry relative to the amygdala volume whereas CMC scales with negative allometry. The volume and neuron number of the CC display isometry, referring to the amygdala volume (Równiak & Bogus‐Nowakowska, 2020). However, the present results indicate that the relative enlargement of the individual BLC nuclei is substantially diversified. Indeed, the volumes of the small‐celled nuclei of the BLC, that is, LA and BM, scale with positive allometry relative to the amygdala volume, but the volume of BL scales isometrically. Moreover, the number of neurons in LA and BM scale with positive allometry relative to the neuron numbers in the whole amygdala, but in BL it scales even with negative allometry across studied species. Thus, in the studied animals, each amygdala nuclei displays a different and unique pattern of evolution in relation to the brain mass or the whole amygdala volume, and this diversity contributes to the unique flavour of the amygdala in various mammalian species. These unique patterns do not match well with the classical divisions of the amygdala into basolateral, central and corticomedial regions or similar anatomical concepts (Breathnach & Goldby, 1954; Krettek & Price, 1978; LeDoux, 2007; Równiak & Bogus‐Nowakowska, 2020), although they reflect diversity, as revealed by the homeobox gene expression in various embryological studies (Martínez‐García et al., 2002; Medina et al., 2004; Moreno & González, 2007).
CONFLICT OF INTEREST
The authors declare no conflict of interest.
AUTHOR CONTRIBUTIONS
Maciej Równiak conceived and designed the experiments; Maciej Równiak and Krystyna Bogus‐Nowakowska performed volumetric measurements and cell counts; Anna Kozłowska and Daniel Kalinowski performed statistical analyses; Maciej Równiak analysed the data and wrote the paper; Krystyna Bogus‐Nowakowska and Anna Kozłowska performed critical paper revisions.
Supporting information
Table S1‐5
Równiak, M. , Bogus‐Nowakowska, K. , Kalinowski, D. & Kozłowska, A. (2022) The evolutionary trajectories of the individual amygdala nuclei in the common shrew, guinea pig, rabbit, fox and pig: A consequence of embryological fate and mosaic‐like evolution. Journal of Anatomy, 240, 489–502. 10.1111/joa.13571
DATA AVAILABILITY STATEMENT
The data that support the findings of this study are available from the corresponding author upon reasonable request.
REFERENCES
- Barger, N. , Stefanacci, L. , Schumann, C.M. , Sherwood, C.C. , Annese, J. , Allman, J.M. et al. (2012) Neuronal populations in the basolateral nuclei of the amygdala are differentially increased in humans compared with apes: a stereological study. The Journal of Comparative Neurology, 520, 3035–3054. 10.1002/cne.23118 [DOI] [PMC free article] [PubMed] [Google Scholar]
- Baron, G. , Frahm, H.D. , Bhatnagar, K.P. et al. (1983) Comparison of brain structure volumes in Insectivora and primates. III. Main Olfactory Bulb (MOB). Journal Fur Hirnforschung, 24, 551–568. [PubMed] [Google Scholar]
- Baron, G. , Stephan, H. & Frahm, H.D. (1987) Comparison of brain structure volumes in Insectivora and primates. VI. Paleocortical components. Journal Fur Hirnforschung, 28, 463–477. [PubMed] [Google Scholar]
- Barton, R.A. & Harvey, P.H. (2000) Mosaic evolution of brain structure in mammals. Nature, 405, 1055. 10.1038/35016580 [DOI] [PubMed] [Google Scholar]
- Boissonnat, J.‐D. (1988) Shape reconstruction from planar cross sections. Computer Vision, Graphics, and Image Processing, 44, 1–29. 10.1016/S0734-189X(88)80028-8 [DOI] [Google Scholar]
- Bookstein, F.L. (1986) Size and shape spaces for landmark data in two dimensions. Statistical Science, 1, 181–222. [Google Scholar]
- Breathnach, A.S. & Goldby, F. (1954) The amygdaloid nuclei, hippocampus and other parts of the rhinencephalon in the porpoise (Phocaena phocaena). Journal of Anatomy, 88, 267–291. [PMC free article] [PubMed] [Google Scholar]
- Bupesh, M. , Legaz, I. , Abellán, A. & Medina, L. (2011) Multiple telencephalic and extratelencephalic embryonic domains contribute neurons to the medial extended amygdala. The Journal of Comparative Neurology, 519, 1505–1525. 10.1002/cne.22581 [DOI] [PubMed] [Google Scholar]
- Carlo, C.N. , Stefanacci, L. , Semendeferi, K. & Stevens, C.F. (2010) Comparative analyses of the neuron numbers and volumes of the amygdaloid complex in old and new world primates. Journal of Comparative Neurology, 518, 1176–1198. 10.1002/cne.22264 [DOI] [PubMed] [Google Scholar]
- Chareyron, L.J. , Banta Lavenex, P. , Amaral, D.G. & Lavenex, P. (2011) Stereological analysis of the rat and monkey amygdala. The Journal of Comparative Neurology, 519, 3218–3239. 10.1002/cne.22677 [DOI] [PMC free article] [PubMed] [Google Scholar]
- Crosby, E.C. & Humphrey, T. (1944) Studies of the vertebrate telencephalon. III. The amygdaloid complex in the shrew (Blarina brevicauda). Journal of Comparative Neurology, 81, 285–305. 10.1002/cne.900810305 [DOI] [Google Scholar]
- Fiala, J.C. (2005) Reconstruct: a free editor for serial section microscopy. Journal of Microscopy, 218, 52–61. 10.1111/j.1365-2818.2005.01466.x [DOI] [PubMed] [Google Scholar]
- Fiala, J.C. & Harris, K.M. (2001) Extending unbiased stereology of brain ultrastructure to three‐dimensional volumes. Journal of the American Medical Informatics Association, 8, 1–16. 10.1136/jamia.2001.0080001 [DOI] [PMC free article] [PubMed] [Google Scholar]
- Finlay, B.L. , Darlington, R.B. & Nicastro, N. (2001) Developmental structure in brain evolution. The Behavioral and Brain Sciences, 24, 263–278. [PubMed] [Google Scholar]
- Frahm, H.D. , Stephan, H. & Stephan, M. (1982) Comparison of brain structure volumes in Insectivora and Primates. I. Neocortex. Journal Für Hirnforschung, 23, 375–389. [PubMed] [Google Scholar]
- Garcia‐Calero, E. , Martínez‐de‐la‐Torre, M. & Puelles, L. (2020) A radial histogenetic model of the mouse pallial amygdala. Brain Structure and Function, 225, 1921–1956. 10.1007/s00429-020-02097-4 [DOI] [PMC free article] [PubMed] [Google Scholar]
- Gutiérrez‐Castellanos, N. , Martínez‐Marcos, A. , Martínez‐García, F. et al. (2010) Chemosensory function of the amygdala. Vitamins and Hormones, 83, 165–196. 10.1016/S0083-6729(10)83007-9 [DOI] [PubMed] [Google Scholar]
- Han, T.M. & De Vries, G.J. (1999) Neurogenesis of galanin cells in the bed nucleus of the stria terminalis and centromedial amygdala in rats: a model for sexual differentiation of neuronal phenotype. Journal of Neurobiology, 38, 491–498. [DOI] [PubMed] [Google Scholar]
- Herculano‐Houzel, S. , Manger, P.R. & Kaas, J.H. (2014) Brain scaling in mammalian evolution as a consequence of concerted and mosaic changes in numbers of neurons and average neuronal cell size. Frontiers in Neuroanatomy, 8, 77. 10.3389/fnana.2014.00077 [DOI] [PMC free article] [PubMed] [Google Scholar]
- Hong, W. , Kim, D.‐W. & Anderson, D.J. (2014) Antagonistic control of social versus repetitive self‐grooming behaviors by separable amygdala neuronal subsets. Cell, 158, 1348–1361. 10.1016/j.cell.2014.07.049 [DOI] [PMC free article] [PubMed] [Google Scholar]
- Janak, P.H. & Tye, K.M. (2015) From circuits to behaviour in the amygdala. Nature, 517, 284–292. 10.1038/nature14188 [DOI] [PMC free article] [PubMed] [Google Scholar]
- Kevetter, G.A. & Winans, S.S. (1981a) Connections of the corticomedial amygdala in the golden hamster. I. Efferents of the 'vomeronasal amygdala'. Journal of Comparative Neurology, 197, 81–98. [DOI] [PubMed] [Google Scholar]
- Kevetter, G.A. & Winans, S.S. (1981b) Connections of the corticomedial amygdala in the golden hamster. II. Efferents of the “olfactory amygdala” The Journal of Comparative Neurology, 197, 99–111. 10.1002/cne.901970108 [DOI] [PubMed] [Google Scholar]
- Krettek, J.E. & Price, J.L. (1978) A description of the amygdaloid complex in the rat and cat with observations on intra‐amygdaloid axonal connections. The Journal of Comparative Neurology, 178, 255–280. 10.1002/cne.901780205 [DOI] [PubMed] [Google Scholar]
- LeDoux, J.E. (2000) Emotion circuits in the brain. Annual Review of Neuroscience, 23, 155–184. 10.1146/annurev.neuro.23.1.155 [DOI] [PubMed] [Google Scholar]
- LeDoux, J. (2003) The emotional brain, fear, and the amygdala. Cellular and Molecular Neurobiology, 23, 727–738. [DOI] [PMC free article] [PubMed] [Google Scholar]
- LeDoux, J. (2007) The amygdala. Current Biology, 17, R868–R874. 10.1016/j.cub.2007.08.005 [DOI] [PubMed] [Google Scholar]
- Linsambarth, S. , Moraga‐Amaro, R. , Quintana‐Donoso, D. , Rojas, S. & Stehberg, J. (2017) The amygdala and anxiety. The Amygdala ‐ where Emotions Shape Perception, Learning and Memories. 10.5772/intechopen.68618 [DOI] [Google Scholar]
- Maras, P.M. & Petrulis, A. (2008) The posteromedial cortical amygdala regulates copulatory behavior, but not sexual odor preference, in the male Syrian hamster (Mesocricetus auratus). Neuroscience, 156, 425–435. [DOI] [PMC free article] [PubMed] [Google Scholar]
- Martínez‐García, F. , Martínez‐Marcos, A. & Lanuza, E. (2002) The pallial amygdala of amniote vertebrates: evolution of the concept, evolution of the structure. Brain Research Bulletin, 57, 463–469. [DOI] [PubMed] [Google Scholar]
- McDonald, A.J. (2020) Chapter 1 ‐ Functional neuroanatomy of the basolateral amygdala: neurons, neurotransmitters, and circuits. In Urban, J.H. & Rosenkranz, J.A. eds. Handbook of behavioral neuroscience. Cambridge, MA: Elsevier, pp. 1–38. [DOI] [PMC free article] [PubMed] [Google Scholar]
- Medina, L. , Legaz, I. , González, G. , De Castro, F. , Rubenstein, J.L. & Puelles, L. (2004) Expression of Dbx1, Neurogenin 2, Semaphorin 5A, Cadherin 8, and Emx1 distinguish ventral and lateral pallial histogenetic divisions in the developing mouse claustroamygdaloid complex: pallial divisions of claustrum and amygdala. The Journal of Comparative Neurology, 474, 504–523. 10.1002/cne.20141 [DOI] [PubMed] [Google Scholar]
- Montgomery, S.H. , Mundy, N.I. & Barton, R.A. (2016) Brain evolution and development: adaptation, allometry and constraint. Proceedings of the Royal Society B: Biological Sciences, 283, 10.1098/rspb.2016.0433 [DOI] [PMC free article] [PubMed] [Google Scholar]
- Moreno, N. & González, A. (2007) Evolution of the amygdaloid complex in vertebrates, with special reference to the anamnio‐amniotic transition. Journal of Anatomy, 211, 151–163. 10.1111/j.1469-7580.2007.00780.x [DOI] [PMC free article] [PubMed] [Google Scholar]
- Muller, J.F. , Mascagni, F. & McDonald, A.J. (2005) Coupled networks of parvalbumin‐immunoreactive interneurons in the rat basolateral amygdala. Journal of Neuroscience, 25, 7366–7376. 10.1523/JNEUROSCI.0899-05.2005 [DOI] [PMC free article] [PubMed] [Google Scholar]
- Newman, S.W. (1999) The medial extended amygdala in male reproductive behavior. A node in the mammalian social behavior network. Annals of the New York Academy of Sciences, 877, 242–257. [DOI] [PubMed] [Google Scholar]
- Pabba, M. (2013) Evolutionary development of the amygdaloid complex. Frontiers in Neuroanatomy, 7, 10.3389/fnana.2013.00027 [DOI] [PMC free article] [PubMed] [Google Scholar]
- Pape, H.‐C. & Pare, D. (2010) Plastic synaptic networks of the amygdala for the acquisition, expression, and extinction of conditioned fear. Physiological Reviews, 90, 419–463. 10.1152/physrev.00037.2009 [DOI] [PMC free article] [PubMed] [Google Scholar]
- Pitkänen, A. , Jolkkonen, E. & Kemppainen, S. (2000) Anatomic heterogeneity of the rat amygdaloid complex. Folia Morphol (Warsz), 59, 1–23. [PubMed] [Google Scholar]
- Prager, E.M. , Bergstrom, H.C. , Wynn, G.H. & Braga, M.F.M. (2016) The basolateral amygdala gabaergic system in health and disease. Journal of Neuroscience Research, 94, 548–567. 10.1002/jnr.23690 [DOI] [PMC free article] [PubMed] [Google Scholar]
- Puelles, L. (2017) Comments on the updated tetrapartite pallium model in the mouse and chick, featuring a homologous claustro‐insular complex. Brain, Behavior and Evolution, 90, 171–189. 10.1159/000479782 [DOI] [PubMed] [Google Scholar]
- Puelles, L. , Kuwana, E. , Puelles, E. , Bulfone, A. , Shimamura, K. , Keleher, J. et al. (2000) Pallial and subpallial derivatives in the embryonic chick and mouse telencephalon, traced by the expression of the genes Dlx‐2, Emx‐1, Nkx‐2.1, Pax‐6, and Tbr‐1. The Journal of Comparative Neurology, 424, 409–438. [DOI] [PubMed] [Google Scholar]
- Remedios, R. , Huilgol, D. , Saha, B. , Hari, P. , Bhatnagar, L. , Kowalczyk, T. et al. (2007) A stream of cells migrating from the caudal telencephalon reveals a link between the amygdala and neocortex. Nature Neuroscience, 10, 1141–1150. 10.1038/nn1955 [DOI] [PubMed] [Google Scholar]
- Richardson, J.S. (1973) The amygdala: historical and functional analysis. Acta Neurobiologiae Experimentalis, 33, 623–648. [PubMed] [Google Scholar]
- Rohlf, F.J. (1999) Shape statistics: procrustes superimpositions and tangent spaces. J of Classification, 16, 197–223. 10.1007/s003579900054 [DOI] [Google Scholar]
- Rohlf, F.J. & Slice, D. (1990) Extensions of the procrustes method for the optimal superimposition of landmarks. Systematic Zoology, 39, 40–59. 10.2307/2992207 [DOI] [Google Scholar]
- Równiak, M. (2013) The amygdala in the guinea pig is sexually dimorphic–a morphometric study. Brain Research, 1524, 44–53. 10.1016/j.brainres.2013.06.005 [DOI] [PubMed] [Google Scholar]
- Równiak, M. & Bogus‐Nowakowska, K. (2020) The amygdala of the common shrew, guinea pig, rabbit, fox and pig: five flavours of the mammalian amygdala as a consequence of clade‐specific mosaic‐like evolution. Journal of Anatomy, 236(5):891‐905. 10.1111/joa.13148 [DOI] [PMC free article] [PubMed] [Google Scholar]
- Równiak, M. , Robak, A. , Szteyn, S. et al. (2005) A morphometric study of the amygdala in the guinea pig. Folia Morphologica, 64, 151–160. [PubMed] [Google Scholar]
- Równiak, M. , Robak, A. , Szteyn, S. , Bogus‐Nowakowska, K. , Wasilewska, B. & Najdzion, J. (2007) The morphometric study of the amygdala in the rabbit. Folia Morphologica, 66, 44–53. [PubMed] [Google Scholar]
- Równiak, M. , Szteyn, S. & Robak, A. (2003) A comparative study of the mammalian amygdala: a Golgi study of the basolateral amygdala. Folia Morphologica, 62, 331–339. [PubMed] [Google Scholar]
- Równiak, M. , Szteyn, S. & Robak, A. (2004) A morphometric study of the amygdala in the common shrew. Folia Morphologica, 63, 387–396. [PubMed] [Google Scholar]
- Sah, P. , Faber, E.S.L. , Lopez de armentia, M. & Power, J. (2003) The amygdaloid complex: anatomy and physiology. Physiological Reviews, 83, 803–834. 10.1152/physrev.00002.2003 [DOI] [PubMed] [Google Scholar]
- Schröder, H. , Moser, N. & Huggenberger, S. (2020) Neuroanatomy of the mouse: an introduction. Heidelberg: Springer International Publishing. 10.1007/978-3-030-19898-5 [DOI] [Google Scholar]
- Stephan, H. , Frahm, H.D. & Baron, G. (1987) Comparison of brain structure volumes in Insectivora and primates. VII. Amygdaloid Components. Journal Fur Hirnforschung, 28, 571–584. [PubMed] [Google Scholar]
- Swanson, L.W. & Petrovich, G.D. (1998) What is the amygdala? Trends in Neurosciences, 21, 323–331. [DOI] [PubMed] [Google Scholar]
- West, M.J. & Gundersen, H.J.G. (1990) Unbiased stereological estimation of the number of neurons in the human hippocampus. Journal of Comparative Neurology, 296, 1–22. [DOI] [PubMed] [Google Scholar]
Associated Data
This section collects any data citations, data availability statements, or supplementary materials included in this article.
Supplementary Materials
Table S1‐5
Data Availability Statement
The data that support the findings of this study are available from the corresponding author upon reasonable request.