

Abstract
Malignant pleural mesothelioma (MPM) arises from mesothelial cells lining the pleural cavity of asbestos‐exposed individuals and rapidly leads to death. MPM harbors loss‐of‐function mutations in BAP1, NF2, CDKN2A, and TP53, but isolated deletion of these genes alone in mice does not cause MPM and mouse models of the disease are sparse. Here, we show that a proportion of human MPM harbor point mutations, copy number alterations, and overexpression of KRAS with or without TP53 changes. These are likely pathogenic, since ectopic expression of mutant KRAS G12D in the pleural mesothelium of conditional mice causes epithelioid MPM and cooperates with TP53 deletion to drive a more aggressive disease form with biphasic features and pleural effusions. Murine MPM cell lines derived from these tumors carry the initiating KRAS G12D lesions, secondary Bap1 alterations, and human MPM‐like gene expression profiles. Moreover, they are transplantable and actionable by KRAS inhibition. Our results indicate that KRAS alterations alone or in accomplice with TP53 alterations likely play an important and underestimated role in a proportion of patients with MPM, which warrants further exploration.
Keywords: asbestos, BAP1, KRAS, NF2, TP53
Subject Categories: Cancer, Respiratory System
Human malignant pleural mesothelioma (MPM) is a devastating occupational cancer that kills more than 200,000 individuals annually. Some MPM harbor mutations of the KRAS proto‐oncogene, but their functional significance is unknown and experimental models for these MPM are not available.
The paper explained.
Problem
In a proportion of patients with human malignant pleural mesothelioma (MPM), a dreadful disease most commonly inflicted by occupational asbestos inhalation but also possibly by smoking, sporadic mutations of KRAS is observed. However, their functional impact and significance have not been addressed and experimental model systems suitable for the study of this molecular subclass of MPM are not available.
Results
We systematically interrogate KRAS alterations in the TCGA pan‐cancer dataset of human MPM and in MPM patients from our centers employing sensitive techniques. 20% of TCGA and 50% of our patients show activating mutations or amplification of KRAS, in 30% of the cases accompanied by TP53 mutations or loss. These changes are associated with enhanced signaling downstream of KRAS. KRAS and TP53 are shown to cooperate for MPM development in conditional mouse models. Three new MPM cell lines are developed that are highly similar to the human disease, and these experimental MPM models are shown to be actionable by a novel KRAS inhibitor.
Impact
Multiple new tools for investigations on MPM biology are provided together with proof‐of‐concept data that support involvement of KRAS signaling in MPM pathogenesis. The findings can be rapidly translated to clinical trials of KRAS pathway inhibition in a molecular subset of MPM patients.
Introduction
Malignant mesothelioma annually kills up to forty persons per million population worldwide (Liu et al, 2017; Carbone et al, 2019). It most commonly arises from the mesothelium of the pleural cavities that line the lungs (visceral pleura) and the interior chest wall (parietal pleura) and only occasionally from the peritoneal mesothelium (Bibby et al, 2016; Mutti et al, 2018). Human malignant pleural mesothelioma (MPM) is mainly caused by inhaled asbestos, which caused 145,235 deaths in 1990 increasing by 51% to 218,827 deaths in 2016, most of them in high‐income countries (GBD 2016 Occupational Carcinogens Collaborators, 2020). However, other bioactive materials such as nanofibers can also cause mesothelioma in rodents and possibly in humans (Ryman‐Rasmussen et al, 2009; Nagai et al, 2011). MPM manifests with or without a malignant pleural effusion (MPE), that is, exudative fluid accumulation that causes chest pain and dyspnea, and is histologically classified into epithelioid, sarcomatoid, or biphasic subtypes (Scherpereel et al, 2010; Galateau‐Salle et al, 2016; Thomas et al, 2017; Paajanen et al, 2018). The disease progresses relentlessly despite contemporary combination therapies, with a median survival of mere 9–18 months (Zalcman et al, 2016; Yap et al, 2017; Scherpereel et al, 2018; Courtiol et al, 2019). The clinicopathologic manifestation of MPM at diagnosis impacts patient survival, with advanced stage, sarcomatoid histologic subtype, poor physical performance status, elevated numbers of peripheral blood leucocytes, male sex, uncontrolled pleural effusion, and other factors portending dismal prognosis (Fennell et al, 2005; Tsao et al, 2009; Pass et al, 2016; Rusch et al, 2016; Cheah et al, 2017; Thomas et al, 2017; Kindler et al, 2018; Hassan et al, 2019).
Multiple comprehensive analyses of MPM genomes identified a mosaic mutational landscape characterized by widespread loss‐of‐function of tumor suppressor genes (BAP1, NF2, CDKN2A, TP53, TSC1, etc), sporadic gain‐of‐function of proto‐oncogenes (PIK3CA, EGFR, KRAS, NRAS, HRAS, BRAF, etc), and inconclusive addiction/exclusion patterns thereof (Bott et al, 2011; Enomoto et al, 2012; Mezzapelle et al, 2013; Shukuya et al; 2014; Guo et al, 2015; Lo Iacono et al, 2015; Bueno et al, 2016; De Rienzo et al, 2016; Kato et al, 2016; Hmeljak et al, 2018). Interestingly, KRAS proto‐oncogene GTPase (KRAS) alterations were detected more frequently using targeted compared with massive parallel sequencing approaches by the studies above. In addition, NF2 mutations that cause persistent KRAS signaling (Tikoo et al, 1994), as well as BAP1 and CDKN2A mutations that are functionally related with TP53 loss‐of‐function (Stott et al, 1998; Arizti et al, 2000; Bi et al, 2016), are very common in MPM. KRAS mutations have also been shown to activate the TP53 cell cycle checkpoint (Matallanas et al, 2011). In addition to clinicopathologic presentation, MPM mutations also impact prognosis, with TP53 and CDKN2A loss‐of‐function occurring more frequently in non‐epithelioid MPM and portending poor survival (Bott et al, 2011; Yap et al, 2017).
There is an unmet clinical need for mouse models that recapitulate the mutation spectrum and clinicopathologic manifestations of human MPM. In this regard, MPM cell lines for transplantable models, asbestos‐induced mouse models, and genetic models of the disease are characterized by scarcity, limited availability, and significant difficulty of implementation (Ikediobi et al, 2006; Fridlender et al, 2009; Forbes et al, 2015; Agalioti et al, 2017). Interestingly, standalone mesothelial loss‐of‐function of BAP1, NF2, CDKN2A, TP53, and TSC1 is not sufficient to cause MPM in mice, rendering the drivers of the disease resistant to functional validation (Jongsma et al, 2008; Guo et al, 2014; Menges et al, 2014; Xu et al, 2014; Kukuyan et al, 2019). Moreover, faithful models of MPM are urgently needed, as most existing studies have focused on the rare peritoneal disease and only one elegant study targeted NF2/CDKN2A/TP53 deletions to the pleural mesothelium (Jongsma et al, 2008). Such mouse models would represent different molecular subtypes of MPM, would have high penetrance, and would also be specific for MPM with or without MPE development.
Based on our previous observation of a Kras G12C mutation (Kras, Mus musculus Kirsten rat sarcoma viral oncogene homolog) in an asbestos‐induced murine MPM cell line (Agalioti et al, 2017; Marazioti et al, 2018), on published work that showed RAS pathway activation in MPM (Patel et al, 2007), and on the functional interconnection between mutant KRAS and TP53 signaling (Matallanas et al, 2011), we hypothesized that KRAS alterations are involved in MPM development, alone or in accomplice with TP53 alterations. Indeed, here we query the TCGA MPM dataset and employ sensitive methods in our own clinical cohorts to discover KRAS and TP53 alterations in a subset of patients with MPM. We further show that targeting oncogenic KRAS G12D alone to the murine pleural mesothelium causes MPM and, when combined with Trp53 deletion, triggers aggressive MPM with MPE. Murine MPM is shown to carry the initiating KRAS G12D mutations, to harbor Bap1 inactivating mutations, to be transmissible to naïve mice, and to resemble the molecular signatures of human MPM. Hence, KRAS mutations are implicated in MPM pathobiology, the contributions of TP53 in shaping the disease's manifestations are described, and new mouse models are provided for the study of the biology and therapy of a molecular subclass of MPM that is driven by KRAS signaling.
Results
KRAS and TP53 alterations in human MPM
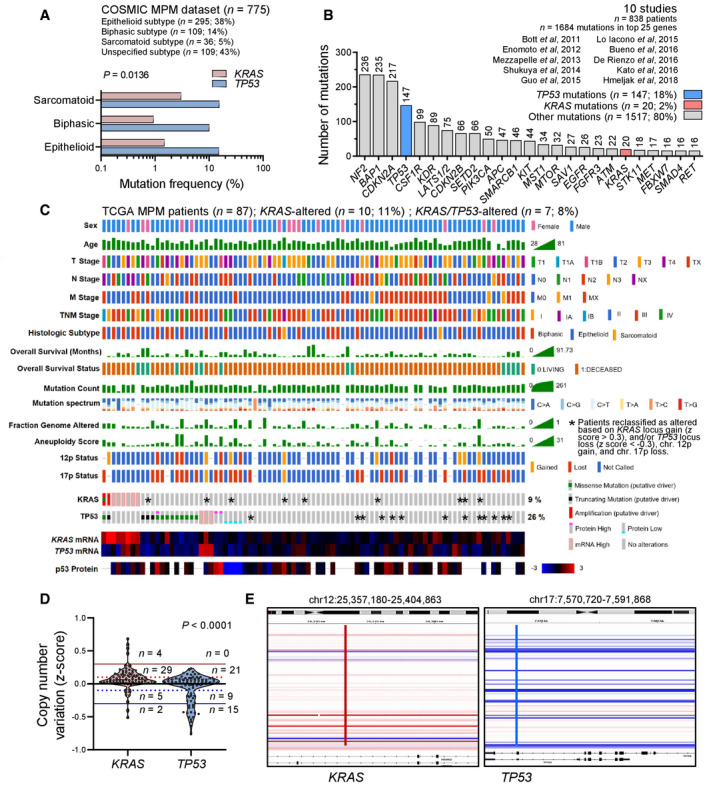
In MPM from the catalogue of somatic mutations in cancer (COSMIC; Forbes et al, 2015), KRAS and TP53 mutation frequencies of 1–3% and 10–20%, respectively, were evident (Fig 1A; dataset available at https://cancer.sanger.ac.uk/cosmic/browse/tissue?wgs=off&sn=pleura&ss=all&hn=mesothelioma&sh=&in=t&src=tissue&all_data=n). KRAS and TP53 mutations comprised, respectively, 2 and 18% of all mutated genes in a dataset composed of 10 large MPM studies (Bott et al, 2011; Enomoto et al, 2012; Mezzapelle et al, 2013; Shukuya et al, 2014; Guo et al, 2015; Lo Iacono et al, 2015; Bueno et al, 2016; De Rienzo et al, 2016; Kato et al, 2016; Hmeljak et al, 2018) (Fig 1B). The aforementioned analysis consisted of manual curation of the main and supplementary data, while the latter study, the cancer genome atlas (TCGA) pan‐cancer MPM dataset (n = 86 patients; Hmeljak et al, 2018) available at https://www.cbioportal.org/study/summary?id=meso_tcga_pan_can_atlas_2018 (Cerami et al, 2012), was analyzed in detail, via a systematic query of mutations, copy number alterations, and mRNA and protein expression of KRAS and TP53. According to TCGA criteria, eight patients showed alterations in KRAS two of which had dual KRAS/TP53 changes. However, when copy number alterations (CNA) at the KRAS12p12.1 (position chr12:25,357,180–25,404,863) and TP53 17p13.1 (position chr17:7,570,720–7,591,868) loci were scrutinized using integrative genomics viewer (Robinson et al, 2011), additional high KRAS gains were discovered in nine and deep TP53 losses in 13 patients, with five patients harboring changes in both genes (Fig 1C–E). For this, KRAS locus gain (z > 0.3) and/or TP53 locus loss (z < −0.3), as well as chromosome 12p gains and 17p losses, were taken into account (Smith & Sheltzer, 2018). Hence, a KRAS alteration alone was determined in n = 10 patients (12%) and a combined KRAS/TP53 alteration in n = 7 (8%), for a total KRAS alteration rate of 20%.
Figure 1. KRAS alterations in human MPM from published datasets and the cancer genome atlas (TCGA) pan‐cancer MPM cohort.
-
AKRAS and TP53 mutation frequencies in MPM from the catalogue of somatic mutations in cancer (COSMIC) stratified by histologic subtype (n = 775 patients).
-
BTop 25 mutated genes from 10 molecular studies of human MPM (n = 838 patients).
-
C–EKRAS and TP53 alterations in the cancer genome atlas (TCGA) pan‐cancer MPM dataset (n = 86 patients). Shown are clinical and molecular data plot with alteration frequencies (C) and patients reclassified as KRAS‐ or TP53‐altered (asterisks), copy number variation data summary (D), and segments of the KRAS and TP53 loci (E).
Data information: In (A), data are presented as cumulative percentages of patients tested mutant respective to patients tested for every gene. P, overall probability, two‐way ANOVA. In (B), data are presented as cumulative numbers (n; numbers above bars) and percentages (%) of patients with KRAS (red bar), TP53 (blue bar), and other (gray bars) mutations. In (C), each column represents one patient and each row one clinical or molecular feature. Asterisks indicate KRAS and TP53 alterations not identified by the TCGA, but reclassified as altered in this study due to 12p gain, 17p loss, KRAS locus gain (z > 0.3), and/or TP53 locus loss (z < −0.3). In (D), data are presented as raw data points (circles), rotated kernel density distributions (violins), and patient numbers (n) between thresholds of normal (solid black line at z = 0), low amplification (dotted red line at z = 0.1), low loss (dotted blue line at z = −0.1), high amplification (solid red line at z = 0.3), and deep loss (solid blue line at z = −0.3). P, probability, paired Wilcoxon rank sum test. In (E), KRAS (red line) and TP53 (blue line) loci segments of all 87 patients are shown. Each horizontal segment represents one patient. White and shades of red and blue indicate no change and magnitude of gain and loss, respectively.
Source data are available online for this figure.
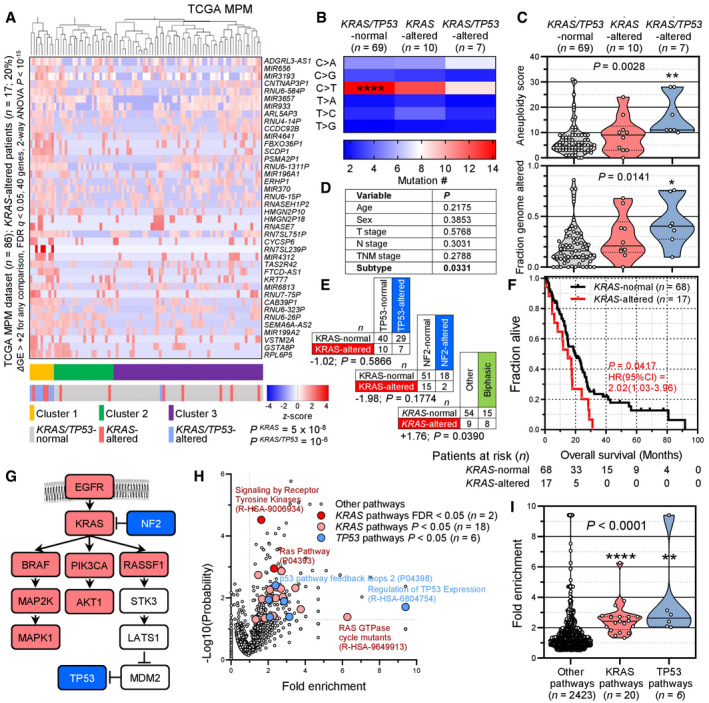
We subsequently examined the transcriptomes of TCGA MPMs (available at https://xenabrowser.net/datapages/?dataset=TCGA‐MESO.htseq_fpkm‐uq.tsv&host=https%3A%2F%2Fgdc.xenahubs.net&removeHub=https%3A%2F%2Fxena.treehouse.gi.ucsc.edu%3A443) stratified by the presence of a KRAS alteration alone (n = 10), a combined KRAS/TP53 alteration (n = 7), or none of the above (n = 69). Forty genes were biologically and statistically significantly overrepresented in KRAS/TP53‐altered over KRAS‐altered over normal patients, which were able to cluster patients by genetic alteration in an unsupervised hierarchical fashion (Fig 2A). KRAS/TP53‐altered patients showed loss of a C>T mononucleotide signature that preponderated in KRAS/TP53‐normal patients and displayed higher aneuploidy and genome alteration indices (Figs 2B and C). KRAS and TP53 alterations were co‐occurring at a rate expected by chance, while KRAS‐altered patients displayed a non‐significant repulsion of NF2 mutations, a statistically significant preponderance of biphasic histology, and significantly worse prognosis (Figs 2D–F). Interestingly, when all mutated genes from this cohort were entered into the Protein Analysis Through Evolutionary Relationships System (PANTHER; http://www.pantherdb.org/), multiple KRAS and TP53 signaling pathways were biologically and statistically significantly enriched in MPM, which, together with the KRAS‐NF2 repulsion described above, aligned along a biological KRAS‐TP53 pathway proposed elsewhere (Tikoo et al, 1994; Matallanas et al, 2011) (Fig 2G–I). Our results were concordant with the TCGA pan‐cancer pathway analysis that reported 9 and 21% alteration frequencies of the RTK/RAS and p53 pathways in MPM (Sanchez‐Vega et al, 2018). Hence, we describe a molecular subclass of MPM patients in the TCGA dataset that involves ∼ 20% of patients, which harbor KRAS gain‐of‐function with or without TP53 loss‐of‐function. This molecular MPM subset features KRAS pathway activation, different mutation spectra, gene expression profiles, histology, and survival compared to other MPMs.
Figure 2. KRAS pathway activation in MPM from the cancer genome atlas (TCGA) pan‐cancer MPM dataset.
-
A–FMolecular and clinical features of the cancer genome atlas (TCGA) pan‐cancer MPM patients (n = 87) stratified by the presence of KRAS standalone (n = 10) and combined KRAS/TP53 (n = 7) alterations. Shown are unsupervised hierarchical clustering of n = 86 patients (gene expression data were not available for one patient) by 40 genes significantly overexpressed in KRAS/TP53‐altered over KRAS‐altered over KRAS/TP53‐normal patients (A) and data summaries of mononucleotide change signatures (B), of indices of genomic instability and mutation burden (C), of clinical features and KRAS/TP53/NF2 co‐mutation frequency (D, E), and of overall survival (F).
- G
-
H, IPANTHER and Reactome KRAS and TP53 pathways significantly altered in the cancer genome atlas (TCGA) pan‐cancer MPM patients. Shown are volcano plot of fold‐enrichment versus −log10(probability) (H), and data summary of fold‐enrichment of KRAS and TP53 versus all other pathways with fold‐enrichment > 0.5 (I).
Data information: In (A), data are presented as heatmap of 40 differentially expressed genes (rows) in 86 individual patients (columns), color code of unsupervised hierarchical clusters, KRAS/TP53 status, and heatmap (legend), and probabilities (P) for enrichment of KRAS‐ and KRAS/TP53‐altered patients in cluster 1. The scale bar represents the color‐coded z‐scores. In (B), data are presented as heatmap of six different possible mononucleotide changes (rows) in patients grouped by KRAS/TP53 status (columns) and color code of mean mutation number (legend). ****, FDR q < 2 × 10⁻⁷ compared with all other mononucleotide changes, 2‐way ANOVA with Benjamini, Krieger, and Yekutieli two‐stage linear step‐up procedure. In (C) and (I), data are presented as raw data points (circles), rotated kernel density distributions (violins), medians (solid lines), and quartiles (dotted lines). P, overall probability, Kruskal–Wallis test. (C): * and **: P < 0.05 and P < 0.01, respectively, compared with KRAS/TP53‐normal patients, Dunn's post‐tests. (I): ** and ****: P < 0.01 and P < 0.0001, respectively, compared with other pathways, Dunn's post‐tests. In (D) and (E), data are presented as patient numbers (n) and overall probability (P) by χ 2 or Kruskal–Wallis tests (D) or hypergeometric test for enrichment of KRAS mutations in TP53‐altered or biphasic MPM (E). In (F), data are presented as sample size (n), Kaplan–Meier survival estimates (lines), censored observations (line marks), log‐rank P value, and hazard ratio (HR) with 95% confidence interval (95% CI). In (H), data are presented as color‐coded individual pathways (circles), threshold of significance (horizontal dotted line), no enrichment baseline reference (vertical dotted line), and selected pathway names and codes. P and R initials in pathway codes denote PANTHER and Reactome pathways, respectively. n, sample size; FDR q, probability, false discovery rate; ΔGE, differential gene expression.
Source data are available online for this figure.
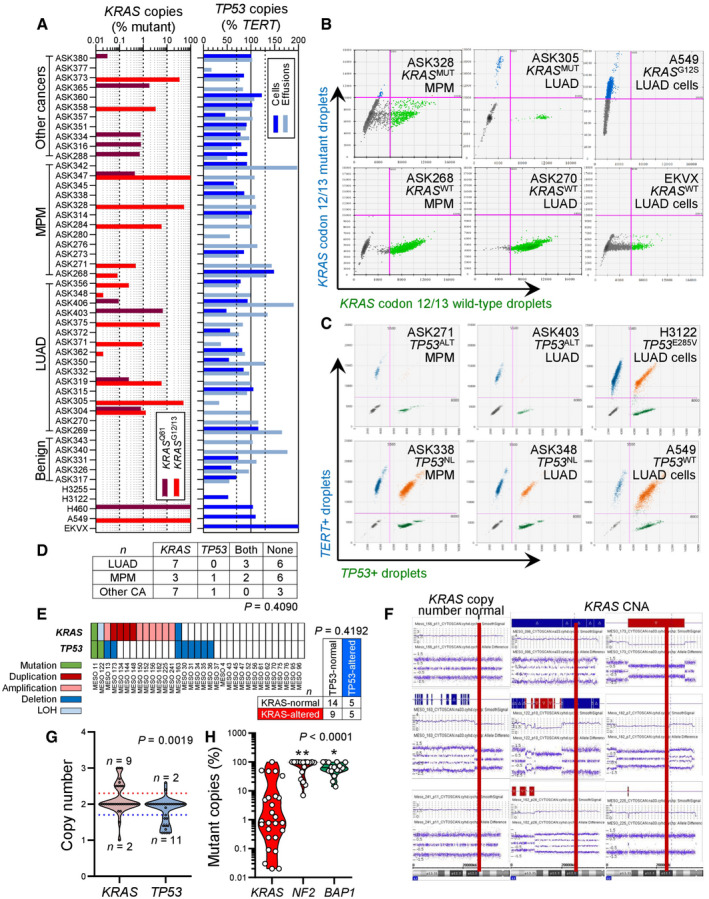
To further test this, we interrogated KRAS and TP53 in our MPM patients, whose clinical characteristics are given in Appendix Table S1. We employed digital droplet polymerase chain reaction (ddPCR) in order to detect KRAS codon 12/13 and 61 mutations, as well as TP53 CNA in pleural fluid and cell pellets of 45 patients with pleural effusions from our cohorts in Munich, Germany (Klotz et al, 2019a, 2019b). The effusions were caused from benign etiologies (n = 5), MPM (n = 12), metastatic lung adenocarcinoma (LUAD; n = 16), or metastatic other bodily tumors (n = 12). The assays were designed for the detection of down to 1:20,000 mutant (MUT) or wild‐type (WT) copies. We detected standalone KRAS mutations and combined KRAS/TP53 alterations in three and two of our 12 patients with MPM, respectively (Fig 3A–C). KRAS and TP53 alterations co‐occurred at a rate expected by chance (Fig 3D). We next used sensitive Affymetrix CytoScanHD Arrays utilizing 2.67 million markers and targeted next‐generation sequencing to identify KRAS and TP53 alterations in a cohort of 33 primary MPM cell lines from Nantes, France (GEO dataset GSE134349; Gueugnon et al, 2011; Data ref: Blanquart et al, 2019; Delaunay et al, 2020; Quetel et al, 2020) The clinical characteristics of the cell line donors are given in Appendix Table S2. We detected standalone KRAS and combined KRAS/TP53 alterations in nine and five cell lines, respectively, and KRAS and TP53 alterations again co‐occurred at a rate expected by chance (Fig 3E). In addition, the KRAS and TP53 loci were statistically significantly amplified and deleted, respectively, across all cell lines irrespective of genotype (Fig 3F and G). Interestingly, 80% of the samples with KRAS MUT copies from both studies displayed low mutant copy numbers (< 10%) that would be likely missed by other techniques with lower read depths or stringent detection thresholds (Fig 3H). We also tested a patient with MPM from the Malignancy of Pleural Effusions in the Emergency Department (MAPED; ClinicalTrials.gov # NCT03319472) Study (preprint: Marazioti et al, 2021) for KRAS and TP53 status by Sanger sequencing, RT–PCR, and qPCR. We found four different KRAS point mutations in this patient, as well as discrepant TP53 expression levels by RT–PCR and qPCR, strongly indicative of a TP53 mutation (Fig EV1). To obtain definitive validation, we finally examined by ddPCR for KRAS codon 12/13 and 61 mutations, as well as TP53 CNA, additional six MPM‐associated MPE samples from Nantes (Gueugnon et al, 2011; Smeele et al, 2018) and 17 MPM tumor samples from Istanbul, Turkey (patients' clinical characteristics are given in Appendix Table S3). Indeed, we found that nine patients had standalone KRAS mutations, whereas another three had combined KRAS/TP53 alterations (Fig 4A and B). Taken together, we examined 36 human tumor/effusion samples from four countries to find standalone KRAS alterations in 12 (33%) and combined KRAS/TP53 alterations in 6 (17%) patients. These results indicate that a molecular subset of MPM that is driven by KRAS with/without TP53 alterations indeed exists outside the TCGA cohort.
Figure 3. KRAS and TP53 alterations in human MPM from Germany and human MPM cell lines from France.
-
A–DPleural fluid cell pellets and supernatants from 45 patients (called ASK #) with pleural effusion from Munich, Germany (Klotz et al, 2019a, 2019b), were subjected to digital droplet polymerase chain reaction (ddPCR) for the detection of mutant (MUT) copies of KRAS codon 12/13 (KRAS G12/13) and KRAS codon 61 (KRAS Q61), as well as copies of TP53 and TERT. Diagnoses were benign pleural effusion (n = 5), lung adenocarcinoma (LUAD; n = 16), MPM (n = 12), and other extrathoracic cancers (n = 12). The assays were designed for detection of down to 1:20,000 copies using EKVX (KRAS WT TP53 G610T), A549 (KRAS G12S TP53 WT), NCI‐H460 (KRAS Q61H TP53 WT), NCI‐H3122 (KRAS WT TP53 E285V), and NCI‐H3255 (KRAS WT TP53 G560‐1A) human LUAD cells as controls. Shown are individual patient (KRAS plot) and individual sample (TP53 plot) allelic frequencies with color code and limits of normal TP53 allelic frequency as vertical dashed lines in the TP53 plot (A), representative gated dotplots of codon 12/13 KRAS ddPCR (B) and TP53/TERT (C), and results summary table (D). Any number of KRAS‐mutant droplets detected in any sample (KRAS plot in A) and any patient that failed to achieve normal TP53 ploidy by any sample (TP53 plot in A) was deemed altered.
-
E–GResults summary (E), representative KRAS CNA segments (F), and data summary of individual cell line CNA z‐score (G) from Affymetrix CytoScanHD Arrays of 33 primary MPM cell lines (called MESO #) from Nantes, France (GEO dataset GSE134349). Red lines denote the KRAS locus on chromosome 12p12.1.
-
HData summary of mutant allelic frequency of KRAS compared with NF2 and BAP1 in all mutated samples from (A–G).
Data information: In (A), data are presented as data summary of the highest mutant copy percentage detected per individual sample (KRAS plot) or of all individual samples assessed (TP53 plot). In (D), data are presented as number of patients (n). P, probability, hypergeometric test for enrichment of KRAS mutations in MPM versus other tumors. In (E), data are presented as individual cell lines (columns), genes (rows), legend, and number of patients (n in table). P, probability, hypergeometric test for enrichment of KRAS mutations in TP53‐mutant MPM. In (G), data are presented as raw data points (circles), rotated kernel density distribution (violins), and cell line numbers (n) outside thresholds of amplification (dotted red line at 2.3) and loss (solid blue line at 1.7). P, probability, paired Wilcoxon rank sum test. In (H), data are presented as raw data points (circles), rotated kernel density distributions (violins), and medians (lines). P, overall probability, one‐way ANOVA. * and **: P < 0.05 and P < 0.01, respectively, compared with KRAS, Tukey's post‐test.
Source data are available online for this figure.
Figure EV1. KRAS and TP53 alterations in a patient with malignant pleural mesothelioma from the MAPED study (NCT03319472).
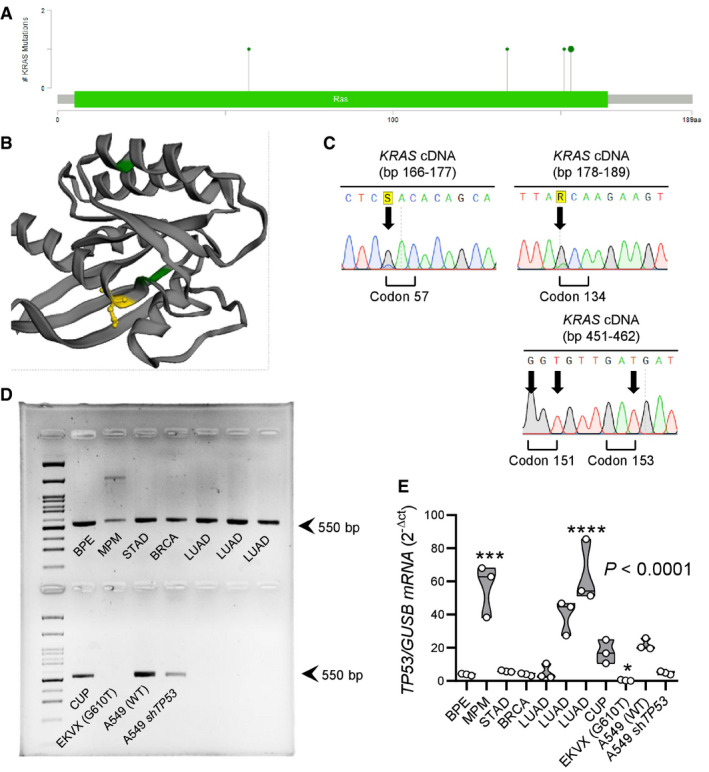
- Lollipop plot showing the four different missense KRAS mutations found (D57H, A134T, R151G, and E153D).
- 3D rendering of KRAS protein showing the three KRAS mutations predicted by OncoKB to be non‐functional (green color) and the E153D mutation predicted by OncoKB to be oncogenic (yellow color).
- Representative Sanger sequencing traces. Arrows indicate point mutations.
- TP53 RT–PCR in comparison to cancer cell lines and other patients with malignant pleural effusion. Note the decreased band intensity in the patient with MPM.
- TP53 qPCR in comparison to cancer cell lines and other patients with malignant pleural effusion. Note the markedly increased TP53 transcript abundance in the patient with MPM that, together with (D), indicates a TP53 mutation.
Data information: In (A), the likely oncogenic E153D mutation is shown enlarged compared with the other three mutations. In (D), arrows at 550 base pairs (bp) indicate amplicon size. In (E), data are presented as raw data points (circles), rotated kernel density distributions (violins), and medians (lines). P, overall probability, one‐way ANOVA. *, ***, and ****: P < 0.05, P < 0.001, and P < 0.0001 compared with A549 cells, Bonferroni post‐tests. In (D) and (E), abbreviations are as follows: BPE, benign pleural effusion; MPM, malignant pleural mesothelioma; STAD, stomach adenocarcinoma; BRCA, breast cancer; LUAD, lung adenocarcinoma; CUP, cancer of unknown primary; sh, cell line stably expressing anti‐TP53 short hairpin RNA. The TP53 status of the EKVX and A549 cell lines is indicated in parentheses.
Source data are available online for this figure.
Figure 4. KRAS and TP53 alterations in MPM patients from France and Turkey.
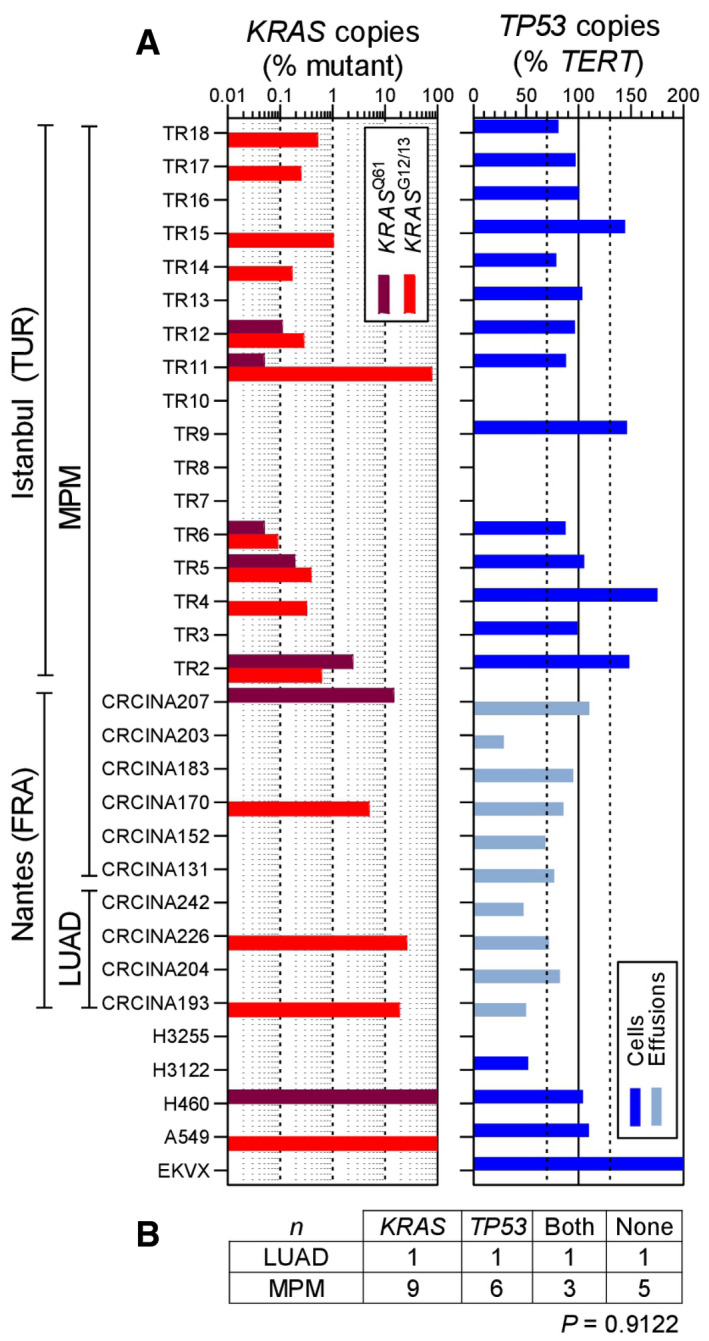
-
A, BPleural fluid cell pellets and supernatants from 10 patients (called CRCINA #) with pleural effusion from Nantes, France (Gueugnon et al, 2011; Smeele et al, 2018), and pleural tumor samples from 17 patients (called TR#) with MPM from Istanbul, Turkey, were subjected to digital droplet polymerase chain reaction (ddPCR) for the detection of mutant (MUT) copies of KRAS codon 12/13 (KRAS G12/13) and KRAS codon 61 (KRAS Q61), as well as copies of TP53 and TERT. Diagnoses were lung adenocarcinoma (LUAD; n = 4) and MPM (n = 23). The assays were designed for detection of down to 1:20,000 copies using EKVX (KRAS WT TP53 G610T), A549 (KRAS G12S TP53 WT), NCI‐H460 (KRAS Q61H TP53 WT), NCI‐H3122 (KRAS WT TP53 E285V), and NCI‐H3255 (KRAS WT TP53 G560‐1A) human LUAD cells as controls. Shown are individual patient (KRAS plot) and individual sample (TP53 plot) allelic frequencies with color code and limits of normal TP53 allelic frequency as vertical dashed lines in the TP53 plot (A) and results summary table (B). Any number of KRAS‐mutant droplets detected in any sample (KRAS plot in A) and any patient that failed to achieve normal TP53 ploidy by any sample (TP53 plot in A) was deemed altered.
Data information: In (A), data are presented as data summary of the highest mutant copy percentage detected per individual sample (KRAS plot) or of all individual samples assessed (TP53 plot). In (B), data are presented as number of patients (n). P, probability, χ 2 test.
Source data are available online for this figure.
MPM in mice expressing mesothelial‐targeted KRAS G12D
To functionally validate KRAS mutations in MPM, we targeted transgenes to mesothelial surfaces using type 5 adenoviral vectors (Ad). For this, mT/mG CRE‐reporter mice that switch from somatic cell membranous tomato (mT) to green fluorescent protein (mG) expression upon Cre‐mediated recombination (Muzumdar et al, 2007) received 5 × 10⁸ plaque‐forming units (PFU) intrapleural Ad encoding Melanotus luciferase (Ad‐Luc) or Cre recombinase (Ad‐Cre) followed by serial bioluminescence imaging. Ad‐Luc‐treated mice developed intense bilateral chest light emission (mice lack mediastinal separations; Stathopoulos et al, 2006) that peaked at 4–7 and subsided by 14 days post‐injection (Fig EV2A). At this time point, when transient Ad‐Luc expression ceased and therefore maximal Ad‐Cre‐mediated recombination was achieved, Ad‐Cre‐treated mice displayed widespread recombination of the pleural mesothelium even in contralateral pleural fissures, but not of the lungs, chest wall, or pleural immune cells (Fig EV2B–E). Similar results were obtained from intraperitoneal 5 × 10⁸ PFU Ad‐Cre‐treated mT/mG mice after 2 weeks (Fig EV2F). Importantly, Ad‐Cre did not cause inflammation in wild‐type (Wt) mice, as evident by imaging and cellular analyses of luminescent bone marrow chimeras used as real‐time myeloid tracers (Cao et al, 2004; Giannou et al, 2015; Agalioti et al, 2017; Fig EV3). These results show that intraserosal Ad‐Cre treatment efficiently and specifically recombines mesothelial surfaces in vivo.
Figure EV2. Adenoviral‐mediated mesothelial recombination.
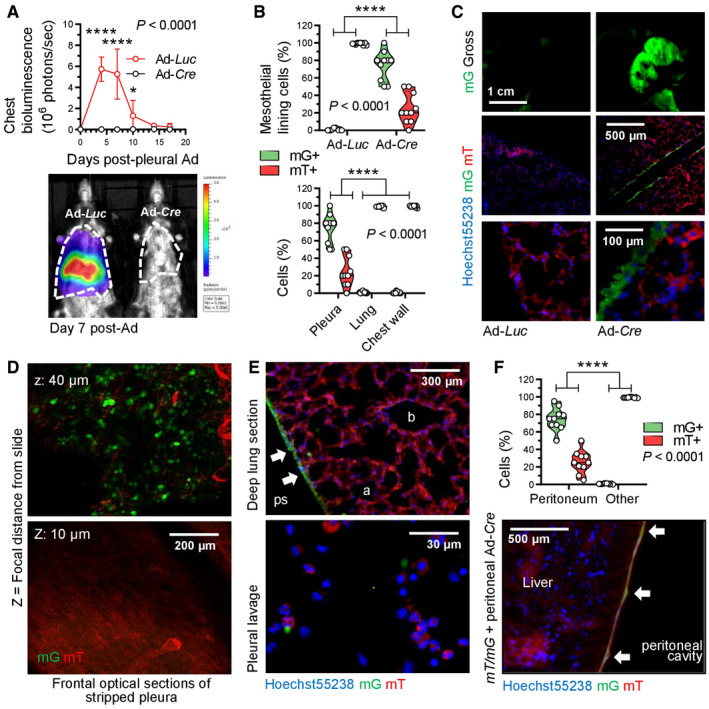
- Data summary of chest light emission (top; n = 5 mice/group) and representative bioluminescence images (bottom). Note cessation of transient Ad‐Luc expression by day 14.
- Data summary of mG+ and mT+ mesothelial, lung, and chest wall cell percentage (n = 10 mice/group; B), representative macroscopic (top) and microscopic (middle, bottom) fluorescent images (C), optical frontal sections of stripped parietal pleura placed apical side up on glass slides (D), and deep lung sections (E, top) and fluorescent image of pleural lavage cells (E, bottom). z, focal plane distance from slide. a, alveoli; b, bronchi; ps, pleural space; arrows, recombined mesothelium.
- Data summary of mG+ and mT+ mesothelial and deeper located (other) abdominal cell percentage (n = 10 mice/group) and representative merged microscopic fluorescent image of peritoneal surface mesothelium showing Cre‐recombined mesothelium (arrows).
Data information: In (A), data are presented as mean ± 95% confidence interval. P, overall probability, two‐way ANOVA. * and ****: P < 0.05 and P < 0.0001 for comparison between groups at the indicated time points, Bonferroni post‐tests. In (B) and (F), data are presented as raw data points (circles), rotated kernel density distribution (violins), and medians (lines). P, overall probability, two‐way ANOVA. ****: P < 0.0001 for the indicated comparisons, Bonferroni post‐tests. Ad, adenovirus; PFU, plaque‐forming units; Luc, luciferase gene; Cre, CRE recombinase gene; mT, membranous tomato red; mG, membranous green fluorescent protein.
Source data are available online for this figure.
Figure EV3. Pleural mesothelial KRAS G12D expression causes inflammation.
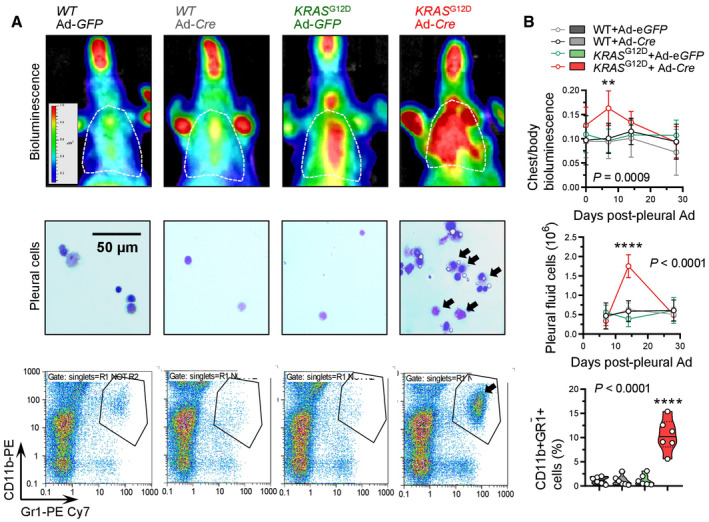
- Representative chest bioluminescence images taken 2 weeks post‐Ad (top), pleural lavage cytocentrifugal specimens stained with May–Gruenwald–Giemsa (middle), and dotplots of CD11b and Gr1 expression by flow cytometry (bottom). Dotted lines in top panels denote the chest. Arrows in middle and bottom panels indicate increased mononuclear cells.
- Summary of longitudinal chest light emission and total pleural cell number (dotplots), legend to dotplots, as well as of CD11b+Gr1+ pleural cells at day 14 post‐Ad (violin plot).
Data information: In (B), data are presented as mean ± 95% confidence interval (dotplots; n = 5–6 mice/data‐point) or as raw data points (circles), rotated kernel density distribution (violins), and medians (lines). P, overall probability, one‐way (violin plot) or two‐way (dotplots) ANOVA. ** and ****: P < 0.01 and P < 0.0001, respectively, for Ad‐Cre‐treated KRAS G12D mice compared with all other groups, Bonferroni post‐tests. WT, wild‐type; KRAS G12D, Lox‐STOP‐Lox.KRAS G12D; CAG. Luc.eGFP, ubiquitously luminescent mice; Ad, adenovirus type 5; PFU, plaque‐forming units; Cre, CRE recombinase gene; GFP, green fluorescent protein; ANOVA, analysis of variance.
Source data are available online for this figure.
To test whether oncogenic KRAS can cause MPM, Wt mice and mice carrying conditional KRAS G12D and/or Trp53f/f alleles expressed or deleted, respectively, upon Cre‐mediated recombination (Marino et al, 2000; Jackson et al, 2001; Meylan et al, 2009) received 5 × 10⁸ PFU intrapleural Ad‐Cre and were longitudinally followed and sampled (Fig 5A–F). Wt, Trp53f/Wt, and Trp53f/f mice survived up to 16 months post‐Ad without clinical or pathologic disease manifestations (median survival undefined). In contrast, KRAS G12D mice developed cachexia and succumbed by 6–12 months post‐injection (median [95% CI] survival = 339 [285–379] days; P = 0.005 compared with controls, log‐rank test). At necropsy, no pleural fluid or inflammatory cell accumulation was evident, but diffuse visceral and parietal pleural nodular and peel‐like lesions were found in all mice. These lesions expressed proliferating cell nuclear antigen (PCNA) unlike the normal pleura and were diagnosed by a board‐certified pathologist as epithelioid MPM (Fig 5G). In addition, chimeric KRAS G12D recipients adoptively transplanted with luminescent bone marrow revealed an early pleural inflammatory infiltrate composed of CD11b+Gr1+ myeloid cells at 7–14 days post‐Ad‐Cre (Fig EV3), emulating the inflammatory response observed after pleural asbestos instillation (Nagai et al, 2011) that is thought to drive MPM development (Fridlender et al, 2009; Patil et al, 2018; Courtiol et al, 2019).
Figure 5. Human‐like malignant pleural mesotheliomas and effusions of mice with pleural mesothelial‐targeted oncogenic KRAS G12D and/or Trp53 deletion.
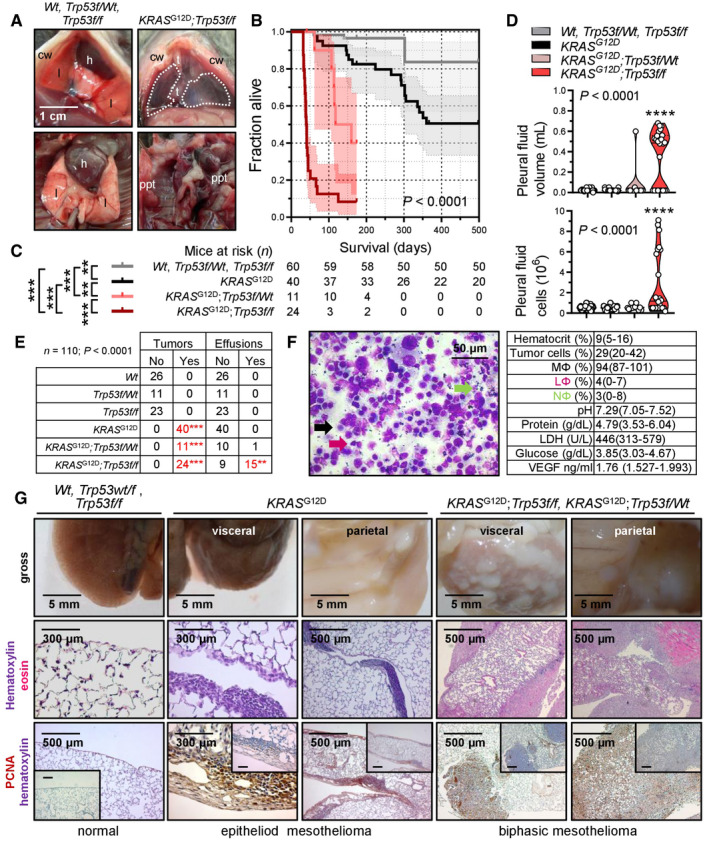
- Representative photographs of the thorax before (top) and after (bottom) chest opening (t, tumors; l, lungs; cw, chest wall; h, heart; dashed lines, effusion; ppt, parietal pleural tumors).
- Kaplan–Meier survival plot.
- Survival table.
- Data summary of pleural effusion volume and nucleated cells (n is given in table in [C]).
- Incidence of pleural tumors and effusions.
- Representative May–Gruenwald–Giemsa‐stained pleural fluid cytocentrifugal specimen from a KRAS G12D;Trp53f/f mouse showing macrophages (MΦ, black arrow), lymphocytes (LΦ, purple arrow), and neutrophils (NΦ, green arrow) and summary of cellular and biochemical features of effusions of KRAS G12D;Trp53f/f mice (n = 10).
- Gross macroscopic and microscopic images of visceral and parietal tumors stained with hematoxylin and eosin or PCNA (n is given in table in [E]).
Data information: In (B) and (C), data are presented as Kaplan–Meier survival estimates (lines), censored observations (line marks) 95% confidence interval (shaded areas) and number of mice at risk. P, overall probability, log‐rank test. ** and ***: P < 0.01 and P < 0.001, respectively, for the comparisons indicated, log‐rank test. In (D), data are presented as raw data points (circles), rotated kernel density distribution (violins), and medians (lines). P, overall probability, one‐way ANOVA. ****: P < 0.0001, for comparison with all other groups, Bonferroni post‐tests. In (E), data are presented as number of mice (n). P, probability for comparison with the top‐three groups, Fischer's exact test. In (F), data are presented as mean ± 95% confidence interval. Wt, wild‐type; KRAS G12D, Lox‐STOP‐Lox.KRAS G12D; Trp53f/f, conditional Trp53‐deleted; Ad, adenovirus type 5; PFU, plaque‐forming units; Cre, CRE recombinase gene; PCNA, proliferating cell nuclear antigen; LDH, lactate dehydrogenase; ANOVA, analysis of variance; VEGF, vascular endothelial growth factor.
Source data are available online for this figure.
The phenotype of intrapleural Ad‐Cre‐injected KRAS G12D ;Trp53f/f mice was fulminant, with respiratory and locomotor distress and retracted body posture culminating in death by 3–6 weeks post‐Ad‐Cre (median [95% CI] survival = 41 [38–73] days; P < 0.001 compared with any other genotype, log‐rank test). Examination of the thorax revealed massive MPE in most and visceral/parietal pleural tumors in all mice, which invaded the lungs, chest wall, and mediastinum and uniformly presented as PCNA+ biphasic MPM with mixed sarcomatoid/epithelioid features. Effusions were bloody but non‐coagulating, contained abundant cancer and inflammatory cells, and had low pH and glucose and high protein, VEGF, and lactate dehydrogenase levels, resembling effusions of human advanced MPM (Robinson et al, 2005; Patil et al, 2018) and of C57BL/6 mice injected with KRASG12C ‐mutant AE17 mesothelioma cells (Agalioti et al, 2017). KRAS G12D ;Trp53f/Wt mice displayed an intermediate phenotype (median [95% CI] survival = 118 [97–160] days; P < 0.003 compared with any other genotype, log‐rank test), biphasic histology, and a single MPE occurrence. Wt, Trp53f/f, and KRAS G12D ;Trp53f/f mice also received 5 × 10⁸ PFU intraperitoneal Ad‐Cre (Fig EV4). Again, Wt and Trp53f/f mice displayed unlimited survival without signs of disease (median survival undefined), but KRAS G12D ;Trp53f/f mice developed abdominal swelling and succumbed by 2–5 months post‐Ad‐Cre (median [95% CI] survival = 95 [60–123] days; P < 0.001 compared with controls, log‐rank test). At necropsy, nodular and diffuse tumors throughout the abdominal cavity and loculated ascites with features similar to MPM with MPE were detected.
Figure EV4. Malignant peritoneal mesothelioma of KRAS G12D ;Trp53f/f mice.
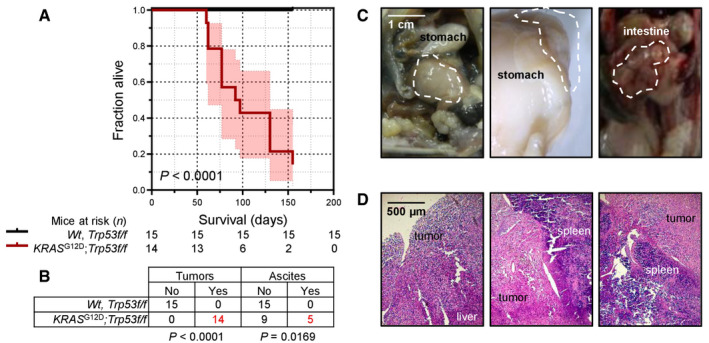
- Kaplan–Meier survival plot and survival table.
- Tumor and ascites incidence table.
- Representative macroscopic images of peritoneal tumors (dashed outlines).
- Representative hematoxylin‐and‐eosin‐stained tissue sections of peritoneal tumors.
Data information: In (A), data are presented as Kaplan–Meier survival estimates (lines), 95% confidence intervals (shaded areas) and numbers of mice at risk. P, probability, log‐rank test. In (B), data are presented as number of mice (n). P, probabilities, Fischer's exact tests. Wt, wild‐type; KRAS G12D, Lox‐STOP‐Lox.KRAS G12D; Trp53f/f, conditional Trp53‐deleted; Ad, adenovirus type 5; PFU, plaque‐forming units; Cre, CRE recombinase gene.
Source data are available online for this figure.
To corroborate that our mice had mesothelioma and not pleural spread of LUAD (Jackson et al, 2001), immunostaining for specific markers of both tumor types was performed based on expert guidelines for distinguishing human MPM from LUAD (Scherpereel et al, 2010; Galateau‐Salle et al, 2016; Courtiol et al, 2019) and on previous published experience from mouse models (Jongsma et al, 2008). In parallel, LUAD of intratracheal Ad‐Cre‐treated (5 × 10⁸ PFU) KRAS G12D and of urethane‐treated mice were examined (Mason et al, 2000; Spella et al, 2019). Our murine MPM displayed ubiquitous strong Wilms' tumor 1, patchy moderate vimentin, ubiquitous moderate mesothelin, ubiquitous strong calretinin/podoplanin/osteopontin, and patchy moderate cytokeratin 5/6 expression, but no evidence of surfactant protein C expression, in contrast with LUAD that expressed some of these markers and SFTPC (Fig 6), supporting that our tumors are indeed MPM of the biphasic subtype. These results show that pleural mesothelial‐targeted KRAS G12D causes epithelioid MPM in mice. Furthermore, that standalone TP53 loss does not trigger MPM, but cooperates with mutant KRAS to accelerate MPM development, to promote biphasic histology, and to precipitate effusion formation.
Figure 6. Molecular phenotyping of murine mesothelioma.
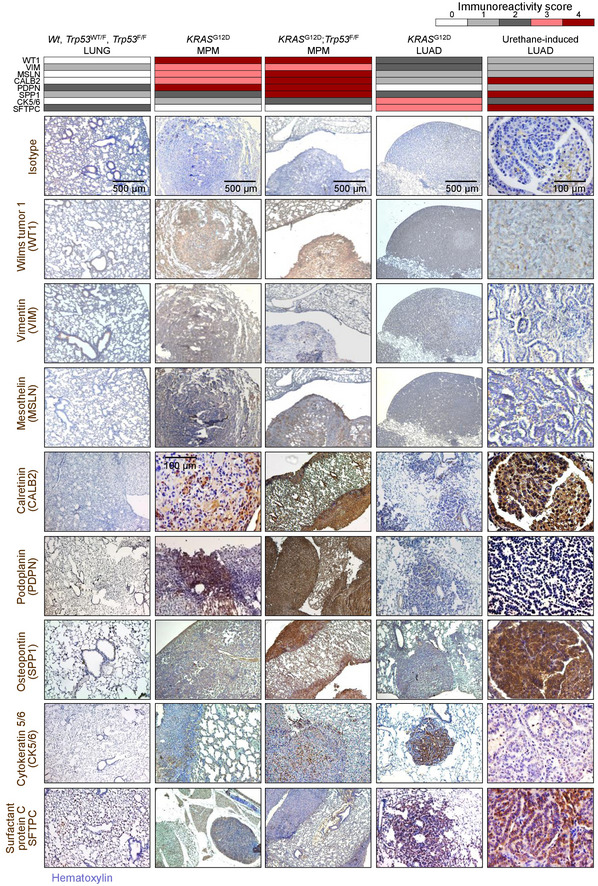
Wild‐type (Wt), KRAS G12D, and Trp53f/f mice were intercrossed, and all possible offspring genotypes received 5 × 10⁸ PFU intrapleural or intratracheal Ad‐Cre and were sacrificed when moribund. In parallel, C57BL/6 mice received 10 consecutive weekly intraperitoneal injections of 1 g/kg urethane and were sacrificed after 6 months. Data summary (heatmap) and representative images of immunoreactivity of tissue sections of pleural and pulmonary tissues and tumors from these mice for different markers of human malignant pleural mesothelioma (MPM) and lung adenocarcinoma (LUAD). n = 10 mice/group were analyzed for each marker. Brown color indicates immunoreactivity and blue color nuclear hematoxylin counterstaining. Note the ubiquitous strong expression of Wilms' tumor 1 (WT1), patchy moderate expression of vimentin (VIM), ubiquitous moderate expression of mesothelin (MSLN), ubiquitous strong expression of calretinin (CALB2), podoplanin (PDPN), and osteopontin (SPP1), patchy moderate expression of cytokeratin 5/6 (CK5/6), and the absence of expression of surfactant protein C (SFTPC) in murine KRAS‐driven mesotheliomas. Note also the ubiquitous strong expression of WT1, the patchy moderate expression of VIM, the ubiquitous low‐level expression of MSLN, the ubiquitous strong expression of CALB2 and SPP1, the ubiquitous low‐level expression of PDPN, the variable moderate expression of CK5/6, and the ubiquitous moderate expression of SFTPC in murine KRAS G12D‐driven and urethane‐induced LUAD.
Transplantable and actionable murine MPM cell lines with KRAS G12D, Trp53, and Bap1 mutations, and a human‐like transcriptome
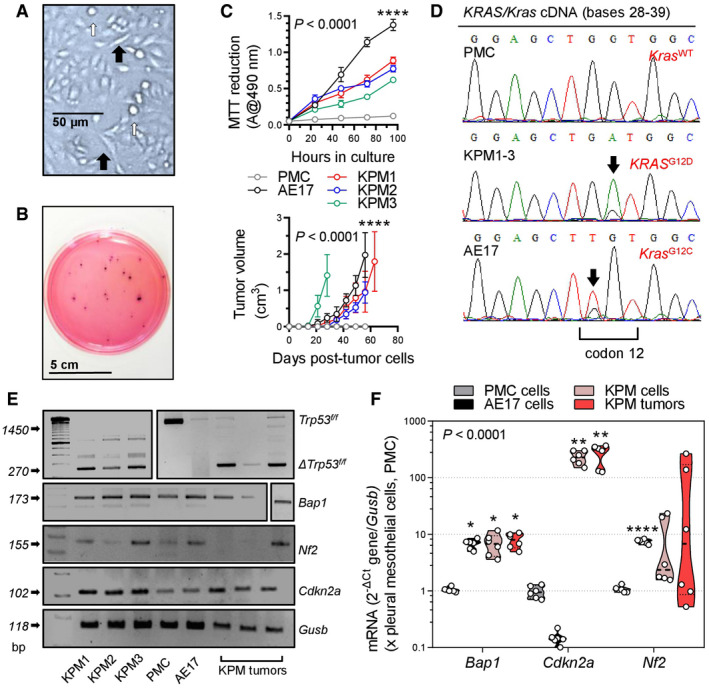
We subsequently isolated three different MPM cell lines from Ad‐Cre‐treated KRAS G12D ;Trp53f/f mice (called KPM1–3) using long‐term tumor culture (Pauli et al, 2017; Kanellakis et al, 2019, 2020). KPM cells displayed anchorage‐independent growth (anoikis), spindle‐shaped morphology, and rapid growth in minimal‐supplemented media and in soft agar. In addition, KPM cells were tumorigenic when injected subcutaneously into the flank of C57BL/6 mice and carried the original KRAS G12D/Trp53 lesions (Fig 7A–E, and Appendix Fig S1). KPM cells and their parental tumors featured enhanced Bap1 and Cdkn2a, but not Nf2 expression (Fig 7E and F, and Appendix Fig S1), consistent with previous work that identified TP53‐mediated repression of BRCA1 and CDKN2A expression (Stott et al, 1998; Arizti et al, 2000). RNA sequencing of KPM cells (GEO dataset GSE94415; Data ref: Stathopoulos et al, 2017) revealed that they carry the pathogenic KRAS G12D/Trp53 lesions, but also multiple stochastic single nucleotide variants in exon 6 and insertions in exon 11 of Bap1, all validated by Sanger sequencing, although immunohistochemistry revealed persistent nuclear BAP1 expression rendering these Bap1 mutations of uncertain functional significance (Nasu et al, 2015) (Fig EV5). Finally, 2 × 10⁵ pleural‐delivered KPM cells could inflict to naïve C57BL/6 mice secondary disease identical to primary MPM of KRAS G12D ;Trp53f/f mice in terms of manifestation, pathology, cytology, and biochemistry (Fig 8A–E), fulfilling modified Koch's postulates (Byrd & Segre, 2016).
Figure 7. Transplantable KRAS/TP53‐mutant murine mesothelioma (KPM) cell lines.
-
AKPM cell culture showing anoikis (white arrows) and spindle‐shaped morphology (black arrows).
-
BRepresentative colonies of KPM1 cells (7.5 × 10³ cells/vessel) seeded on a soft agar‐containing 60‐mm petri dish and stained with crystal violet after a month (n = 3/group).
-
CData summaries from in vitro MTT reduction (top; 2 × 10⁴ cells/well; n = 6 independent experiments) and in vivo subcutaneous tumor growth after injection of 106 cells per C57BL/6 mouse (bottom; n = 5/group).
-
DKRAS/Kras mRNA Sanger sequencing shows wild‐type Kras (Kras WT) of PMC and mutant murine Kras/human KRAS alleles (KRAS G12D and Kras G12C) of KPM and AE17 cells (arrows).
-
E, FRT–PCR (E) and qPCR (F) of KPM cells and parental tumors show Trp53f/f allele deletion (Δ) and Bap1 and Cdkn2a overexpression compared with PMC.
Data information: In (C), data are presented as mean (circles) and 95% confidence interval (bars). P, overall probability, two‐way ANOVA. ****: P < 0.0001 for AE17 cells (top) or for KPM cells (bottom) compared with all other groups, Bonferroni post‐tests. In (F), data are presented as raw data points (circles), rotated kernel density distribution (violins), and medians (lines). P, overall probability, two‐way ANOVA. *, **, and ****: P < 0.05, P < 0.01, and P < 0.0001, respectively, for comparison with PMC, Bonferroni post‐tests.
Source data are available online for this figure.
Figure EV5. Bap1 mutations of KPM cells.
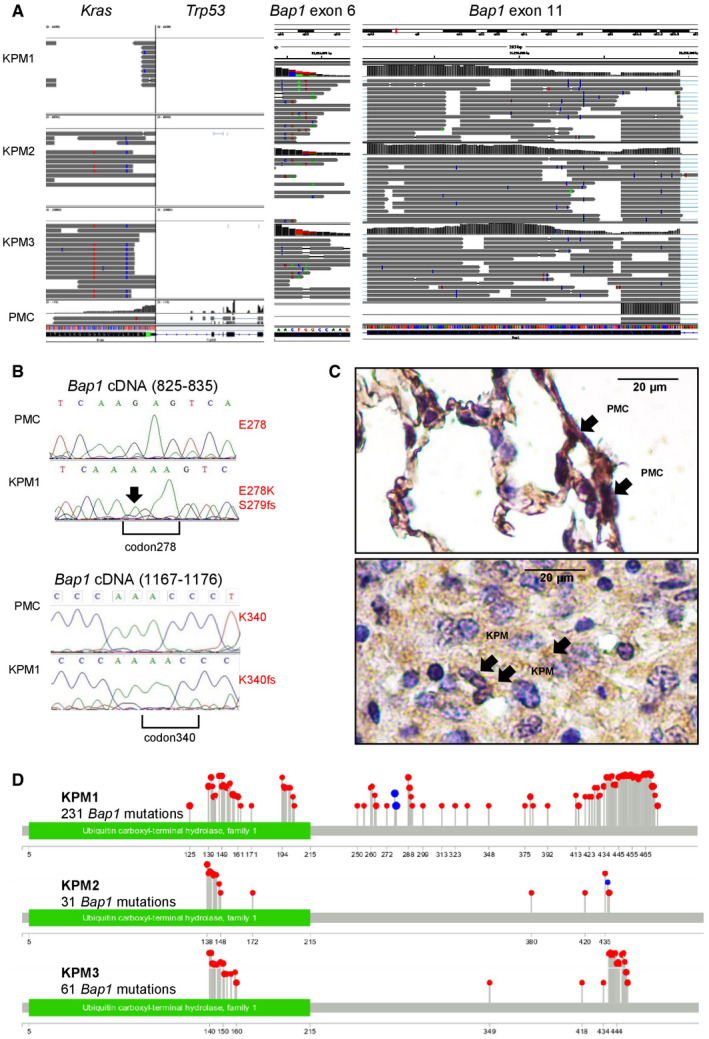
- Coverage and alignment plot from RNA sequencing. Alignments are represented as gray polygons with reads mismatching the reference indicated by color. Loci with a large percentage of mismatches relative to the reference are flagged in the coverage plot as color‐coded bars. Alignments with inferred small insertions or deletions are represented with vertical or horizontal bars, respectively.
- Bap1 mRNA Sanger sequencing shows a G>A transition (arrow) at c.829 that generates a missense mutation in codon E278K (top), as well as a single nucleotide insertion in position c.831 with a consequent frameshift mutation in codon S279insA and a single nucleotide insertion resulting to a frameshift mutation in codon K340insA at c.1072 (bottom).
- Representative immunohistochemical images of BAP1 immunoreactivity (brown) of lungs with normal PMC and mouse tumors caused by transplanted KPM cells counterstained with hematoxylin (blue). Arrows indicate nuclear BAP1 staining.
- Lollipop plot for each KPM cell line visualizing all Bap1 mutations detected. Red and blue lollipops with their numbers represent, respectively, missense mutations and insertions causing frameshift with their positions after the ATG start codon.
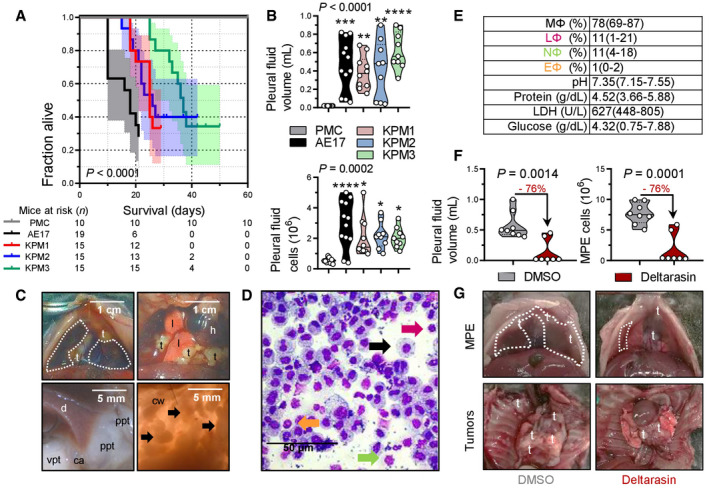
Figure 8. Transplantable and actionable murine mesothelioma models using KPM cells.
-
AKaplan–Meier survival plot with survival table.
-
BData summary of pleural effusion volume and total cells (n = 10, 12, 10, 9, and 9 mice/group, respectively, from left to right).
-
CImages of the chest before and after opening, showing effusion (dashed lines), visceral (vpt), and parietal (ppt) pleural tumors on the costophrenic angle (ca), the diaphragm (d), and the chest wall (cw, arrows). t, tumors; l, lungs; h, heart.
-
DMay–Gruenwald–Giemsa‐stained pleural cells (macrophages, MΦ: black arrow; lymphocytes, LΦ: purple arrow; neutrophils, NΦ: green arrow; eosinophils, EΦ: orange arrow).
-
EEffusion cytology and biochemistry data summary (total n = 10 mice; n = 4, 3, and 3 effusions from mice injected with KPM1, KPM2, and KPM3 cells, respectively, were analyzed and shown are pooled data).
-
F, GC57BL/6 mice received pleural KPM1 cells followed by a single intrapleural injection of liposomes containing 1% DMSO or 15 mg/kg deltarasin in 1% DMSO at day 9 post‐tumor cells. Shown are data summaries of MPE volume (n = 8 and 7 DMSO and deltarasin‐treated mice/group, respectively) and pleural fluid nucleated cells at day 19 post‐KPM1 cells (F), as well as representative images of pleural effusions (dashed lines) and tumors (t in [G]).
Data information: In (A), data are presented as Kaplan–Meier survival estimates (lines), 95% confidence interval (shaded areas), and number of mice at risk (n). P, probability of overall comparison and of any comparison to PMC, log‐rank test. In (B) and (F), data are presented as raw data points (circles), rotated kernel density distribution (violins), and medians (lines). Numbers in red font and arrows in (F) indicate end‐point reduction by deltarasin effect. P, probability, one‐way ANOVA (B) or Student's t‐test (F). *, **, ***, and ****: P < 0.05, P < 0.01, P < 0.001, and P < 0.0001, respectively, for comparison with PMC, Bonferroni post‐tests. In (E), data are presented as mean ± 95% confidence interval. LDH, lactate dehydrogenase.
Source data are available online for this figure.
To determine the potential efficacy of KRAS inhibition against murine KRAS/TP53‐driven MPM, C57BL/6 mice received pleural KPM1 cells, followed by a single intrapleural injection of liposomal‐encapsulated KRAS inhibitor deltarasin (15 mg/kg; Zimmermann et al, 2013) or empty liposomes on day nine post‐tumor cells, in order to allow initial tumor implantation in the pleural space (Agalioti et al, 2017). At day 19 after pleural injection of KPM1 cells, deltarasin‐treated C57BL/6 mice developed fewer and smaller MPE with decreased cellularity compared with controls (Fig 8F and G). These results collectively show that our murine MPM is indeed malignant, originate from recombined mesothelial cells, and cause transplantable disease that can be used for hypothesis and drug testing.
Finally, RNA sequencing of KPM cells comparative to normal pleural mesothelial cells revealed a distinctive transcriptomic signature that included classic mesothelioma markers (Msln, Spp1, Efemp1, Pdpn, Wt1) as well as new candidate mesothelioma genes (Fig 9A–C and Appendix Table S4). A human 150–gene mesothelioma signature derived from a cohort of 113 patients via comparison of MPM against multiple other malignancies (GSE42977; De Rienzo et al, 2013; Data ref: De Rienzo et al, 2012) was highly enriched in our KPM cell line signature (Fig 9D). These data indicate that murine KRAS/TP53‐driven MPM present Bap1 mutations, a gene expression profile that is highly similar to human MPM, and can be used for transplantable and druggable MPM models in syngeneic mice. Collectively, the murine and human findings support the existence of a KRAS‐driven subset of MPM patients or clones that are likely missed during sequencing and/or sampling (Comertpay et al, 2014; Li et al, 2020).
Figure 9. The molecular signature of KPM cells is enriched in human mesothelioma.
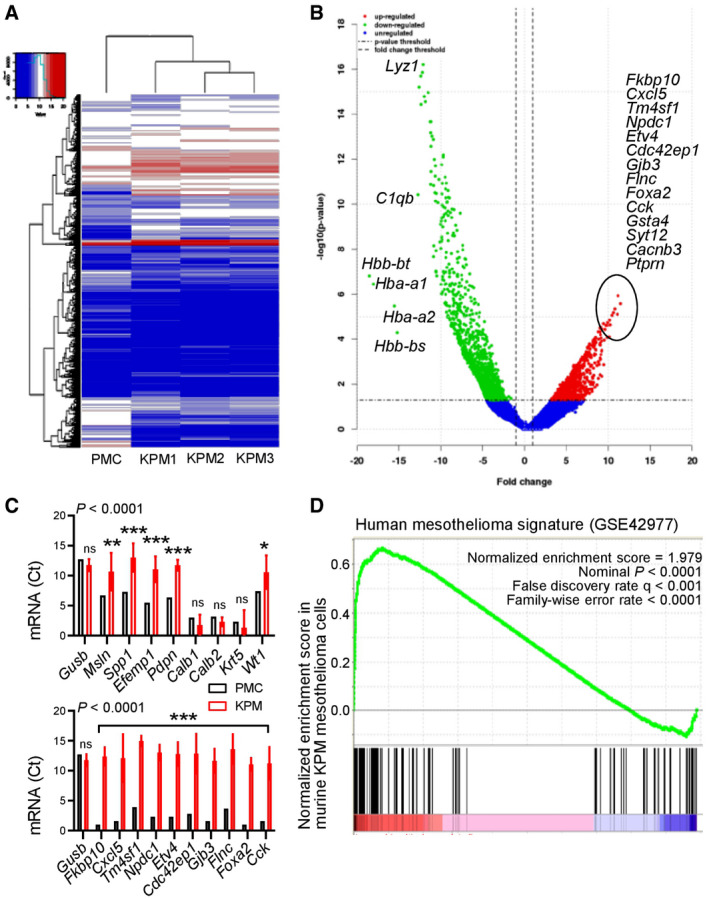
- Unsupervised hierarchical clustering shows distinctive gene expression of KPM versus PMC.
- Volcano plot showing some top KPM versus PMC differentially expressed genes.
- KPM and PMC expression of classic mesothelioma markers (top) and top KPM versus PMC overexpressed genes (bottom).
- Gene set enrichment analysis, including enrichment score and nominal probability value of the 150 gene‐signature specifically over‐represented in human mesothelioma compared with other thoracic malignancies derived from 113 patients (GSE42977) within the transcriptome of KPM cells versus PMC shows significant enrichment of the human mesothelioma signature in KPM cells.
Data information: In (C), data are presented as mean (columns) and 95% confidence interval (bars). P: probability, two‐way ANOVA. ns, *, **, and ***: P > 0.05, P < 0.05, P < 0.01, and P < 0.001, respectively, compared with PMC, Bonferroni post‐tests.
Source data are available online for this figure.
Discussion
Our results demonstrate that, alone or in combination with TP53, KRAS is perturbed in a proportion of human MPM and can potentially drive the murine mesothelium toward MPM development. KRAS mutations, amplifications, and overexpression, as well as chromosome 12p gains, are shown to exist in 20% of patients from the TCGA MPM dataset and low allelic frequency KRAS mutations are discovered in 50% of MPM samples from our own human cohorts using sensitive techniques. Furthermore, KRAS mutations are shown to occasionally co‐exist with TP53 mutations, to repulse NF2 mutations, and to be associated with biphasic MPM histology. Targeting of oncogenic KRAS G12D alone to the pleural mesothelium caused epithelioid MPM in mice and together with Trp53 deletion resulted in biphasic MPM with MPE. We further show that murine MPM carry the initiating KRAS G12D/Trp53 mutations and multiple secondary Bap1 mutations, are transplantable and druggable, and highly similar to human MPM in terms of molecular markers and gene expression. Collectively, the data support a pathogenic role for KRAS mutations in a fraction of MPMs and provide new models to study this patient group.
Our striking findings can be reconciled with the sporadic nature of KRAS mutations in human MPM sequencing studies (Bott et al, 2011; Guo et al, 2015; Bueno et al, 2016; Hmeljak et al, 2018) and the incomplete penetrance of standalone Bap1, Cdkn2a, Nf2, or Trp53 deletions in causing MPM in mice (Jongsma et al, 2008; Guo et al, 2014; Menges et al, 2014; Xu et al, 2014; Kukuyan et al, 2019). To this end, mesothelial KRAS mutations may initiate MPM in some patients, but may be lost during sampling and sequencing, as has been shown for other mutations in LUAD that persist at a subclonal level (Abbosh et al, 2017; Jamal‐Hanjani et al, 2017). The low allelic frequency of KRAS mutations is explicable by their heterozygous nature and the robust inflammatory responses KRAS‐mutant tumors generate (Agalioti et al, 2017; Marazioti et al, 2018) and is not limiting their driver capabilities in other tumor types (Abbosh et al, 2017; Jamal‐Hanjani et al, 2017; Li et al, 2020). The fact that these mutations were not detected by most next‐generation sequencing studies of MPM can be explained by the relative low sensitivity of these methods compared with ddPCR, as well as the low allelic frequency of KRAS mutations. To this end, typical read depths of 50–100 are employed in most next‐generation sequencing studies yielding a sensitivity of 1–2%, compared with the theoretical 0.005% or actual 0.1% of ddPCR (Demuth et al, 2018). In addition, most next‐generation sequencing studies set discovery cutoffs of 25% allelic frequency, likely rendering many KRAS mutations undiscovered. Our findings are plausible, since MPM is likely polyclonal (Comertpay et al, 2014), cell lines display KRAS activation and mutations (Patel et al, 2007; Agalioti et al, 2017), NF2 is a KRAS suppressor (Tikoo et al, 1994), and KRAS signaling is interconnected with the TP53 cell cycle checkpoint (Matallanas et al, 2011). The postulation that KRAS mutations in MPM might be early events can be tested in the future by genome doubling analyses. Taken together, our data and the literature support that, in a subset of patients, low allelic frequency KRAS alterations conditionally accomplice with TP53 to drive mesothelial cells toward MPM. These tumors may be selectively responsive to KRAS blockade and detectable by sensitive methods like ddPCR or maximal depth sequencing (Li et al, 2020).
We also corroborate the critical role of TP53 in MPM progression, since TP53 mutations are frequent in MPM. Although standalone Trp53 deletion did not induce MPM in mice, it promoted KRAS G12D‐driven MPM progression and biphasic histology, as was also observed in combination with Nf2 and Tsc1 deletion (Jongsma et al, 2008; Guo et al, 2014), suggesting that Trp53 loss may conditionally cooperate with other oncogenes in MPM. In addition, Trp53‐deleted KRAS G12D MPM was accompanied by effusions, a human MPM phenotype that likely affects survival (Ryu et al, 2014) and that was previously not reproducible in mice. Again, Trp53 loss was not causative, but likely potentiated the effusion‐promoting effects of KRAS, which we recently identified in metastatic effusions (Agalioti et al, 2017). Taken together with published work, our findings functionally validate the role of TP53 mutations in human MPM in driving biphasic histology, tumor progression and metastasis, and poor survival (Bueno et al, 2016; Yap et al, 2017). Hence, TP53‐targeted therapies may be prioritized for biphasic MPM when available (Brown et al, 2009).
Another surprising finding was the multiple and different Bap1 mutations of our MPM cell lines, since they originated from tumors inflicted by KRAS G12D and Trp53 loss. Frequent copy number loss and recurrent somatic mutations in BAP1 have been identified in MPM (Bott et al, 2011; Guo et al, 2015; Nasu et al, 2015). Based on the multiplicity and variety of the Bap1 mutations we observed, we postulate that they were secondarily triggered by the genomic instability caused from combined KRAS mutation and TP53 loss. Whatever their cause may be, their presence strengthens our findings of an involvement of KRAS signaling in MPM pathobiology, as well as the relevance of the novel mouse models we developed, since Bap1 is the single most commonly mutated gene in human MPM.
Research on MPM is hampered by the paucity of mouse models (Blanquart et al, 2020). We provide multiple new mouse models with defined phenotype, histology, and latency: (i) a genetic mouse model of pleural epithelioid MPM; (ii) genetic and transplantable models of pleural and peritoneal biphasic MPM with accompanying effusion; and (iii) three new MPM cell lines of defined genotype, transcriptome, and phenotype that are syngeneic to C57BL/6 mice. These are positioned to enhance MPM research by overcoming the need for immune compromise providing intact immune responses critical for MPM pathogenesis (Burt et al, 2012; Westbom et al, 2014; Kadariya et al, 2016; Patil et al, 2018), by widening the repertoire of existing cell lines, by recapitulating MPM with effusion, and by addressing pleural MPM.
In conclusion, our findings support that oncogenic KRAS signaling causes MPM in a proportion of humans and in mice. As some mutations along this signaling pathway are currently druggable or are likely to become such in the near future (Herbst et al, 2002; Brown et al, 2009; Flaherty et al, 2010; Stephen et al, 2014), our findings may facilitate therapeutic innovation. Pending validation of our human findings in larger cohorts, we provide novel tools for the study of a molecular subclass of MPM that will hopefully aid in drug discovery and personalized treatment of patients with MPM driven by KRAS signaling.
Materials and Methods
Computational biologic analyses
The dataset for Fig 1A was generated by manual curation of COSMIC data (https://cancer.sanger.ac.uk/cosmic/browse/tissue?wgs=off&sn=pleura&ss=all&hn=mesothelioma&sh=&in=t&src=tissue&all_data=n). The dataset for Fig 1B was generated by manual curation of the main text and supplementary data of publications (Bott et al, 2011; Enomoto et al, 2012; Mezzapelle et al, 2013; Shukuya et al; 2014; Guo et al, 2015; Lo Iacono et al, 2015; Bueno et al, 2016; De Rienzo et al, 2016; Kato et al, 2016; Hmeljak et al, 2018). Raw data from 86 human TCGA MPM patients were retrieved from the cBioPortal for Cancer Genomics (www.cbioportal.org/) using inputs “mesothelioma”, “Mesothelioma (TCGA, PanCancer Atlas)”, “Query by Gene KRAS and TP53”, “Mutations”, “Putative copy‐number alterations from GISTIC”, “mRNA expression z‐scores”, and “Protein expression z‐scores” were downloaded and analyzed. Gene expression data from these patients, normalized with the log2(fpkm‐uq + 1) method, were downloaded (https://xenabrowser.net/datapages/?dataset=TCGA‐MESO.htseq_fpkm‐uq.tsv&host=https%3A%2F%2Fgdc.xenahubs.net&removeHub=https%3A%2F%2Fxena.treehouse.gi.ucsc.edu%3A443), ENSEMBL gene IDs were converted to gene symbols using https://www.biotools.fr/mouse/ensembl_symbol_converter, the data were filtered, differential gene expression (ΔGE) was analyzed, and heatmap visualization was performed using R* and packages limma R version 3.42.2 (https://bioconductor.org/packages/release/bioc/html/limma.html) and edgeR (https://bioconductor.org/packages/release/bioc/html/edgeR.html). Both rows and columns were clustered using Pearson correlation and complete linkage. All mutations (n = 2,150) of all patients (n = 86) with MPM from the TCGA pan‐cancer dataset were retrieved from www.cbioportal.org/ and were fed into the protein analysis through evolutionary relationships (PANTHER) Classification System (www.pantherdb.org/) using parameters: organism, Homo Sapiens; analysis, statistical overrepresentation test > PANTHER pathways or reactome pathways (both analyses were done); whole‐genome reference list: Homo Sapiens; test type: binomial; and correction: false discovery rate. All raw data from the two independent PANTHER and reactome pathway analyses were retrieved, merged, and analyzed. Gene set enrichment analysis (GSEA) was performed with the Broad Institute pre‐ranked GSEA module software (http://software.broadinstitute.org/gsea/index.jsp;Subramanian et al, 2005). All aforementioned raw data were downloaded from the sources referenced above in *.csv format, are provided as source data files with this publication, and were reanalyzed using R*, Prism v8.0 (GraphPad, La Jolla, CA), and Excel (Microsoft, Redmont, WA).
Reagents
Adenoviruses type 5 (Ad) encoding Melanotus luciferase (Luc) or CRE‐recombinase (Cre) were from the Vector Development Laboratory, Baylor College of Medicine (Houston, TX); 3‐(4,5‐dimethylthiazol‐2‐yl)‐2,5‐diphenyltetrazolium bromide (MTT) assay from Sigma‐Aldrich (St. Louis, MO), and D‐luciferin from Gold Biotechnology (St. Louis, MO). Primers and antibodies are listed in Appendix Tables S5 and S6. All cell culture reagents were from Thermo Fisher Scientific.
Human studies
All human experiments conformed to the principles set out in the WMA Declaration of Helsinki and the Department of Health and Human Services Belmont Report. The Munich clinical study was prospectively approved by the Ludwig‐Maximilians‐University Munich Ethics Committee (approvals #623–15 and #711–16). All patients gave written informed consent a priori. Diagnoses were made according to current standards by a board‐certified pathologist at the Asklepios Fachkliniken Gauting, Munich, Germany. Pleural fluid was centrifuged at 300 g for 10 min at 4°C, genomic DNA was extracted from cell pellets, supernatants, and pleural tumor tissues using TRIzol (Thermo Fisher) and purified using GenElute Mammalian Genomic DNA Miniprep (Sigma Aldrich), and 200 ng DNA were used to analyze KRAS codons 12/13 and 61, and TP53 copies with ddPCR KRAS G12/G13, KRAS G61, TP53 CNV, and TERT CNV Kits and QuantaSoft Analysis Pro software (BioRad, Hercules, CA) as described elsewhere (Poole et al, 2019). Thresholds for KRAS WT, KRAS MUT, TP53, and TERT droplet amplitude gates were, respectively, 6,000, 10,000, 5,500, and 7,000. Data were normalized by accepted droplet numbers to yield absolute mutant (MUT) and wild‐type (WT) droplet percentages, which were determined using thresholds derived from cell line controls and from LUAD patient samples clinically confirmed to have KRAS mutations and TP53 copy number changes, according to the formula:
In the Nantes Study, MPM cell lines, as well as pleural fluid cells and supernatants, were derived from pleural fluid aspirates obtained for diagnostic and therapeutic purposes. The study was approved by the French Ministry of Research (DC‐2011‐1399), and all patients gave written informed consent a priori for their excess pleural fluid to be used for the establishment of cell lines. MPE samples from over 120 patients with MPM were used to generate the 33 cell lines, since the success rate is < 30%, as described elsewhere (Gueugnon et al, 2011; Delaunay et al, 2020). Diagnoses were established by both fluid cytology and immunohistochemical staining of pleural biopsies performed by the pathology department at Laënnec Hospital (St‐Herblain, France) and then externally confirmed by MESOPATH, the French panel of pathology experts for the diagnosis of mesothelioma. All recruited patients had received no prior anticancer therapy. All cell lines were maintained in RPMI‐1640 medium supplemented with 2 mM l‐glutamine, 100 IU/ml penicillin, 0.1 mg/ml streptomycin, and 10% heat‐inactivated fetal calf serum and cultured at 37°C in 5% CO2‐95% air. Genomic DNA from 33 MPM cell lines was extracted with Nucleospin Blood kit (Macherey‐Nagel, Düren, Germany) and 500 ng were hybridized to Affymetrix CytoScanHD Arrays (Thermo Fisher). Detection, quantification, and visualization of single nucleotide variations (SNV) and copy number alterations (CNA) were performed using Affymetrix Chromosome Analysis Suite v3.1.1.27 (Thermo Fisher) and data are available at GEO datasets (GSE134349; Data ref: Blanquart et al, 2019). The cell lines were also sequenced in a targeted fashion focusing on 21 genes and the TERT promoter on a MiSeq system (Illumina, San Diego, CA) (Quetel et al, 2020). The MAPED (Clinical identification of malignant pleural effusions in the emergency department) study entailed a few samples from patients enrolled in a prospective clinical trial (preprint: Marazioti et al, 2021). MAPED was registered with ClinicalTrials.gov (#NCT03319472), and written informed consent was obtained from all patients a priori. MAPED was approved by the University of Patras Ethics Committee (approval #22699/21.11.2013). Pleural fluid was centrifuged at 300 g for 10 min at 4°C, RNA and DNA were extracted from cell pellets using TRIzol (Thermo Fisher) and purified using GenElute Mammalian Genomic DNA Miniprep (Sigma‐Aldrich), and 200 ng RNA/DNA were used for RT–PCR, qPCR, and Sanger sequencing. The Istanbul study was approved by the Koç University Ethics Committee on Human Research (approval #2021.223.IRB2.042/06.05.2021). Both Nantes pleural fluid and Istanbul pleural tumor specimens were processed and analyzed identical to the Munich study.
Mice
C57BL/6 (#000664), B6.129(Cg)‐Gt(ROSA)26Sortm4(ACTB‐tdTomato,‐EGFP)Luo /J (mT/mG; #007676; Muzumdar et al, 2007), FVB‐Tg(CAG‐luc,‐GFP)L2G85Chco/J (CAG.Luc.eGFP; #008450; Cao et al, 2004)64, B6.129S4‐Krastm4Tyj /J (KRAS G12D; #008179; Jackson et al, 2001), and B6.129P2‐Trp53tm1Brn /J (Trp53f/f; #008462; Meylan et al, 2009) mice were obtained from Jackson Laboratories (Bar Harbor, ME) and bred on the C57BL/6 background at the University of Patras Center for Animal Models of Disease. Experiments were approved by the Prefecture of Western Greece's Veterinary Administration (approval 118018/578‐30.04.2014) and were conducted according to Directive 2010/63/EU (http://eur‐lex.europa.eu/legal‐content/EN/TXT/?uri=CELEX%3A32010L0063). Sex‐, weight (20–25 g)‐, and age (6–12 week)‐matched experimental mice were used, and their numbers (total n = 432) are detailed in Appendix Table S7.
Mesothelial transgene delivery
Isoflurane‐anesthetized C57BL/6 and mT/mG mice received 5 × 10⁸ PFU intrapleural or intraperitoneal Ad‐Cre or Ad‐Luc in 100 μl PBS and were serially imaged for bioluminescence on a Xenogen Lumina II (Perkin‐Elmer, Waltham, MA) after receiving 1 mg retro‐orbital D‐luciferin under isoflurane anesthesia, and data were analyzed using Living Image v.4.2 (Perkin‐Elmer; Stathopoulos et al, 2006; Spella et al, 2019), or were euthanized and pleural lavage was performed, lungs were explanted, and parietal pleura was stripped. For pleural lavage, 1 ml PBS was injected, was withdrawn after 30 s, and was cytocentrifuged onto glass slides (5 × 10⁴ cells, 300 g, 10 min) using CellSpin (Tharmac, Marburg, Germany). Lungs were embedded in optimal cutting temperature (OCT; Sakura, Tokyo, Japan) and sectioned into 10‐µm cryosections. The parietal pleura was placed apical side up onto glass slides. Samples were stained with Hoechst 55238 and were examined on AxioObserver D1 (Zeiss, Jena, Germany) or TCS SP5 (Leica, Heidelberg, Germany) microscopes.
Primary MPM models
Wild‐type (Wt), KRAS G12D, and Trp53f/f mice were intercrossed and all possible offspring genotypes received isoflurane anesthesia and 5 × 10⁸ PFU intrapleural or intraperitoneal Ad‐Cre. Mice were monitored daily and sacrificed when moribund or prematurely for pathology. Mice with pleural fluid volume ≥ 100 μl were judged to have effusions that were aspirated. Animals with pleural fluid volume < 100 μl were judged not to have effusions and underwent pleural lavage. For isolation of primary murine pleural mesothelial cells (PMC), pleural myeloid and lymphoid cells were removed by pleural lavage followed by pleural instillation of 1 ml DMEM, 2% trypsin EDTA, aspiration after 1 min, and culture.
Bone marrow transfer
For adoptive BMT, C57BL/6 mice received 107 bone marrow cells obtained from CAG.Luc.eGFP donors i.v. 12 h after total‐body irradiation (1,100 Rad). Full bone marrow reconstitution was completed after one month, as described elsewhere (Agalioti et al, 2017).
Transplantable mesothelioma cell lines
Murine KRAS G12D ;Trp53f/f pleural mesotheliomas were minced and cultured in DMEM 10% FBS for > 30 passages, yielding three KRAS G12D ;Trp53f/f mesothelioma (KPM1–3) cell lines, which were compared to AE17 cells (KrasG12C ‐mutant asbestos‐induced murine mesothelioma) and PMC (Agalioti et al, 2017). PMC were generated in our laboratory as primary cultures of murine pleural lavage with DMEM 2% trypsin, whereas AE17 cells were donated by Dr. YC Gary Lee (University of Western Australia, Perth, Australia) and have been both extensively described elsewhere (Giannou et al, 2015, 2017; Agalioti et al, 2017; Marazioti et al, 2018). For this, 2 × 10⁵ cells in 100 μl PBS were delivered intrapleurally to isoflurane‐anesthetized C57BL/6 mice that were followed as above. For solid tumor formation, C57BL/6 mice received 106 subcutaneous PMC, KPM, or AE17 cells in the rear flank, three vertical tumor dimensions (δ1, δ2, δ3) were monitored serially, and the formula πδ1δ2δ3/6 was used to calculate tumor volume. RNA sequencing was done on an IonTorrent sequencer (Thermo Fisher); data were deposited at GEO datasets (GSE94415) and were analyzed using Bioconductor (Data ref: Stathopoulos et al, 2017). Gene set enrichment was done with the Broad Institute pre‐ranked GSEA module (Subramanian et al, 2005).
PCR and Sanger sequencing
Cellular RNA was isolated using TRIzol (Thermo Fisher Scientific, Waltham, MA) followed by RNAeasy purification and genomic DNA removal (Qiagen, Hilden, Germany). For tumor RNA, tissues were passed through 70‐μm strainers (BD Biosciences, San Jose, CA) and 107 cells were subjected to RNA extraction. One μg RNA was reverse‐transcribed using Oligo(dT)18 and Superscript III (Thermo Fisher). cDNAs were amplified using specific primers (Appendix Table S5) and Phusion Hot Start Flex polymerase (New England Biolabs, Ipswich, MA). DNA fragments were run on 2% agarose gels or were purified with NucleoSpin gel and PCR clean‐up columns (Macherey‐Nagel, Düren, Germany) and were sequenced using their primers by VBC Biotech (Vienna, Austria). qPCR was performed using specific primers (Appendix Table S5) and SYBR FAST qPCR Kit (Kapa Biosystems, Wilmington, MA) in a StepOne cycler (Applied Biosystems, Carlsbad, CA). Ct values from triplicate reactions were analyzed with the method (Pfaffl, 2001). mRNA abundance was determined relative to glycuronidase beta (Gusb) and is given as . The Sanger sequencing trace files were further analyzed for double peak parser using Bioconductor (https://www.bioconductor.org/) with a threshold of 25 Phred quality core (Ewing et al, 1998). The mismatch basecalls in respect to the wild‐type samples were grouped by sample and used as template to generate the lollipop plot per each KPM cell line for a visual representation of all the mutations detected (Jay & Brouwer, 2016). Lollipop plots were generated using MutationMapper (https://www.cbioportal.org/mutation_mapper; Cerami et al, 2012).
RNA sequencing
RNA sequencing was done on an IonTorrent sequencer (Thermo Fisher), and data were analyzed using Bioconductor (https://www.bioconductor.org/). File alignments were performed with Τmap (https://github.com/iontorrent/TMAP). Coverage and alignments plot from sequencing were generated using Integrative genome viewer (Robinson et al, 2011). Alignments are represented as gray polygons with reads mismatching the reference indicated by color. Loci with a large percentage of mismatches relative to the reference are flagged in the coverage plot as color‐coded bars. Alignments with inferred small insertion or small deletion are represented with vertical or horizontal bars, respectively. Gene set enrichment analysis (GSEA) was performed with the Broad Institute pre‐ranked GSEA module software (http://software.broadinstitute.org/gsea/index.jsp; Subramanian et al, 2005). The raw *.bam files, one for each RNA‐Seq sample, were summarized to a gene read counts table, using the Bioconductor package GenomicRanges. In the final read counts table, each row represented one gene, each column one RNAseq sample, and each cell the corresponding read counts associated with each row and column. The gene counts table was normalized for inherent systematic or experimental biases (e.g., sequencing depth, gene length, and GC content bias) using the Bioconductor package DESeq after removing genes that had zero counts over all RNASeq samples (20,007 genes). The output of the normalization algorithm was a table with normalized counts, which can be used for differential expression analysis with statistical algorithms developed specifically for count data. Prior to the statistical testing procedure, the gene read counts were filtered for possible artifacts that could affect the subsequent statistical testing procedures. Genes presenting any of the following were excluded from further analysis: (i) genes with length less than 500 bp (2,051 genes), (ii) genes whose average reads per 100 bp was less than the 25th percentile of the total normalized distribution of average reads per 100 bp (0 genes with cutoff value 0.02248 average reads per 100 bp), (iii) genes with read counts below the median read counts of the total normalized count distribution (11,358 genes with cutoff value 16 normalized read counts). The total number of genes excluded due to the application of gene filters was 5,298. The total (unified) number of genes excluded due to the application of all filters was 32,595. The resulting gene counts table was subjected to differential expression analysis for the contrast KPM versus PMC using the Bioconductor package DESeq. The final numbers of statistically significant differentially expressed genes were 2,344 genes and of these, 650 were up‐regulated and 1,694 were down‐regulated according to an absolute fold‐change cutoff value of 2.
Cell culture
All KPM cell lines are available upon request. Cells were cultured at 37°C in 5% CO2‐95% air using DMEM 10% FBS, 2 mM l‐glutamine, 1 mM pyruvate, 100 U/ml penicillin, and 100 mg/ml streptomycin and were tested biannually for identity (by short tandem repeats) and Mycoplasma Spp. (by PCR). In vitro cell proliferation was determined using 3‐(4,5‐dimethylthiazol‐2‐yl)‐2,5‐diphenyltetrazolium bromide (MTT) assay. For in vivo injections, cells were harvested with trypsin, incubated with Trypan blue, counted on a hemocytometer, and > 95% viable cells were injected into the pleural space (2 × 10⁵) or into the skin (106) as described elsewhere (Agalioti et al, 2017). Mouse numbers used are detailed in Appendix Table S7.
Cell and tissue analyses
MPE fluid was diluted in 10‐fold excess red blood cells lysis buffer (155 mM NH4Cl, 12 mM NaHCO3, 0.1 mM EDTA). Total pleural cell counts were determined microscopically in a hemocytometer and cytocentrifugal specimens (5 × 10⁴ cells each) of pleural fluid cells were fixed with methanol for 2 min. Cells were stained with May–Grünwald stain in 1 mM Na2HPO4, 2.5 mM KH2PO4, pH = 6.4 for 6 min and Giemsa stain in 2 mM Na2HPO4, 5 mM KH2PO4, pH = 6.4 for 40 min, washed with H2O, and dried. Slides were mounted with Entellan (Merck Millipore, Darmstadt, Germany), coverslipped, and analyzed. For flow cytometry, 106 nucleated pleural fluid cells suspended in 50 μl PBS supplemented with 2% FBS and 0.1% NaN3 were stained with the indicated antibodies according to manufacturer's instructions (Appendix Table S6) for 20 min in the dark, washed, and resuspended in buffer for further analysis. Lungs, visceral pleural tumors, parietal pleural tumors, and chest walls were fixed in 4% paraformaldehyde overnight, embedded in paraffin or optimal cutting temperature (OCT) and were stored at room temperature or −80°C, respectively. Five‐μm paraffin or 10‐μm cryosections were mounted on glass slides. Sections were labeled using the indicated antibodies (Appendix Table S6), counterstained with Envision (Dako, Carpinteria, CA) or Hoechst 33258 (Sigma‐Aldrich, St. Louis, MO), and mounted with Entellan new (Merck Millipore) or Mowiol 4‐88 (Calbiochem, Gibbstown, NJ). For isotype control, primary antibody was omitted. Bright‐field and fluorescent microscopy were done on AxioLab.A1 (Zeiss), AxioObserver.D1 (Zeiss), or TCS SP5 (Leica) microscopes and digital images were processed with Fiji (Schindelin et al, 2012).
Liposomal deltarasin preparation and treatment
Deltarasin‐encapsulating liposomes were prepared as described elsewhere (Markoutsa et al, 2014; Marazioti et al, 2019), by freeze‐drying 30 mg of empty DSPC/PG/Chol (9:1:5 mol/mol/mol) unilamelar sonicated vesicles with 1 ml of deltarasin solution (5 mg/ml) in PBS, or plain PBS (for empty liposomes), followed by controlled rehydration. Liposome size was decreased by extrusion though Lipo‐so‐fast extruder polycarbonate membranes (Avestin Europe, Mannheim, Germany) with 400‐nm pore diameter. Liposome lipid concentration, size distribution, surface charge (zeta‐sizer, Malvern Panalytical Ltd, Malvern, United Kingdom), and drug encapsulation efficiency were estimated by measuring non‐liposomal drug absorption at 284 nm as reported elsewhere (Markoutsa et al, 2014; Marazioti et al, 2019). Deltarasin‐encapsulating liposomes were delivered intrapleurally into C57BL/6 mice 9 days post‐intrapleural KPM1 cells, when the first pleural tumors were already established (Agalioti et al, 2017).
Statistics
Sample size was estimated using G*power (Faul et al, 2007) assuming α = 0.05, β = 0.05, and effect size d or φ = 1.5. Animals were allocated to treatments by alternation and transgenic animals case‐control‐wise. Data acquisition was blinded and no data were excluded from analyses. Data were tested for normality of distribution by Kolmogorov–Smirnov test and are given as mean ± 95% confidence interval (CI). Sample size (n) refers to biological replicates. Differences in means or medians were examined by t‐test, Mann–Whitney test, Wilcoxon matched‐pairs signed rank test, one‐way analysis of variance (ANOVA) with Tukey's or Bonferroni's post‐tests, or Kruskal–Wallis test with Dunn's post‐tests, as indicated and appropriate. Differences in frequencies were tested by Fischer's exact or χ 2 tests. Molecular and longitudinal (bioluminescence, MTT, tumor growth) data were analyzed by two‐way ANOVA with Bonferroni's, Sidak's, Dunnett's, or Tukey's post‐tests, or with two‐stage linear step‐up procedure of Benjamini, Krieger, and Yekutieli. Survival was analyzed using Kaplan–Meier estimates, log‐rank (Mantel–Cox) test for probability, and Mantel–Haenszel estimates of hazard ratio. Probability (P) values are two‐tailed and P < 0.05 was considered significant. Analyses and plots were done on Prism v8.0 (GraphPad, La Jolla, CA) and Excel (Microsoft, Redmont, WA).
Author contributions
AM, ACK, GAG, SJB, and GN designed and carried out experiments, analyzed data, provided critical intellectual input, and generated portions of the paper draft; CB, DJ, SD, and MG designed and carried out microarray analyses, provided the French MPM cell line cohort, and provided and characterized the Nantes patient cohort; HB, ÖK, DM, ŞD, ST, SE, ÖY, PB, and PF provided and characterized the Istanbul patient cohort; SAIW, LT, MAAP, and CMH designed and carried out sequencing experiments and analysis, immunohistochemistry, RNA sequencing analysis, and digital droplet PCR; LVK, IK, ML, RAH, and JB provided the German MPM and LUAD tumor cohort; MI and MV performed in vivo CRE reporter assays and experiments using KRAS G12D mice; ACK and IL performed molecular phenotyping of murine tumors; DEW performed GSEA; HP evaluated and diagnosed mouse pathology; SGA prepared liposomes; IP, MS, and IG designed and performed experiments and provided critical intellectual input and partial funding; A‐SL carried out and analyzed immunohistochemistry and digital droplet PCR, and organized the experiments for the revision of the manuscript; and GTS conceived the idea, obtained funding, supervised the study, designed experiments, analyzed the data, performed statistics, analyzed public datasets, generated graphs and figures, wrote the original paper and its revised form, and is the guarantor of the study’s integrity. All authors reviewed and concur with the submitted manuscript.
Conflict of interest
IP works as a Senior Director in AstraZeneca Pharmaceutical in a non‐related field with the publication. The remaining authors declare no competing financial interests.
For more information
Institute of Lung Biology and Disease (ILBD) & Comprehensive Pneumology Center (CPC): https://www.helmholtz‐muenchen.de/ilbd/index.html
Helmholtz Center Munich‐German Research Center for Environmental Health (HMGU): https://www.helmholtz‐muenchen.de/en/helmholtz‐zentrum‐muenchen/index.html
Ludwig‐Maximilian‐University (LMU) Munich: https://www.en.uni‐muenchen.de/index.html
The Regional Center for Research in Cancerology and Immunology Nantes / Angers: https://www.crcina.org/?lang=en
The Koc University School of Medicine: https://medicine.ku.edu.tr/en/
The cancer genome atlas (TCGA) pan‐cancer human malignant pleural mesothelioma (MPM) dataset available at cBioportal: https://www.cbioportal.org/study/summary?id=meso_tcga_pan_can_atlas_2018
The cancer genome atlas (TCGA) pan‐cancer human malignant pleural mesothelioma (MPM) gene expression dataset available at: https://xenabrowser.net/datapages/?dataset=TCGA‐MESO.htseq_fpkm‐uq.tsv&host=https%3A%2F%2Fgdc.xenahubs.net&removeHub=https%3A%2F%2Fxena.treehouse.gi.ucsc.edu%3A443
The catalogue of somatic mutations in cancer (COSMIC) human MPM dataset: https://cancer.sanger.ac.uk/cosmic/browse/tissue?wgs=off&sn=pleura&ss=all&hn=mesothelioma&sh=&in=t&src=tissue&all_data=n
Human MPM datasets at Gene Expression Omnibus: https://www.ncbi.nlm.nih.gov/geo/query/acc.cgi?acc=GSE51024, https://www.ncbi.nlm.nih.gov/geo/query/acc.cgi?acc=GSE134349, https://www.ncbi.nlm.nih.gov/geo/query/acc.cgi?acc=GSE42977
Novel mouse MPM cell line and normal mesothelial cell RNA sequencing dataset at Gene Expression Omnibus: https://www.ncbi.nlm.nih.gov/geo/query/acc.cgi?&acc=GSE94415
Using Pleural Effusions to Diagnose Cancer (MAPED) study page at ClinicalTrials.gov: https://www.clinicaltrials.gov/ct2/show/NCT03319472?term=maped&draw=2&rank=1
Links to patient support, advocate, and charity organizations: https://www.mesotheliomagroup.com/, https://www.mesothelioma.com/, https://www.mesotheliomahelp.org/, https://www.asbestos.com/support/, https://mesothelioma.net/mesothelioma‐support/, https://www.curemeso.org/, https://www.mesotheliomahope.com/resources/cancer‐foundations/, https://www.mesothelioma.uk.com/.
Supporting information
Appendix
Expanded View Figures PDF
Source Data for Expanded View/Appendix
Source Data for Figure 1
Source Data for Figure 2
Source Data for Figure 3
Source Data for Figure 4
Source Data for Figure 5
Source Data for Figure 7
Source Data for Figure 8
Source Data for Figure 9
Acknowledgements
The authors thank Dr. YC Gary Lee (University of Western Australia, Perth, Australia) for donating AE17 cells and the cluster LUNG innovation (LUNG O2) for logistic support. This work was supported by European Research Council 2010 Starting Independent Investigator (#260524) and 2015 Proof of Concept (#679345) grants, the Graduate College (Graduiertenkolleg, GRK) #2338 of the German Research Society (Deutsche Forschungsgemeinschaft, DFG), the target validation project for pharmaceutical development ALTERNATIVE of the German Ministry for Education and Research (Bundesministerium für Bildung und Forschung, BMBF), and a Translational Research Grant by the German Center for Lung Research (Deutsches Zentrum für Lungenforschung, DZL) (all to GTS); the Greek State Scholarship Foundation Program “Reinforcement of Postdoctoral Researchers‐1st and 2nd cycles” co‐financed by the European Union Social Fund and Greek national funds (NSRF 2014–2020 and MIS‐5033021) (to IG, MS, and IL); General Secretariat for Research and Innovation and Hellenic Foundation for Research and Innovation grant #1853a (to MS); REPSIRE European Respiratory Society Fellowship (LTRF 2015‐1824) (to IP); INSERM, CNRS, the “Institut de Recherche en Santé Respiratoire des Pays de la Loire”, ARSMESO44, the National Research Agency under the Programme d' Investissements d' Avenir (ANR‐16‐IDEX‐0007), and the Pays de la Loire Region research program (all to CB, MG, and SD); as well as INSERM, the Ligue Contre le Cancer (Ile de France committee), and the Chancellerie des Universités de Paris (Legs POIX) (all to DJ). Open Access funding enabled and organized by Projekt DEAL.
EMBO Mol Med (2022) 14: e13631.
Data availability
Affymetrix CytoScanHD Microarray data: GEO dataset GSE134349 (https://www.ncbi.nlm.nih.gov/geo/query/acc.cgi?acc=GSE134349).
IonTorrent RNA sequencing data: GEO dataset GSE94415 (https://www.ncbi.nlm.nih.gov/geo/query/acc.cgi?&acc=GSE94415).
References
- Abbosh C, Birkbak NJ, Wilson GA, Jamal‐Hanjani M, Constantin T, Salari R, Le Quesne J, Moore DA, Veeriah S, Rosenthal R et al (2017) Phylogenetic ctDNA analysis depicts early‐stage lung cancer evolution. Nature 545: 446–451 [DOI] [PMC free article] [PubMed] [Google Scholar]
- Agalioti T, Giannou AD, Krontira AC, Kanellakis NI, Kati D, Vreka M, Pepe M, Spella M, Lilis I, Zazara DE et al (2017) Mutant KRAS mediates malignant pleural effusion formation. Nat Commun 8: 15205 [DOI] [PMC free article] [PubMed] [Google Scholar]
- Arizti P, Fang L, Park I, Yin Y, Solomon E, Ouchi T, Aaronson SA, Lee SW (2000) Tumor suppressor p53 is required to modulate BRCA1 expression. Mol Cell Biol 20: 7450–7459 [DOI] [PMC free article] [PubMed] [Google Scholar]
- Bi M, Zhao S, Said JW, Merino MJ, Adeniran AJ, Xie Z, Nawaf CB, Choi J, Belldegrun AS, Pantuck AJ et al (2016) Genomic characterization of sarcomatoid transformation in clear cell renal cell carcinoma. Proc Natl Acad Sci USA 113: 2170–2175 [DOI] [PMC free article] [PubMed] [Google Scholar]
- Bibby AC, Tsim S, Kanellakis N, Ball H, Talbot DC, Blyth KG, Maskell NA, Psallidas I (2016) Malignant pleural mesothelioma: an update on investigation, diagnosis and treatment. Eur Respir Rev 25: 472–486 [DOI] [PMC free article] [PubMed] [Google Scholar]
- Blanquart C, Fonteneau J, Minvielle S (2019) Gene Expression Omnibus GSE134349 (https://www.ncbi.nlm.nih.gov/geo/query/acc.cgi?acc=GSE134349). [DATASET]
- Blanquart C, Jaurand MC, Jean D (2020) The biology of malignant mesothelioma and the relevance of preclinical models. Front Oncol 10: 388 [DOI] [PMC free article] [PubMed] [Google Scholar]
- Bott M, Brevet M, Taylor BS, Shimizu S, Ito T, Wang LU, Creaney J, Lake RA, Zakowski MF, Reva B et al (2011) The nuclear deubiquitinase BAP1 is commonly inactivated by somatic mutations and 3p21.1 losses in malignant pleural mesothelioma. Nat Genet 43: 668–672 [DOI] [PMC free article] [PubMed] [Google Scholar]
- Brown CJ, Lain S, Verma CS, Fersht AR, Lane DP (2009) Awakening guardian angels: drugging the p53 pathway. Nat Rev Cancer 9: 862–873 [DOI] [PubMed] [Google Scholar]
- Bueno R, Stawiski EW, Goldstein LD, Durinck S, De Rienzo A, Modrusan Z, Gnad F, Nguyen TT, Jaiswal BS, Chirieac LR et al (2016) Comprehensive genomic analysis of malignant pleural mesothelioma identifies recurrent mutations, gene fusions and splicing alterations. Nat Genet 48: 407–416 [DOI] [PubMed] [Google Scholar]
- Burt BM, Bader A, Winter D, Rodig SJ, Bueno R, Sugarbaker DJ (2012) Expression of interleukin‐4 receptor alpha in human pleural mesothelioma is associated with poor survival and promotion of tumor inflammation. Clin Cancer Res 18: 1568–1577 [DOI] [PubMed] [Google Scholar]
- Byrd AL, Segre JA (2016) Infectious disease. Adapting Koch's postulates. Science 351: 224–226 [DOI] [PubMed] [Google Scholar]
- Cao YA, Wagers AJ, Beilhack A, Dusich J, Bachmann MH, Negrin RS, Weissman IL, Contag CH (2004) Shifting foci of hematopoiesis during reconstitution from single stem cells. Proc Natl Acad Sci USA 101: 221–226 [DOI] [PMC free article] [PubMed] [Google Scholar]
- Carbone M, Adusumilli PS, Alexander HR, Baas P, Bardelli F, Bononi A, Bueno R, Felley‐Bosco E, Galateau‐Salle F, Jablons D et al (2019) Mesothelioma: scientific clues for prevention, diagnosis, and therapy. CA Cancer J Clin 69: 402–429 [DOI] [PMC free article] [PubMed] [Google Scholar]
- Cerami E, Gao J, Dogrusoz U, Gross BE, Sumer SO, Aksoy BA, Jacobsen A, Byrne CJ, Heuer ML, Larsson E et al (2012) The cBio cancer genomics portal: an open platform for exploring multidimensional cancer genomics data. Cancer Discov 2: 401–404 [DOI] [PMC free article] [PubMed] [Google Scholar]
- Cheah HM, Lansley SM, Varano Della Vergiliana JF, Tan AL, Thomas R, Leong SL, Creaney J, Lee YC (2017) Malignant pleural fluid from mesothelioma has potent biological activities. Respirology 22: 192–199 [DOI] [PubMed] [Google Scholar]
- Comertpay S, Pastorino S, Tanji M, Mezzapelle R, Strianese O, Napolitano A, Baumann F, Weigel T, Friedberg J, Sugarbaker P et al (2014) Evaluation of clonal origin of malignant mesothelioma. J Transl Med 12: 301 [DOI] [PMC free article] [PubMed] [Google Scholar]
- Courtiol P, Maussion C, Moarii M, Pronier E, Pilcer S, Sefta M, Manceron P, Toldo S, Zaslavskiy M, Le Stang N et al (2019) Deep learning‐based classification of mesothelioma improves prediction of patient outcome. Nat Med 25: 1519–1525 [DOI] [PubMed] [Google Scholar]
- De Rienzo A, Richards WG, Yeap BY, Coleman MH, Sugarbaker PE, Chirieac LR, Wang YE, Quackenbush J, Jensen RV, Bueno R (2012) Gene Expression Omnibus GSE42977 (https://www.ncbi.nlm.nih.gov/geo/query/acc.cgi?acc=GSE42977). [DATASET]
- De Rienzo A, Richards WG, Yeap BY, Coleman MH, Sugarbaker PE, Chirieac LR, Wang YE, Quackenbush J, Jensen RV, Bueno R (2013) Sequential binary gene ratio tests define a novel molecular diagnostic strategy for malignant pleural mesothelioma. Clin Cancer Res 19: 2493–2502 [DOI] [PMC free article] [PubMed] [Google Scholar]
- De Rienzo A, Archer MA, Yeap BY, Dao N, Sciaranghella D, Sideris AC, Zheng Y, Holman AG, Wang YE, Dal Cin PS et al (2016) Gender‐specific molecular and clinical features underlie malignant pleural mesothelioma. Cancer Res 76: 319–328 [DOI] [PMC free article] [PubMed] [Google Scholar]
- Delaunay T, Achard C, Boisgerault N, Grard M, Petithomme T, Chatelain C, Dutoit S, Blanquart C, Royer P‐J, Minvielle S et al (2020) Frequent homozygous deletions of type I interferon genes in pleural mesothelioma confer sensitivity to oncolytic measles virus. J Thorac Oncol 15: 827–842 [DOI] [PubMed] [Google Scholar]
- Demuth C, Spindler KG, Johansen JS, Pallisgaard N, Nielsen D, Hogdall E, Vittrup B, Sorensen BS (2018) Measuring KRAS mutations in circulating tumor DNA by droplet digital PCR and next‐generation sequencing. Transl Oncol 11: 1220–1224 [DOI] [PMC free article] [PubMed] [Google Scholar]
- Enomoto Y, Kasai T, Takeda M, Takano M, Morita K, Kadota E, Iizuka N, Maruyama H, Haratake J, Kojima YU et al (2012) Epidermal growth factor receptor mutations in malignant pleural and peritoneal mesothelioma. J Clin Pathol 65: 522–527 [DOI] [PubMed] [Google Scholar]
- Ewing B, Hillier L, Wendl MC, Green P (1998) Base‐calling of automated sequencer traces using phred I accuracy assessment. Genome Res 8: 175–185 [DOI] [PubMed] [Google Scholar]
- Faul F, Erdfelder E, Lang AG, Buchner A (2007) G*Power 3: a flexible statistical power analysis program for the social, behavioral, and biomedical sciences. Behav Res Methods 39: 175–191 [DOI] [PubMed] [Google Scholar]
- Fennell DA, Parmar A, Shamash J, Evans MT, Sheaff MT, Sylvester R, Dhaliwal K, Gower N, Steele J, Rudd R (2005) Statistical validation of the EORTC prognostic model for malignant pleural mesothelioma based on three consecutive phase II trials. J Clin Oncol 23: 184–189 [DOI] [PubMed] [Google Scholar]
- Flaherty KT, Puzanov I, Kim KB, Ribas A, McArthur GA, Sosman JA, O'Dwyer PJ, Lee RJ, Grippo JF, Nolop K et al (2010) Inhibition of mutated, activated BRAF in metastatic melanoma. N Engl J Med 363: 809–819 [DOI] [PMC free article] [PubMed] [Google Scholar]
- Forbes SA, Beare D, Gunasekaran P, Leung K, Bindal N, Boutselakis H, Ding M, Bamford S, Cole C, Ward S et al (2015) COSMIC: exploring the world's knowledge of somatic mutations in human cancer. Nucleic Acids Res 43: D805–D811 [DOI] [PMC free article] [PubMed] [Google Scholar]
- Fridlender ZG, Sun J, Kim S, Kapoor V, Cheng G, Ling L, Worthen GS, Albelda SM (2009) Polarization of tumor‐associated neutrophil phenotype by TGF‐beta: "N1" versus "N2" TAN. Cancer Cell 16: 183–194 [DOI] [PMC free article] [PubMed] [Google Scholar]
- Galateau‐Salle F, Churg A, Roggli V, Travis WD; World Health Organization Committee for Tumors of the Pleura (2016) The 2015 World Health Organization classification of tumors of the pleura: advances since the 2004 classification. J Thorac Oncol 11: 142–154 [DOI] [PubMed] [Google Scholar]
- Giannou AD, Marazioti A, Kanellakis NI, Giopanou I, Lilis I, Zazara DE, Ntaliarda G, Kati D, Armenis V, Giotopoulou GA et al (2017) NRAS destines tumor cells to the lungs. EMBO Mol Med 9: 672–686 [DOI] [PMC free article] [PubMed] [Google Scholar]
- Giannou AD, Marazioti A, Spella M, Kanellakis NI, Apostolopoulou H, Psallidas I, Prijovich ZM, Vreka M, Zazara DE, Lilis I et al (2015) Mast cells mediate malignant pleural effusion formation. J Clin Invest 125: 2317–2334 [DOI] [PMC free article] [PubMed] [Google Scholar]
- Global Burden of Disease (GBD) 2016 Occupational Carcinogens Collaborators (2020) Global and regional burden of cancer in 2016 arising from occupational exposure to selected carcinogens: a systematic analysis for the Global Burden of Disease Study 2016. Occup Environ Med 77: 151–159 [DOI] [PMC free article] [PubMed] [Google Scholar]
- Gueugnon F, Leclercq S, Blanquart C, Sagan C, Cellerin L, Padieu M, Perigaud C, Scherpereel A, Gregoire M (2011) Identification of novel markers for the diagnosis of malignant pleural mesothelioma. Am J Pathol 178: 1033–1042 [DOI] [PMC free article] [PubMed] [Google Scholar]
- Guo Y, Chirieac LR, Bueno R, Pass H, Wu W, Malinowska IA, Kwiatkowski DJ (2014) Tsc1‐Tp53 loss induces mesothelioma in mice, and evidence for this mechanism in human mesothelioma. Oncogene 33: 3151–3160 [DOI] [PMC free article] [PubMed] [Google Scholar]
- Guo G, Chmielecki J, Goparaju C, Heguy A, Dolgalev I, Carbone M, Seepo S, Meyerson M, Pass HI (2015) Whole‐exome sequencing reveals frequent genetic alterations in BAP1, NF2, CDKN2A, and CUL1 in malignant pleural mesothelioma. Cancer Res 75: 264–269 [DOI] [PubMed] [Google Scholar]
- Hassan M, Mercer RM, Maskell NA, Asciak R, McCracken DJ, Bedawi EO, Shaarawy H, El‐Ganady A, Psallidas I, Miller RF et al (2019) Survival in patients with malignant pleural effusion undergoing talc pleurodesis. Lung Cancer 137: 14–18 [DOI] [PubMed] [Google Scholar]
- Herbst RS, Maddox A‐M, Rothenberg ML, Small EJ, Rubin EH, Baselga J, Rojo F, Hong WK, Swaisland H, Averbuch SD et al (2002) Selective oral epidermal growth factor receptor tyrosine kinase inhibitor ZD1839 is generally well‐tolerated and has activity in non‐small‐cell lung cancer and other solid tumors: results of a phase I trial. J Clin Oncol 20: 3815–3825 [DOI] [PubMed] [Google Scholar]
- Hmeljak J, Sanchez‐Vega F, Hoadley KA, Shih J, Stewart C, Heiman D, Tarpey P, Danilova L, Drill E, Gibb EA et al (2018) Integrative molecular characterization of malignant pleural mesothelioma. Cancer Discov 8: 1548–1565 [DOI] [PMC free article] [PubMed] [Google Scholar]
- Ikediobi ON, Davies H, Bignell G, Edkins S, Stevens C, O'Meara S, Santarius T, Avis T, Barthorpe S, Brackenbury L et al (2006) Mutation analysis of 24 known cancer genes in the NCI‐60 cell line set. Mol Cancer Ther 5: 2606–2612 [DOI] [PMC free article] [PubMed] [Google Scholar]
- Jackson EL, Willis N, Mercer K, Bronson RT, Crowley D, Montoya R, Jacks T, Tuveson DA (2001) Analysis of lung tumor initiation and progression using conditional expression of oncogenic K‐ras. Genes Dev 15: 3243–3248 [DOI] [PMC free article] [PubMed] [Google Scholar]
- Jamal‐Hanjani M, Wilson GA, McGranahan N, Birkbak NJ, Watkins TBK, Veeriah S, Shafi S, Johnson DH, Mitter R, Rosenthal R et al (2017) Tracking the evolution of non‐small‐cell lung cancer. N Engl J Med 376: 2109–2121 [DOI] [PubMed] [Google Scholar]
- Jay JJ, Brouwer C (2016) Lollipops in the clinic: information dense mutation plots for precision medicine. PLoS One 11: e0160519 [DOI] [PMC free article] [PubMed] [Google Scholar]
- Jongsma J, van Montfort E, Vooijs M, Zevenhoven J, Krimpenfort P, van der Valk M, van de Vijver M, Berns A (2008) A conditional mouse model for malignant mesothelioma. Cancer Cell 13: 261–271 [DOI] [PubMed] [Google Scholar]
- Kadariya Y, Menges CW, Talarchek J, Cai KQ, Klein‐Szanto AJ, Pietrofesa RA, Christofidou‐Solomidou M, Cheung M, Mossman BT, Shukla A et al (2016) Inflammation‐related IL1β/IL1R signaling promotes the development of asbestos‐induced malignant mesothelioma. Cancer Prev Res (Phila) 9: 406–414 [DOI] [PMC free article] [PubMed] [Google Scholar]
- Kanellakis NI, Giannou AD, Pepe MAA, Agalioti T, Zazara DE, Giopanou I, Psallidas I, Spella M, Marazioti A, Arendt KAM et al (2019) Tobacco chemical‐induced mouse lung adenocarcinoma cell lines pin the prolactin orthologue proliferin as a lung tumour promoter. Carcinogenesis 40: 1352–1362 [DOI] [PubMed] [Google Scholar]
- Kanellakis NI, Asciak R, Hamid MA, Yao X, McCole M, McGowan S, Seraia E, Hatch S, Hallifax RJ, Mercer RM et al (2020) Patient‐derived malignant pleural mesothelioma cell cultures: a tool to advance biomarker‐driven treatments. Thorax 75: 1004–1008 [DOI] [PMC free article] [PubMed] [Google Scholar]
- Kato S, Tomson BN, Buys TP, Elkin SK, Carter JL, Kurzrock R (2016) Genomic landscape of malignant mesotheliomas. Mol Cancer Ther 15: 2498–2507 [DOI] [PubMed] [Google Scholar]
- Kindler HL, Ismaila N, Armato SG, Bueno R, Hesdorffer M, Jahan T, Jones CM, Miettinen M, Pass H, Rimner A et al (2018) Treatment of malignant pleural mesothelioma: American Society of Clinical Oncology Clinical Practice Guideline. J Clin Oncol 36: 1343–1373 [DOI] [PMC free article] [PubMed] [Google Scholar]
- Klotz LV, Courty Y, Lindner M, Petit‐Courty A, Stowasser A, Koch I, Eichhorn ME, Lilis I, Morresi‐Hauf A, Arendt KAM et al (2019) Comprehensive clinical profiling of the Gauting locoregional lung adenocarcinoma donors. Cancer Med 8: 1486–1499 [DOI] [PMC free article] [PubMed] [Google Scholar]
- Klotz LV, Lindner M, Eichhorn ME, Grützner U, Koch I, Winter H, Kauke T, Duell T, Hatz RA (2019) Pleurectomy/decortication and hyperthermic intrathoracic chemoperfusion using cisplatin and doxorubicin for malignant pleural mesothelioma. J Thorac Dis 11: 1963–1972 [DOI] [PMC free article] [PubMed] [Google Scholar]
- Kukuyan AM, Sementino E, Kadariya Y, Menges CW, Cheung M, Tan Y, Cai KQ, Slifker MJ, Peri S, Klein‐Szanto AJ et al (2019) Inactivation of Bap1 cooperates with losses of Nf2 and Cdkn2a to drive the development of pleural malignant mesothelioma in conditional mouse models. Cancer Res 79: 4113–4123 [DOI] [PMC free article] [PubMed] [Google Scholar]
- Liu B, van Gerwen M, Bonassi S, Taioli E; International Association for the Study of Lung Cancer Mesothelioma Task Force (2017) Epidemiology of Environmental Exposure and Malignant Mesothelioma. J Thorac Oncol 12: 1031–1045 [DOI] [PubMed] [Google Scholar]
- Li S, MacAlpine DM, Counter CM (2020) Capturing the primordial Kras mutation initiating urethane carcinogenesis. Nat Commun 11: 1800 [DOI] [PMC free article] [PubMed] [Google Scholar]
- Lo Iacono M, Monica V, Righi L, Grosso F, Libener R, Vatrano S, Bironzo P, Novello S, Musmeci L, Volante M et al (2015) Targeted next‐generation sequencing of cancer genes in advanced stage malignant pleural mesothelioma: a retrospective study. J Thorac Oncol 10: 492–499 [DOI] [PubMed] [Google Scholar]
- Marazioti A, Lilis I, Vreka M, Apostolopoulou H, Kalogeropoulou A, Giopanou I, Giotopoulou GA, Krontira AC, Iliopoulou M, Kanellakis NI et al (2018) Myeloid‐derived interleukin‐1β drives oncogenic KRAS‐NF‐κΒ addiction in malignant pleural effusion. Nat Commun 9: 672 [DOI] [PMC free article] [PubMed] [Google Scholar]
- Marazioti A, Papadia K, Giannou A, Stathopoulos GT, Antimisiaris SG (2019) Prolonged retention of liposomes in the pleural cavity of normal mice and high tumor distribution in mice with malignant pleural effusion, after intrapleural injection. Int J Nanomed 14: 3773–3784 [DOI] [PMC free article] [PubMed] [Google Scholar]
- Marazioti A, Voulgaridis A, Psallidas I, Lamort AS, Iliopoulou M, Krontira AC, Lilis I, Asciak R, Kanellakis NI, Rahman NM et al (2021) Clinical identification of malignant pleural effusions. medRxiv 10.1101/2020.05.31.20118307 [PREPRINT] [DOI] [PMC free article] [PubMed] [Google Scholar]
- Marino S, Vooijs M, van Der Gulden H, Jonkers J, Berns A (2000) Induction of medulloblastomas in p53‐null mutant mice by somatic inactivation of Rb in the external granular layer cells of the cerebellum. Genes Dev 14: 994–1004 [PMC free article] [PubMed] [Google Scholar]
- Markoutsa E, Papadia K, Giannou AD, Spella M, Cagnotto A, Salmona M, Stathopoulos GT, Antimisiaris SG (2014) Mono and dually decorated nanoliposomes for brain targeting, in vitro and in vivo studies. Pharm Res 31: 1275–1289 [DOI] [PubMed] [Google Scholar]
- Mason RJ, Kalina M, Nielsen LD, Malkinson AM, Shannon JM (2000) Surfactant protein C expression in urethane‐induced murine pulmonary tumors. Am J Pathol 156: 175–182 [DOI] [PMC free article] [PubMed] [Google Scholar]
- Matallanas D, Romano D, Al‐Mulla F, O'Neill E, Al‐Ali W, Crespo P, Doyle B, Nixon C, Sansom O, Drosten M et al (2011) Mutant K‐Ras activation of the proapoptotic MST2 pathway is antagonized by wild‐type K‐Ras. Mol Cell 44: 893–906 [DOI] [PubMed] [Google Scholar]
- Menges CW, Kadariya Y, Altomare D, Talarchek J, Neumann‐Domer E, Wu Y, Xiao G‐H, Shapiro IM, Kolev VN, Pachter JA et al (2014) Tumor suppressor alterations cooperate to drive aggressive mesotheliomas with enriched cancer stem cells via a p53‐miR‐34a‐c‐Met axis. Cancer Res 74: 1261–1271 [DOI] [PMC free article] [PubMed] [Google Scholar]
- Meylan E, Dooley AL, Feldser DM, Shen L, Turk E, Ouyang C, Jacks T (2009) Requirement for NF‐kappaB signalling in a mouse model of lung adenocarcinoma. Nature 462: 104–107 [DOI] [PMC free article] [PubMed] [Google Scholar]
- Mezzapelle R, Miglio U, Rena O, Paganotti A, Allegrini S, Antona J, Molinari F, Frattini M, Monga G, Alabiso O et al (2013) Mutation analysis of the EGFR gene and downstream signalling pathway in histologic samples of malignant pleural mesothelioma. Br J Cancer 108: 1743–1749 [DOI] [PMC free article] [PubMed] [Google Scholar]
- Mutti L, Peikert T, Robinson BWS, Scherpereel A, Tsao AS, de Perrot M, Woodard GA, Jablons DM, Wiens J, Hirsch FR et al (2018) Scientific advances and new frontiers in mesothelioma therapeutics. J Thorac Oncol 13: 1269–1283 [DOI] [PMC free article] [PubMed] [Google Scholar]
- Muzumdar MD, Tasic B, Miyamichi K, Li L, Luo L (2007) A global double‐fluorescent Cre reporter mouse. Genesis 45: 593–605 [DOI] [PubMed] [Google Scholar]
- Nagai H, Okazaki Y, Chew SH, Misawa N, Yamashita Y, Akatsuka S, Ishihara T, Yamashita K, Yoshikawa Y, Yasui H et al (2011) Diameter and rigidity of multiwalled carbon nanotubes are critical factors in mesothelial injury and carcinogenesis. Proc Natl Acad Sci USA 108: E1330–E1338 [DOI] [PMC free article] [PubMed] [Google Scholar]
- Nasu M, Emi M, Pastorino S, Tanji M, Powers A, Luk H, Baumann F, Zhang Y‐A, Gazdar A, Kanodia S et al (2015) High incidence of somatic BAP1 alterations in sporadic malignant mesothelioma. J Thorac Oncol 10: 565–576 [DOI] [PMC free article] [PubMed] [Google Scholar]
- Paajanen J, Laaksonen S, Ilonen I, Wolff H, Husgafvel‐Pursiainen K, Kuosma E, Ollila H, Myllärniemi M, Vehmas T (2018) Computed tomography in the evaluation of malignant pleural mesothelioma‐Association of tumor size to a sarcomatoid histology, a more advanced TNM stage and poor survival. Lung Cancer 116: 73–79 [DOI] [PubMed] [Google Scholar]
- Pass H, Giroux D, Kennedy C, Ruffini E, Cangir AK, Rice D, Asamura H, Waller D, Edwards J, Weder W et al (2016) The IASLC mesothelioma staging project: improving staging of a rare disease through international participation. J Thorac Oncol 11: 2082–2088 [DOI] [PubMed] [Google Scholar]
- Patel MR, Jacobson BA, De A, Frizelle SP, Janne P, Thumma SC, Whitson BA, Farassati F, Kratzke RA (2007) Ras pathway activation in malignant mesothelioma. J Thorac Oncol 2: 789–795 [DOI] [PubMed] [Google Scholar]
- Patil NS, Righi L, Koeppen H, Zou W, Izzo S, Grosso F, Libener R, Loiacono M, Monica V, Buttigliero C et al (2018) Molecular and histopathological characterization of the tumor immune microenvironment in advanced stage of malignant pleural mesothelioma. J Thorac Oncol 13: 124–133 [DOI] [PubMed] [Google Scholar]
- Pauli C, Hopkins BD, Prandi D, Shaw R, Fedrizzi T, Sboner A, Sailer V, Augello M, Puca L, Rosati R et al (2017) Personalized in vitro and in vivo cancer models to guide precision medicine. Cancer Discov 7: 462–477 [DOI] [PMC free article] [PubMed] [Google Scholar]
- Pfaffl MW (2001) A new mathematical model for relative quantification in real‐time RT‐PCR. Nucleic Acids Res 29: e45 [DOI] [PMC free article] [PubMed] [Google Scholar]
- Poole JC, Wu S‐F, Lu TT, Vibat CRT, Pham A, Samuelsz E, Patel M, Chen J, Daher T, Singh VM et al (2019) Analytical validation of the target selector ctDNA platform featuring single copy detection sensitivity for clinically actionable EGFR, BRAF, and KRAS mutations. PLoS One 14: e0223112 [DOI] [PMC free article] [PubMed] [Google Scholar]
- Quetel L, Meiller C, Assié J‐B, Blum Y, Imbeaud S, Montagne F, Tranchant R, Wolf J, Caruso S, Copin M‐C et al (2020) Genetic alterations of malignant pleural mesothelioma: association with tumor heterogeneity and overall survival. Mol Oncol 14: 1207–1223 [DOI] [PMC free article] [PubMed] [Google Scholar]
- Robinson BW, Musk AW, Lake RA (2005) Malignant mesothelioma. Lancet 366: 397–408 [DOI] [PubMed] [Google Scholar]
- Robinson JT, Thorvaldsdóttir H, Winckler W, Guttman M, Lander ES, Getz G, Mesirov JP (2011) Integrative genomics viewer. Nat Biotechnol 29: 24 [DOI] [PMC free article] [PubMed] [Google Scholar]
- Rusch VW, Chansky K, Kindler HL, Nowak AK, Pass HI, Rice DC, Shemanski L, Galateau‐Sallé F, McCaughan BC, Nakano T et al (2016) The IASLC mesothelioma staging project: proposals for the M descriptors and for revision of the TNM stage groupings in the forthcoming (Eighth) edition of the TNM classification for mesothelioma. J Thorac Oncol 11: 2112–2119 [DOI] [PubMed] [Google Scholar]
- Ryman‐Rasmussen JP, Cesta MF, Brody AR, Shipley‐Phillips JK, Everitt JI, Tewksbury EW, Moss OR, Wong BA, Dodd DE, Andersen ME et al (2009) Inhaled carbon nanotubes reach the subpleural tissue in mice. Nat Nanotechnol 4: 747–751 [DOI] [PMC free article] [PubMed] [Google Scholar]
- Ryu JS, Ryu HJ, Lee SN, Memon A, Lee SK, Nam HS, Kim HJ, Lee KH, Cho JH, Hwang SS (2014) Prognostic impact of minimal pleural effusion in non‐small‐cell lung cancer. J Clin Oncol 32: 960–967 [DOI] [PubMed] [Google Scholar]
- Sanchez‐Vega F, Mina M, Armenia J, Chatila WK, Luna A, La KC, Dimitriadoy S, Liu DL, Kantheti HS, Saghafinia S et al (2018) Oncogenic signaling pathways in the cancer genome atlas. Cell 173: 321–337 [DOI] [PMC free article] [PubMed] [Google Scholar]
- Scherpereel A, Astoul P, Baas P, Berghmans T, Clayson H, de Vuyst P, Dienemann H, Galateau‐Salle F, Hennequin C, Hillerdal G et al (2010) Guidelines of the European Respiratory Society and the European Society of Thoracic Surgeons for the management of malignant pleural mesothelioma. Eur Respir J 35: 479–495 [DOI] [PubMed] [Google Scholar]
- Scherpereel A, Wallyn F, Albelda SM, Munck C (2018) Novel therapies for malignant pleural mesothelioma. Lancet Oncol 19: e161–e172 [DOI] [PubMed] [Google Scholar]
- Schindelin J, Arganda‐Carreras I, Frise E, Kaynig V, Longair M, Pietzsch T, Preibisch S, Rueden C, Saalfeld S, Schmid B et al (2012) Fiji: an open‐source platform for biological‐image analysis. Nat Methods 9: 676–682 [DOI] [PMC free article] [PubMed] [Google Scholar]
- Shukuya T, Serizawa M, Watanabe M, Akamatsu H, Abe M, Imai H, Tokito T, Ono A, Taira T, Kenmotsu H et al (2014) Identification of actionable mutations in malignant pleural mesothelioma. Lung Cancer 86: 35–40 [DOI] [PubMed] [Google Scholar]
- Smeele P, d'Almeida SM, Meiller C, Chéné A‐L, Liddell C, Cellerin L, Montagne F, Deshayes S, Benziane S, Copin M‐C et al (2018) Brain‐derived neurotrophic factor, a new soluble biomarker for malignant pleural mesothelioma involved in angiogenesis. Mol Cancer 17: 148 [DOI] [PMC free article] [PubMed] [Google Scholar]
- Smith JC, Sheltzer JM (2018) Systematic identification of mutations and copy number alterations associated with cancer patient prognosis. Elife 7: e39217 [DOI] [PMC free article] [PubMed] [Google Scholar]
- Spella M, Lilis I, Pepe MAA, Chen Y, Armaka M, Lamort A‐S, Zazara DE, Roumelioti F, Vreka M, Kanellakis NI et al (2019) Club cells form lung adenocarcinomas and maintain the alveoli of adult mice. Elife 8: e45571 [DOI] [PMC free article] [PubMed] [Google Scholar]
- Stathopoulos GT, Zhu Z, Everhart MB, Kalomenidis I, Lawson WE, Bilaceroglu S, Peterson TE, Mitchell D, Yull FE, Light RW et al (2006) Nuclear factor‐kappaB affects tumor progression in a mouse model of malignant pleural effusion. Am J Respir Cell Mol Biol 34: 142–150 [DOI] [PMC free article] [PubMed] [Google Scholar]
- Stathopoulos GT, Kanellakis NI, Pepe M (2017) Gene Expression Omnibus GSE94415: Transcriptomic profiling of KPM cell lines through RNA‐Seq (https://www.ncbi.nlm.nih.gov/geo/query/acc.cgi?acc=GSE94415). [DATASET]
- Stephen AG, Esposito D, Bagni RK, McCormick F (2014) Dragging ras back in the ring. Cancer Cell 25: 272–281 [DOI] [PubMed] [Google Scholar]
- Stott FJ, Bates S, James MC, McConnell BB, Starborg M, Brookes S, Palmero I, Ryan K, Hara E, Vousden KHJ et al (1998) The alternative product from the human CDKN2A locus, p14(ARF), participates in a regulatory feedback loop with p53 and MDM2. EMBO J 17: 5001–5014 [DOI] [PMC free article] [PubMed] [Google Scholar]
- Subramanian A, Tamayo P, Mootha VK, Mukherjee S, Ebert BL, Gillette MA, Paulovich A, Pomeroy SL, Golub TR, Lander ES et al (2005) Gene set enrichment analysis: a knowledge‐based approach for interpreting genome‐wide expression profiles. Proc Natl Acad Sci USA 102: 15545–15550 [DOI] [PMC free article] [PubMed] [Google Scholar]
- Thomas R, Fysh ETH, Smith NA, Lee P, Kwan BCH, Yap E, Horwood FC, Piccolo F, Lam DCL, Garske LA et al (2017) Effect of an indwelling pleural catheter vs talc pleurodesis on hospitalization days in patients with malignant pleural effusion: the AMPLE randomized clinical trial. JAMA 318: 1903–1912 [DOI] [PMC free article] [PubMed] [Google Scholar]
- Tikoo A, Varga M, Ramesh V, Gusella J, Maruta H (1994) An anti‐Ras function of neurofibromatosis type 2 gene product (NF2/Merlin). J Biol Chem 269: 23387–23390 [PubMed] [Google Scholar]
- Tsao AS, Wistuba I, Roth JA, Kindler HL (2009) Malignant pleural mesothelioma. J Clin Oncol 27: 2081–2090 [DOI] [PMC free article] [PubMed] [Google Scholar]
- Westbom CM, Shukla A, MacPherson MB, Yasewicz EC, Miller JM, Beuschel SL, Steele C, Pass HI, Vacek PM, Shukla A (2014) CREB‐induced inflammation is important for malignant mesothelioma growth. Am J Pathol 184: 2816–2827 [DOI] [PMC free article] [PubMed] [Google Scholar]
- Xu J, Kadariya Y, Cheung M, Pei J, Talarchek J, Sementino E, Tan Y, Menges CW, Cai KQ, Litwin S et al (2014) Germline mutation of Bap1 accelerates development of asbestos‐induced malignant mesothelioma. Cancer Res 74: 4388–4397 [DOI] [PMC free article] [PubMed] [Google Scholar]
- Yap TA, Aerts JG, Popat S, Fennell DA (2017) Novel insights into mesothelioma biology and implications for therapy. Nat Rev Cancer 17: 475–488 [DOI] [PubMed] [Google Scholar]
- Zalcman G, Mazieres J, Margery J, Greillier L, Audigier‐Valette C, Moro‐Sibilot D, Molinier O, Corre R, Monnet I, Gounant V et al (2016) French Cooperative Thoracic Intergroup (IFCT). Bevacizumab for newly diagnosed pleural mesothelioma in the Mesothelioma Avastin Cisplatin Pemetrexed Study (MAPS): a randomised, controlled, open‐label, phase 3 trial. Lancet 387: 1405–1414 [DOI] [PubMed] [Google Scholar]
- Zimmermann G, Papke B, Ismail S, Vartak N, Chandra A, Hoffmann M, Hahn SA, Triola G, Wittinghofer A, Bastiaens PIH et al (2013) Small molecule inhibition of the KRAS‐PDEδ interaction impairs oncogenic KRAS signalling. Nature 497: 638–642 [DOI] [PubMed] [Google Scholar]