Abstract
Noncoding RNAs have been verified to regulate the infiltration of macrophages to accelerate tumor biological progression, however the regulation of macrophages by circular RNAs in hepatocellular carcinoma (HCC) remains unresolved. Using high‐throughput RNA sequencing, we demonstrated that hsa_circ_0003410 was clearly upregulated in HCC. 5‐Ethynyl‐2′‐deoxyuridine and transwell assays showed that hsa_circ_0003410 facilitated the proliferation and migration of HCC cells in vitro. We knocked down the expression of hsa_circ_0003410 in HepG2 cells and performed next‐generation sequencing to determine possible target genes of hsa_circ_0003410. Kyoto Encyclopedia of Genes and Genomes analysis revealed that different genes were mainly enriched in immune‐related pathways. Mechanistically, we identified CCL5 as the target gene of hsa_circ_0003410. RNA‐FISH showed the co‐expression of hsa_circ_0003410 and CCL5. Western blot and ELISA also verified that hsa_circ_0003410 could upregulate the expression of CCL5 protein. Flow cytometry and immunofluorescence assays indicated that CCL5 activated and recruited M2 macrophages and increased the ratio of M2/M1 macrophages to promote the progression of HCC. Animal experiments in vitro also confirmed our results. Taken together, our experiments revealed that noncoding RNAs play a critical role in the HCC microenvironment and can be considered as markers for the diagnosis and prognosis of HCC.
Keywords: CCL5, hepatocellular carcinoma, hsa_circ_0003410, immune microenvironment, M2 macrophages
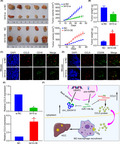
Through high‐throughput sequencing, we found that hsa_circ_0003410 was significantly overexpressed in HCC. We verified that hsa_circ_0003410 could promote the expression of CCL5 by sponging miR‐139‐3p. Flow cytometry found that CCL5 could significantly promote the polarization and recruitment of M2 macrophages and increase the ratio of M2/M1 macrophages.
Abbreviations
- EdU
5‐ethynyl‐2‐deoxyuridine
- HCC
hepatocellular carcinoma
- IF
immunofluorescence
- MVC
maraviroc
- NC
negative control
- qRT‐PCR
quantitative RT‐PCR
- TAMs
tumor‐associated macrophages
1. INTRODUCTION
HCC is the sixth most common solid malignancy worldwide. According to World Health Organization (WHO) statistics, as the third leading cause of death, HCC is responsible for approximately 1 in 6 deaths worldwide. 1 Cirrhosis, aflatoxin exposure, and alcoholism are the main causative factors for HCC. 2 Due to its high recurrence, malignant metastasis, and drug resistance, HCC has had a disappointing 5‐y survival rate. 3 , 4 Alpha‐fetoprotein (AFP) is the main biomarker for HCC diagnosis but it has had limited use when assessed alone. 5 It has been reported that serum anti‐EIF3A autoantibodies can improve the sensitivity and specificity of cancer diagnosis. 6
Noncoding RNAs are usually single‐stranded RNAs that do not encode proteins and that include circular RNAs, snRNAs, and microRNAs. 7 They were initially regarded as transcriptional “junk” products, but recently the most noncoding RNAs have been found to positively or negatively regulate gene expression. 8 , 9 Xu and colleagues' research revealed the negative functional relationship between Cdr1as and miR‐7 in islet cells. 10 Chen and Li 11 showed that circPVT1 promoted germinal center (GC) cell proliferation and invasion by acting as a sponge for miR‐125. It has also been proven that circβ‐catenin translation accelerates HCC via activation of the Wnt pathway. 12 Similarly, miRNAs can negatively regulate translation by interacting with the 3' untranslated region (3'UTR). 13 , 14 miRNAs are widely found in eukaryotic cells, 15 in which they can mediate the deregulation of target mRNAs. To date, miRNAs have been found to function not only in competitive endogenous RNA networks as sponges but also in some other noncanonical molecular mechanisms, such as posttranscriptional gene silencing 16 and transcriptional regulation. 17 , 18
Hepatic macrophages, including Kupfer cells and recruited macrophages, are involved in the occurrence and development of a variety of liver diseases. They rectify the inflammatory microenvironment by producing different cytokines and chemokines. 19 According to different activation procedures, macrophages can be mainly divided into classically activated macrophages (M1) and alternatively activated macrophages (M2). 20 Currently, TAMs are the most well known component in the tumor microenvironment. They have been demonstrated to be involved in cancer cell proliferation, angiogenesis, invasion, metastasis, and immunosuppression. 21 However, the recruitment and polarization of macrophages in HCC are poorly understood.
Furthermore, how circRNAs affect macrophage expression patterns remains unclear. Whether a classic ceRNA network or its interactions with proteins are involved remains to be further investigated. In this study, we analyzed the overall circular RNA expression profile through microarray sequencing and found that hsa_circ_0003410, derived from the UBAP2 gene locus with a 329‐nt splice length, was markedly upregulated in HCC. Mechanistically, hsa_circ_0003410 could stimulate the expression of CCL5 by sponging miR‐139‐3p to recruit macrophages. Previous studies have revealed that CCL5 mediates immune and inflammatory responses to regulate biological processes. 22 , 23
Considering the positive effect of CCL5 in HCC progression, 24 , 25 , 26 we speculate that hsa_circ_0003410 can promote the immune response for HCC through CCL5, thereby promoting HCC progression.
2. MATERIALS AND METHODS
2.1. Patients and tissue specimens
Tumor specimens from HCC patients together with matched adjacent normal tissues were obtained from 50 patients at the Department of Hepatobiliary Surgery, the First Affiliated Hospital of Soochow University, Jiangsu Province, China, and were used for subsequent clinical data analysis. The research was approved by the Ethics Committee of the First Affiliated Hospital of Soochow University, and informed consent was obtained from all patients enrolled in the study.
2.2. Cell culture
Hep1, HepG2, Hep3B, Huh7, and SMMC7721 human HCC cells and L02 normal liver cells purchased from GenePharma Technology Co., Ltd were studied in our research. Cells were cultured in DMEM supplemented with 10% FBS and 1% penicillin/streptomycin in a humidified 5% CO2 incubator at 37°C.
2.3. Microarray profiling analysis
To identify differential noncoding RNAs in HCC, total RNA was isolated from 8 paired HCC specimens using the mirVana miRNA Isolation Kit (Ambion). An Agilent 2100 bioanalyzer (Agilent Technologies) was used to assess RNA integrity. Libraries sequenced on the Illumina sequencing platform (HiSeq™ 2500) were prepared using the TruSeq Stranded Total RNA with Ribo‐Zero Gold kit.
To evaluate the target genes regulated by hsa_circ_0003410, we knocked down the expression of hsa_circ_0003410 by transfecting the interference fragment into HepG2 cells and then used the Illumina sequencing platform to analyze the expression changes of downstream target genes. Differentially expressed noncoding RNAs and mRNAs with a fold change (FC) ≥ 2 and P ≤ .05 were identified.
2.4. Prediction of target miRNAs
We used the online bioinformatic forecasting site CircInteractome to predict the downstream miRNAs to which hsa_circ_0003410 may bind. Based on the selected downstream mRNAs, we also predicted miRNAs that might interact with the 3′‐UTR of the mRNAs through the online site miRWalk, and by intersecting the results, we identified genes of interest.
2.5. Transfection
Hsa_circ_0003410 interference fragments 3410‐si‐1, 3410‐si‐2, and its overexpression plasmids (GenePharma, China) were synthesized and co‐transfected using Lipofectamine 2000 reagent to downregulate or upregulate the expression levels in HCC cells, respectively. miR‐139‐3p mimics and inhibitors (Synbio Technologies, China) were transfected into cells at a concentration of 50 nmol according to the manufacturer's instructions, to temporarily modulate miRNA expression. After 48 h of transfection, cells were collected for further experiments. The siRNA and miRNA mimics or inhibitor sequences are listed in Table S2.
2.6. RNA isolation and quantitative real‐time polymerase chain reaction
Total RNA was extracted from HCC cells or specimens. All primers used for qRT‐PCR were designed and blasted at the National Center for Biotechnology Information. RNA reverse transcription was performed using Vazyme following the manufacturer’s protocol. Primers were synthesized by Synbio Technologies (Suzhou, China). Human ACTB and U6 served as the internal controls for circRNAs, mRNAs, and miRNAs. Relative RNA levels were determined using the method relative to the control. The primer sequences are shown in Table S2.
2.7. Fluorescence in situ hybridization
To visualize the co‐expression of hsa_circ_0003410 and CCL5 mRNA, FAM‐labeled probes for hsa_circ_0003410 and Cy3‐labeled probes for CCL5 were synthesized by GenePharma. After fixation and permeabilization, treated cells were incubated with prehybridization buffer at 37°C for 30 min and then co‐cultured with hybridization buffer containing 1 µM probes at 37°C overnight. Subsequently, the nuclei were stained with DAPI. A confocal microscope was used for image capture.
2.8. Biotin‐coupled miRNA probe pull‐down assay
First, a biotinylated miR‐139‐3p probe that could bind to the possible binding sites of hsa_circ_0003410 was synthesized (GenePharma, China). The probe sequence was Bio‐5′‐UGGAGACGCGGCCCUGUUGGAGU‐3′. The antisense sequence of miR‐139‐3p was used as a NC reagent. Approximately 5 × 10⁷ miR‐139‐3p‐overexpressing Hep1 cells were washed, then fixed with 1% formaldehyde for 10 min, lysed with RNA lysis buffer and centrifuged to obtain the supernatant. The supernatant was incubated overnight with streptavidin‐conjugated magnetic Dynabeads (Invitrogen) to enrich for the miR‐139‐3p probe. The next day, the circRNA‐bead‐miRNA mixture was washed, RNA was extracted and the hsa_circ_0003410 content was analyzed using qRT‐PCR.
2.9. Wound‐healing assay
Transfected HCC cells in different treatment groups were seeded into a six‐well plate and grown to ~80% confluency. Intact cell monolayers were wounded evenly by scratching with a 200‐µL pipette tip. To capture the 0‐h and 48‐h time points, cell movement was assessed with an optical microscope by measuring the distance the cells in the different groups migrated.
2.10. Cell counting kit‐8 assay
Stably transfected HCC cells were seeded equally in a 96‐well plate (5 × 10³ cells per well) and cultured for 0, 24, 48, 72, or 96 h. Then, HCC cell viability was measured by adding 10 µL CCK‐8 reagent (Dojindo Laboratories) and incubating the plate at 37°C for 2 h as stated in the protocol. Then, the optical density was detected and compared using a microplate reader at a wavelength of 450 nm.
2.11. 5‐Ethynyl‐2‐deoxyuridine assay
The Cell‐Light™ EdU Apollo567 In Vitro Kit (RiboBio) was applied for detection of the proliferative capacity. Briefly, after transfection for 48 h, cells were incubated with 5 µM EdU reagent for 2 h. Subsequently, the cells were permeabilized for 20 min by 4% paraformaldehyde fixation for 30 min. Apollo and DAPI dyes were used to stain DNA and nuclei, respectively, according to the manufacturer's instructions. Images of EdU and DAPI staining were acquired under a fluorescence microscope in a dark room.
2.12. Transwell invasion assay
Transwell chambers (Costar) were used to evaluate migration. Cells were added to serum‐free DMEM in the upper chamber, and the lower chamber was filled with 700 µL DMEM containing 20% FBS. After incubation for 48 h, cell numbers invading through the upper chamber were counted and images were collected using a fluorescence microscopy.
To verify that hsa_circ_0003410 could promote macrophage migration, HepG2 cells and macrophages were co‐cultured in a transwell chamber. In short, ~1 × 10⁴ M0 macrophages were added to the upper compartment and differently treated HepG2 cells were added to the lower compartment. After co‐culture for 48 h, cell fixation, staining, and microscopy analysis were performed.
2.13. Luciferase reporter assay
Wild‐type and mutant reporter plasmids containing possible binding sites were constructed, synthesized, and then co‐transfected with miRNA mimics into 293T cells using Lipofectamine 2000 regent. After incubation for 48 h, the cells were collected and lysed using Passive Lysis Buffer (PLB); luciferase activity was measured using the Dual‐Luciferase Reporter Assay kit (Promega).
2.14. Concentration gradient assays
We transfected miR‐NC or miRNA mimics at 10, 20, 40, or 80 nmol concentration into HepG2 cells for 48 h, and then extracted total RNA to detect the expression of target mRNAs by qRT‐PCR.
2.15. CCL5 ELISA
The level of CCL5 secreted by HCC cells was detected using ELISA and a CCL5 ELISA kit (KEJING Biology). According to the protocol, after antigen coating, blocking, HRP‐conjugated antibody addition, substrate addition, and reaction termination, the fluorescence value was detected at 450 nm. Then a standard curve was drawn, and the expression level of CCL5 was determined.
2.16. Immunofluorescence detection assay
For HCC or mouse tumor specimens and hepatic cell slides, after dewaxing, hydration, and antigen repair, paraffin sections were blocked with an immunostaining blocking solution for 1 h, incubated with primary antibody at 4°C overnight, and then incubated with corresponding secondary antibody for 1 h in a dark environment. The sections were sealed with an anti‐fluorescence quenching agent and imaged under a fluorescence microscope. CCL5 primary antibody (Santa, USA) and CD16/CD206 primary antibody (BD Biosciences) were used for IF assay.
2.17. Identifying macrophage phenotypes using flow cytometry
THP‐1 macrophages were induced with 50 ng/mL PMA (MultiSciences, China) for 48 h to polarize the cells into M0 macrophages, and then recombinant human CCL5 protein (Genscript, China) was applied at a concentration of 20 ng/mL to induce macrophage polarization for 72 h. Later, according to the protocol, the cells were fixed with paraformaldehyde, followed by incubation with 5% BSA for 1 h. Then, flow cytometry antibodies specific for M1 (CD16) and M2 (CD206) macrophage markers (BD Pharmingen) were added and cells incubated at 4℃ for 1.5 h. The phenotypes of polarized cells were detected using flow cytometry.
2.18. Western blotting
We used a RIPA (Cwbiotech) mixture containing 1% PMSF lysate to lyse transfected cells for total protein. Later total protein lysates were electrophoresed on 10% SDS polyacrylamide gels and stably transferred to PVDF membranes (Millipore) at 200 mA for 1.5 h, then the membrane was blocked in 5% skimmed milk for 1 h. The membrane was incubated with primary antibodies overnight at 4°C, and subsequently an HRP‐labeled secondary antibody (ImmunoWay) was incubated with the membrane for 1 h in a dark room. The immunoreactive protein was visualized using chemiluminescence. ACTB served as a housekeeping gene.
2.19. Xenograft nude mouse model
Male BALB/c nude mice (3‐5 wk) were purchased and raised in the Animal Experiment Center of Soochow University. At, 1 wk later, approximately 2 × 10⁶ HepG2 cells in 0.1 mL PBS were subcutaneously injected into the right armpit region of the mice. From the time tumors formed, the 3410‐siRNA fragment or overexpression plasmids were injected into matched subcutaneous tumors every 3 d for 4 wk, and tumor size was measured every 3 d. At 4 wk later, the mice were sacrificed, and the weights of the subcutaneous tumors were measured according to the Animal Management Rule of the Chinese Ministry of Health. The specimens were used for subsequent experimental studies.
2.20. Statistical analysis
All data are presented as the mean ± standard deviation of at least 3 independent experiments. We applied GraphPad Prism 7.0 software for statistical analysis and illustration. Student t test was used to analyze differences between the 2 groups. Overall survival was compared between different groups using the Kaplan‐Meier method. Experimental data were considered to represent a significant difference only if P‐values were < .05.
3. RESULTS
3.1. Microarray profiling revealed high expression of hsa_circ_0003410 in HCC tissues
To elucidate the specific noncoding RNA functional networks in HCC, 8 pairs of HCC, and matched adjacent normal tissues were analyzed via high‐throughput RNA sequencing. As shown, 96 differentially expressed genes with a fold change >2 and P‐value < .05 were identified (Table S1), including 40 upregulated and 56 downregulated noncoding RNAs (Figure 1A,B). To determine the targets, we detected the expression of differential circRNAs in 50 pairs of HCC specimens and found that hsa_circ_0003410 was significantly upregulated (P = .0006) (Figure 1C,D). Considering that hsa_circ_0003410 was rarely reported, we mainly focused on hsa_circ_0003410 in HCC. Moreover, we also checked the expression of hsa_circ_0003410 in HCC cell lines, and this was in line with our expectations (P < .01) (Figure 1E). HepG2 and Hep1 cells had higher and lower expression levels and were therefore used for cell experiments.
FIGURE 1.
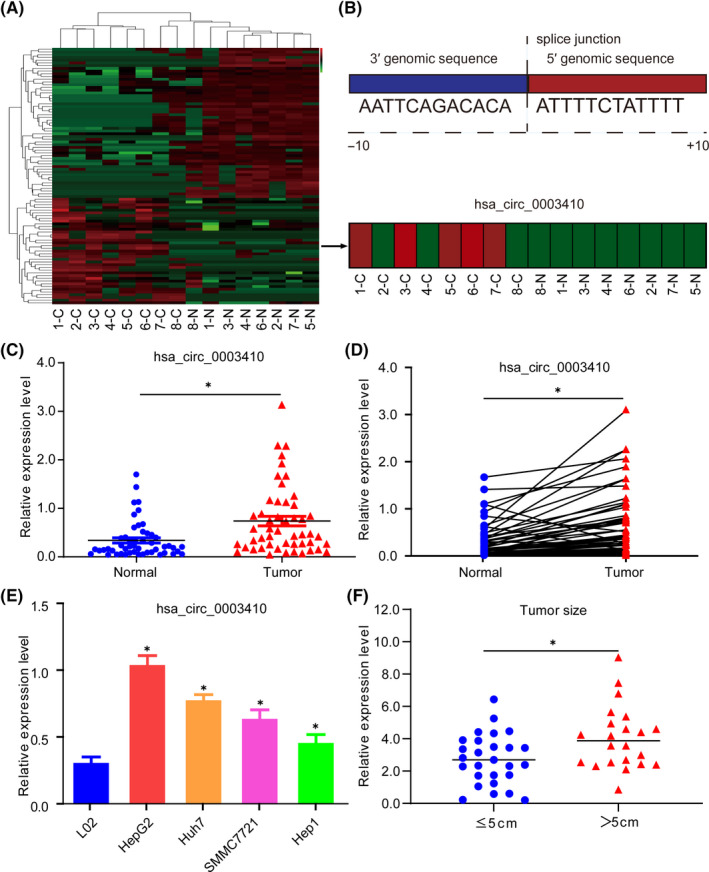
High expression of hsa_circ_0003410 in HCC and its correlation with clinical features. A, Expression profile of noncoding RNA in 8 paired HCC tissues by high‐throughput sequencing. B, Splice junction sequence of hsa_circ_0003410 and its expression in 8 paired HCC tissues. C, D, Relative expression levels of hsa_circ_0003410 in 50 paired HCC tissues. E, Relative expression levels of hsa_circ_0003410 in HCC cell lines. F, Relationship between hsa_circ_0003410 expression and tumor size
Subsequently, we analyzed the correlations between the expression level of hsa_circ_0003410 and HCC clinicopathological characteristics and found that the expression of hsa_circ_0003410 was downregulated more significantly when the tumor size was ≤5 cm compared with when it was >5 cm (P = .011; Figure 1F). However, the survival rate was not significant between hsa_circ_0003410 high and low expression groups (P = .13).
3.2. hsa_circ_0003410 promotes HCC cell proliferation and migration in vitro
First, the cyclization of hsa_circ_0003410 was verified by qRT‐PCR after total RNA extracted from cells was digested with or without RNase (P = .65) (Figure 2A). Next, we wanted to further investigate the biological function of hsa_circ_0003410. The hsa_circ_0003410 siRNA (3410‐siRNA) fragments and overexpression plasmid (3410‐OE) were transfected into HepG2 and Hep1 cells, respectively. The transfection efficiency was confirmed by qRT‐PCR (P < .001) (Figure 2B). CCK‐8 and EdU assays revealed that silencing hsa_circ_0003410 obviously inhibited the proliferation of HCC cells, while its overexpression distinctly promoted cell proliferation (P < .05) (Figure 2C‐E). In addition, a transwell assay was used to evaluate migration. As shown, compared with the NC group, the migration rate of 3410‐siRNA transfected HepG2 cells was significantly lower, while the migration of cells in the 3410‐OE group was promoted (P < .05) (Figure 2F). Therefore, we concluded that hsa_circ_0003410 could strengthen HCC cell proliferation and migration. Additionally, a wound‐healing assay indicated that hsa_circ_0003410 could increase, while inhibition could dramatically decrease, cell proliferation ability (Figure 2G). The results illustrate that hsa_circ_0003410 exerts oncogenic functions in HCC.
FIGURE 2.
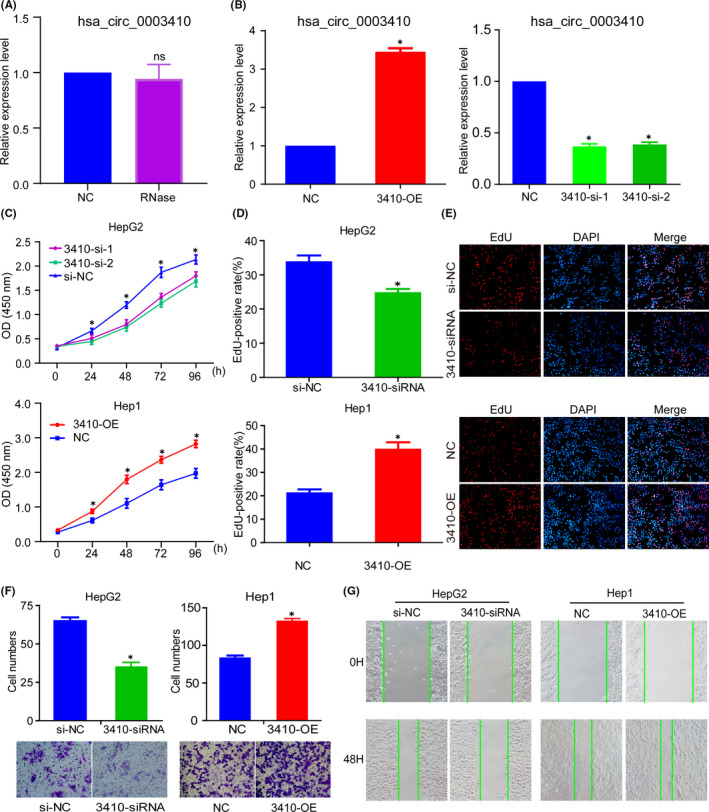
hsa_circ_0003410 promotes HCC cell proliferation and migration. A, Verification of the stability of circular hsa_circ_0003410 after treatment with RNase. B, Verification of HCC cell transfection efficiency by qRT‐PCR. C, CCK‐8 assay was used to detect transfected cells viability. D, E, EdU assay was used to detect cell proliferation ability. F, G, Transwell and wound‐healing assays were used to verify the ability for cell migration
3.3. CCL5 is considered a downstream gene of hsa_circ_0003410
Because of the appreciable effect of hsa_circ_0003410 on HCC cells, we next wanted to identify target mRNAs with altered expression in HCC cells after hsa_circ_0003410 expression was changed. We then constructed a 3410‐siRNA group and an si‐NC group with HepG2 cells. After transfection for 48 h, qRT‐PCR verified the reduction of hsa_circ_0003410 (P = .0005) (Figure 3A). Then, using high‐throughput next‐generation sequencing, we obtained a total of 1380 differential genes including 997 downregulated and 383 upregulated genes (Figure 3B,C). KEGG and Gene Ontology (GO) enrichment analyses showed that the differentially expressed genes were mainly enriched in the immune response pathway (Figure 3D,E), indicating that hsa_circ_0003410 may play a major role in the HCC immune microenvironment. Previous studies have shown that the tumor necrosis factor (TNF) signaling pathway plays an important role in the progression of HCC, 27 and KEGG analysis also showed a similar effect after hsa_circ_0003410 knockdown (P = .0046); therefore, we started with the TNF signaling pathway. There were 17 differentially expressed genes in the regulatory pathway and, after preliminary screening, IRF1, CCL5, CASP7, and FOS met our experimental expectations, with CCL5 (chemokine (C–C motif) ligand 5) showing the most significant changes (P < .001; Figure 3F). To verify CCL5 expression in cells, we performed qRT‐PCR analysis of the hsa_circ_0003410 overexpression group and found that CCL5 expression also showed a significant upward trend (P < .001; Figure 3F). We also found that the mRNA expression of the parental gene UBAP2 was positively regulated by hsa_circ_0003410 (P < .001). Studies have found that a circRNA can regulate the expression of its parental gene through a ceRNA mechanism, 28 so we speculated that hsa_circ_0003410 regulated UBAP2 expression through a ceRNA network, which needed further verification. Given that KEGG analysis revealed the role of hsa_circ_0003410 in the immune response, CCL5 was eventually selected as the target gene. TCGA database analysis also showed that CCL5 was upregulated in HCC (Figure 3G). Consistently, overexpression of CCL5 was verified in HCC cells (P < .001) (Figure 3H). These experiments further confirmed that CCL5 is likely to be a feasible downstream target gene of hsa_circ_0003410.
FIGURE 3.
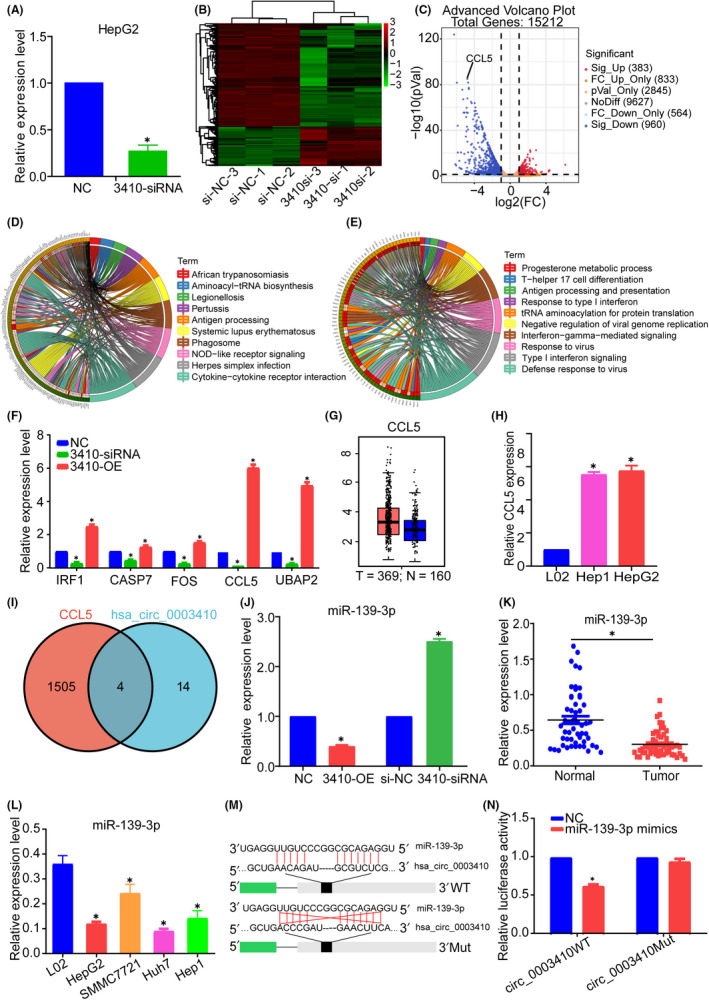
Identification of hsa_circ_0003410 target gene CCL5 by next‐generation sequencing and determination of miR‐139‐3p. A, KO efficiency verification of sequencing cells. B, C, Heatmap and volcanic plot of differentially expressed genes between si‐NC and 3410‐si groups. D, E, KEGG and GO enrichment analysis of differentially expressed genes. F, Expression changes in key genes after hsa_circ_0003410 overexpression or KO. G, CCL5 expression in TCGA database. H, CCL5 expression in HCC cell lines. I, Venn diagram of common miRNA prediction of CCL5 and hsa_circ_0003410. J, Relative expression of miR‐139‐3p after hsa_circ_0003410 overexpression or KO. K, L, miR‐139‐3p expression levels in HCC tissues and cell lines. M, N, Dual‐Luciferase Reporter Assay verification of the combination of hsa_circ_0003410 and miR‐139‐3p
3.4. Bioinformatics to predict hsa_circ_0003410 targets the miR‐139‐3p
To elucidate the ceRNA pathway of hsa_circ_0003410 and CCL5 mRNA, we used the online site CircInteractome to predict the downstream miRNAs that may bind to hsa_circ_0003410, and 18 target miRNAs were obtained. Similarly, we obtained 1509 possible miRNAs from the miRWalk website that may bind to CCL5.
After intersecting the data, we obtained 4 miRNAs, miR‐139‐3p, miR‐623, miR‐767‐3p, and miR‐885‐5p, which were selected for subsequent detection (Figure 3I). First, our sequencing results showed that miR‐139‐3p was downregulated in HCC but not the other 3 miRNAs. To verify the specific relationships between hsa_circ_0003410 and the target miRNAs, qRT‐PCR verified the negative relationship between hsa_circ_0003410 and miR‐139‐3p (P < .005; Figure 3J). We also checked miR‐139‐3p expression in HCC tissues and cell lines and found that it was downregulated (P < .01) (Figure 3K,L). Subsequently, a luciferase reporter assay indicated that miR‐139‐3p mimics decreased the luciferase activity in the hsa_circ_0003410WT group (P < .005) (Figure 3M,N). We performed qRT‐PCR detection of immunoprecipitated complexes containing biotinylated miR‐139‐3p and successfully detected the enrichment of hsa_circ_0003410 (P < .001; Figure 4A). As expected, hsa_circ_0003410 may regulate the immune response to HCC through the ceRNA pathway.
FIGURE 4.
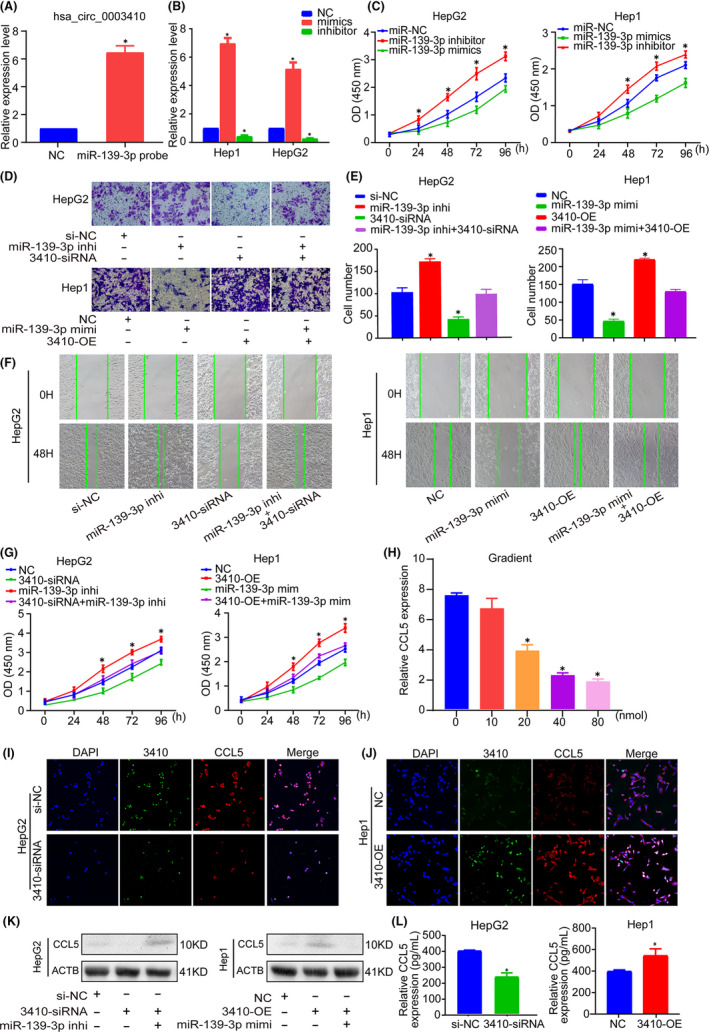
miR‐139‐3p can reverse the carcinogenic effects of hsa_circ_0003410. A, RNA pull‐down verifies the interaction between hsa_circ_0003410 and miR‐139‐3p. B, Transfection efficiency of miR‐139‐3p mimics or inhibitor. C, miR‐139‐3p inhibited HCC cell viability. D‐G, miR‐139‐3p could inhibit cell proliferation and migration ability and reverse the oncogenic effect of hsa_circ_0003410. H, miR‐139‐3p inhibited CCL5 expression as shown by concentration gradient experiment. I, J, RNA‐FISH of hsa_circ_0003410 and CCL5 in HCC cells. K, CCL5 protein expression detected by western blot in HCC cells. L, Secreted CCL5 protein level detected by ELISA
3.5. hsa_circ_0003410 promotes HCC proliferation and migration by sponging miR‐139‐3p and upregulating CCL5 expression
To further verify the functional affiliation of miR‐139‐3p and hsa_circ_0003410 in HCC, we performed a series of functional experiments.
First, the transfection efficiency of miR‐139‐3p was detected (P < .005; Figure 4B). A functional CCK‐8 assay showed that overexpression of hsa_circ_0003410 increased Hep1 cell proliferation and viability, but these effects could be reversed by miR‐139‐3p mimics; similarly, the suppressive effect of hsa_circ_0003410 knockdown was also reversed by a miR‐139‐3p inhibitor (P < .05; Figure 4C). Transwell and wound‐healing assays showed that miR‐139‐3p inhibited cell proliferation and migration and could reverse the biological function of hsa_circ_0003410 in cell viability (P < .05; Figure 4D‐G). Moreover, we performed a concentration gradient experiment and found that, as the miR‐139‐3p concentration increased, the CCL5 mRNA expression level gradually decreased (P < .005; Figure 4H). A subsequent FISH also verified that high expression of hsa_circ_0003410 led to an increase in CCL5 mRNA, while hsa_circ_0003410 downregulation led to the opposite result (Figure 4I,J). Western blot verified that CCL5 protein levels were positively regulated by hsa_circ_0003410 and the reduction in CCL5 protein expression caused by 3410‐siRNA could be rescued by the miR‐139‐3p inhibitor (Figure 4K). ELISA analysis showed that 3410‐OE could promote CCL5 secretion (P = .016), whereas 3410‐siRNA inhibited CCL5 secretion (P = .0004) (Figure 4L). Therefore, we concluded that miR‐139‐3p is a significant noncoding RNA in HCC progression.
3.6. CCL5 recruits M2 macrophages to promote further HCC deterioration
CCL5/RANTES is a member of the CC motif chemokine family, and usually functions as an oncogene by binding to its receptor CCR5; it contributes to increasing tumor growth, inducing extracellular matrix (ECM) remodeling, recruiting immune cell, and polarizing macrophages. 29 , 30 , 31 Considering the enrichment of the immune pathway found by next‐generation sequencing and the positive effect of macrophages in HCC, 32 we were eager to determine whether CCL5 could have a considerable effect on macrophages in HCC. Transwell co‐culture assays revealed that recombinant human CCL5 protein could facilitate the macrophage migration, while CCR5 retardant MVC could inhibit its migration ability, also hsa_circ_0003410 knockdown in HCC cells inhibited macrophages migration (Figure 5A). Our western blot result showed that rcCCL5 increased CCR5 expression while MVC decreased it (Figure S1), indicating that CCR5 was a major CCL5 receptor on macrophages, qRT‐PCR verified that CCL5 mainly activated and recruited M2 macrophages (P < .005), increasing the ratio of M2/M1 macrophages (Figure 5B). Moreover, flow cytometry verified that CCL5 could activate M1 and M2 macrophages but mainly M2 macrophages (Figures 5C and S2). An IF experiment verified that CCL5 and the M2 macrophage marker CD206 showed good expression correlation in HCC specimens, while it was not evident for the M1 marker CD16 (Figure 5D,E).
FIGURE 5.
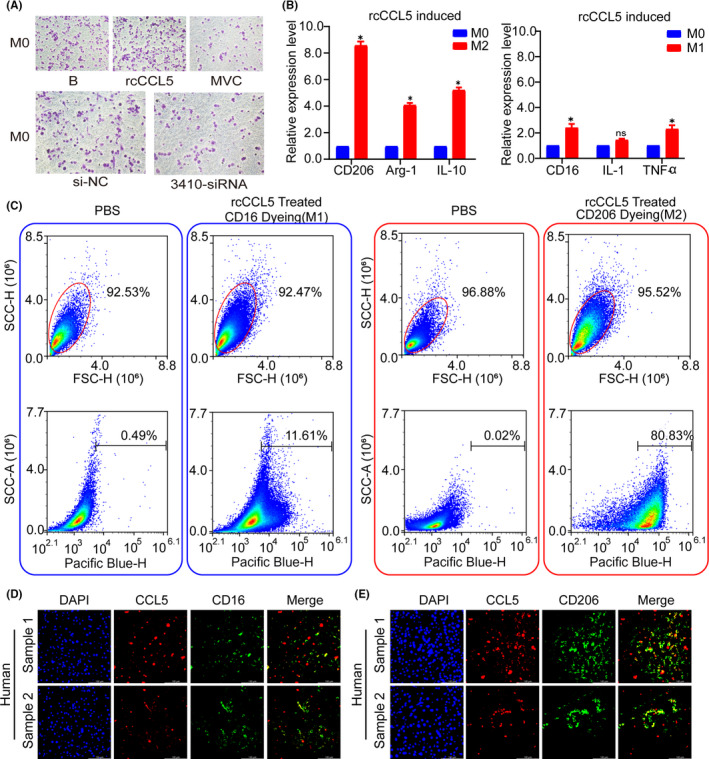
CCL5 promotes M2 macrophages recruitment and increases the ratio of M2/M1 macrophages. A, Transwell assay reveals the migration ability of macrophages. B, Relative expression of M1 and M2 macrophage markers. C, Flow cytometry analysis of the expression of M1 and M2 macrophage surface markers. D, E, IF staining of CCL5 and M1/M2 macrophage markers in HCC specimens
3.7. hsa_circ_0003410 promotes HCC tumor growth and M2 macrophage polarization in vivo via a ceRNA network
We next investigated the significance of hsa_circ_0003410 silencing or overexpression in HCC growth in vivo. We found that the tumor volume in the 3410‐siRNA group was greatly decreased compared with that in the 3410‐OE group (P < .005; Figure 6A), and similar results were found for tumor weight (P < .005; Figure 6B). An IF assay revealed a positive expression correlation between CCL5 and the M2 macrophage marker CD206 (Figure 6C,D). qRT‐PCR confirmed that hsa_circ_0003410 showed a positive relationship with CCL5 (P < .005; Figure 6E). In summary, these results demonstrated that hsa_circ_0003410 regulates the recruitment of macrophages by CCL5 in vivo to promote HCC tumor growth (Figure 6F).
FIGURE 6.
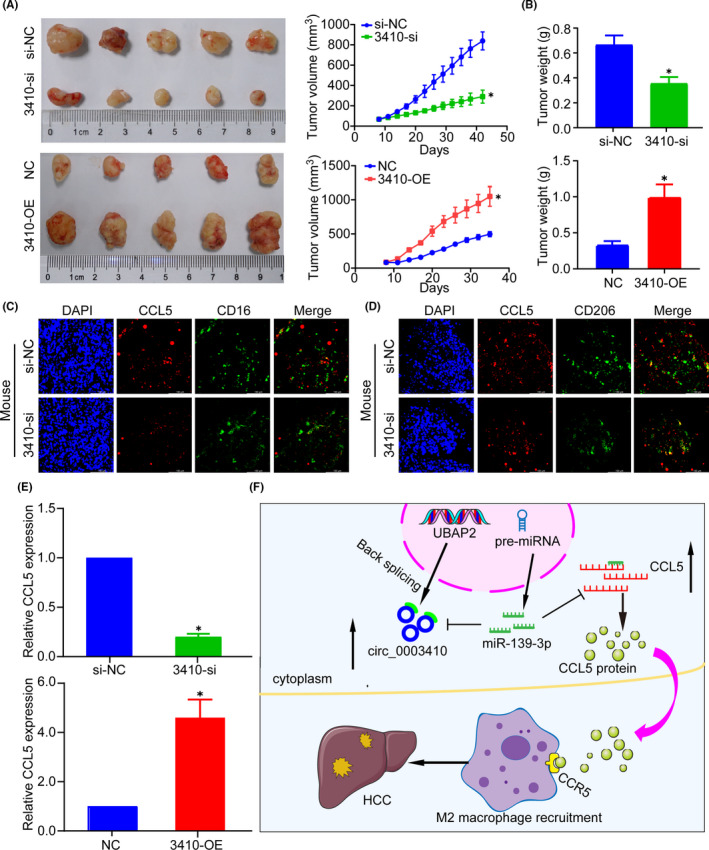
hsa_circ_0003410 promotes tumor formation and M2 macrophage recruitment in vivo. A, B, Tumor volume and weight detection after hsa_circ_0003410 overexpression or KO. C, D, IF staining of CCL5 and M1/M2 macrophage markers in mouse tumors. E, Positive expression of hsa_circ_0003410 and CCL5 in mouse tumors. F, Mechanism of hsa_circ_0003410 regulating macrophage expression through ceRNA
4. DISCUSSION
Hepatocellular carcinoma, which has high mortality, is one of the prevalent malignant cancers in the world. Because the liver is the main detoxification organ, the general state of HCC patients in the later period is usually poor. Generally, high frequencies of metastasis and recurrence are the main reasons for the disappointing mortality rate of HCC patients. 33 Currently, clinical interventions for HCC patients mainly include embolization chemotherapy and transhepatic artery occlusion. 34 The main treatments for patients are surgical, such as liver resection and transplantation, 35 as well as neoadjuvant therapies and emerging immunotherapies. 36 , 37 However, these measures fall far short of producing satisfactory results. Currently, the molecular mechanism of HCC is not completely clear. Therefore, precise molecular mechanisms for HCC need further research.
Only ~2% of the human genome encodes proteins. 38 In the past, studies on cancer have mainly focused on coding RNAs, such as the well studied genes p53 39 and NF‐κB. 40 Recently, we found that noncoding RNAs, which were previously considered to be waste products of transcription, constituted vital components of the human transcriptome and could effectively promote tumor metastasis, 41 cancer development, 11 and the tumor immune microenvironment. 42 Many studies have shown the relationship between noncoding RNAs and HCC. For example, circHMGCS1 competes endogenously with miR‐503‐5p to promote glutaminolysis and hepatoblastoma cell proliferation. 43 In addition, recent studies have found that noncoding RNAs can also encode proteins. 44 Whether there is a similar role in HCC remains to be explored. Here, using high‐throughput sequencing, we found that noncoding RNAs do have significant expression differences in HCC tissues. We ultimately selected the upregulated circular RNA hsa_circ_0003410 as the research object and found that the expression level of hsa_circ_0003410 was significantly negatively correlated with that of miR‐139‐3p. KEGG analysis of miR‐139‐3p targets revealed it could regulate a variety of biological activities (Figure S3). By next‐generation sequencing, KEGG and GO analyses revealed that hsa_circ_0003410 mainly regulated the immune pathway. CCL5 has multiple biological functions in the cancer response, however its function in HCC is still controversial. As a chemokine, CCL5 can promote tumor metastasis and inflammation by coordinating monocytes and T cells to induce damage 45 or by recruiting macrophages. It can also promote the expression of survival factors in breast cancer 46 and induce an immunosuppressive effect on the microenvironment, so we speculated that the high expression of hsa_circ_0003410 in HCC directly promoted the inflammatory response mediated by CCL5. Given that macrophages are an essential immune cell type and that CCL5 has pivotal roles in macrophage recruitment and polarization, 47 , 48 , 49 we further investigated the connection between CCL5 and macrophages in HCC and were surprised to find that CCL5 could recruit M2 macrophages to promote the development of HCC, which was consistent with the findings in previous studies. 50 , 51
Previously, we have been at a loss regarding approaches for cancer treatments, such as therapies for HCC. Due to metastasis and deterioration, patients are already in an advanced cancer stage when symptoms appear. Presently, the treatment of HCC has achieved gratifying benefits, but the battle against HCC requires further efforts and more effective diagnostic and treatment methods are worth finding. Given that hsa_circ_0003410 has such a notable inflammatory effect in HCC, we speculate that it can be used as a new target for immunotherapy to cure HCC and benefit patients.
Researchers at Harvard University found that, in the early stage of zebrafish embryo formation, a short Toddler peptide produced by an lncRNA played a role in a G protein‐coupled receptor activating factor to promote gastrula formation. 52 We believe that there are still many interesting molecular biological mechanisms in HCC waiting to be mined.
CONFLICT OF INTEREST
All the other authors have no conflicts of interest to disclose.
AUTHOR CONTRIBUTIONS
Xiaofeng Xue and Lei Qin contributed to the conception and design of the article. Pei Cao, Bo Ma, Weigang Zhang, and Lei Qin contributed to the acquisition of the data. Pei Cao and Bo Ma contributed to the implementation of the experiments. Weigang Zhang, Junyi Qiu, and Ding Sun contributed to the acquisition of specimens. Pei Cao and Bo Ma contributed to the bioinformatics analysis. Xiaofeng Xue, Pei Cao, Bo Ma, and Junyi Qiu contributed to the analysis and interpretation of the data. Xiaofeng Xue and Pei Cao contributed to the writing, review, and revision of the paper.
Supporting information
Fig S1
Fig S2
Fig S3
Tables S1‐S2
Supplementary Material
ACKNOWLEDGMENTS
The authors thank GenePharma (Suzhou, China) for technical support and equipment employment. We thank Zhi Cao, Yubin Zhao, Rongkuan Hu, and Xiangyong Chen for theoretical guidance. Also we thank Hong Zhou and Pengcheng Cao for experimental skills. We appreciate the Animal Experiment Center of Soochow University for Animal Welfare. The authors declare no competing financial interests.
Cao P, Ma B, Sun D, et al. hsa_circ_0003410 promotes hepatocellular carcinoma progression by increasing the ratio of M2/M1 macrophages through the miR‐139‐3p/CCL5 axis. Cancer Sci.2022;113:634–647. doi: 10.1111/cas.15238
Pei Cao and Bo Ma contributed equally to this work.
Funding information
This research was supported by the Youth Science Foundation of National Natural Science Foundation of China (No. 81802365).
Contributor Information
Lei Qin, Email: qinlei@suda.edu.cn.
Xiaofeng Xue, Email: xfxue@suda.edu.cn.
REFERENCES
- 1. Forner A, Reig M, Bruix J. Hepatocellular carcinoma. Lancet. 2018;391(10127):1301‐1314. [DOI] [PubMed] [Google Scholar]
- 2. Yang JD, Hainaut P, Gores GJ, Amadou A, Plymoth A, Roberts LR. A global view of hepatocellular carcinoma: trends, risk, prevention and management. Nat Rev Gastroenterol Hepatol. 2019;16(10):589‐604. [DOI] [PMC free article] [PubMed] [Google Scholar]
- 3. Llovet JM, Burroughs A, Bruix J. Hepatocellular carcinoma. Lancet. 2003;362(9399):1907‐1917. [DOI] [PubMed] [Google Scholar]
- 4. Siegel RL, Miller KD, Jemal A. Cancer statistics, 2017. CA Cancer J Clin. 2017;67(1):7‐30. [DOI] [PubMed] [Google Scholar]
- 5. Luo P, Wu S, Yu Y, et al. Current status and perspective biomarkers in AFP negative HCC: towards screening for and diagnosing hepatocellular carcinoma at an earlier stage. Pathol Oncol Res. 2020;26(2):599‐603. [DOI] [PubMed] [Google Scholar]
- 6. Heo C‐K, Hwang H‐M, Lee H‐J, et al. Serum anti‐EIF3A autoantibody as a potential diagnostic marker for hepatocellular carcinoma. Sci Rep. 2019;9(1):11059. [DOI] [PMC free article] [PubMed] [Google Scholar]
- 7. Liu D, Mewalal R, Hu R, Tuskan GA, Yang X. New technologies accelerate the exploration of non‐coding RNAs in horticultural plants. Hortic Res. 2017;4:17031. [DOI] [PMC free article] [PubMed] [Google Scholar]
- 8. Memczak S, Jens M, Elefsinioti A, et al. Circular RNAs are a large class of animal RNAs with regulatory potency. Nature. 2013;495(7441):333‐338. [DOI] [PubMed] [Google Scholar]
- 9. Lei M, Zheng G, Ning Q, Zheng J, Dong D. Translation and functional roles of circular RNAs in human cancer. Mol Cancer. 2020;19(1):30. [DOI] [PMC free article] [PubMed] [Google Scholar]
- 10. Xu H, Guo S, Li W, Yu P. The circular RNA Cdr1as, via miR‐7 and its targets, regulates insulin transcription and secretion in islet cells. Sci Rep. 2015;5:12453. [DOI] [PMC free article] [PubMed] [Google Scholar]
- 11. Chen J, Li Y, Zheng Q, et al. Circular RNA profile identifies circPVT1 as a proliferative factor and prognostic marker in gastric cancer. Cancer Lett. 2017;388:208‐219. [DOI] [PubMed] [Google Scholar]
- 12. Liang W‐C, Wong C‐W, Liang P‐P, et al. Translation of the circular RNA circβ‐catenin promotes liver cancer cell growth through activation of the Wnt pathway. Genome Biol. 2019;20(1):84. [DOI] [PMC free article] [PubMed] [Google Scholar]
- 13. Guo H, Ingolia NT, Weissman JS, Bartel DP. Mammalian microRNAs predominantly act to decrease target mRNA levels. Nature. 2010;466(7308):835‐840. [DOI] [PMC free article] [PubMed] [Google Scholar]
- 14. Hendrickson DG, Hogan DJ, McCullough HL, et al. Concordant regulation of translation and mRNA abundance for hundreds of targets of a human microRNA. PLoS Biol. 2009;7(11):e1000238. [DOI] [PMC free article] [PubMed] [Google Scholar]
- 15. Bartel DP. MicroRNAs: target recognition and regulatory functions. Cell. 2009;136(2):215‐233. [DOI] [PMC free article] [PubMed] [Google Scholar]
- 16. Liu B, Li J, Cairns MJ. Identifying miRNAs, targets and functions. Brief Bioinform. 2014;15(1):1‐19. [DOI] [PMC free article] [PubMed] [Google Scholar]
- 17. Stavast CJ, Erkeland SJ. The non‐canonical aspects of microRNAs: many roads to gene regulation. Cells. 2019;8(11):1465. [DOI] [PMC free article] [PubMed] [Google Scholar]
- 18. Wang Z, Yao H, Lin S, et al. Transcriptional and epigenetic regulation of human microRNAs. Cancer Lett. 2013;331(1):1‐10. [DOI] [PubMed] [Google Scholar]
- 19. Tacke F. Targeting hepatic macrophages to treat liver diseases. J Hepatol. 2017;66(6):1300‐1312. [DOI] [PubMed] [Google Scholar]
- 20. Krenkel O, Tacke F. Liver macrophages in tissue homeostasis and disease. Nat Rev Immunol. 2017;17(5):306‐321. [DOI] [PubMed] [Google Scholar]
- 21. Qian B‐Z, Pollard JW. Macrophage diversity enhances tumor progression and metastasis. Cell. 2010;141(1):39‐51. [DOI] [PMC free article] [PubMed] [Google Scholar]
- 22. Harikumar KB, Yester JW, Surace MJ, et al. K63‐linked polyubiquitination of transcription factor IRF1 is essential for IL‐1‐induced production of chemokines CXCL10 and CCL5. Nat Immunol. 2014;15(3):231‐238. [DOI] [PMC free article] [PubMed] [Google Scholar]
- 23. Yu‐Ju WUC, Chen C‐H, Lin C‐Y, et al. CCL5 of glioma‐associated microglia/macrophages regulates glioma migration and invasion via calcium‐dependent matrix metalloproteinase 2. Neuro Oncol. 2020;22(2):253‐266. [DOI] [PMC free article] [PubMed] [Google Scholar]
- 24. Mohs A, Kuttkat N, Reißing J, et al. Functional role of CCL5/RANTES for HCC progression during chronic liver disease. J Hepatol. 2017;66(4):743‐753. [DOI] [PubMed] [Google Scholar]
- 25. Ponziani FR, Bhoori S, Castelli C, et al. Hepatocellular carcinoma is associated with gut microbiota profile and inflammation in nonalcoholic fatty liver disease. Hepatology. 2019;69(1):107‐120. [DOI] [PubMed] [Google Scholar]
- 26. Sadeghi M, Lahdou I, Oweira H, et al. Serum levels of chemokines CCL4 and CCL5 in cirrhotic patients indicate the presence of hepatocellular carcinoma. Br J Cancer. 2015;113(5):756‐762. [DOI] [PMC free article] [PubMed] [Google Scholar]
- 27. Ding J, Huang S, Wang Y, et al. Genome‐wide screening reveals that miR‐195 targets the TNF‐α/NF‐κB pathway by down‐regulating IκB kinase alpha and TAB3 in hepatocellular carcinoma. Hepatology. 2013;58(2):654‐666. [DOI] [PubMed] [Google Scholar]
- 28. Kong P, Yu Y, Wang L, et al. circ‐Sirt1 controls NF‐κB activation via sequence‐specific interaction and enhancement of SIRT1 expression by binding to miR‐132/212 in vascular smooth muscle cells. Nucleic Acids Res. 2019;47(7):3580‐3593. [DOI] [PMC free article] [PubMed] [Google Scholar]
- 29. Tyner JW, Uchida O, Kajiwara N, et al. CCL5‐CCR5 interaction provides antiapoptotic signals for macrophage survival during viral infection. Nat Med. 2005;11(11):1180‐1187. [DOI] [PMC free article] [PubMed] [Google Scholar]
- 30. Long H, Xie R, Xiang T, et al. Autocrine CCL5 signaling promotes invasion and migration of CD133+ ovarian cancer stem‐like cells via NF‐κB‐mediated MMP‐9 upregulation. Stem Cells. 2012;30(10):2309‐2319. [DOI] [PubMed] [Google Scholar]
- 31. Suffee N, Hlawaty H, Meddahi‐Pelle A, et al. RANTES/CCL5‐induced pro‐angiogenic effects depend on CCR1, CCR5 and glycosaminoglycans. Angiogenesis. 2012;15(4):727‐744. [DOI] [PubMed] [Google Scholar]
- 32. Tian X, Wu Y, Yang Y, et al. Long noncoding RNA LINC00662 promotes M2 macrophage polarization and hepatocellular carcinoma progression via activating Wnt/β‐catenin signaling. Mol Oncol. 2020;14(2):462‐483. [DOI] [PMC free article] [PubMed] [Google Scholar]
- 33. Han D, Li J, Wang H, et al. Circular RNA circMTO1 acts as the sponge of microRNA‐9 to suppress hepatocellular carcinoma progression. Hepatology. 2017;66(4):1151‐1164. [DOI] [PubMed] [Google Scholar]
- 34. Roche A. Therapy of HCC–TACE for liver tumor. Hepatogastroenterology. 2001;48(37):3‐7. [PubMed] [Google Scholar]
- 35. Pinna AD, Yang T, Mazzaferro V, et al. Liver transplantation and hepatic resection can achieve cure for hepatocellular carcinoma. Ann Surg. 2018;268(5):868‐875. [DOI] [PubMed] [Google Scholar]
- 36. Ruiz de Galarreta M, Bresnahan E, Molina‐Sánchez P, et al. β‐Catenin activation promotes immune escape and resistance to anti‐PD‐1 therapy in hepatocellular carcinoma. Cancer Discov. 2019;9(8):1124‐1141. [DOI] [PMC free article] [PubMed] [Google Scholar]
- 37. Llovet JM, Montal R, Sia D, Finn RS. Molecular therapies and precision medicine for hepatocellular carcinoma. Nat Rev Clin Oncol. 2018;15(10):599‐616. [DOI] [PMC free article] [PubMed] [Google Scholar]
- 38. Yan X, Hu Z, Feng Y, et al. Comprehensive genomic characterization of long non‐coding RNAs across human cancers. Cancer Cell. 2015;28(4):529‐540. [DOI] [PMC free article] [PubMed] [Google Scholar]
- 39. Amelio I, Melino G. The p53 family and the hypoxia‐inducible factors (HIFs): determinants of cancer progression. Trends Biochem Sci. 2015;40(8):425‐434. [DOI] [PubMed] [Google Scholar]
- 40. De Simone V, Franzè E, Ronchetti G, et al. Th17‐type cytokines, IL‐6 and TNF‐α synergistically activate STAT3 and NF‐kB to promote colorectal cancer cell growth. Oncogene. 2015;34(27):3493‐3503. [DOI] [PMC free article] [PubMed] [Google Scholar]
- 41. Houseley J, Rubbi L, Grunstein M, Tollervey D, Vogelauer M. A ncRNA modulates histone modification and mRNA induction in the yeast GAL gene cluster. Mol Cell. 2008;32(5):685‐695. [DOI] [PMC free article] [PubMed] [Google Scholar]
- 42. Li B, Zhu L, Lu C, et al. circNDUFB2 inhibits non‐small cell lung cancer progression via destabilizing IGF2BPs and activating anti‐tumor immunity. Nat Commun. 2021;12(1):295. [DOI] [PMC free article] [PubMed] [Google Scholar]
- 43. Zhen N, Gu S, Ma J, et al. CircHMGCS1 promotes hepatoblastoma cell proliferation by regulating the IGF signaling pathway and glutaminolysis. Theranostics. 2019;9(3):900‐919. [DOI] [PMC free article] [PubMed] [Google Scholar]
- 44. Nelson BR, Makarewich CA, Anderson DM, et al. A peptide encoded by a transcript annotated as long noncoding RNA enhances SERCA activity in muscle. Science. 2016;351(6270):271‐275. [DOI] [PMC free article] [PubMed] [Google Scholar]
- 45. Warburg O. On the origin of cancer cells. Science. 1956;123(3191):309‐314. [DOI] [PubMed] [Google Scholar]
- 46. Murooka TT, Rahbar R, Fish EN. CCL5 promotes proliferation of MCF‐7 cells through mTOR‐dependent mRNA translation. Biochem Biophys Res Commun. 2009;387(2):381‐386. [DOI] [PubMed] [Google Scholar]
- 47. Walens A, DiMarco AV, Lupo R, Kroger BR, Damrauer JS, Alvarez JV. CCL5 promotes breast cancer recurrence through macrophage recruitment in residual tumors. Elife. 2019;8:e43653. [DOI] [PMC free article] [PubMed] [Google Scholar]
- 48. Nie Y, Huang H, Guo M, et al. Breast phyllodes tumors recruit and repolarize tumor‐associated macrophages via secreting CCL5 to promote malignant progression, which can be inhibited by CCR5 inhibition therapy. Clin Cancer Res. 2019;25(13):3873‐3886. [DOI] [PubMed] [Google Scholar]
- 49. Keophiphath M, Rouault C, Divoux A, Clément K, Lacasa D. CCL5 promotes macrophage recruitment and survival in human adipose tissue. Arterioscler Thromb Vasc Biol. 2010;30(1):39‐45. [DOI] [PubMed] [Google Scholar]
- 50. Li X, Yao W, Yuan Y, et al. Targeting of tumour‐infiltrating macrophages via CCL2/CCR2 signalling as a therapeutic strategy against hepatocellular carcinoma. Gut. 2017;66(1):157‐167. [DOI] [PubMed] [Google Scholar]
- 51. Yin Z, Ma T, Lin Y, et al. IL‐6/STAT3 pathway intermediates M1/M2 macrophage polarization during the development of hepatocellular carcinoma. J Cell Biochem. 2018;119(11):9419‐9432. [DOI] [PubMed] [Google Scholar]
- 52. Pauli A, Norris ML, Valen E, et al. Toddler: an embryonic signal that promotes cell movement via Apelin receptors. Science. 2014;343(6172):1248636. [DOI] [PMC free article] [PubMed] [Google Scholar]
Associated Data
This section collects any data citations, data availability statements, or supplementary materials included in this article.
Supplementary Materials
Fig S1
Fig S2
Fig S3
Tables S1‐S2
Supplementary Material


