Abstract
P53 and DNA damage‐regulated gene1 (PDRG1) is overexpressed in diverse carcinomas. Here, we discover that PDRG1 is overexpressed in glioblastoma multiforme (GBM). However, the clinical significance, biological role, and underlying molecular mechanisms of PDRG1 in GBM remain unclear. PDRG1 was aberrantly overexpressed in glioma, especially prevalent in GBM, and correlated with poor clinicopathologic features of glioma. The risk score, operational feature curve analysis, Kaplan‐Meier curve, and univariate and multivariate Cox regression analysis indicated that PDRG1 was an independent prognostic indicator and significantly correlates with disease progression of glioma. A prognostic nomogram was constructed to predict the survival risk of individual patients. The function and pathway enrichment analysis of PDRG1 in The Cancer Genome Atlas cohort was performed. PDRG1 knockdown significantly inhibited the migration and proliferation of GBM cells in vitro and in vivo. Transcriptome sequencing analysis of PDRG1 knockdown U‐118 MG(U118) cells indicated that biological regulation adhesion, growth and death, cell motility, cell adhesion molecular and proteoglycans in cancer were significantly enriched. Importantly, we found that the expression of adhesion molecule cluster of differentiation 44 (CD44) was regulated by PDRG1 in GBM. We found that PDRG1 promoted the migration and proliferation of GBM cells via the mitogen‐activated protein kinase kinase (MEK)/extracellular regulated protein kinase (ERK)/CD44 pathway. Our findings provide proof that PDRG1 upregulation predicts progression and poor prognosis in human gliomas, especially in isocitrate dehydrogenase (IDH) wt glioma patients. The study provides new evidence that PDRG1 regulates the expression of CD44 in GBM cells and might promote the migration and proliferation via the MEK/ERK/CD44pathway. PDRG1 might be a novel diagnostic indicator and promising therapeutic target for GBM.
Keywords: Extracellular regulated protein kinase, Glioblastoma multiforme, migration, P53 and DNA damage‐regulated gene1, proliferation
Our study provides the evidence that aberrantly expressed P53 and DNA damage‐regulated gene1 (PDRG1) might be a negative prognosticator in glioma. We characterized the roles of PDRG1 in proliferation and migration of GBM cells, and delineated the underlying molecular mechanism that PDRG1 functions via the MEK/extracellular regulated protein kinase/cluster of differentiation 44 pathway. Our data provide evidence that PDRG1 might serve as a valuable prognostic marker. Inhibition of PDRG1 may be a plausible strategy for the development of the target therapy of glioma.
Abbreviations
- CD44
cluster of differentiation 44
- CGGA
Chinese Glioma Genome Atlas
- DEG
differentially expressed genes
- DMEM
Dulbecco's modification of Eagle's medium
- MEK
mitogen‐activated protein kinase kinase
- ERK
extracellular regulated protein kinase
- FBS
fetal bovine serum
- GBM
glioblastoma multiforme
- GO
Gene Ontology
- GSEA
Gene Set Enrichment Analysis
- GTEx
genotype‐tissue expression
- HE
hematoxylin and eosin
- IDH
isocitrate dehydrogenase
- ECM
extracellular matrix
- IHC
immunohistochemistry
- AUC
area under curve
- KEGG
Kyoto Encyclopedia of Genes and Genomes
- MAPK
mitogen‐activated protein kinase
- PDRG1
P53 and DNA damage‐regulated gene1
- PI3K
phosphatidylinositol 3‐kinase
- Q‐PCR
quantitative real‐time PCR
- RNA‐seq
RNA sequencing
- ROC
receiver operational feature curve
- TCGA
The Cancer Genome Atlas
- WHO
World Health Organization
1. INTRODUCTION
GBM is the most prevalent and lethal primary brain tumor in adults with particularly poor prognosis. 1 , 2 Currently, multimodal treatments like maximal surgical resection, radiotherapy, and adjuvant chemotherapy of temozolomide are considered to be the best available therapeutic approach. 3 However, the median overall survival time of GBM patients is still 12‐15 months. Recurrence and death in patients with GBM are predominantly attributed to the highly invasiveness, chemo‐resistance and relapse‐prone behavior. 4 To date, we lack an effective treatment regimen for patients with GBM. It is therefore urgent that we find the cellular and molecular mechanism of GBM development and discover promising molecular markers for diagnosis, prognosis, and potential therapeutic targets.
PDRG1 was first considered to be differentially regulated by ultraviolet radiation and tumor suppressor p53. 5 It was found to be upregulated in multiple cancers, including lung cancer, ovarian cancer, colorectal cancer, breast cancer, and esophagus cancer. 6 The results of functional experiments in tumor cells indicated that PDRG1 was associated with cellular progress, such as DNA damage repair, radiation‐resistance, cell cycle, and programmed cell death. 7 PDRG1 knockdown markedly suppressed the growth of human colon cancer cells, 6 and participated in the radiation‐resistance of lung cancer cells 8 and nasopharyngeal carcinoma cells. 9 However, the expression, clinical significance, biological roles, and molecular mechanisms of PDRG1 in GBM remain unknown.
CD44, a transmembrane glycoprotein, is the receptor for the ECM, such as hyaluronic acid, osteopontin, collagens, and matrix metalloproteinases and others. 10 With elevated expression in many types of cancer, CD44 is a marker of cancer stem cells and plays an important role in cell‐cell interactions, cell adhesion, and migration. 11 Aberrantly expressed CD44 promotes the stemness, proliferation, migration, invasion, epithelial‐mesenchymal transition, and chemotherapy resistance of GBM cells. 12 , 13 , 14 , 15 CD44 facilitates the development of cancer through activating central key signaling pathways, including the renin‐angiotensin system (RAS)/MAPK/ERK, Rho Rho guanosine triphosphate hydrolases (GTPases), and PI3K/protein kinase B (AKT) pathways. 16 , 17 As one distinctive MAPK cascade, the MAPK/ERK cascade is primarily described as a transducer of extracellular signals and it participates in the regulation of several fundamental processes such as proliferation, migration, metabolism, differentiation, and angiogenesis. 18 , 19 , 20
Here, we focus on the expression, clinical significance, biological roles, and underlying molecular mechanisms of PDRG1 in GBM. Our findings may provide a basis for the development of novel diagnostic and therapeutic targets for GBM.
2. MATERIALS AND METHODS
2.1. Human tissue and clinical analysis
Glioma tissues (n = 96) were obtained from the Department of Pathology of the Affiliated Hospital of Xuzhou Medical University between 2016 and 2017. All specimens were identified by pathologists according to the 2016 World Health Organization (WHO) classification criteria. Ethical approval for this study was obtained from the Institutional Ethics Committee of the Affiliated Hospital of Xuzhou Medical University (No. XYFY2018‐KL056‐01). RNA sequencing (RNA‐seq) data of gliomas were collected from the Chinese Glioma Genome Atlas (CGGA) database (batch Ⅰ, n = 413; batch Ⅱ, n = 273) and The Cancer Genome Atlas (TCGA) database (n = 703) and the Genotype‐Tissue Expression (GTEx) database (n = 1152). After incomplete data (grade, overall survival, IDH mutation status, 1p/19q codeletion status, O6‐methylguanine‐DNA methyltransferase promoter methylation status) were deleted, 413 glioma tissues of dataset batch Ⅰ and 273 glioma tissues of batch Ⅱ from the CGGA were used to analyze overall survival and expression.
2.2. Cell culture
The human GBM cell lines (U87, U118, U251, LN229, and T98G) were cultured in Dulbecco's modification of Eagle's medium (DMEM, Keygen Biotech) supplemented with 10% fetal bovine serum (FBS; Life Technologies). The Committee of Type Culture Collection of the Chinese Academy of Sciences provided short tandem repeat DNA fingerprinting for GBM cell lines identity confirmation in August 2018.
2.3. Cell proliferation assay
Cell viability was evaluated by cell proliferation assay using the Cell Counting Kit‐8 (DOJINDO) as previously described. 21 A microplate reader was used to measure the absorbance value at a wavelength of 450 nm.
2.4. Transwell assay and wound healing assay
Transwell assay was performed as previously described. 22 Detailed descriptions of the methods are provided in Appendix S1.
2.5. Immunoblot
The collected cells were lysed in RIPA buffer and the concentration of protein was detected by BCA Protein Assay Kit. The lysates were separated by SDS‐PAGE gel and transferred onto nitrocellulose membranes (Millipore). The information for primary antibodies is showed in Table S1. Membranes were incubated with horseradish peroxidase‐conjugated secondary antibody and proteins were detected by enhanced chemiluminescence reagent.
2.6. Quantitative real‐time PCR
Trizol reagent (Invitrogen) was used for extracting total RNA according to the manufacturer's instructions. cDNA was synthesized from RNA by reverse transcription reagent kit (Vazyme Biotech) and SYBR Green Master Mix (Takara) was used. The primer sequences are shown in Table S2.
2.7. Stable cell lines construction and cell transfection
The shRNA lentiviral for PDRG1 was packed and verified by Genechem. Lentivirus‐based vector was constructed for PDRG1 overexpression by Genechem. The CD44 siRNA and scramble sequence were both purchased from Ribobio. Detailed descriptions of the methods are provided in Appendix S1.
2.8. RNA‐sequence and bioinformatics analysis
Total RNA of PDRG1 silenced U118 was extracted by Trizol reagent (Invitrogen) and sequenced using Illumina HiSeq2500 by Gene Denovo Biotechnology Co. RNA sequencing data were deposited in the Sequence Read Archive (https://www.ncbi.nlm.nih.gov/sra) under the accession numbers SRR14209303, SRR14209302, SRR14209307, SRR14209305, SRR14209304, and SRR14209306. Detailed descriptions of bioinformatics analysis are provided in Appendix S1.
2.9. Glioblastoma xenografts and in vivo imaging system
All animal work was approved by the Laboratory Animal Ethics Committee of Xuzhou Medical University (No. 202012A064). Detailed descriptions of the methods are provided in Appendix S1.
2.10. Histology and IHC analysis
Brain tissues of mice were fixed in 4% paraformaldehyde and embedded in paraffin. HE and IHC were performed as per the standard laboratory protocols. Detailed descriptions of the methods are provided in Appendix S1.
2.11. Luciferase activity assay
To address the mechanism of ERK1/2 regulation of CD44 in glioma cells, we used PDRG1 knockdown and negative control U118 cells for CD44 promoter activity analysis. Meanwhile, wildtype U118 and 293T cells were used for the analysis of the effect of ERK1/2 on CD44 promoter activity treated with MEK inhibitor U0126 (S1901; Beyotime Biotechnology) or ERK activator C6 ceramide (860506P; Sigma). Different groups of cell lines were seeded in 96‐well plates and were co‐transfected with pGL3‐CD44 promoter (19 122; Addgene) and pGL3‐TR (Promega). After transfection, cells were treated with U0126 (10 and 20 µM) or ceramide C6 (10 µg/mL) for 16 hours before being lysed. The control groups were set accordingly. CD44 luciferase activity was evaluated by the Dual Luciferase Assay System (Promega) after transfection for 48 hours.
2.12. Statistical analyses
Statistical analyses were performed on GraphPad Prism 7.0 (Graphpad Software Inc) and SPSS16.0 software (SPSS 16.0, SPSS Inc). Statistical acquired from TCGA were merged and conducted by R(3.6.3). The correlation analysis was evaluated by chi‐square (χ 2) test, Pearson correlation or Spearman correlation analysis. Survival analyses were performed by the Kaplan‐Meier method. The Student's t test was used to determine the statistical significance of differences between groups and the differences between more than two groups were analyzed by one‐way ANOVA and the Kruskal‐Wallis test. A P value <.05 was considered statistically significant: *P <0.05, **P < 0.01, ***P < 0.001, ****P <0.0001. More descriptions of the methods are provided in Appendix S1.
3. RESULTS
3.1. PDRG1 was aberrantly overexpressed in GBM and correlated with poor clinicopathologic features of glioma
The gene expression profile demonstrated that PDRG1 is overexpressed in diverse carcinomas, especially GBM (Figure 1A,B). Bioinformatic analyses from the CGGA database (Figure 1C,D) and TCGA dataset (Figure 1E) showed obviously elevated PDRG1 expression in high grade glioma, especially in GBM. Several molecular markers have been widely used in the diagnosis and prognosis evaluation of glioma, especially IDH genotype and 1p/19q codeletion. 23 The mRNA expression of PDRG1 was enriched in the IDH wt (Figure 1F‐H) or 1p/19q non‐codeletion (Figure 1I‐K) cases, which also indicated a glioma‐promoting role of PDRG1. As demonstrated in Table 1 from the TCGA dataset, PDRG1 overexpression was markedly associated with the WHO grade, IDH genotype, 1p/19q codeletion, and age (all P < 0.001). The clinical significance of PDRG1 was further investigated in clinical pathologic specimens by IHC in 96 glioma tissues and 27 para‐tumor tissues. As shown in Figure 1L,O, PDRG1 expression was elevated in glioma tissue in contrast to para‐tumor tissue. Correlation of PDRG1 staining with clinicopathologic parameters showed elevated expression of PDRG1 in high‐grade glioma, especially GBM (Figure 1M,N and Table 2), which was consistent with the results of analysis in TCGA dataset (Table 1). In addition, we found that the protein level of PDRG1 was higher in P53 mutate glioma than P53 wildtype glioma (Figure S1A,B). These findings suggest that PDRG1 is significantly upregulated in GBM and involved in the development and malignant phenotype of glioma.
FIGURE 1.
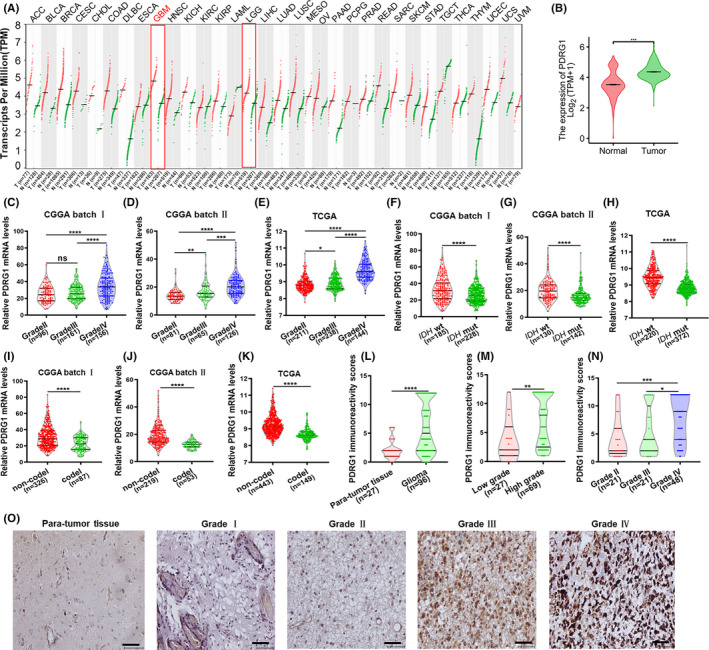
PDRG1 was aberrantly overexpressed in GBM. A, The dot plot shows the gene expression profile across all tumor samples and paired normal tissues from the Gene Expression Profiling Interactive Analysis web server. B, PDRG1 mRNA levels were analyzed in gliomas and normal brain tissue from TCGA database (n = 703), GTEx database (n = 1152), CGGA database batch I (C), CGGA batch Ⅱ (D), and TCGA database (E). PDRG1 expression in different IDH genotype of gliomas from CGGA batch (F, G) and TCGA database (H). PDRG1 expression in different 1p/19q status of glioma from CGGA (I, J) and TCGA database (K). L, PDRG1 immunoreactivity was scored and analyzed in human para‐tumor tissue and glioma tissue groups. M, PDRG1 immunoreactivity score was statistically analyzed in low‐grade and high‐grade glioma tissues. N, PDRG1 immunoreactivity score was statistically analyzed in grade Ⅱ, grade Ⅲ, and grade Ⅳ glioma tissues. O, Representative IHC images of PDRG1 in human para‐tumor tissue and glioma tissues. Scale bars, 50 μm. Error bars, SD
TABLE 1.
Association between PDRG1 mRNA expression and the clinical parameters of glioma patients in TCGA
| Characteristic | Low PDRG1 | High PDRG1 | P |
|---|---|---|---|
| WHO grade, n (%) | <0.001 | ||
| G2 | 165 (26%) | 59 (9.3%) | |
| G3 | 137 (21.6%) | 106 (16.7%) | |
| G4 | 13 (2%) | 155 (24.4%) | |
| IDH status, n (%) | <0.001 | ||
| WT | 46 (6.7%) | 200 (29.2%) | |
| Mut | 298 (43.4%) | 142 (20.7%) | |
| 1p/19q codeletion, n (%) | <0.001 | ||
| Codel | 143 (20.8%) | 28 (4.1%) | |
| Non‐codel | 205 (29.8%) | 313 (45.4%) | |
| Age, median (IQR) | 39 (32, 51.25) | 52.5 (38.75, 62) | <0.001 |
Abbreviations: WHO, World Health Organization; IQR, interquartile range; IDH, isocitrate dehydrogenase.
TABLE 2.
PDRG1 IHC staining and clinicopathological characteristics of 96 glioma patients
| Variable | Number (n) | PDRG1 IHC staining | |||
|---|---|---|---|---|---|
| Low (%) | High (%) | Χ 2 | P | ||
| Sex | 1.099 | 0.294 | |||
| Male | 59 | 32 (54.2) | 27 (45.8) | ||
| Female | 37 | 16 (43.2) | 21 (56.8) | ||
| Age | 0.677 | 0.411 | |||
| <50 years | 42 | 23 (54.8) | 19 (45.2) | ||
| ≥50 years | 54 | 25 (46.3) | 29 (53.7) | ||
| Tumor size | 3.270 | 0.071 | |||
| <5 cm | 31 | 19 (61.3) | 12 (38.7) | ||
| ≥5 cm | 29 | 11 (37.9) | 18 (62.1) | ||
| WHO grade | 8.709 | 0.003 | |||
| Low (Ⅰ‐Ⅱ) | 27 | 20 (74.1) | 7 (25.9) | ||
| High (Ⅲ‐Ⅳ) | 69 | 28 (40.6) | 41 (59.4) | ||
3.2. PDRG1 is an independent prognostic indicator and significantly correlates with disease progression of glioma
Glioma patients were divided into high‐risk and low‐risk groups according to the cutoff value of the median risk score. The results demonstrated that poorer prognosis and more death occurred in the high‐risk group than in the low‐risk group (Figure 2A). We conducted ROC analysis of PDRG1 gene expression data to evaluate the diagnostic value. As shown in Figure 2B, the area under curve (AUC) value was 0.813. Timed dependent AUC values of 0.751, 0.816, and 0.795 were obtained for the 1‐year, 3‐year, and 5‐year survival rates, respectively (Figure 2C). The results indicate the high diagnostic value of PDRG1 expression in glioma. Overall survival analysis in diverse datasets showed PDRG1 was negatively correlated with the prognosis of glioma (Figure 2D‐F). Highly expressed PDRG1 was also significantly associated with the disease‐specific survival and progress‐free interval of glioma patients in TCGA dataset (Figure 2G‐H). We also performed the survival analysis of GBM in CGGA batch 1, batch 2, and TCGA. We found there was statistically significance in CGGA batch 2 while there was no significance in CGGA batch 1 and TCGA, although there was a tendency of high PDRG1 predicting a poorer prognosis in GBM (Figure S1C‐E). In addition, patients with PDRG1 elevated expression in the IDH wt group had a poorer prognosis, which indicates that PDRG1 expression may have a role in the evaluation of prognosis of IDH wt glioma cases (Figure 2J‐K).
FIGURE 2.
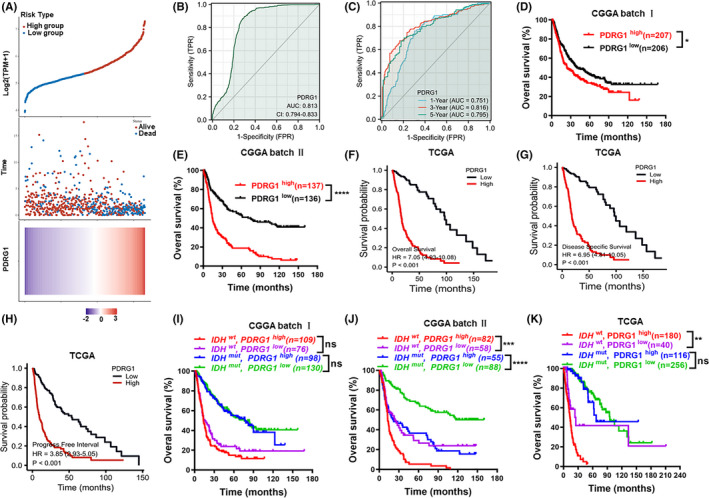
PDRG1 is a negative prognosticator for survival in glioma. A, Risk score distribution, survival overview, and heatmap for patients in TCGA cohorts assigned to high‐ and low‐risk groups based on the risk score. B, ROC curve of PDRG1 expression in the glioma cohort. C, Timed dependent ROC curve of PDRG1 expression in the glioma cohort. Overall survival analysis in datasets from CGGA and TCGA databases (D‐F). High levels of PDRG1 mRNA are associated with the poor prognosis of patients. Disease‐specific survival analysis (G) and progress‐free intervals (H) in datasets from TCGA database. Survival analysis of PDRG1 mRNA expression and IDH gene status in CGGA and TCGA databases (I‐K). Error bars, SD
To further assess the prognostic significances of risk signature and clinicopathologic characteristics in TCGA cohort, we performed univariate and multivariate Cox regression analysis. Both univariate Cox regression and multivariate Cox regression analysis demonstrated that PDRG1 expression, WHO grade, and age were correlated with the overall survival of glioma patients (Figure 3A,B). The outcomes strongly indicated that PDRG1 was an independent prognostic factor.
FIGURE 3.
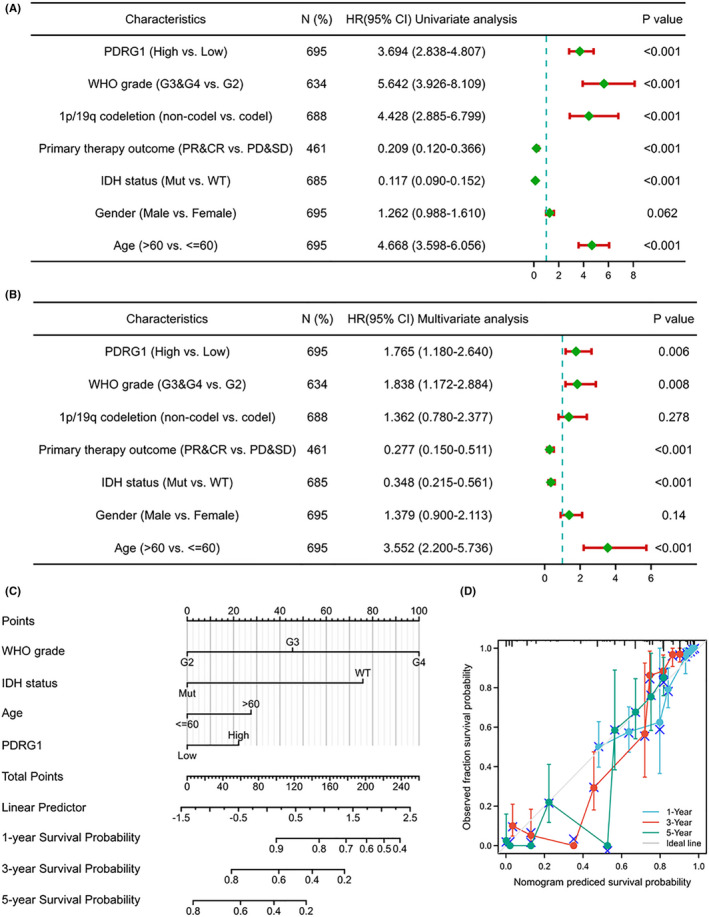
Univariate/multivariate Cox proportional hazards analysis and nomogram for predicting the probability of 1‐, 3‐, and 5‐year overall survival for glioma patients. Forest plot showed the univariate (A) and multivariate (B) Cox regression model of prognosis for PDRG1 in the TCGA cohort. (C) Nomogram for predicting the probability of patients with 1‐, 3‐, and 5‐year overall survival. (D) Calibration curves of the prognostic nomogram on consistency between predicted and observed 1‐, 3‐, and 5‐year survival
To provide a quantitative analysis tool that can predict the survival risk of individual patients, a prognostic nomogram was constructed. A worse prognosis was represented by a higher total number of points on the nomogram (Figure 3C). The deviation correction line in the calibration curves of the prognostic nomogram was close to the ideal curve calibration, which showed good consistency between predictive and actual 1‐, 3‐, and 5‐year survival in the entire TCGA cohort (Figure 3D).
3.3. Function and pathway enrichment analysis of PDRG1 in glioma
The heat maps of the top 25 genes positively and negatively associated with PDRG1, respectively (Figure 4A). To analyze the biological function of PDRG1 in glioma, Gene Ontology (GO) enrichment, Kyoto Encyclopedia of Genes and Genomes (KEGG) pathway, and GSEA analysis were performed. The results revealed that PDRG1 co‐expressed genes were mainly enriched in regulation of cell cycle, cell cycle checkpoint, recombinational repair, mitotic nuclear division, double‐strand break repair, cell adhesion molecule binding, damaged DNA binding, and other biological processes or molecular functions (Figure 4B‐D). GSEA was performed and fceri_mediated_MAPK_activation, cell cycle, and DNA repair pathways were significantly enriched (Figure 4E). KEGG pathway analysis showed that PDRG1 co‐expressed genes were enriched in pathways of cell cycle, focal adhesion, cellular senescence, p53 signaling, nucleotide excision repair, and mismatch repair (Figure 4F‐G). These results suggest that PDRG1 might participate in cell cycle, cell migration, or DNA repair in glioma cells.
FIGURE 4.
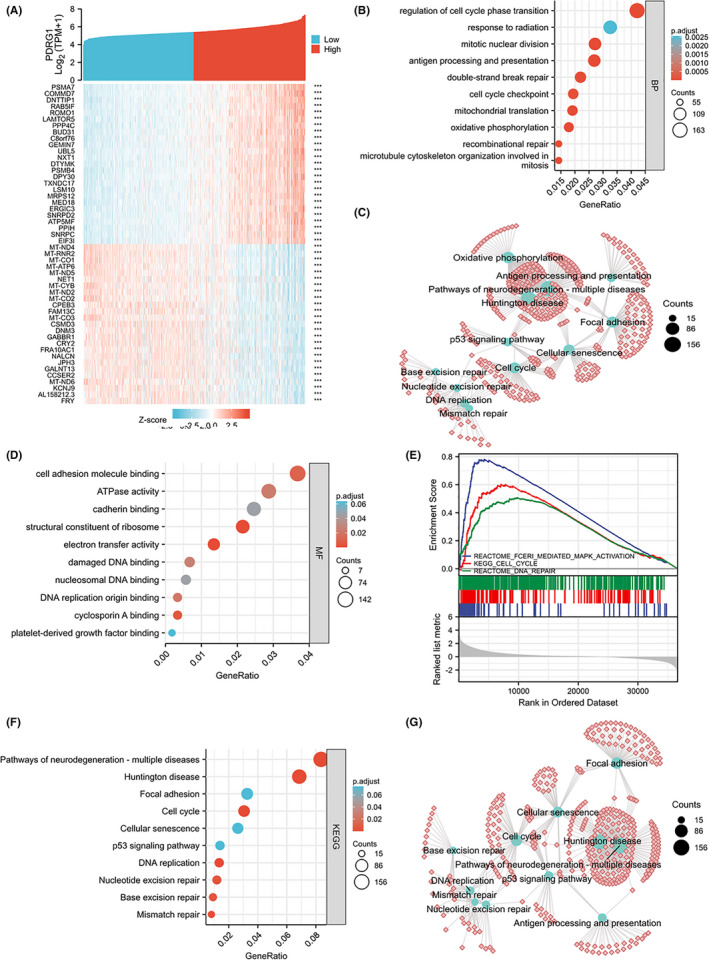
GO, KEGG, and GSEA analysis of PDRG1 in TCGA data. A, The top 25 genes most positively or negatively associated with PDRG1 are shown on a heatmap. B, C, GO enrichment analysis (biological process) of PDRG1 and its co‐expression genes. The GO enriched terms are colored by P value. D, GO enrichment analysis (molecular function) of PDRG1 and its co‐expression genes. GSEA (E) and KEGG pathway enrichment (F, G) analyses were performed
3.4. Knockdown of PDRG1 inhibits proliferation and migration of GBM cells
PDRG1 was highly expressed in these five GBM cell lines (Figure 5A). In view of the expression of PDRG1 in GBM cell lines, TP53 mutate cell lines (U118 and T98G) and TP53 wild type cell lines (U87) were selected in the following experiments. To gain insight into the biological function of PDRG1, PDRG1 was knocked down by shRNA in U118, T98G, and U87 cells (Figures 5B‐E and S2A). PDRG1 knockdown remarkably inhibited the viability (Figure 5F,G) and induced the G1 phase cell cycle arrest (Figure 5H) in U118 and T98G cells. In addition, the migration ability of U118 and T98G cells after knockdown was markedly inhibited, as detected by Transwell assay (Figure 5I,K) and wound healing assay (Figure 5J,L). In U87 cells, PDRG1 knockdown also remarkably inhibited the viability (Figure S2B) and migration ability (Figure S2C‐F), and induced G1 phase cell cycle arrest (Figure S2G,H). These data indicate that PDRG1 promotes the proliferation and migration of GBM cells.
FIGURE 5.
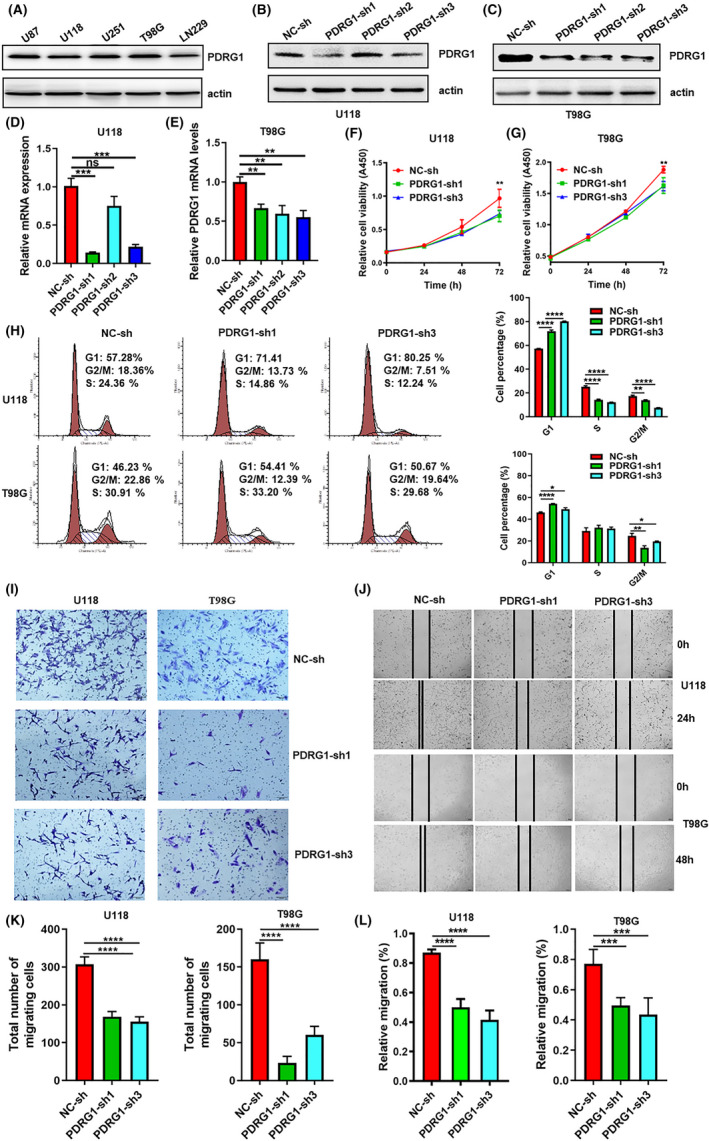
Knockdown of PDRG1 inhibits the proliferation and migration of GBM cells. A, The protein level of PDRG1 in five GBM cell lines was evaluated by immunoblot. Immunoblot assay analyzed the PDRG1 protein level in U118 (B) and T98G (C) cells after PDRG1 silencing. The PDRG1 mRNA level was assessed by Q‐PCR in U118 (D) and T98G cells (E) after PDRG1 silencing. The viability of PDRG1 silenced U118 (F) and T98G (G) in 72 hours after seeding. (H) The cell cycle of PDRG1 silenced U118 and T98G was measured by flow cytometry. The migration ability of PDRG1 silenced U118 and T98G cells was assessed by Transwell assay (I, K) and wound healing assay (J, L). Data represent three independent experiments. Error bars, SD
3.5. PDRG1 silencing obviously inhibited the growth of primary glioma
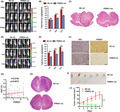
To investigate the in vivo effect of PDRG1 on the growth of intracranial primary glioma in nude mice, we used luciferase‐labeled U118 cells to establish the intracranial glioma model. The in vivo imaging system demonstrated that PDRG1 silencing obviously inhibited the growth of orthotopic glioma (Figure 6A,B). Brain sections from tumor xenografts were stained with HE and PDRG1 knockdown significantly suppressed the growth of orthotopic glioma (Figure 6C). Subcutaneous glioma model also was established and the results confirmed that the growth of the tumor was inhibited by PDRG1 knockdown in vivo (Figure 6D,E). We further analyzed the correlation of PDRG1 with proliferation index Ki67. In the glioma clinical pathologic specimen, PDRG1 was positively correlated with Ki67 (Figure 6G). In the intracranial glioma model, the Ki67 positive rate also decreased in PDRG1 knockdown tumor tissues (Figure 6F). In addition, the decreased expression of PDRG1 in PDRG1 knockdown tumor tissues was confirmed (Figure 6F). Another PDRG1 knockdown GBM cell line (U87) was constructed and used to construct the intracranial and subcutaneous glioma model. The growth of the glioma in the intracranial model was evaluated by HE staining and growth of the tumor in the subcutaneous model was evaluated by volume measuring (Figure 6H‐J). The results were consistent with U118 cells, which indicated that PDRG1 silencing obviously inhibited the growth of primary glioma.
FIGURE 6.
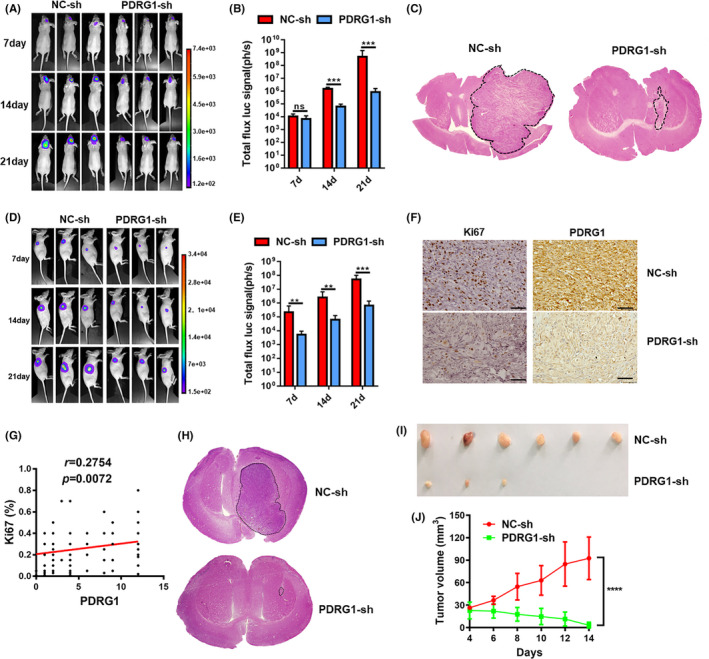
PDRG1 silencing inhibited the growth of primary glioma. Luciferase‐labeled U118 cells were used to establish the intracranial glioma model and tumor growth was recorded in vivo using bioluminescent imaging. Representative bioluminescent images (A) and the quantification (B) of the U118 tumor‐bearing mice on days 7, 14, and 21. The data are shown as mean ± SD (n = 8). (C) Growth of glioma was detected by HE staining after U118 tumor‐bearing mice were sacrificed. Luciferase‐labeled U118 cells were used to establish the subcutaneous glioma model and tumor growth was recorded in vivo using bioluminescent imaging. Representative bioluminescent images (D) and the quantification (E) of the tumor‐bearing mice on days 7, 14, and 21. The data are shown as mean ± SD (n = 6). F, Representative IHC images of the intracranial glioma tissue from U118 tumor‐bearing mice stained by Ki67 and PDRG1. (G) Correlation analysis of PDRG1 and Ki67 expression in 96 glioma clinical specimens. Scale bars, 50 μm. Error bars, SD. H, The growth of the glioma from U87 tumor‐bearing mice was evaluated by HE staining method. I, Representative images of the subcutaneous glioma tissue from U87 tumor‐bearing mice. (n = 6). J, Tumor growth curve of subcutaneous glioma in U87 tumor‐bearing mice
3.6. GO analysis and KEGG pathway analysis of PDRG1‐related genes in GBM
To discover the underlying molecular mechanism of PDRG1 in GBM, RNA‐Seq analysis from negative control and PDRG1 knockdown U118 cells was performed. GO enrichment analysis indicated that the cellular progress, biological regulation, biological regulation adhesion, growth was enriched and the numbers of downregulated genes in PDRG1 knockdown cells were more than upregulated genes (Figure 7A,B). Many common genes enriched in diverse biological processes, such as cell adhesion, cell migration, and regulation of cell motility (Figure 7C). The biological process of analysis is consistent with our previous findings that PDRG1 promoted the proliferation and migration of GBM cells. DEGs were highly enriched in molecular function and cellular components, such as plasmamembrane parts, integrin binding, and cell adhesion molecule binding (Figure 7D,E). The results prompted us to concentrate on the change of expression of cell surface molecules.
FIGURE 7.
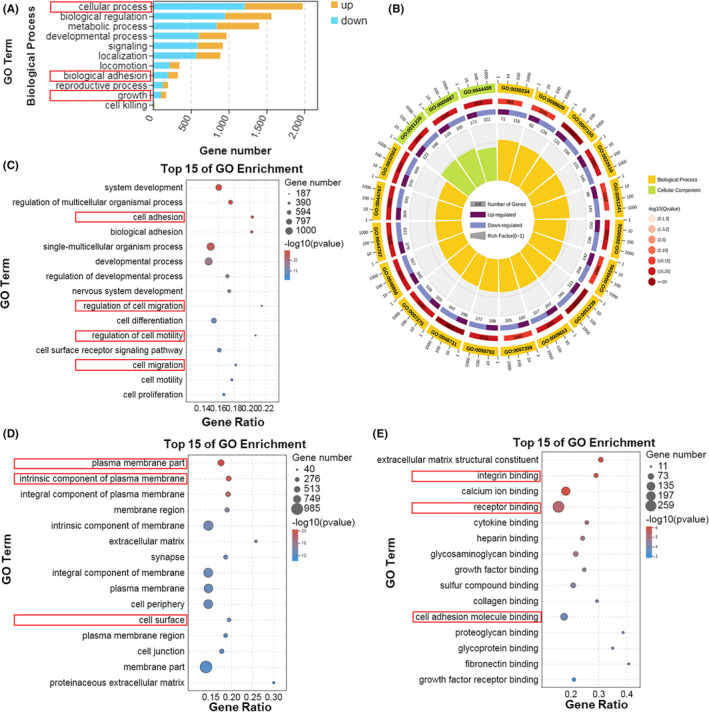
GO enrichment analyses between negative control and PDRG1 knockdown groups. RNA‐Seq analysis from negative control and PDRG1 knockdown U118 cells was performed. A, Summary of the distribution and number of DEGs in the biological process of ontology classes. The x axis shows the gene numbers and the y axis shows the secondary GO terms. B, Enriched circle map showing the GO term analysis. The top 15 enriched GO analyses in three ontology classes, including biological process (C), cellular component (D), and molecular function (E)
KEGG enrichment analysis also identified that cell growth and death, signal transduction, and cell motility were significantly enriched in pathways (Figure 8A). In addition, the data showed that DEGs were significantly enriched in pathways related to cell migration and proliferation, such as ECM‐receptor interaction, cell adhesion molecular, focal adhesion and proteoglycans in cancer (Figure 8B,C).
FIGURE 8.
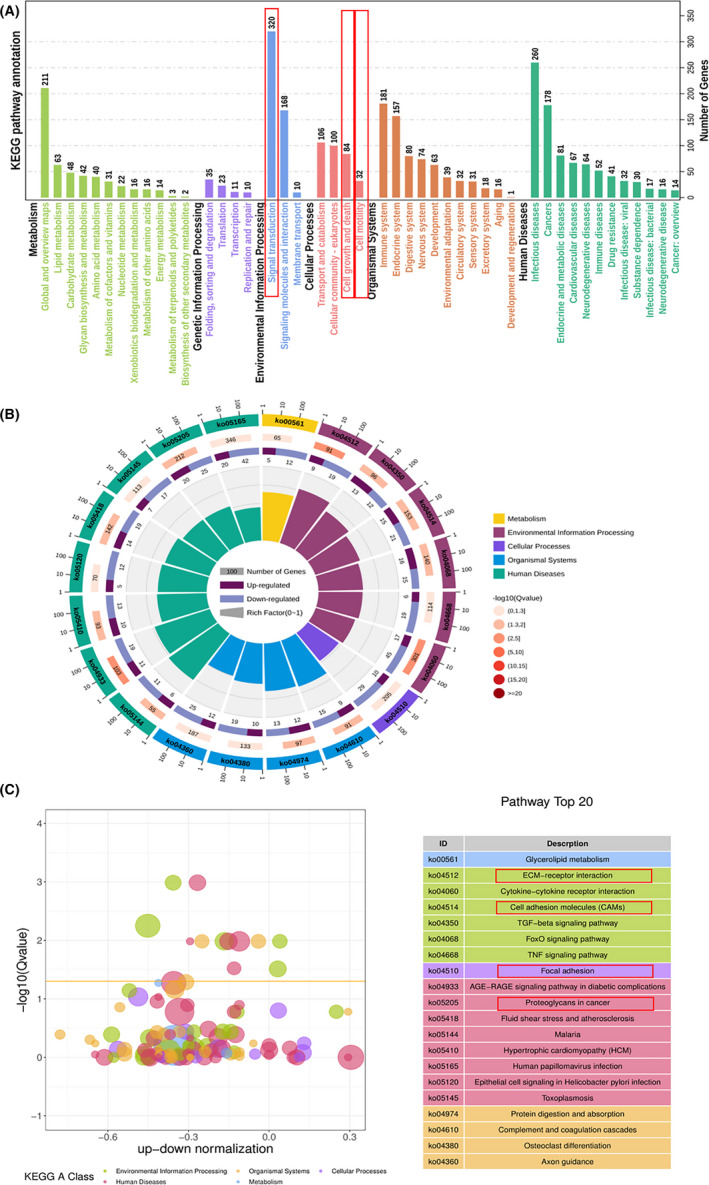
KEGG pathway enrichment analyses between normal and PDRG1 knockdown groups. RNA‐Seq analysis from normal and PDRG1 knockdown U118 cells was performed. A, Enriched circle map showing the KEGG PATHWAY. B, The z‐score bubble chart represents the top 20 enriched KEGG pathways. The x axis shows the −log10 (Q value) and the ratio of up‐down normalization. The yellow line represents the threshold of Q value (0.05). Different colors represent different classes. C, KEGG pathway enrichment analyses show pathways under five classes including the number of genes
3.7. Expression of adhesion molecule CD44 was regulated by PDRG1 in GBM cells
GO and KEGG enrichment analysis indicated that PDRG1 might play an important role in regulating the cell surface molecules involved in ECM‐receptor interaction, cell adhesion, migration, and proteoglycans in cancer. We screened related molecules in the RNA‐Seq results and found the CD44 mRNA level was significantly decreased in PDRG1 knockdown U118 cells (Figure 9A). The total protein and cell surface level of CD44 was reduced in both U118 and T98G cells which PDRG1 knockdown (Figure 9B‐D). In the intracranial glioma model, the protein level of CD44 of tumor tissue was assessed. IHC staining showed a lower protein level of CD44 in the PDRG1 knockdown group than the control group (Figure 9E).
FIGURE 9.
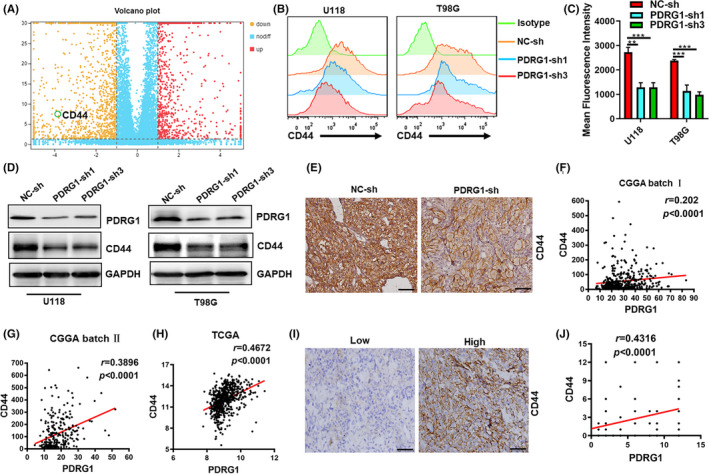
Expression of adhesion molecule CD44 was regulated by PDRG1 in GBM cells. A, Volcano plots show the difference analyses of gene expression between the normal and PDRG1 knockdown groups. Red and yellow points represent up‐ and downregulated genes, respectively. Blue points represent genes with no differently expressing. B, C, The surface expression of CD44 in negative control and PDRG1 knockdown U118 cells and T98G cells was measured by flow cytometry. D, Western blot analysis of the level of CD44 in PDRG1 silenced U118 and T98G cells. E, Luciferase‐labeled U118 cells were used to establish the intracranial glioma model. Representative IHC images of the intracranial glioma tissue stained by CD44. Scale bar, 50 μm. Correlation analysis was performed between PDRG1 and CD44 mRNA level in CGGA (F‐G) and TCGA (H) dataset. I, Immunohistochemistry analyzed the CD44 expression in PDRG1‐high and PDRG1‐low glioma specimens. Scale bar, 50 μm. J, Correlation analysis of the immunostaining scores of PDRG1 with CD44 in human glioma specimens
Bioinformatic analyses of the datasets from the CGGA and TCGA datasets demonstrated that the expression of CD44 was positively correlated with PDRG1 (Figure 9F‐H). The glioma specimens were stratified into two categories, PDRG1‐high and PDRG1‐low groups, based on median PDRG1 immunostaining scores as the cutoff. We found the CD44 expression was elevated in glioma specimens of the PDRG1‐high group and the immunostaining scores of PDRG1 were positive correlated with CD44 (Figure 9I,J).
3.8. PDRG1 promotes the proliferation and migration of GBM cells by the MEK/ERK/CD44 pathway
PDRG1 expression was rescued by PDRG1 overexpression lentivirus in PDRG1 stable knockdown U118 and T98G cells. The expression of CD44 was knocked down by siRNA silencing (Figure 10A). Overexpression of PDRG1 significantly enhanced the protein expression of CD44 (Figure 10A). The results showed that cell proliferation and migration were significantly enhanced after PDRG1 recovery in PDRG1 stable knockdown U118 and T98G cells. However, PDRG1 rescue could not promote the proliferation (Figures 10B and S3A) and migration (Figures 10C‐F and S3B‐E) of U118 and T98G cells which CD44 was silenced. The results indicated that PDRG1 might promote cell proliferation and migration by CD44. As CD44 promoted cell adhesion, migration, survival, and invasion through activation of the downstream MAPK pathways, we assessed the protein level of the MAPK pathways. PDRG1 silencing obviously inhibited the phosphorylation of ERK1/2 in U118 and T98G cells, while no change of total ERK1/2, JNK, P38, phosphorylated P38, and phosphorylated JNK was observed (Figure 10G). The results indicated that PDRG1 might promote GBM cell migration and proliferation by the MEK/ERK pathway.
FIGURE 10.
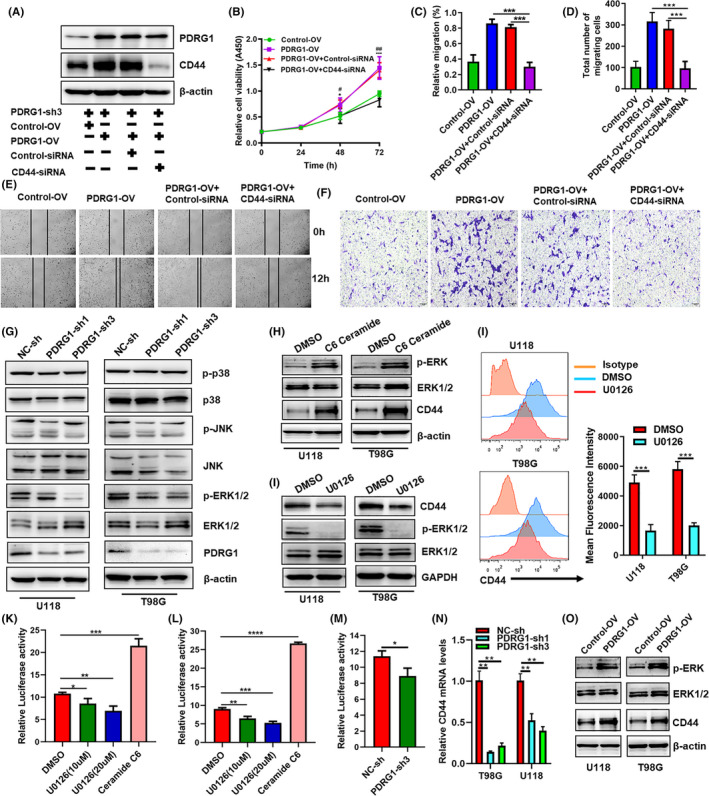
PDRG1 promotes the proliferation and migration of GBM cells by the MEK/ERK/CD44 pathway. A, The PDRG1 stable knockdown U118 cells were transfected with either PDRG1 overexpression lentivirus (PDRG1‐OV) or control lentivirus (Control‐OV). The expression of CD44 was knocked down by siRNA (CD44‐siRNA) silencing. Negative control (Control‐siRNA) was used. Immunoblot assay analyzed the PDRG1and CD44 protein levels. B, The viability of U118 treated as indicated was assessed in 72 hours after seeding. Control‐OV vs PDRG1‐OV (*P < 0.05, ***P <0.001), PDRG1‐OV+Control‐siRNA vs PDRG1‐OV+CD44‐siRNA (#P <0.05, ##P <0.01). The migration ability of U118 and T98G cells treated as indicated was assessed by wound healing assay (C, E) and Transwell assay (D, F). (G) Western blot analysis of the level of p‐ERK1/2, ERK1/2, JNK, P38, p‐P38 and p‐JNK in U118 and T98G cells. (H, I) Cells were treated with MEK inhibitor U0126 or ERK activator C6 ceramide. Western blot analysis of the level of p‐ERK1/2, ERK1/2, and CD44 in U118 and T98G cells. (J) The surface expression of CD44 was measured by flow cytometry. The cells were co‐transfected with indicated CD44 promoter‐luciferase and Renilla plasmids in triplicate. The wildtype 293T (K) and U118 (L) were treated with U0126 or C6 ceramide, and CD44 luciferase activity was evaluated. Luciferase activity was normalized to Renilla activity to control. M, The PDRG1 stable knockdown U118 were transfected with CD44 promoter‐luciferase and Renilla plasmids, CD44 luciferase activity was evaluated. N, q‐PCR analysis of the mRNA level of CD44 in PDRG1 stable knockdown cells. O, Western blot analysis of the level of p‐ERK1/2, ERK1/2, and CD44 in PDRG1 rescued U118 and T98G cells. Data represent one of three independent experiments. Error bars, SD
In oral cavity squamous cell carcinoma, the promoter activity and expression of CD44 were significantly enhanced by ERK1/2 signaling. 24 As shown in Figure 10H, ERK1/2 was activated by an ERK activator C6 ceramide in U118 and T98G cells. The activation of the ERK1/2 pathway enhanced the total protein level of CD44 (Figure 10H). MAPK kinase inhibitor (U0126) markedly reduced the total protein and surface CD44 level in GBM cells with inhibition of ERK1/2 phosphorylation (Figure 10I‐J). These results indicate that the ERK pathway was the upstream that regulated the expression of CD44. To address the mechanism of ERK1/2 regulation of CD44 in GBM cells, CD44 promoter activity analysis was performed. In both 293T and U118 cells, the CD44 promoter activity was markedly decreased by inhibitor (U0126) and significantly enhanced by ERK activator C6 ceramide (Figure 10K,L). PDRG1 knockdown also significantly decreased the CD44 promoter activity and the mRNA expression of CD44 in GBM cells (Figure 10M,N). PDRG1 expression was rescued by PDRG1 overexpression lentivirus in PDRG1 stable knockdown U118 and T98G cells, and PDRG1 rescue enhanced the protein level of phosphorylation of ERK1/2 and CD44. These findings suggest that PDRG1 promotes the proliferation and migration of GBM cells by the MEK/ERK/CD44 pathway.
4. DISCUSSION
The genotypes of IDH and 1p/19q codeletion were first used as molecular parameters in the pathological type of glioma in the WHO 2016 classification of central nervous system tumors due to their significant clinical value. 23 Glioma patients with IDH wt and/or 1p/19q non‐codeletion usually predict a poorer prognosis. No effective therapeutic agents target IDH wt or 1p/19q non‐codeletion GBM. PDRG1 predominantly overexpressed in IDH wt or 1p/19q non‐codeletion GBM, which suggests that PDRG1 is a promising therapeutic target of the poorest GBM. We provide evidence that PDRG1 correlated with the poor prognosis of glioma patients obviously and has a high risk score. Notably, PDRG1 also correlated with poor prognosis of glioma patients in the IDH wt glioma cohort. Therefore, PDRG1 may be used to evaluate the prognosis of patients with IDH wt gliomas. PDRG1 may be a promising and valuable marker in glioma therapy and prognosis evaluation.
Previous study showed that PDRG1 was upregulated by UV but downregulated by P53. Human prostate cancer cell TSUPr1, which harbors the p53 mutate, could upregulate PDRG1 expression. 5 The P53 expression pattern detected by IHC is a moderately sensitive and highly specific marker for p53 gene status (wildtype or mutate). 25 We found that PDRG1 expression was higher in p53 mutate glioma than in p53 wildtype glioma tissues, which provides evidence that PDRG1 expression in glioma is correlated with p53 gene status. As previous studies reported, PDRG1 promotes the proliferation of colorectal cancer cells 6 and esophageal cancer cells in vitro. 26 We manifested PDRG1 functioned as an oncogene in GBM. PDRG1 promoted the proliferation and migration of U118 and T98G cells in vitro and in vivo. Rescued experiment furtherly demonstrated the oncogenic role in GBM of PDRG1. Previous studies did not supply definite clues to the molecular mechanism of PDRG1 function in tumors. Bioinformatic analysis of the transcriptome sequencing of PDRG1 knockdown cells provided information that pathways related to cell migration and proliferation, such as ECM‐receptor interaction, cell adhesion molecular, focal adhesion, and proteoglycans, in cancer were enriched. PDRG1 knockdown significantly inhibited the migration and proliferation of GBM cells in vitro and in vivo, which was consistent with the biological process of bioinformatic analysis.
Among the DEGs, an important oncogene, CD44 expression was downregulated with PDRG1 silencing. In GBM, CD44 is a marker of cancer stem cells and is involved in cell‐cell interactions, stemness, cell adhesion, and migration. 11 Our results demonstrate that the expression of CD44 is regulated by PDRG1 in GBM. Binding with its ligand, CD44 promotes the biological function of various types of cancer, including proliferation, adhesion, invasion, angiogenesis, and metastasis. 27 , 28 CD44 provides a close link between many key pathways and might play a central role in the proliferation and migration regulated by PDRG1 in GBM. The promoter activity and expression of CD44 could be significantly enhanced by ERK1/2 signaling in oral carcinoma cells. 24 We also found that PDRG1 promoted the expression of CD44 by activating the ERK pathway, which enhances the promoter activity of CD44 in GBM cells. Knockdown of CD44 in PDRG1 rescued cells could inhibit the function of PDRG1. Therefore, it is reasonable to believe that PDRG1 promotes the proliferation and migration of GBM cells by the MEK/ERK/CD44 pathway. Meanwhile, CD44 promoted proliferation and migration via the phosphorylation of Erk1/2 in U87 GBM and prostate cancer cells. 29 , 30 Given that ERK1/2 signaling is the downstream pathway of CD44 and the activation of ERK pathway could enhance the promoter activity of CD44, there may be a positive MEK/ERK/ CD44 feedback loop which is regulated by PDRG1 in GBM cells.
In summary, our study provides evidence that aberrantly expressed PDRG1 might be a negative prognosticator in glioma. We characterized the roles of PDRG1 in proliferation and migration of GBM cells, and delineated the underlying molecular mechanism that PDRG1 functions via the MEK/ERK/CD44 pathway. Our data provide evidence that PDRG1 might serve as a valuable prognostic marker. Inhibition of PDRG1 may be a plausible strategy for the development of glioma target therapy.
DISCLOSURE
The authors declare no conflict of interest.
Supporting information
Figure S1‐S3
Table S1
Table S2
Appendix S1
ACKNOWLEDGMENTS
This work is supported by grants from the National Natural Science Foundation of China (82002516), the Natural Science Foundation of Jiangsu Province in China (Grants No BK20190984), and the Natural Science Fund for Colleges and Universities in Jiangsu Province (19KJB310023).
Sun J, Xu Y, Liu J, Cui H, Cao H, Ren J. PDRG1 promotes the proliferation and migration of GBM cells by the MEK/ERK/CD44 pathway. Cancer Sci.2022;113:500–516. doi: 10.1111/cas.15214
REFERENCES
- 1. Lapointe S, Perry A, Butowski NA. Primary brain tumours in adults. Lancet. 2018;392:432‐446. [DOI] [PubMed] [Google Scholar]
- 2. Stupp R, Mason WP, van den Bent MJ, et al. Radiotherapy plus concomitant and adjuvant temozolomide for glioblastoma. New England J Med. 2005;352:987‐996. [DOI] [PubMed] [Google Scholar]
- 3. Körber V, Yang J, Barah P, et al. Evolutionary trajectories of IDH(WT) glioblastomas reveal a common path of early tumorigenesis instigated years ahead of initial diagnosis. Cancer Cell. 2019;35:692‐704 e12. [DOI] [PubMed] [Google Scholar]
- 4. Torre LA, Bray F, Siegel RL, Ferlay J, Lortet‐Tieulent J, Jemal A. Global cancer statistics, 2012. Cancer J Clin. 2015;65(2):87‐108. [DOI] [PubMed] [Google Scholar]
- 5. Luo X, Huang Y, Sheikh MS. Cloning and characterization of a novel gene PDRG that is differentially regulated by p53 and ultraviolet radiation. Oncogene. 2003;22:7247‐7257. [DOI] [PubMed] [Google Scholar]
- 6. Jiang L, Luo X, Shi J, et al. PDRG1, a novel tumor marker for multiple malignancies that is selectively regulated by genotoxic stress. Cancer Biol Ther. 2011;11:567‐573. [DOI] [PMC free article] [PubMed] [Google Scholar]
- 7. Zhang W, Yao F, Zhang H, et al. The potential roles of the apoptosis‐related protein PDRG1 in diapause embryo restarting of Artemia sinica . Int J Mol Sci. 2018;19(1):126. [DOI] [PMC free article] [PubMed] [Google Scholar]
- 8. Tao Z, Chen S, Mao G, Xia H, Huang H, Ma H. The PDRG1 is an oncogene in lung cancer cells, promoting radioresistance via the ATM‐P53 signaling pathway. Biomed Pharm. 2016;83:1471‐1477. [DOI] [PubMed] [Google Scholar]
- 9. Xu T, Xiao D. Oleuropein enhances radiation sensitivity of nasopharyngeal carcinoma by downregulating PDRG1 through HIF1alpha‐repressed microRNA‐519d. J Exp Clin Cancer Res. 2017;36:3. [DOI] [PMC free article] [PubMed] [Google Scholar]
- 10. Naor D, Sionov RV, Ish‐Shalom D. CD44: structure, function, and association with the malignant process. Adv Cancer Res. 1997;71:241‐319. [DOI] [PubMed] [Google Scholar]
- 11. Chen C, Zhao S, Karnad A, Freeman JW. The biology and role of CD44 in cancer progression: therapeutic implications. J Hematol Oncol. 2018;11:64. [DOI] [PMC free article] [PubMed] [Google Scholar]
- 12. Wu G, Song X, Liu J, et al. Expression of CD44 and the survival in glioma: a meta‐analysis. Biosci Rep. 2020;40. [DOI] [PMC free article] [PubMed] [Google Scholar]
- 13. Chen D, Li D, Xu X‐B, et al. Galangin inhibits epithelial‐mesenchymal transition and angiogenesis by downregulating CD44 in glioma. J Cancer. 2019;10:4499‐4508. [DOI] [PMC free article] [PubMed] [Google Scholar]
- 14. Klank RL, Decker Grunke SA, Bangasser BL, et al. Biphasic dependence of glioma survival and cell migration on CD44 expression level. Cell Rep. 2017;18:23‐31. [DOI] [PMC free article] [PubMed] [Google Scholar]
- 15. Lah TT, Novak M, Breznik B. Brain malignancies: glioblastoma and brain metastases. Semin Cancer Biol. 2020;60:262‐273. [DOI] [PubMed] [Google Scholar]
- 16. Al‐Othman N, Alhendi A, Ihbaisha M, Barahmeh M, Alqaraleh M, Al‐Momany BZ. Role of CD44 in breast cancer. Breast Dis. 2020;39:1‐13. [DOI] [PubMed] [Google Scholar]
- 17. Daniel PM, Filiz G, Tymms MJ, et al. Intratumor MAPK and PI3K signaling pathway heterogeneity in glioblastoma tissue correlates with CREB signaling and distinct target gene signatures. Exp Mol Pathol. 2018;105:23‐31. [DOI] [PubMed] [Google Scholar]
- 18. Valis K, Novak P. Targeting ERK‐hippo interplay in cancer therapy. Int J Molec Sci. 2020;21(9):3236. [DOI] [PMC free article] [PubMed] [Google Scholar]
- 19. Papa S, Choy PM, Bubici C. The ERK and JNK pathways in the regulation of metabolic reprogramming. Oncogene. 2019;38:2223‐2240. [DOI] [PMC free article] [PubMed] [Google Scholar]
- 20. Lu S, Jang H, Gu S, Zhang J, Nussinov R. Drugging Ras GTPase: a comprehensive mechanistic and signaling structural view. Chem Soc Rev. 2016;45:4929‐4952. [DOI] [PMC free article] [PubMed] [Google Scholar]
- 21. Liu Y, Liu R, Yang F, et al. miR‐19a promotes colorectal cancer proliferation and migration by targeting TIA1. Mol Cancer. 2017;16:53. [DOI] [PMC free article] [PubMed] [Google Scholar]
- 22. Niu Y, Ma F, Huang W, et al. Long non‐coding RNA TUG1 is involved in cell growth and chemoresistance of small cell lung cancer by regulating LIMK2b via EZH2. Mol Cancer. 2017;16:5. [DOI] [PMC free article] [PubMed] [Google Scholar]
- 23. Louis DN, Perry A, Reifenberger G, et al. The 2016 World Health Organization classification of tumors of the central nervous system: a summary. Acta Neuropathol. 2016;131:803‐820. [DOI] [PubMed] [Google Scholar]
- 24. Judd NP, Winkler AE, Murillo‐Sauca O, et al. ERK1/2 regulation of CD44 modulates oral cancer aggressiveness. Can Res. 2012;72:365‐374. [DOI] [PMC free article] [PubMed] [Google Scholar]
- 25. Takami H, Yoshida A, Fukushima S, et al. Revisiting TP53 mutations and immunohistochemistry–a comparative study in 157 diffuse gliomas. Brain Pathol. 2015;25:256‐265. [DOI] [PMC free article] [PubMed] [Google Scholar]
- 26. Tao Z, Zhang Y, Zhu S, et al. Knockdown of PDRG1 could inhibit the Wnt signaling pathway in esophageal cancer cells. Ann Clin Lab Sci. 2019;49:794‐803. [PubMed] [Google Scholar]
- 27. Wade A, Robinson AE, Engler JR, Petritsch C, James CD, Phillips JJ. Proteoglycans and their roles in brain cancer. FEBS J. 2013;280:2399‐2417. [DOI] [PMC free article] [PubMed] [Google Scholar]
- 28. Iozzo RV, Sanderson RD. Proteoglycans in cancer biology, tumour microenvironment and angiogenesis. J Cell Mol Med. 2011;15:1013‐1031. [DOI] [PMC free article] [PubMed] [Google Scholar]
- 29. Xu Y, Stamenkovic I, Yu Q. CD44 attenuates activation of the hippo signaling pathway and is a prime therapeutic target for glioblastoma. Can Res. 2010;70:2455‐2464. [DOI] [PMC free article] [PubMed] [Google Scholar]
- 30. Lai CJ, Lin CY, Liao WY, Hour TC, Wang HD, Chuu CP. CD44 promotes migration and invasion of docetaxel‐resistant prostate cancer cells likely via induction of Hippo‐Yap signaling. Cells. 2019;8:295. [DOI] [PMC free article] [PubMed] [Google Scholar]
Associated Data
This section collects any data citations, data availability statements, or supplementary materials included in this article.
Supplementary Materials
Figure S1‐S3
Table S1
Table S2
Appendix S1


