

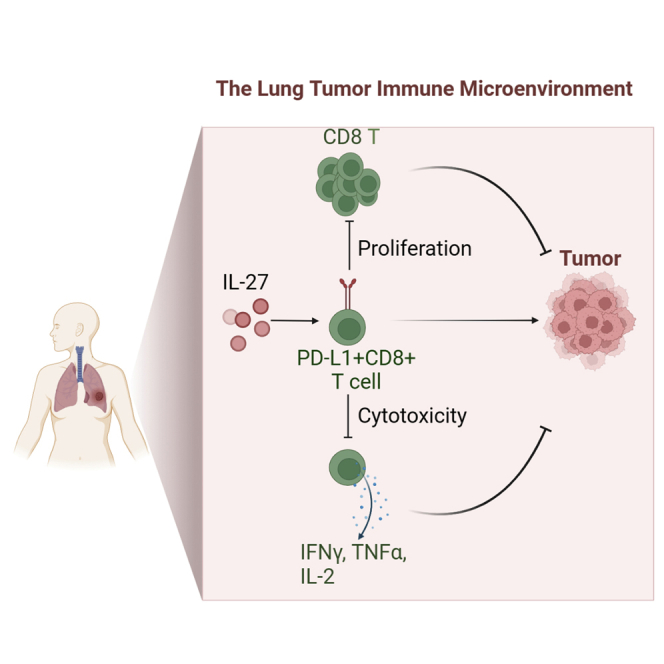
Summary
Immunotherapy targeting checkpoint blockade to rescue T cells from exhaustion has become an essential therapeutic strategy in treating cancers. Till now, little is known about the PD-L1 graphic pattern and characteristics in CD8+ T cells. We combined cytometry by time-of-flight (CyTOF) and imaging mass cytometry (IMC) approaches to analyze CD8+ T cells from primary lung cancers and discovered that PD-L1+CD8+ T cells were enriched in tumor lesions, spatially localized with PD-1+CD8+ T cells. Furthermore, PD-L1+CD8+ T cells exerted regulatory functions that inhibited CD8+ T cells proliferation and cytotoxic abilities through the PD-L1/PD-1 axis. Moreover, tumor-derived IL-27 promotes PD-L1+CD8+ T cells development through STAT1/STAT3 signaling. Single-cell RNA sequencing data analysis further clarified PD-L1+CD8+ T cells elevated in the components related to downregulation of adaptive immune response. Collectively, our data demonstrated that PD-L1+CD8+ T cells enriched in lung cancer engaged in tolerogenic effects and may become a therapeutic target in lung cancer.
Subject areas: Biological sciences, Immune system, Transcriptomics
Graphical abstract
Highlights
-
•
CyTOF and IMC revealed PD-L1+CD8+ T cells were enriched in human lung cancer
-
•
PD-L1+CD8+ T cells inhibited CD8+ T cells function through PD-1/PD-L1 axis
-
•
IL27 promoted PD-L1+CD8 T cells development through STAT1/STAT3 signaling
Biological sciences; Immune system; Transcriptomics
Introduction
Lung cancer is one of the most common cancer types and causes dramatic mortality. Current checkpoint blockade therapies mainly focus on rescuing T cells from exhaustion or deplete T regulatory cells (Treg). The FDA has approved the anti-PD-L1 mAb atezolizumab (Tecentriq) for second-line treatment of metastatic non-small cell lung cancer (NSCLC) with high PD-L1 expression. However, the overall response rate to anti-PD-L1 mAb therapy is still very low, at approximately 21% (Santini and Rudin, 2017; Herbst et al., 2014). Surprisingly, despite the absence of PD-L1 expression on tumor cells, anti-PD-L1 mAb therapy also shows a clinical response (Herbst et al., 2014). Although CD4+ Tregs are treated as the dominant immunosuppressive population in the tumor microenvironment (TME), many other regulatory populations-such as myeloid-derived suppressor cells (MDSCs), activated M2 macrophages, and tolerogenic dendritic cells (tDCs)- existing and collectively contribute to the immunosuppressive TME (Zhang et al., 2020; Azizi et al., 2018). However, only limited studies have reported the existence of CD8+ Tregs in tumors, including colorectal cancer, prostate tumor, and liver cancer (Chaput et al., 2009; Olson et al., 2012; Zheng et al., 2017). Recently, Andres et al. reported that human CD8+HLA-DR+ Tregs, similar to classic CD4+Foxp3+ T cells, suppress immune responses via the PD-1/PD-L1 axis, trigger inhibitory signaling downstream of the T cell receptor, thus blocking effector functions and reducing T cell killing capacity (Arruvito et al., 2014, Lukas Yani et al., 2018).
PD-L1 has been reported to be expressed on B cells, T cells, NK cells, macrophages, MDSCs, and DCs, and its expression is upregulated after activation (Okazaki and Honjo, 2007; Dong et al., 2019). Many cytokines, including IFN-γ, IL-1α, IL-10, IL-27, and IL-32, have been reported to induce PD-L1 expression in cells (Chen et al., 2019). Transcription factors such as STAT1, STAT3, NF-κB, and HIF-1α are known to activate PD-L1 expression in response to inflammatory and metabolic cues from the TME (Noman et al., 2014; Lee et al., 2006). Tumor and/or immune cells express PD-L1 and interact with PD-1 on tumor-infiltrating lymphocytes, attenuating effector T cell responses and resulting in tumor cells escaping immune surveillance. Therefore, PD-L1 expression is an essential indicator of preexisting immunity and induces immunosuppression in the tumor milieu. In lung cancers, approximately 33% of PD-L1 expression is restricted to immune cells, 6% of PD-L1 expression is restricted to tumor cells, and 26% of PD-L1 expression is restricted to both tumor immune cells (Kowanetz et al., 2018). However, what kinds of cell types express PD-L1 in TME are still unclear and need further study.
Several studies have recently defined the immune cell composition in lung cancer by different methods, including flow cytometry, single-cell RNA sequencing, and time of flight cytometry (CyTOF). These studies indicated the cell types, density, and location of immune cells within the lung cancer TME; however, these results were varied and included some controversies (Stankovic et al., 2018; Lavin et al., 2017; Mony and Schuchert, 2018; Kargl et al., 2017) because of the complexity and high heterogeneity of TME. Two types of high-throughput technologies, CyTOF and imaging mass cytometry (IMC), were applied to define the phenotypic subpopulations preferentially enriched within TME. Furthermore, these approaches were engaged to analyze the tumor-infiltrating CD8+ T cells in lung cancer. Our studies specifically revealed the occurrence of CD8+ Tregs that expressed PD-L1. PD-L1+CD8+ T cells were found to have the ability to suppress CD8+ T cell proliferation, IFNγ, and TNFα production. Specifically, PD-L1+CD8+ T cells were spatially co-localized with PD-1+CD38+CD8+ T cells and may engage in their regulatory activity. We further found that tumor cells derived IL-27 induced CD8+T cells PD-L1 expression through STAT1 and STAT3 pathways. Our study suggested that enrichment of this T cell subset might serve as a prognostic biomarker and therapeutic target in lung cancer.
Results
Distribution characteristics of immune cells in lung cancer by CyTOF
We first employed two panels of cytometry antibodies (Table S1) conjugated to unique metal isotypes. The immune cells, including T cells, B cells, NK cells, monocytes/macrophages, and dendritic cells, were detected from 30 patients with lung cancer by CyTOF, which has high-throughput and high-resolution properties (Christophersen et al., 2019; Bottcher et al., 2019) (Figure 1A). The patients were treatment-naive at the time of surgery, and their clinical information was included in Table S2. Details related to sample preparation, staining, data analysis, and statistical analyses were provided in the Methods; the gating strategy was described in Figure S1. Phenograph (Levine et al., 2015) was applied to visualize high-dimensional data in two dimensions to analyze immune cell populations systematically. Altogether 23 unique immune cell types and functional subpopulations were identified using single-cell suspensions generated from lung and adjacent tissues (Figures 1B–1D). Similar to a previous report (Lavin et al., 2017), T cells were the most abundant compartment in tumor-infiltrating immune cells that comprise major immune lineages (Figure 1E). T cells and B cells were present at a higher frequency in tumor lesions than in adjacent tissues; however, the frequencies of NK cells and macrophages were significantly decreased. In contrast, DCs and monocytes were equally represented in two types of tissues (Figure 1F).
Figure 1.

Properties of immune infiltrate in human lung cancer determined with CyTOF
(A) Schematic diagram of the experimental design and analysis. Adjacent lung tissues and tumor tissues were collected from lung cancer patients undergoing surgical resection of primary tumors, processed barcoded, and stained with antibodies conjugated to metal isotopes. Single-cell mass cytometry data were clustered using Phenograph to identify common populations across patients.
(B) viSNE analysis of CD45+ immune cells colored and labeled by tissue types (left) and Phenograph (right).
(C) Heatmap of Phenograph clusters of CD45+ cells. The relative expression levels of markers across cells were shown, sorted by cell type.
(D) viSNE analysis of primary immune cells colored by the relative expression of CyTOF markers.
(E) Cell-type fractions in lung cancer tumors and adjacent tissues, colored by cell types (N = 15).
(F) Composition of the CD45+ compartment showing average frequencies of major immune lineages for each tissue across patients, and bar plots showing the frequencies for each patient (N = 15). Bar plots show the mean ± SEM.
(G) Normalized expression of PD-L1 on CD45+ cells shown in a viSNE plot. Bar plots show the mean ± SEM ∗p <0.05 and ∗∗p <0.01, paired two-tailed t-test.
Anti-PD-L1 therapy is efficient and secure in clinical treatment and has been approved for second-line treatment in NSCLC (Li et al., 2019; Meng et al., 2017). Analyzed PD-L1 expression in B cells, monocytes/macrophages, NK cells, and T cells was evaluated. Strikingly, data emphasized that the immunosuppressive molecule PD-L1 was widely expressed in immune cells infiltrated in lung cancer lesions, and T cells expressed a relatively high level of PD-L1 (Figure 1G).
Lung tumors were enriched in CD8+PD-L1+ T cells
We further Phenograph clustering of tumor-infiltrating T cells (TIL) and identified many known immune cell populations across tumors and adjacent tissues (Figures 2A–2C), including naive CD4 and CD8 T cells, memory and effector CD4 and CD8 T cells, CD4 Tregs, NKT cells, and exhausted CD8 T cells. Specifically, cells in CD4-C9 expressed high levels of CTLA4 (CD152), CD39, CD27, and 4-1BB (CD137) compared to other T cell clusters, suggesting this cluster represented cells with Treg properties at tumor sites (Guo et al., 2018) (Figure 2B). The C-type lectin CD161 was expressed mainly in CD4-C4 and CD8-C10 clusters, and T cells expressing CD161 were reported to be a population of innate-like unconventional T cells known as MAIT cells. In addition, CD161 expression in lung cancers was associated with improved clinical outcomes (Fergusson et al., 2014; Braud et al., 2018).
Figure 2.

PD-L1-expression CD8+ T cells were enriched in lung tumor lesions
(A) viSNE analysis of CD3+ T cells, showing the identification of 16 main clusters. Each dot corresponds to a single cell, colored according to the cell cluster.
(B) Normalized expression of related markers on CD3+ T cells shown by a viSNE plot.
(C) Heatmap of Phenograph clusters of CD3+T cells. The relative expression levels of markers across cells are shown, sorted by cell types.
(D) Bar plots of the frequencies of the clusters from (A) across tissue samples from 10 lung cancer patients (∗p <0.05 and ∗∗p <0.01, paired two-tailed t-test).
(E) viSNE analysis of CD8+ T cells, showing the identification of 11 clusters. Each dot corresponds to a single cell, colored according to the cell cluster.
(F) Normalized expression of PD1 and PD-L1 on CD8+ cells shown by the viSNE plot in (E).
(G) Normalized expression of CD38, CD39, CD103, CD127, CD45RA, TIM3, IFNγ, and Granzyme B in CD8+ T cell clusters shown by the viSNE plot in (E).
(H) Bar plots of the frequencies of cluster one of the CD8 viSNE plot across tissue samples for 12 lung tumor patients.
(I) Heatmap of the Phenograph clusters 1, five, and seven of CD8+ cells in (E). The relative expression levels of markers across cells are shown.
(J) FACS analysis of PD-L1 and CD38 expression in CD8+ T cells from adjacent and tumor tissues (left). Bar plots show the frequencies of CD8+PD-L1+CD38+ T cells in different patients (N = 7, ∗p <0.05, paired two-tailed t-test).
(K) The ratio of CD4+CD57+ T cell to CD4+ Treg cluster frequencies and CD8+CD57+ T cell to PD-L1+CD8+ cell cluster frequencies across tissue samples (N = 10). ∗p <0.05 and ∗∗p <0.01, paired two-tailed t-test.
Moreover, cells in the CD8-C7 cluster expressed elevated levels of CD57 and CD45RA, but CD27 expression was negative (Figures 2B and 2C). CD8+CD57+CD45RA+CD27− T cells were defined as effector cells that produce relatively high Granzyme B and perforin levels and have the most potential ability to kill tumor cells positively associated with antitumor effector function and defense against chronic viral infection (Appay et al., 2002; Hoji et al., 2007; Ohkawa et al., 2001; Wu et al., 2012). In addition, this subset expressed a notable level of Ki67 (Figures 2A and 2B), suggesting the proliferative ability. Nevertheless, this population declined in tumor lesions (Figure 2D), indicating insufficient antitumor immunity in lung cancers. CD8-C15 cells were enriched in markers related to the exhausted state, such as PD-1 (CD279), CD39, and CD38. Consistent with a previous study (Lavin et al., 2017), the levels of Tregs and exhausted CD8 T cells were significantly increased. In contrast, those of both CD4 NKT cells and CD8 NKT cells were significantly decreased in the tumor lesions compared with the adjacent tissues (Figure 2D).
CD8+ T cells positively correlated with patients' outcomes in several solid tumor types (Tumeh et al., 2014; Jansen et al., 2019). We then analyzed CD8+T cell dimensionality reduction. Interestingly, we found a subset of CD8+ T cells (cluster 1) expressed high levels of PD-L1 but relatively low levels of PD-1 compared to the exhausted CD8+ T cells (cluster 5) (Figures 2E and 2F). This population exhibited CD45RA, CD127, medium levels of CD38, CD39 but low levels of CD103, granzyme B, and IFNγ. This kind of feature suggested an inactivated state (Figure 2G). This population (cluster 1) was significantly increased in tumor tissues (Figure 2H). The heatmap showed the distinct expression patterns of PD-L1, PD-1, CD38, CD39, and Granzyme B among clusters 1, 5, and 7, suggesting that cluster five was exhausted CD8 T cells, whereas cluster seven was activated CD8 T cells (Figure 2I). Moreover, we verified CD38+PD-L1+ CD8 T cells from tumors and adjacent tissues by flow cytometry and found an increasing presence of this subset, consistent with the CyTOF data (Figure 2J). PD-L1 engagement on T cells promotes self-tolerance, and suppression of neighboring macrophages and effector T cells in cancer was recently reported (Diskin et al., 2020). In addition, we observed reducing CD4+CD57+/CD4+ Treg and CD8+CD57+/CD8+PD-L1+ T cell ratios in lung tumor lesions compared with adjacent tissues (Figure 2K). These data suggested that PD-L1+ CD8+T cells may play a regulatory role in lung cancer, which has not been previously reported.
Tissue imaging mass cytometry (IMC) revealed PD-L1+CD8+ T cells characteristics in lung cancer
IMC was utilized to verify and expand spatial information on PD-L1+CD8+ T cells in lung cancer. The panel designed for operating IMC included 14 antibodies recognizing cell surface and functional targets (Table S3). The workflow for IMC was shown in Figure S2A. A cohort of 13 patients was included (Table S2 and Figure S2B). Firstly, each antibody was measured to determine the appropriate titers to maximize the separation between signal and background (Figure S2C). We further verified PD-L1 antibody sensitivity and specificity through IHC and multiple immunochemical staining (Figures S2D and S2E). Then paraffin sections stained with metal-labeled antibodies were analyzed using the IMC system. Finally, we analyzed the data according to the IMC analysis pipeline recommended by Fluidigm© (Ramaglia et al., 2019; Schapiro et al., 2017). At first, the location of the nucleus and the protein expression levels of Pan-CK+, CD45+, CD3+, CD4+, and CD8+ cells were captured in lung tumor sections (Figures 3A and S3C). Then, CD45+ cells were used to preliminarily reveal the relationship between tumor cells and infiltrating immune cells distributions. The method proposed to classify those tumor-forming borders, or tumor cells and immune cells mixed. Sample 33 represented the tumor-forming border, whereas Sample 34 represented tumor cells and immune cells mixed (Figure S3D). Our data suggested different distribution modes in different TME of lung cancer patients.
Figure 3.

The IMC system analysis indicated PD-L1+CD8+ T cells enrichment in lung tumor tissues and spatially located with PD-1+ effect T cells
(A) Staining for tumor cells (Pan-CK), immune cells (CD45, CD3, CD4, and CD8), and nuclei (DNA) in one of the representative patients.
(B) Normalized expression of CD45, Pan-CK, Epcam, CD3, CD4, and CD8 was shown in the viSNE plot.
(C) The intensity of Pan-CK+, Epcam+, CD45+, and CD3+ cells in lung tumors and adjacent tissues, N = 9.
(D) Representative co-expression of CD8 and PD-L1 in tumor tissues from two patients.
(E) viSNE plot of CD8+ T cells, showing the identification of 11 clusters. Each dot corresponds to a single cell, colored according to the cell cluster.
(F) Heatmap of the Phenograph clusters of CD8+ cells. The relative expression levels of markers across cells were shown.
(G) The frequency of PD-L1+, PD-1+, CD38+, and CD39+ in CD8+ T cells in adjacent and tumor tissues is determined by IMC. N = 9, two tailed paired t-test.
(H) Two representative samples of the neighborhood cells with PD-L1+CD8+ T cells in lung tumor tissues.
(I) viSNE plot showed the neighborhood cells with PD-L1+CD8+ T cells in lung tumor tissues, including 7 clusters.
(J) viSNE plot of the related markers of the CD8+ T cell clusters generated in (I).
(K) Re-cluster of neighborhood CD8+T cells with PD-L1+CD8+ T cells in lung tumor tissues, including five clusters.
(L) Heatmap of the related markers across the neighborhood CD8+T cells generated in (K).
We also used histoCAT analytical toolbox to analyze cell subpopulations and cell-cell interactions (Schapiro et al., 2017). tSNE dimensionality reduction analysis operated as a standard method to determine the characteristics of immune cells resident in tissues. The representative tSNE dimensionality reduction tumor and adjacent tissue cells were shown (Figure S3E). Cells between the two groups were partially coincident and most were apparently different (Figure S3E). Similar to the CyTOF, the distributions of different subpopulations are based on classifying markers, such as CD45, CD3, CD8, CD4, Epcam, and PanCK (Figure 3B). Tumor tissues exhibited a higher quantity of Epcam+ cells, CD45+ immune cells, and CD3+ T cells than adjacent tissues (Figure 3C). In addition, PD-L1 was expressed in both Epcam+, CD45+and CD3+cells (Figure S3F). Consistently, PD-L1+CD8+ T cells presented in lung TME (Figure 3D).
Then, CD8+ T cells were observed dividing into 11 subgroups (Figures 3E and S3H). The expression levels of different proteins in different clusters were analyzed and are shown with tSNE plots and heatmaps (Figures 3F and S3G). Cluster 8, which composed cells that displayed high levels of PD-L1 and relatively low levels of PD-1 and CD38, was consistent with the CyTOF data generated with the single-cell suspension (Figure 3F). It was also ensured that some clusters contained cells expressing PD-1, such as clusters 1, 2, 4, and 7. However, cells in these clusters expressed different levels of CD38, CD39, IFNγ, and GranzymeB, suggesting the activated or diverse exhausting stages (Figures 3F and S3H). Likewise, the percentages of PD-L1+, PD-1+, CD38+, and CD39+ in CD8+ T cells were significantly raised in the tumor lesions (Figure 3G).
Neighborhood analysis was adopted to certify the potential interactions of PD-L1-expressing CD8+ T cells and other TIL (Schapiro et al., 2017). The neighborhood cells were divided into 7 clusters (Figures 3H and 3I), including the CD4, CD8, and Epcam expressing cells (Figure 3J). Of note, when re-cluster the neighbor CD8+ T cells, cluster two and cluster five express PD-1 and different levels of CD38, CD39, IFNγ, and GranzymeB, suggesting the activated and exhausted CD8+ T cells were nearby with the PD-L1+CD8 T cells (Figures 3K, 3L, and S3I). Together, these data gave clues that PD-L1+CD8+ T cells might interact with PD-1+CD8+ T cells and perform a regulatory role in inhibiting CD8+ T cells, thus mitigating T cell activation.
PD-L1-expressing CD8+ T cells engage in regulatory activities in vitro
To verify the function of PD-L1+CD8+ T cells, we first cocultured the lung cancer cell line HCC827 with CD8+ T cells isolated from healthy PBMCs. The results provided conclusive evidence that the expression on CD8+ T cells of PD-L1, CD38, and PD-1 significantly increased after coculture with HCC827 cells (Figures 4A and S4A). Furthermore, other lung cancer cell lines, including A549, H1299, H460, also induced CD8+T cells PD-L1 expression (Figure S4B). PD-L1-expressing CD8+ T cells expressed moderate levels of CD38 (Figures 4B and S4C), coinciding with the CyTOF and IMC data. In addition, this subset of cells secreted low levels of TNFα and INFγ compared to PD-L1−CD38hiCD8+T cells. The stimulation with lung cancer cell lines could significantly reduce PDL1+CD8+T cell inflammatory cytokine expression (Figures 4C, 4D, and S4D). As well, compared to PD-L1−CD38hi CD8+ T cells, PD-L1+ CD8+ T cells were detected with low levels of PD-1 (Figure 4E). These data demonstrated that the lung cancer cell line not only induced PD-L1+CD8+ T cell development but also modulated their function.
Figure 4.

PD-L1+CD8+ T cells engage in regulatory activity in vitro
(A, B, C, and D) CD8+ T cells were cocultured with lung cancer cell line HCC827 or alone for 48 h. (A) FACS analysis of PD-L1, CD38, and PD-1 expression. One of three similar experiments is shown. (B) PD-L1 and CD38 expressions were evaluated by FACS. One of three similar experiments is shown. TNFα (C) and IFNγ (D) expression was compared between PD-L1+CD38lo and PD-L1-CD38hi CD8 T cells. One of three similar experiments was shown.
(E) The PD-1 expression of PD-L1+CD38lo and PD-L1-CD38hi CD8 T cells was shown. One of five similar experiments is shown. (F, G, and H) CD8+ T cells were cocultured with the lung cancer cell line HCC827 for 48 h, and PD-L1+ and PD-L1- CD8+ T cells were sorted and then cocultured with CFSE-labeled CD8+ T cells for 96 h. One of three similar experiments is shown.
(F) The proliferation (G) TNFα and IFNγ expression of CFSE-labeled CD8+ T cells were measured. One of three similar experiments was shown. (H) CD8+ T cells were cocultured with the lung cancer cell line HCC827 for 48 h, and PD-L1+ and PD-L1- CD8+ T cells were sorted and then cocultured with CFSE-labeled CD8+ T cells for 72 h in the presence of an anti-PD-L1 antibody or IgG control. TNFα and IFNγ expression was measured. One of three similar experiments was shown. All the data were presented as the mean ± SEM, and the p value was calculated by a two-tailed Student’s t-test, ∗p <0.05, ∗∗p <0.01.
We then used HCC827 cells to treat CD8+ T cells for 48 h. Isolated PD-L1−CD8+ and PD-L1+CD8+ T cells were sorted by fluorescence-activated cell sorting (FACS) and cocultured the isolated cells with CFSE-labeled CD8+ T cells isolated from control PBMCs. PD-L1+CD8+ T cells significantly inhibited CFSE-labeled CD8+ T cell proliferation compared to PD-L1- CD8+ T cells (Figures 4F and S4E). Further, when CD8+ T cells were cocultured with PD-L1+CD8+ T cells, TNFα, and IFNγ expressions were decreased compared to coculture with PD-L1−CD8+ T cells (Figures 4G and S4F). Blocking PD-L1 in the coculture system, the inhibitory ability to secrete TNFα and IFNγ in CD8+ T cells was reduced (Figures 4H and S4G). These data indicated that PD-L1+CD8+ T cells might have a regulatory function that suppressed CD8+ T cells activation, playing an immunosuppressive role in the tumor microenvironment through the conventional PD-L1/PD-1 axis.
IL-27 regulated PD-L1+CD8+ regulatory T cells development
Many inflammatory cytokines and mediators induce PD-L1 expression (Loke and Allison, 2003; Horlad et al., 2016), and we previously found that tumor cell lines could stimulate PD-L1 expression in CD8+ T cells. Then, we used a supernatant isolated from the lung cancer cell line for treating CD8+ T cells. Our data indicated that after stimulation, the expressive degree of PD-L1 on CD8+ T cells was significantly increased compared to stimulation with control medium (Figures 5A, 5B, S5A, and S5B). However, IFNγ, TNFα, and IL-2 expression was reduced compared to that induced by the control medium (Figures 5C and S5C). We then further explored the detailed mechanisms. First, we measured inflammatory cytokine expression in the culture medium with a Proteome ProfilerTM antibody array and found that the levels of many several mediators, such as MIF, IL-6, IL8, and IL-27, were elevated (Figure S5D). As IL-27 has been reported to stimulate PD-L1 expression in tumor cells, macrophages, and mouse T cells (Zhu et al., 2018, d'Almeida et al., 2016; Chen et al., 2019), we hypothesized that IL-27 could stimulate PD-L1 expression in human CD8+ T cells. Indeed, the supernatants from lung cancer cell lines contained high levels of IL-27 (Figure 5D). When CD8+ T cells were stimulated with IL-27, PD-L1 expression was significantly augmented compared to control stimulation (Figures 5E, S5E, and S5F), and blocking IL-27 in coculture supernatants diminished this effect (Figures 5F and S5G). Although IFNγ has been discovered to induce PD-L1 expression in tumor cells and macrophages, we did not observe IFNγ-induced PD-L1 expression in CD8+ T cells (Figure S5H). We further tested the potential molecular signaling. Accordingly, IL-27 stimulation upregulated p-STAT3 and p-STAT1 signaling in CD8+ T cells (Figure 5G), and STAT3 and STAT1 inhibitors significantly reduced these effects (Figures 5H and S5I), suggesting that induction of PD-L1 expression in T cells by IL-27 requires both STAT3 and STAT1 signaling.
Figure 5.

IL-27 induces PD-L1 expression in CD8+ T cells
(A) CD8+ T cells were stimulated with culture supernatant from the lung cancer cell line H460 or HCC827 or control medium. Q-PCR was performed to analyze CD274 expression after 24 h of stimulation, N = 3, two-tailed unpaired Student’s t tests.
(B and C) CD8+ T cells from the same volunteer were treated with different conditions. FACS was used to detect PD-L1 expression after 48 h stimulation, N = 3, two-tailed paired Student’s t test (B). FACS was used to analyze IFNγ, IL-2, and TNFα expression, N = 3, two-tailed paired Student’s t test (C).
(D) ELISA was performed to detect IL-27 levels in the culture supernatant of the lung cancer line HCC827, H460, and control medium, N = 3, one-way ANOVA analysis, Tukey's multiple coated three times with similar results.
(H) CD8+ T cells from the same volunteer were stimulated with IL-27, and STAT1-specific inhibitor (Fludarabine) or STAT3-specific inhibitor (Stattic) was added for 48 h. PD-L1 expression was determined by FACS, N = 11, paired one-way ANOVA analysis, Tukey's multiple comparisons test.
(I) Correlations of CD274 with IL-27 (left) or IL-27RA (right) in NSCLC data from the TCGA. The P and r values represent Pearson’s correlation and its coefficient of determination. Data are presented as the mean ± SEM; ∗p <0.05, ∗∗p <0.01, ∗∗∗p <0.001.
In addition, we applied gene expression profile interactive analysis. We found that CD274 expression had a positive relationship with IL-27 and the IL-27 receptor IL-27RA (Figure 5I), suggesting a potential regulatory effect of IL-27 on PD-L1 expression by CD8+ T cells in the lung cancer TME.
PD-L1+CD8+ T cells enriched in components related to downregulation of adaptive immune response
Previously, we performed unbiased characterization of a subgroup of PD-L1 expression CD8+ T cells that were enriched in lung cancer tissues using CyTOF and IMC approaches. To explore the phenotype of PD-L1-expressing CD8+ T cells in more depth, we evaluated published single-cell sequencing data from NSCLC (Guo et al., 2018), explicitly analyzing the PD-L1 (CD274)-positive CD8+T cells transcriptional profile. We identified a set of genes differentially expressed by PD-L1+CD8+ T cells compared to naive CD274 negative CD8+ T cells (Figure S5). The profile included CD274, PTPN22, TGFB1, AKT1, TNFRSF1B, and LAG3, suggesting that PD-L1+CD8 T cells might be involved in immunoregulatory functions (Figure 6A). Analysis of pathway gene signatures highlighted that PD-L1+CD8 T cells were associated with PD-1 signaling, negative regulation of the adaptive immune response, the apoptotic signaling pathway, and positive regulation of IL-10 signaling (Figure 6B) supported the regulatory function of PDL-1+CD8+ T cells.
Figure 6.

PD-L1+CD8+ T cells were associated with negative regulation of the adaptive immune response
(A) Violin plot showing the expression of related genes in CD274+CD8+ and naive CD8+ T cells determined from published single-cell RNA-sequencing data. Expression was measured as the log2 (count+1).
(B) Bar graph of enriched terms generated with the Metascape website across the genes differentially expressed between CD274+CD8+ and naive CD8+ T cells; the blue boxes indicate the signaling of interest.
(C, D, and E) CD8+ T cells were stimulated with IL-27 for 48 h, FACS was used to isolate PD-L1+CD8+ and PD-L1−CD8+ T cells and Smart RNA-seq was performed. The volcano plot shows the differentially expressed genes (CD274+CD8+ versus CD274−CD8+ T cells), with the purple and green dots denoting the downregulated and upregulated genes, respectively, with an adjusted p-value <0.01 and fold change ≥1 (C). The heatmap shows the downregulated and upregulated genes between PD-L1+CD8+ and CD274−CD8+ T cells (D).
(E). Bar graph of enriched terms generated with the Metascape website across the genes differentially expressed between PD-L1+CD8+ and PD-L1−CD8+ T cells; the blue boxes indicated the signaling of interest.
Furthermore, we isolated PD-L1+CD8+ T cells and PD-L1−CD8+ T cells after in vitro IL-27 stimulation and performed bulk RNA sequencing. Data showed that the PD-L1+CD8+ T cells had different transcriptional profiles from the PD-L1−CD8+ T cells (Figures 6C and 6D). Consistent with the single-cell sequencing data, PD-L1+CD8+ T cells were enriched in regulating the adaptive immune response and apoptotic process (Figure 6E), suggesting that this subset of cells was involved in immunosuppression in lung cancer.
Discussion
Antitumor immune response suppression is paramount for lung cancer progression. Studies have begun to dissect the details of T cell function and distribution in advanced tumor lesions to identify strategies for strengthening antitumor T cells immunity. We used a multiplexed method for ex vivo identification and profiling PD-L1-expressing CD8+ regulatory T cells. First, we employed the high-dimensionality CyTOF approach, which was superior in detecting relatively small populations, such as cells that accounted for only ∼1% of leukocytes, and identified a signature subpopulation of CD8+ Tregs characterized by high expression of PD-L1 and relatively low expression of PD-1 and CD38 in lung tumor tissues. The majority of these cells expressed moderate levels of TNFα, IFNγ, and Granzyme B but expressed TIM3, an immunosuppressive molecule. Most previous reports have assessed the infiltrating immune cell distribution in whole tissue, representing a mixture of phenotypically and likely biologically distinct lesions. Therefore, we further employed an IMC approach to solving the spatial distribution to a certain extent and verified the phenotype and function of this subpopulation in situ. We demonstrated that this subset of cells was the neighbor of PD-1+CD38+CD8+ T cells. In addition, this population of cells negatively regulated the proliferation and secretory cytokine function of non-exhausted CD8+ T cells. Moreover, single-cell sequencing targeting the lung cancer microenvironment confirmed this population's existence and functional characteristics. The expression of PD-L1 on CD8+ T cells may be crucial in immune interactions and immunotherapy outcomes but is challenging to assess by current IHC-based scoring criteria (Stuart et al., 2004; Memon and Patel, 2019).
PD-L1 expression in carcinomas, including NSCLC, has been attributed mainly to expression by tumor cells, myeloid cells, B cells, and inhibition of T cell activation has been well studied (Sharma and Allison, 2015). Recently, Dong et al. reported anti-PD-L1 antibody efficacy against PD-L1 negative tumors and identified NK cells expressing PD-L1 as a cytolytic effector (Dong et al., 2019). However, PD-L1-expressing T cells, especially in CD8+ T cells, have not been well characterized in TME; furthermore, their role in the programming of the TME remains ill-defined. Diskin et al. also noted the prevalence of T cells expressing PD-L1 in a preinvasive autochthonous model of pancreatic ductal adenocarcinoma (PDA), with human PDA T cell infiltration into tumor tissues. Notably, the expression of PD-L1 in T cells in PDA was more remarkable than in tumor cells, B cells, or macrophages (Diskin et al., 2020). Moreover, PD-L1 expression was found to be highly upregulated on intra-tumoral T cells in murine melanoma (Diskin et al., 2020). PD-L1+ T cells suppress neighboring T cells and induce an alternative M2 program via PD-1 ligation (Diskin et al., 2020). A similar study found that γδ T cells expressing high levels of PD-L1 and galectin nine powerfully inhibiting the activation of adjacent αβ T cells in PDA via ligation of the respective checkpoint receptors; furthermore, PD-L1+ and PD-1+ T cells had more excellent spatial proximity than PD-L1+ antigen-processing and PD-1+ T cells (Daley et al., 2016). Chaido et al. outlined that PD-1 receptor signaling downregulates asparaginyl endopeptidase expression to maintain Foxp3 stability in induced Tregs (Stathopoulou et al., 2018); and PD-1 upregulation on Tregs during chronic viral infection enhances the suppression of the CD8+ T cell-mediated immune response via interaction with PD-L1 expressed on CD8+ T cells (Park et al., 2015). However, features and functions of PD-L1 in T cells have not been well described in lung cancer TME. Recently, Wu et al. reported that stromal PD-L1+ regulatory T cells and PD-1+ CD8+ T cells define the responses of different subsets of NSCLC to PD-1/PD-L1 blockade immunotherapy (Wu et al., 2018). In a resistant tumor mouse model, relatively low expression of PD-L1 on total CD8+ TILs was the only parameter associated with relative tumor indolence (Ngiow et al., 2015), demonstrating the critical roles of PD-L1-expressing CD8+ T cells in tumor immune evasion and tolerance.
It has been reported that epithelial cells, endothelial cells, and tumor cells express PD-L1 after exposure to the IFNγ; however, PD-L1 was not induced by IFNγ on CD8+ cells. In addition, lung tumor cell lines or coculture supernatant effects stimulate CD8+ T cells to express PD-L1 and reduce their ability to produce inflammatory cytokines. Nevertheless, we determined that tumor cell-derived IL-27 induced CD8+ T cell expression of PD-L1 through STAT3 and STAT1 signaling. Overall, our data, which were generated by combining the methodologies CyTOF and IMC, directly supported the existence of the CD8+ regulatory T cell subset. In addition, this subset was correlated with clinical events, suggesting that this subset may have potential as a therapeutic target in patients with lung cancer.
Limitations of the study
Although we took our effort to eliminate the batch-to-batch variation to the patients applied for CyTOF, the limitation of the barcoding technology only supports 20 samples (10 patients) analysis at the same time. Another issue was that, because a limited number of cells were obtained; we couldn’t generate all the data from each patient. In addition, we may increase the number of antibody detection in IMC to study the interaction of CD8+PD-L1+ T cells with other cells, such as tumor cells, fibroblasts, monocytes, macrophage, and DCs. In addition, we could further verify the function of this group of cells through in vivo experiments in mice.
STAR★Methods
Key resources table
| REAGENT or RESOURCE | SOURCE | IDENTIFIER |
|---|---|---|
| Antibodies | ||
| anti-human CD45 -89Y | Fluidigm | Cat# 3089003B |
| anti-human CD19 -142Nd | Fluidigm | Cat# 3142001B |
| anti-human CD127 (IL-7Ra) -143Nd | Fluidigm | Cat# 3143012B |
| anti-human CD69 -144Nd | Fluidigm | Cat# 3144018B |
| anti-human CD163 -145Nd | Fluidigm | Cat# 3145010B |
| anti-human CD64 -146Nd | Fluidigm | Cat# 3146006B |
| anti-human CD11c -147Sm | Fluidigm | Cat# 3147008B |
| anti-human CD274/PD-L1 -148Nd | Fluidigm | Cat# 3148017B |
| anti-human CD56 (NCAM) -149Sm | Fluidigm | Cat# 3149021B |
| anti-human CD27 -150Nd | Fluidigm | Cat# 3150017B |
| anti-human CD107a/LAMP1 -151Eu | Fluidigm | Cat# 3151002B |
| anti-human CD62L -153Eu | Fluidigm | Cat# 3153004B |
| anti-human TIM-3 -154Sm | Fluidigm | Cat# 3154010B |
| anti-human CD279 (PD-1) -155Gd | Fluidigm | Cat# 3155009B |
| anti-human CD137/4-1BB -158Gd | Fluidigm | Cat# 3158013B |
| anti-human CD39 -160Gd | Fluidigm | Cat# 3160004B |
| anti-human CD152 (CTLA-4) -161Dy | Fluidigm | Cat# 3161004B |
| anti-human CD161 -164Dy | Fluidigm | Cat# 3164009B |
| anti-human CD16 -165Ho | Fluidigm | Cat# 3165001B |
| anti-human CD38 -167Er | Fluidigm | Cat# 3167001B |
| anti-human CD45RA -169Tm | Fluidigm | Cat# 3169008B |
| anti-human CD3 -170Er | Fluidigm | Cat# 3170001B |
| anti-human CD44 -171Yb | Fluidigm | Cat# 3171003B |
| anti-human HLA-DR -174Yb | Fluidigm | Cat# 3174001B |
| anti-human CD14 -175Lu | Fluidigm | Cat# 3175015B |
| anti-human CD57 -176Yb | Fluidigm | Cat# 3176019B |
| anti-human CD11b (Mac-1) -209Bi | Fluidigm | Cat# 3209003B |
| anti-human CD103 -151Eu | Fluidigm | Cat# 3151011B |
| anti-human IFNg -158Gd | Fluidigm | Cat# 3158017B |
| anti-human Granzyme B -173Yb | Fluidigm | Cat# 3173006B |
| anti-human TNFa -175Lu | Fluidigm | Cat# 3175023B |
| anti-human CD8a | Biolegend | Cat# 301002 |
| anti-human CD4 | Biolegend | Cat# 344625 |
| anti-human CD103 | Abcam | Cat# ab245746 |
| anti-human CD24 | Abcam | Cat# ab228455 |
| anti-human CD25 (IL-2R) | Abcam | Cat# ab212488 |
| anti-human CD66b | Biolegend | Cat# 392902 |
| anti-human Ki67 | Abcam | Cat# ab209897 |
| anti-human TNF-α | abcam | Cat# ab212899 |
| anti-human CD38 | abcam | Cat# ab176886 |
| anti-human CD39 | abcam | Cat# ab236038 |
| anti-human IFNg | abcam | Cat# ab231301 |
| anti-human PD1 | abcam | Cat# ab52587 |
| anti-human PDL1 | biolegend | Cat# 329710 |
| anti-human EpCAM | abcam | Cat# ab71916 |
| anti-human CD4 | abcam | Cat# ab181724 |
| anti-human PAN-CK | abcam | Cat# ab216014 |
| anti-human CD45 | biolegend | Cat# 304002 |
| anti-human CD8a | biolegend | Cat# 372902 |
| anti-human Granzyme B | abcam | Cat# ab53097 |
| anti-human Ki-67 | abcam | Cat# ab15580 |
| anti-human CD3 | abcam | Cat# ab5690 |
| Human IL-27 Antibody | R&D Systems | Cat# AF2526 |
| Biological samples | ||
| Human fresh lung tumor and adjacent tissue | This paper | See Table S2 |
| Chemicals, peptides, and recombinant proteins | ||
| Recombinant Human IL-27 | PEPROTECH | Cat# 200-38 |
| Stattic | SELLECK | Cat# S7024 |
| Fludarabine | SELLECK | Cat# S1491 |
| Critical commercial assays | ||
| Cell-ID™ 20-Plex Pd Barcoding Kit | FLUIDIGM | Cat# 201060 |
| Maxpar® X8 Antibody Labeling Kit, 141Pr—4 Rxn | Fluidigm | Cat# 201141A |
| Maxpar® X8 Antibody Labeling Kit, 146Nd—4 Rxn | Fluidigm | Cat# 201146A |
| Maxpar® X8 Antibody Labeling Kit, 147Sm—4 Rxn | Fluidigm | Cat# 201147A |
| Maxpar® X8 Antibody Labeling Kit, 148Nd—4 Rxn | Fluidigm | Cat# 201148A |
| Maxpar® X8 Antibody Labeling Kit, 149Sm—4 Rxn | Fluidigm | Cat# 201149A |
| Maxpar® X8 Antibody Labeling Kit, 150Nd—4 Rxn | Fluidigm | Cat# 201150A |
| Maxpar® X8 Antibody Labeling Kit, 152Sm—4 Rxn | Fluidigm | Cat# 201152A |
| Maxpar® X8 Antibody Labeling Kit, 153Eu—4 Rxn | Fluidigm | Cat# 201153A |
| Maxpar® X8 Antibody Labeling Kit, 156Gd—4 Rxn | Fluidigm | Cat# 201156A |
| Maxpar® X8 Antibody Labeling Kit, 158Gd—4 Rxn | Fluidigm | Cat# 201158A |
| Maxpar® X8 Antibody Labeling Kit, 160Gd—4 Rxn | Fluidigm | Cat# 201160A |
| Maxpar® X8 Antibody Labeling Kit, 162Dy—4 Rxn | Fluidigm | Cat# 201162A |
| Maxpar® X8 Antibody Labeling Kit, 163Dy—4 Rxn | Fluidigm | Cat# 201163A |
| Maxpar® X8 Antibody Labeling Kit, 167Er—4 Rxn | Fluidigm | Cat# 201167A |
| Maxpar® X8 Antibody Labeling Kit, 168Er—4 Rxn | Fluidigm | Cat# 201168A |
| Maxpar® X8 Antibody Labeling Kit, 170Er—4 Rxn | Fluidigm | Cat# 201170A |
| Maxpar® X8 Antibody Labeling Kit, 172Yb—4 Rxn | Fluidigm | Cat# 201172A |
| Maxpar® X8 Antibody Labeling Kit, 173Yb—4 Rxn | Fluidigm | Cat# 201173A |
| Proteome Profiler Human Cytokine Array Kit | R&D Systems | Cat# ARY005B |
| Human IL-27(Interleukin 27) ELISA Kit | Sangon Biotech | Order NO. D711285 |
| Deposited data | ||
| sc-RNA Sequence Data | Guo et al. (2018) | GSE99254 |
| Smart seq data | This paper | GSE192591 |
| Experimental models: Cell lines | ||
| HCC827 | Shanghai Academy of Biological Sciences | TCHu153 |
| NCI-H460(H460) | Shanghai Academy of Biological Sciences | SCSP-584 |
| NCI-H1299 | Shanghai Academy of Biological Sciences | TCHu160 |
| A549 | Shanghai Academy of Biological Sciences | TCHu150 |
| Oligonucleotides | ||
| Primer for CD274 (forward 5′-ACA GCTGAATTGGTCATCCC-3′; reverse 5′-TGTCAGTGCTACACCAAGGC-3′) | This paper | N/A |
| Primer for GAPDH (forward 5′-GCC ACC CAG AAG ACT GTG GAT GGC-3; reverse 5′CATGTAGGCCATGAGGTCCACCAC-3′) | This paper | N/A |
| Software and algorithms | ||
| Cellprofiler | Jones et al. (2008) | https://cellprofiler.org/ |
| MCD viewer | Jones et al. (2008) | https://www.fluidigm.com/products-services/software#hyperion-anchor |
| Histocat | Schapiro et al. (2017) | https://bodenmillergroup.github.io/histoCAT/ |
| Seurat V3 | (Stuart, 2019) | https://satijalab.org/seurat/ |
Resource availability
Lead contact
Further information and requests may be directed to and will be fulfilled by the lead contact, Lisong Shen (lisongshen@hotmail.com).
Material availability
This study did not generate new unique reagents.
Experimental model and subject details
Patients collection
Patients who were pathologically diagnosed with lung cancers were enrolled in this study. None of the patients had been treated with chemotherapy, radiation, or any other antitumor medicines prior to tumor resection. The clinical information of these patients is summarized in Table S2. Clinical samples were collected at Xinhua Hospital, Shanghai Jiaotong University School of Medicine. Prior to participation, written informed consent was obtained from all subjects. All studies were performed following the Declaration of Helsinki. The study was approved by the Research Ethics Board of Xinhua Hospital, Shanghai Jiao Tong University School of Medicine.
Cell lines
The human lung cancer cell line (HCC827, H460, A549 and H1299) were purchased from the Cell Resource Center, Shanghai Academy of Biological Sciences, China. All cells were cultured at 37°C in a humidified incubator with 5% CO2 in recommended medium supplemented with 10% fetal bovine serum (FBS) (Gibco), 100 U/mL penicillin and 100 μg/mL streptomycin (Gibco).
Method details
Single cell isolation for CyTOF
Paired and freshly excised tumor and adjacent lung tissues were obtained immediately after surgical removal. The adjacent tissues were collected at least 5 cm from the tumor tissues. Tumor and adjacent tissues were processed by mincing freshly obtained surgical specimens into 1-mm3 pieces, followed by enzymatic digestion using 0.1% collagenase IV, 0.002% DNAse I, and 0.01% hyaluronidase and incubation on a rocker for 20–40 min at 37°C. The digested tissues were then passed through a 40-μm cell strainer and washed twice with PBS (PBS). They were treated in red blood cell lysis buffer (BioLegend) and then resuspended in complete media and counted. For intracellular cytokine staining, cells were stimulated with the cell stimulation cocktail plus protein transport inhibitors (eBioscience) for 4 h.
Barcoding and cell staining
According to the manufacturer's instructions, antibodies were purchased pre-conjugated from Fluidigm or as purified antibodies and conjugated in-house using MaxPar X8 Polymer Kits (Fluidigm). Cells from each tissue (tumor or adjacent) were stained for viability with 5 μM cisplatin in PBS for 5 min at 37°C and fixed with 1.6% paraformaldehyde (PFA) before storage. The samples were labeled with a unique barcode using the 20-Plex Pd Barcoding Kit (Fluidigm) and pooling. The pool of samples was washed and split into two equal aliquots. One aliquot was stained with an immune cell type-focused panel of antibodies (Table S1, panel 1). In contrast, the other was stained with the CD8 T cell within the cytokine-focused panel of antibodies (Table S1, panel 2) for 30 min at room temperature (RT). Then, the cells were fixed and permeabilized with Cytofix/Cytoperm buffer (B.D. Bioscience), and intracellular cytokines were stained. Finally, the cells were washed and incubated in 125 nM Ir intercalator (Fluidigm) diluted in PBS containing 2% PFA and stored at 4°C until acquisition.
CyTOF data acquisition
Stained samples were washed once with PBS and three times with deionized water (DI water). Before the acquisition, polled samples were resuspended at the concentration of 1×10⁶ cells/mL in DI water containing 10% EQ 4 Element Beads (Fluidigm). The samples were acquired on a CyTOF instrument (Fluidigm) equipped with a supersampling fluidics system (Victorian Airships) at an event rate of <500 events/second.
CyTOF data analysis
After the acquisition, data were performed using the CyTOF software for normalization. Barcodes were deconvoluted using the CyTOF “debarcoding” function. The residual normalization beads, debris, dead cells, and doublets were exclusively gated using FlowJo (TreeStar). Data dimensionality reduction analysis and mapping were performed with the R package (cytofkit, Rtsne).
IMC sample preparation
Samples for IMC analysis were as previously described as CyTOF. These tissue samples were first preserved in a 4% PFA solution and then embedded in a paraffin wax block to form formalin-fixed paraffin-embedded (FFPE) tissue specimens to identify representative areas.
Labeling for IMC
Briefly, fresh NSCLC sections were deparaffinized at 60°C for 20 min and then incubated twice in xylene for 20 min each time. Antigen retrieval was performed with EDTA buffer pH 8.0 at 97°C for 20 min in a pretreatment heating container (P.T. Module, Thermo Scientific). Then, the slides were blocked with 0.3% BSA in 0.1 mol/L Tris-buffered salines for 30 min at RT. The metal-labeled antibodies were obtained using the MaxPar antibody conjugation kit (Fluidigm) according to the manufacturer's protocol. Metal-labeled antibodies could be diluted in stabilization buffer (Fluidigm) for long-term storage at 4°C. All the carrier-free purified primary antibodies used for metal conjugation are shown in Table S3. Tissue slides were incubated overnight at 4°C with metal-conjugated antibodies, washed with 0.1% Triton X-100 and PBS twice each, and exposed to 25 μM Ir-Intercalator (Fluidigm) for 30 min at RT for nuclear staining. Then the slides were rinsed twice in distilled water and air-dried before IMC analysis.
IMC data acquisition
After daily tuning was carried out at a laser frequency of 200 Hz, data acquired from tumor and adjacent sections were analyzed with an IMC system (Hyperion, Fluidigm) following the manufacturer's instructions. Approximately 0.5 × 0.5 mm regions were selected based on bright-field images. The marker expression intensity associated with individual regions of interest (ROIs) was used as the input for further analysis.
IMC image visualization and data analysis
The data analysis pipeline included MCD Viewer, CellProfiler, and histoCAT software. MCD Viewer enables the transformation from raw data into visual images. CellProfiler was used to generate segmentation masks by inputting the surface marker and nuclear signals (Jones et al., 2008). A combination of channels was used to classify the background and membrane. The nuclear and cell masks were combined with individual TIFF files to extract single-cell information from each image for further histoCAT analysis. HistoCAT software enables comprehensive analysis of cellular phenotypes and the interaction within the spatial context in the tissue microenvironment (Schapiro et al., 2017).
Peripheral blood mononuclear cell (PBMC) isolation
Fresh blood was obtained from 30 healthy volunteers (age range: 34 to 62, median age: 46). PBMCs were isolated from fresh heparinized blood using standard density gradient centrifugation using the commercial solution named Ficoll-Paque Plus (GE Healthcare). Then, we resuspended the PBMCs in RPMI-1640 medium supplemented with 10% FBS.
Flow cytometric analysis
For cell surface marker staining, antibodies were used (anti-CD45, PI, anti-CD3, anti-CD4, anti-CD8, anti-CD38, anti-CD39, anti-PD1 and anti-PD-L1). For intracellular cytokine staining, cells were stimulated with the cell stimulation cocktail plus protein transport inhibitors (eBioscience) for 4 h. Then, the cells were fixed and permeabilized with Cytofix/Cytoperm buffer. According to the manufacturer's instructions, intracellular cytokines were stained with antibodies against Granzyme B, IFN TNF, and IL-2 or isotype control. The antibody dilutions were in accordance with the manufacturer’s instructions. Flow cytometric analysis was performed with a FACSCanto II instrument (BD Bioscience) and FlowJo software (TreeStar).
Cell subset isolation
PBMCs were surface stained for CD3, CD8, and PD-L1, and CD8+PD-L1- and CD8+PD-L1+ T cells were sorted using a BD FACSAria II cell sorter. The purity of the sorted samples was greater than 95%.
Cell line co-culture
CD8+ T cells were isolated from healthy PBMCs by negative selection (Miltenyi) and stained with 2 μM CFSE (Sigma-Aldrich) for 8 min in the dark at RT. Then, the CD8+ T cells were cocultured with the lung cancer cell lines HCC827, H460, H1299, and A549 at a ratio of 10:1 in the complete medium (CM) containing RPMI-1640 medium (Gibco) 10% FBS, penicillin (100 U/mL), and streptomycin (100 mg/mL) (Gibco). Cells were incubated at 37°C (5% CO2) in CM with 0.5 μg/mL soluble anti-human CD28 mAb (BD Bioscience) in 96-well round-bottom plates pre-coated with 1 μg/mL anti-human CD3 mAb (BD Bioscience) for 24 h for PD-L1 mRNA and 48 h for protein detection.
Supernatant stimulation
H460 and HCC827 lung cancer cell lines were cultured for 48 h until the cell confluence reached 80%, and then the supernatant was collected and filtered. CD8+ T cells were stimulated with the supernatant or control medium for 48 h.
IL-27 stimulation
CD8+ T cells were cultured in the CM with different concentrations of human IL-27 (PeproTech) or not (control). For anti-IL-27 blocking experiments, CD8+ T cells were stimulated with supernatant and 10 μg/mL anti-IL-27 antibody (R&D Systems) or IgG isotype (control). Similarly, CD8+ T cells were stimulated with 50 ng/mL IL-27, 62.5 nM STAT-3′ inhibitor Stattic (Selleck), or 100 μM STAT1 inhibitor Fludarabine (Selleck) for STAT1/3 blocking tests. The cells mentioned above were dealt with 48 h then subjected to further analysis.
IL-27 production measurements
IL-27 levels were measured with ELISA kits according to the manufacturer’s instructions (Sangon Biotech).
Immunoblot analysis
Cells were directly lysed and subjected to 10% SDS-PAGE. Immunoblotting was performed by transferring the proteins to nitrocellulose membranes (Schleicher & Schuell Microscience) with a Mini Trans-Blot apparatus (Bio-Rad). Membranes were incubated overnight at 4°C with the following specific primary antibodies (1:1000): anti-p-STAT3, anti-p-STAT1, anti-STAT1, anti-STAT3, and anti-β-actin (Cell Signaling Technology). After the membranes were washed, subsequent incubations with appropriate IRDye 800CW- or Alexa Fluor 680-conjugated secondary antibodies (1:5000, Abcam) were conducted for 1 h at RT, and the signals were visualized with the Odyssey Infrared Imaging System.
Real-time PCR
mRNA expression levels were measured by the SYBR green-based real-time qPCR assay (Yeasen). The data were collected and quantitatively analyzed on the ABI Prism 7900HT Sequence Detection System (Applied Biosystems). The sequences of the primers were as follows: CD274 (forward 5′-ACAGCTGAATTGGTCATCCC-3′; reverse 5′-TGTCAGTGCTACACCAAGGC-3′), and GAPDH (forward 5′-GCC ACC CAG AAG ACT GTG GAT GGC-3; reverse 5′CATGTAGGCCATGAGGTCCACCAC-3′). The data were analyzed according to the following equations: target mRNA expression = 2ˆ-(deltaCt), with ΔCt = (GAPDH Ct-target mRNA Ct).
Proteome profilerTM antibody arrays
Proteome ProfilerTM antibody arrays were used to measure cytokine levels in cell line culture supernatants according to the manufacturer’s instructions (R&D Systems).
Smart-RNA sequencing
CD8 T cells were stimulated with IL-27 for 48 h, CD8+PD-L1+ and CD8+PD-L1- T cells were sorted into tubes containing lysis buffer, and and total RNA were extracted by using the Quick-RNA Microprep Kit (Zymo). Then transcriptome amplifications were performed by using Single Cell Full Length mRNA-Amplification Kit (Vazyme). The amplified cDNA products were purified with DNA beads (KAPA) to eliminate short fragments (less than 500 bp). At this step, the concentration of each sample was quantified with Qubit HsDNA kits (Invitrogen), and libraries were then constructed with the TruePrep DNA Library Prep Kit V2 for Illumina (Vazyme). Finally, the libraries were sequenced on an Illumina Nova6000 sequencer (Illumina). The workflow of the data analysis followed the standard RNA-seq procedure.
GEO sc-RNA sequence data analysis
Published single-cell RNA-seq data for tumor-infiltrating T cells in NSCLC were used to evaluate differences in gene expression between PD-L1+ T cells and naive T cells. The normalized expression data and annotated information of GSE99254 were downloaded. CD8 T cells derived from tumor tissues were used for subsequent analysis, and the CD274 expression values on cells larger than 4.5 were identified as PDL1+CD8+ T cells. Patients whose PD-L1+CD8+ cell number was less than four were excluded. Based on the annotations in the original research, the CD8-C1−LEF1 cluster was selected as naive CD8 T cells.
Wilcox analysis of differentially expressed genes was performed using the ‘FindMarkers’ function in the R package Seurat v3.
Quantification and statistical analysis
Statistical analyses were performed with Prism8. The statistical methods used for each analysis were described in the “Methods” sections and figure legends.
Acknowledgments
This work was supported by grants from the National Natural Science Foundation of China [81873863 and 82071753 to Y.Z., 81672363 to L.S., 81871448 and 22077079 to X.D.], the Shanghai Municipal Education Commission—Gaofeng Clinical Medicine Grant Support [20161315 to Y.Z.], the Key Specialty Development Program of Xin Hua Hospital and Shanghai Municipal Health Commission(to L.S.), Clinical Research Plan of SHDC (Project No. 16CR3057A, to L.S.), Medicine and Engineering Cross Research Foundation of Shanghai Jiao Tong University (Project No. YG2017ZD02 to L.S.).
Authors contribution
L.S., X.D., and Y.Z. designed experiments. Y.Z., L.H., Z.C., B.Z., Y.L., R.H., H.X., and S.C. performed the experiments. Y.Z., L.H., Z.C., Y.M., G.X., and J.Y. analyzed experimental data. L.S., X.D, Y.Z., L.H., Z.C. wrote the manuscript, with all authors contributing to the writing and providing feedback.
Declaration of interests
The authors declare no competing interests.
Published: February 18, 2022
Footnotes
Supplemental information can be found online at https://doi.org/10.1016/j.isci.2022.103785.
Contributor Information
Yingxia Zheng, Email: zhengyingxia@xinhuamed.com.cn.
Xianting Ding, Email: dingxianting@sjtu.edu.cn.
Lisong Shen, Email: lisongshen@hotmail.com.
Supplemental information
Data and code availability
Smart seq data have been deposited at GEO and are publicly available as of the date of publication. Accession numbers are listed in the key resources table. This paper does not report original code. Any additional information required to reanalyze the data reported in this paper is available from the lead contact upon request.
References
- Appay V., Dunbar P.R., Callan M., Klenerman P., Gillespie G.M., Papagno L., Ogg G.S., King A., Lechner F., Spina C.A., et al. Memory CD8+ T cells vary in differentiation phenotype in different persistent virus infections. Nat. Med. 2002;8:379–385. doi: 10.1038/nm0402-379. [DOI] [PubMed] [Google Scholar]
- Arruvito L., Payaslian F., Baz P., Podhorzer A., Billordo A., Pandolfi J., Semeniuk G., Arribalzaga E., Fainboim L. Identification and clinical relevance of naturally occurring human CD8+HLA-DR+ regulatory T cells. J. Immunol. 2014;193:4469–4476. doi: 10.4049/jimmunol.1401490. [DOI] [PubMed] [Google Scholar]
- Azizi E., Carr A.J., Plitas G., Cornish A.E., Konopacki C., Prabhakaran S., Nainys J., Wu K., Kiseliovas V., Setty M., et al. Single-cell map of diverse immune phenotypes in the breast tumor microenvironment. Cell. 2018;174:1293–1308 e36. doi: 10.1016/j.cell.2018.05.060. [DOI] [PMC free article] [PubMed] [Google Scholar]
- Bottcher C., Schlickeiser S., Sneeboer M.A.M., Kunkel D., Knop A., Paza E., Fidzinski P., Kraus L., Snijders G.J.L., Kahn R.S., et al. Human microglia regional heterogeneity and phenotypes determined by multiplexed single-cell mass cytometry. Nat. Neurosci. 2019;22:78–90. doi: 10.1038/s41593-018-0290-2. [DOI] [PubMed] [Google Scholar]
- Braud V.M., Biton J., Becht E., Knockaert S., Mansuet-Lupo A., Cosson E., Damotte D., Alifano M., Validire P., Anjuere F., et al. Expression of LLT1 and its receptor CD161 in lung cancer is associated with better clinical outcome. Oncoimmunology. 2018;7 doi: 10.1080/2162402X.2017.1423184. [DOI] [PMC free article] [PubMed] [Google Scholar]
- Chaput N., Louafi S., Bardier A., Charlotte F., Vaillant J.C., Menegaux F., Rosenzwajg M., Lemoine F., Klatzmann D., Taieb J. Identification of CD8+CD25+Foxp3+ suppressive T cells in colorectal cancer tissue. Gut. 2009;58:520–529. doi: 10.1136/gut.2008.158824. [DOI] [PubMed] [Google Scholar]
- Chen S., Crabill G.A., Pritchard T.S., Mcmiller T.L., Wei P., Pardoll D.M., Pan F., Topalian S.L. Mechanisms regulating PD-L1 expression on tumor and immune cells. J. Immunother. Cancer. 2019;7:305. doi: 10.1186/s40425-019-0770-2. [DOI] [PMC free article] [PubMed] [Google Scholar]
- Christophersen A., Lund E.G., Snir O., Sola E., Kanduri C., Dahal-Koirala S., Zuhlke S., Molberg O., Utz P.J., Rohani-Pichavant M., et al. Distinct phenotype of CD4(+) T cells driving celiac disease identified in multiple autoimmune conditions. Nat. Med. 2019;25:734–737. doi: 10.1038/s41591-019-0403-9. [DOI] [PMC free article] [PubMed] [Google Scholar]
- d'Almeida S.M., Kauffenstein G., Roy C., Basset L., Papargyris L., Henrion D., Catros V., Ifrah N., Descamps P., Croue A., et al. The ecto-ATPDase CD39 is involved in the acquisition of the immunoregulatory phenotype by M-CSF-macrophages and ovarian cancer tumor-associated macrophages: regulatory role of IL-27. Oncoimmunology. 2016;5 doi: 10.1080/2162402X.2016.1178025. [DOI] [PMC free article] [PubMed] [Google Scholar]
- Daley D., Zambirinis C.P., Seifert L., Akkad N., Mohan N., Werba G., Barilla R., Torres-Hernandez A., Hundeyin M., Mani V.R.K., et al. Gammadelta T cells support pancreatic oncogenesis by restraining alphabeta T cell activation. Cell. 2016;166:1485–1499 e15. doi: 10.1016/j.cell.2016.07.046. [DOI] [PMC free article] [PubMed] [Google Scholar]
- Diskin B., Adam S., Cassini M.F., Sanchez G., Liria M., Aykut B., Buttar C., LI E., Sundberg B., Salas R.D., et al. PD-L1 engagement on T cells promotes self-tolerance and suppression of neighboring macrophages and effector T cells in cancer. Nat. Immunol. 2020;21:442–454. doi: 10.1038/s41590-020-0620-x. [DOI] [PubMed] [Google Scholar]
- Dong W., Wu X., Ma S., Wang Y., Nalin A.P., Zhu Z., Zhang J., Benson D.M., He K., Caligiuri M.A., Yu J. The mechanism of anti-PD-L1 antibody efficacy against PD-L1-negative tumors identifies NK cells expressing PD-L1 as a cytolytic effector. Cancer Discov. 2019;9:1422–1437. doi: 10.1158/2159-8290.CD-18-1259. [DOI] [PMC free article] [PubMed] [Google Scholar]
- Fergusson J.R., Smith K.E., Fleming V.M., Rajoriya N., Newell E.W., Simmons R., Marchi E., Bjorkander S., Kang Y.H., Swadling L., et al. CD161 defines a transcriptional and functional phenotype across distinct human T cell lineages. Cell Rep. 2014;9:1075–1088. doi: 10.1016/j.celrep.2014.09.045. [DOI] [PMC free article] [PubMed] [Google Scholar]
- Guo X., Zhang Y., Zheng L., Zheng C., Song J., Zhang Q., Kang B., Liu Z., Jin L., Xing R., et al. Global characterization of T cells in non-small-cell lung cancer by single-cell sequencing. Nat. Med. 2018;24:978–985. doi: 10.1038/s41591-018-0045-3. [DOI] [PubMed] [Google Scholar]
- Herbst R.S., Soria J.C., Kowanetz M., Fine G.D., Hamid O., Gordon M.S., Sosman J.A., Mcdermott D.F., Powderly J.D., Gettinger S.N., et al. Predictive correlates of response to the anti-PD-L1 antibody MPDL3280A in cancer patients. Nature. 2014;515:563–567. doi: 10.1038/nature14011. [DOI] [PMC free article] [PubMed] [Google Scholar]
- Hoji A., Connolly N.C., Buchanan W.G., Rinaldo C.R., Jr. CD27 and CD57 expression reveals atypical differentiation of human immunodeficiency virus type 1-specific memory CD8+ T cells. Clin. Vaccin. Immunol. 2007;14:74–80. doi: 10.1128/CVI.00250-06. [DOI] [PMC free article] [PubMed] [Google Scholar]
- Horlad H., Ma C., Yano H., Pan C., Ohnishi K., Fujiwara Y., Endo S., Kikukawa Y., Okuno Y., Matsuoka M., et al. An IL-27/Stat3 axis induces expression of programmed cell death 1 ligands (PD-L1/2) on infiltrating macrophages in lymphoma. Cancer Sci. 2016;107:1696–1704. doi: 10.1111/cas.13065. [DOI] [PMC free article] [PubMed] [Google Scholar]
- Jansen C.S., Prokhnevska N., Master V.A., Sanda M.G., Carlisle J.W., Bilen M.A., Cardenas M., Wilkinson S., Lake R., Sowalsky A.G., et al. An intra-tumoral niche maintains and differentiates stem-like CD8 T cells. Nature. 2019;576:465–470. doi: 10.1038/s41586-019-1836-5. [DOI] [PMC free article] [PubMed] [Google Scholar]
- Jones T.R., Kang I.H., Wheeler D.B., Lindquist R.A., Papallo A., Sabatini D.M., Golland P., Carpenter A.E. CellProfiler Analyst: data exploration and analysis software for complex image-based screens. BMC Bioinformatics. 2008;9:482. doi: 10.1186/1471-2105-9-482. [DOI] [PMC free article] [PubMed] [Google Scholar]
- Kargl J., Busch S.E., Yang G.H., Kim K.H., Hanke M.L., Metz H.E., Hubbard J.J., Lee S.M., Madtes D.K., Mcintosh M.W., Houghton A.M. Neutrophils dominate the immune cell composition in non-small cell lung cancer. Nat. Commun. 2017;8:14381. doi: 10.1038/ncomms14381. [DOI] [PMC free article] [PubMed] [Google Scholar]
- Kowanetz M., Zou W., Gettinger S.N., Koeppen H., Kockx M., Schmid P., Kadel E.E., 3rd, Wistuba I., Chaft J., Rizvi N.A., et al. Differential regulation of PD-L1 expression by immune and tumor cells in NSCLC and the response to treatment with atezolizumab (anti-PD-L1) Proc. Natl. Acad. Sci. U S A. 2018;115:E10119–E10126. doi: 10.1073/pnas.1802166115. [DOI] [PMC free article] [PubMed] [Google Scholar]
- Lavin Y., Kobayashi S., Leader A., Amir E.D., Elefant N., Bigenwald C., Remark R., Sweeney R., Becker C.D., Levine J.H., et al. Innate immune landscape in early lung adenocarcinoma by paired single-cell analyses. Cell. 2017;169:750–765 e17. doi: 10.1016/j.cell.2017.04.014. [DOI] [PMC free article] [PubMed] [Google Scholar]
- Lee S.J., Jang B.C., Lee S.W., Yang Y.I., Suh S.I., Park Y.M., Oh S., Shin J.G., Yao S., Chen L., Choi I.H. Interferon regulatory factor-1 is prerequisite to the constitutive expression and IFN-gamma-induced upregulation of B7-H1 (CD274) FEBS Lett. 2006;580:755–762. doi: 10.1016/j.febslet.2005.12.093. [DOI] [PubMed] [Google Scholar]
- Levine J.H., Simonds E.F., Bendall S.C., Davis K.L., Amir El A.D., Tadmor M.D., Litvin O., Fienberg H.G., Jager A., Zunder E.R., et al. Data-driven phenotypic dissection of AML reveals progenitor-like cells that correlate with prognosis. Cell. 2015;162:184–197. doi: 10.1016/j.cell.2015.05.047. [DOI] [PMC free article] [PubMed] [Google Scholar]
- Li J.X., Huang J.M., Jiang Z.B., Li R.Z., Sun A., Leung E.L.-H., Yan P.Y. Current clinical progress of PD-1/PD-L1 immunotherapy and potential combination treatment in non-small cell lung cancer. Integr. Cancer Ther. 2019;18 doi: 10.1177/1534735419890020. 1534735419890020. [DOI] [PMC free article] [PubMed] [Google Scholar]
- Loke P., Allison J.P. PD-L1 and PD-L2 are differentially regulated by Th1 and Th2 cells. Proc. Natl. Acad. Sci. U S A. 2003;100:5336–5341. doi: 10.1073/pnas.0931259100. [DOI] [PMC free article] [PubMed] [Google Scholar]
- Lukas yani S., Keller M., Melzer F.L., Weinberger B., Pangrazzi L., Sopper S., Trieb K., Lobina M., Orru V., Fiorillo E., et al. CD8(+)HLADR(+) regulatory T cells change with aging: they increase in number, but lose checkpoint inhibitory molecules and suppressive function. Front. Immunol. 2018;9:1201. doi: 10.3389/fimmu.2018.01201. [DOI] [PMC free article] [PubMed] [Google Scholar]
- Memon H., Patel B.M. Immune checkpoint inhibitors in non-small cell lung cancer: a bird's eye view. Life Sci. 2019;233 doi: 10.1016/j.lfs.2019.116713. [DOI] [PubMed] [Google Scholar]
- Meng X., Liu Y., Zhang J., Teng F., Xing L., Yu J. PD-1/PD-L1 checkpoint blockades in non-small cell lung cancer: new development and challenges. Cancer Lett. 2017;405:29–37. doi: 10.1016/j.canlet.2017.06.033. [DOI] [PubMed] [Google Scholar]
- Mony J.T., Schuchert M.J. Prognostic implications of heterogeneity in intra-tumoral immune composition for recurrence in early stage lung cancer. Front. Immunol. 2018;9:2298. doi: 10.3389/fimmu.2018.02298. [DOI] [PMC free article] [PubMed] [Google Scholar]
- Ngiow S.F., Young A., Jacquelot N., YamazakI T., Enot D., Zitvogel L., Smyth M.J. A threshold level of intratumor CD8+ T-cell PD1 expression dictates therapeutic response to anti-PD1. Cancer Res. 2015;75:3800–3811. doi: 10.1158/0008-5472.CAN-15-1082. [DOI] [PubMed] [Google Scholar]
- Noman M.Z., Desantis G., Janji B., Hasmim M., Karray S., Dessen P., Bronte V., Chouaib S. PD-L1 is a novel direct target of HIF-1alpha, and its blockade under hypoxia enhanced MDSC-mediated T cell activation. J. Exp. Med. 2014;211:781–790. doi: 10.1084/jem.20131916. [DOI] [PMC free article] [PubMed] [Google Scholar]
- Ohkawa T., Seki S., Dobashi H., Koike Y., Habu Y., Ami K., Hiraide H., Sekine I. Systematic characterization of human CD8+ T cells with natural killer cell markers in comparison with natural killer cells and normal CD8+ T cells. Immunology. 2001;103:281–290. doi: 10.1046/j.1365-2567.2001.01248.x. [DOI] [PMC free article] [PubMed] [Google Scholar]
- Okazaki T., Honjo T. PD-1 and PD-1 ligands: from discovery to clinical application. Int. Immunol. 2007;19:813–824. doi: 10.1093/intimm/dxm057. [DOI] [PubMed] [Google Scholar]
- Olson B.M., Jankowska-Gan E., Becker J.T., Vignali D.A., Burlingham W.J., Mcneel D.G. Human prostate tumor antigen-specific CD8+ regulatory T cells are inhibited by CTLA-4 or IL-35 blockade. J. Immunol. 2012;189:5590–5601. doi: 10.4049/jimmunol.1201744. [DOI] [PMC free article] [PubMed] [Google Scholar]
- Park H.J., Park J.S., Jeong Y.H., Son J., Ban Y.H., Lee B.H., Chen L., Chang J., Chung D.H., Choi I., Ha S.J. PD-1 upregulated on regulatory T cells during chronic virus infection enhances the suppression of CD8+ T cell immune response via the interaction with PD-L1 expressed on CD8+ T cells. J. Immunol. 2015;194:5801–5811. doi: 10.4049/jimmunol.1401936. [DOI] [PubMed] [Google Scholar]
- Ramaglia V., Sheikh-Mohamed S., Legg K., Park C., Rojas O.L., Zandee S., Fu F., Ornatsky O., Swanson E.C., Pitt D., et al. Multiplexed imaging of immune cells in staged multiple sclerosis lesions by mass cytometry. Elife. 2019;8 doi: 10.7554/eLife.48051. [DOI] [PMC free article] [PubMed] [Google Scholar]
- Santini F.C., Rudin C.M. Atezolizumab for the treatment of non-small cell lung cancer. Expert Rev. Clin. Pharmacol. 2017;10:935–945. doi: 10.1080/17512433.2017.1356717. [DOI] [PMC free article] [PubMed] [Google Scholar]
- Schapiro D., Jackson H.W., Raghuraman S., Fischer J.R., Zanotelli V.R.T., Schulz D., Giesen C., Catena R., Varga Z., Bodenmiller B. histoCAT: analysis of cell phenotypes and interactions in multiplex image cytometry data. Nat. Methods. 2017;14:873–876. doi: 10.1038/nmeth.4391. [DOI] [PMC free article] [PubMed] [Google Scholar]
- Sharma P., Allison J.P. The future of immune checkpoint therapy. Science. 2015;348:56–61. doi: 10.1126/science.aaa8172. [DOI] [PubMed] [Google Scholar]
- Stankovic B., Bjorhovde H.A.K., Skarshaug R., Aamodt H., Frafjord A., Muller E., Hammarstrom C., Beraki K., Baekkevold E.S., Woldbaek P.R., et al. Immune cell composition in human non-small cell lung cancer. Front. Immunol. 2018;9:3101. doi: 10.3389/fimmu.2018.03101. [DOI] [PMC free article] [PubMed] [Google Scholar]
- Stathopoulou C., Gangaplara A., Mallett G., Flomerfelt F.A., Liniany L.P., Knight D., Samsel L.A., Berlinguer-Palmini R., Yim J.J., Felizardo T.C., et al. PD-1 inhibitory receptor downregulates asparaginyl endopeptidase and maintains Foxp3 transcription factor stability in induced regulatory T cells. Immunity. 2018;49:247–263 e7. doi: 10.1016/j.immuni.2018.05.006. [DOI] [PMC free article] [PubMed] [Google Scholar]
- Stuart T., Butler A., Hoffman P., Hafemeister C., Papalexi E., Mauck W.M., 3rd, Hao Y., Stoeckius M., Smibert P., Satija R. Comprehensive Integration of Single-Cell Data. Cell. 2019;177:1888–1902.e21. doi: 10.1016/j.cell.2019.05.031. [DOI] [PMC free article] [PubMed] [Google Scholar]
- Stuart G., Taylor G., Bancej C.M., Beaulac J., Colgan T., Franco E.L., Kropp R.Y., Lotocki R., Mai V., Mclachlin C.M., et al. Society of Gynecologic Oncologists of, C., Cervical Cancer Prevention Network of, C. and Canadian Coordinating Office for Health Technology, A Report of the 2003 pan-Canadian forum on cervical cancer prevention and control. J. Obstet. Gynaecol. Can. 2004;26:1004–1028. doi: 10.1016/s1701-2163(16)30423-6. [DOI] [PubMed] [Google Scholar]
- Tumeh P.C., Harview C.L., Yearley J.H., Shintaku I.P., Taylor E.J., Robert L., Chmielowski B., Spasic M., Henry G., Ciobanu V., et al. PD-1 blockade induces responses by inhibiting adaptive immune resistance. Nature. 2014;515:568–571. doi: 10.1038/nature13954. [DOI] [PMC free article] [PubMed] [Google Scholar]
- Wu R.C., Liu S., Chacon J.A., Wu S., Li Y., Sukhumalchandra P., Murray J.L., Molldrem J.J., Hwu P., Pircher H., et al. Detection and characterization of a novel subset of CD8(+)CD57(+) T cells in metastatic melanoma with an incompletely differentiated phenotype. Clin. Cancer Res. 2012;18:2465–2477. doi: 10.1158/1078-0432.CCR-11-2034. [DOI] [PMC free article] [PubMed] [Google Scholar]
- Wu S.P., Liao R.Q., Tu H.Y., Wang W.J., Dong Z.Y., Huang S.M., Guo W.B., Gou L.Y., Sun H.W., Zhang Q., et al. Stromal PD-L1-positive regulatory T cells and PD-1-positive CD8-positive T cells define the response of different subsets of non-small cell lung cancer to PD-1/PD-L1 blockade immunotherapy. J. Thorac. Oncol. 2018;13:521–532. doi: 10.1016/j.jtho.2017.11.132. [DOI] [PubMed] [Google Scholar]
- Zhang L., LI Z., Skrzypczynska K.M., Fang Q., Zhang W., O'Brien S.A., He Y., Wang L., Zhang Q., Kim A., et al. Single-cell analyses inform mechanisms of myeloid-targeted therapies in colon cancer. Cell. 2020;181:442–459 e29. doi: 10.1016/j.cell.2020.03.048. [DOI] [PubMed] [Google Scholar]
- Zheng C., Zheng L., Yoo J.K., Guo H., Zhang Y., Guo X., Kang B., Hu R., Huang J.Y., Zhang Q., et al. Landscape of infiltrating T cells in liver cancer revealed by single-cell sequencing. Cell. 2017;169:1342–1356 e16. doi: 10.1016/j.cell.2017.05.035. [DOI] [PubMed] [Google Scholar]
- Zhu Z., Yang C., Wen L., Liu L., Zuo X., Zhou F., Gao J., Zheng X., Shi Y., Zhu C., et al. Bach2 regulates aberrant activation of B cell in systemic lupus erythematosus and can be negatively regulated by BCR-ABL/PI3K. Exp. Cell Res. 2018;365:138–144. doi: 10.1016/j.yexcr.2018.02.034. [DOI] [PubMed] [Google Scholar]
Associated Data
This section collects any data citations, data availability statements, or supplementary materials included in this article.
Supplementary Materials
Data Availability Statement
Smart seq data have been deposited at GEO and are publicly available as of the date of publication. Accession numbers are listed in the key resources table. This paper does not report original code. Any additional information required to reanalyze the data reported in this paper is available from the lead contact upon request.