

Abstract
Objective:
Pain is associated with increased risk for harmful substance use. Substance use also may increase levels of pain, suggesting that these two factors may reciprocally increase risk. The current study examined the reciprocal association between pain and substance use outcomes (i.e., alcohol, cannabis, and painkillers/sedatives/tranquilizers [PSTs]) longitudinally in a nationally representative cohort of non-incarcerated U.S. citizens.
Method:
Adult (≥18 years old) survey data from Waves 2–4 of the Population Assessment of Tobacco and Health (PATH) study were used. The PATH is a nationally representative multiwave cohort survey (Wave 2: October 2014–October 2015, Wave 3: October 2015–October 2016, Wave 4: December 2016–January 2018). Cross-lagged panel models were used to estimate the reciprocal effects of pain intensity and substance use on subsequent changes in both variables. Substance use outcomes were substance use problems and greater-than-weekly use for cannabis and PSTs, total past-month drinks, and alcohol use exceeding moderate drinking guidelines. All models controlled for autoregressive effects and demographic covariates.
Results:
Pain intensity showed a positive prospective association with all substance use outcomes. All cannabis and PST use were positively associated with subsequent pain intensity. Alcohol use problems also predicted higher levels of pain intensity. Neither total past-month drinks nor exceeding moderate drinking guidelines predicted subsequent pain intensity.
Conclusions:
Pain and substance use show a reciprocal association and may act in a positive feedback loop to worsen both conditions over time in people with a history of use.
Pain is an unpleasant sensory-emotional experience that is associated with actual or potential tissue damage (Williams & Craig, 2016). It is a common health concern among adults in the United States (Nahin, 2015) and a leading cause of disability globally (Vos et al., 2017). There is a well-documented link between pain and substance use (Ditre et al., 2019). Much of the research in this area has been cross-sectional in nature, showing that people who are experiencing pain use substances at higher rates (Lawton & Simpson, 2009; Zvolensky et al., 2011) and are more likely to meet criteria for substance use disorders (SUDs; McDermott et al., 2018). Although these studies are crucial for identifying patterns of symptom co-occurrence, it is impossible to determine causal associations between conditions based on cross-sectional data alone.
Less is known about the longitudinal associations between pain and substance use. Longitudinal analysis is necessary to elucidate potential causal pathways between pain and substance use behavior. The bulk of prospective research on pain and substance use has documented impact of pain on treatment outcomes in people participating in SUD treatment. Among this clinical population, those with pain conditions experience poorer treatment outcomes and are less likely to remain abstinent from alcohol or other drugs compared to their peers without pain conditions (Caldeiro et al., 2008; Larson et al., 2007). Similarly, patients receiving treatment in pain management clinics use substances, including cannabis and prescription painkillers, at higher rates compared with the general population (Smiley-McDonald et al., 2017). Episodes of elevated pain seem to constitute risk periods for individuals receiving SUD treatment. Patients in a clinical trial of buprenorphine-naloxone for opioid dependence showed increased odds of opioid use following periods of high pain severity (Griffin et al., 2016). These studies support a causal pathway from pain to poor substance use outcomes. Although the mechanisms by which pain increases rates of substance use are not fully specified, most theoretical models and clinical wisdom suggest that pain motivates substance use via negative reinforcement learning (see Ditre et al., 2019, for review). That is, people experiencing pain are motivated to use a substance to achieve acute reduction in pain.
Other research has examined the impact of substance use on pain outcomes. Although many drugs of abuse can reduce pain experiences in the short term, sustained patterns of use may worsen pain. Several studies have shown that heavy alcohol use predicts increased likelihood of chronic pain conditions (Holmes et al., 2010) as well as increased pain severity and interference following treatment for acute injury (Castillo et al., 2006). Other studies find that alcohol use is a risk factor for developing specific pain conditions (see Zale et al., 2015, for review). Further, opioid-induced hyperalgesia is a well-documented phenomenon by which chronic opioid use can increase pain sensitivity (Angst & Clark, 2006), and longitudinal clinical research finds that pain patients who engage in frequent opioid use report higher levels of pain severity at follow-up compared with those who use infrequently or discontinue their use (Turner et al., 2016). Existing research on cannabis use and pain is primarily clinical and examines ameliorative effects in pain patients over relatively brief follow-up periods, and a recent systematic review found evidence for its beneficial effect on most pain conditions to be inconclusive (Nugent et al., 2017). A more recent study found that cannabis use predicted increased levels of pain severity and lower self-efficacy for managing pain in patients receiving opioid therapy for chronic pain (Campbell et al., 2018).
Taken together, these two sets of findings suggest a bidirectional causal association between pain and substance use. Along these lines, Ditre and colleagues (2019) offered a recent comprehensive review of the literature and proposed that pain and substance use may interact in a positive feedback loop, which acts to maintain or exacerbate both conditions over time by dysregulating neural systems involved in both pain and reward processing. Previous prospective studies have separately examined whether pain predicts later changes in substance use outcomes and vice versa. Given the evidence for bidirectional risk between pain and substance use, cross-lagged associations will provide a more comprehensive evaluation of the association between these health conditions. Another limitation in the literature is that most previous studies have examined these associations in clinical populations (e.g., those seeking treatment for SUDs or pain conditions; Ditre et al., 2019). Although pain (Nahin, 2015) and substance use (Substance Abuse and Mental Health Services Administration, 2019) are both common in the general population, much of the research in this area has focused on populations with clinically significant problems in one or both areas. Studies in the general population are needed to better understand the associations between pain and substance use among people who have not necessarily engaged with treatment (Ditre et al., 2019). To our knowledge, no research to date has examined bidirectional associations between pain and substance use using a general population sample.
The current study addressed these gaps in the literature by examining the cross-lagged association between pain intensity and substance use in three waves of the Population Assessment of Tobacco and Health (PATH) survey (Waves 2, 3, and 4, adult surveys). We examined several classes of substances, including (a) alcohol, (b) cannabis, and (c) painkillers/sedatives/tranquilizers (PSTs). We chose to examine these substance classes based on prior work suggesting that use of these substances influences pain outcomes, either acutely or following chronic use (Lee et al., 2011; McDermott et al., 2018). We examined both substance use frequency- and problem-based outcomes to better represent various levels of substance involvement. We hypothesized reciprocal cross-lagged associations between substance use variables and reported pain intensity. That is, we expected that substance use would predict increases in pain intensity during subsequent waves and that pain intensity would predict increases in substance use.
Method
Data for this study were drawn from the three most recent waves (Waves 2–4) of the PATH study adult survey public use files (Wave 2: 2014–2015; Wave 3: 2015–2016; Wave 4: 2016–2017). The PATH study was developed and implemented as a collaboration between the National Institute on Drug Abuse (NIDA) and the Center for Tobacco Products (CTP) within the Food and Drug Administration (FDA). The PATH survey was conducted by Westat and approved by their institutional review board. Computer-assisted self-interviews were conducted in English or Spanish to gather information on tobacco use and associated behavioral, health, and substance use outcomes in a nationally representative, longitudinal cohort study of noninstitutionalized civilian adults in the United States who were 18 years or older. The PATH Study recruitment used a stratified, address-based, area-probability sampling design that oversampled tobacco users, African Americans, and young adults ages 18–24 years. The overall weighted response rate was 78.4%. Additional details about the PATH study methodology are reported elsewhere (Hyland et al., 2017).
Pain intensity
At each wave, participants rated their level of pain intensity according to the following item: “In the past 7 days, how would you rate your pain on average on a scale from 0 to 10 where 0 is no pain and 10 is the worst pain imaginable.”
Substance use outcomes
Alcohol use
Quantity/frequency-based alcohol use outcomes were calculated from past-month alcohol use. Outcomes were calculated for each wave based on identical questions administered at each time point. Alcohol use quantity/frequency were assessed by the questions: “In the past 30 days, how many days did you have one or more alcoholic drinks?” and “On average, on those days that you drank in the past 30 days, how many alcoholic drinks did you usually have each day?”
Outcome variables derived from this measure included (a) alcohol use exceeding low-risk guidelines and (b) past-month total drinks. Alcohol use exceeding low-risk drinking guidelines was determined according to standardized National Institute on Alcohol Abuse and Alcoholism (2005) criteria. Participants who reported consuming more than 7/14 (women/men) drinks per week on average or reported an average quantity of more than 3/4 (women/men) drinks per drinking day were classified as exceeding low-risk drinking guidelines. The total drinks variable was calculated as Average Quantity × Frequency.
Cannabis and painkiller/sedative/tranquilizer use
Participants reported whether they engaged in weekly cannabis and/or PST use over the month preceding each assessment. This was assessed by the item, “When was the last time you used alcohol or other drugs weekly or more often?” Participants who endorsed weekly use in the past month further specified which substances they used. They were classified as weekly users according to their responses to these questions. Participants were instructed not to report on drugs that were prescribed to them.
Substance use problems
Participants also reported on the social and physical problems during the past 30 days resulting from their substance use. Specifically, they reported whether their substance use caused them to experience any of the following problems during the past month: physical withdrawal, problems with school or work, social problems, spending a lot of time getting the substance, and/or spending a lot of time recovering from the effects of the substance. Participants who endorsed any problems resulting from substance use in the past month specified which substances caused their problems. In the current study, participants were categorized as experiencing problems with each substance (i.e., alcohol use problems, cannabis use problems, PST use problems) based on their responses to these questions.
We also calculated a substance use problem count variable indicating the total number of past-month problems endorsed by participants who reported experiencing those problems as a result of their alcohol, cannabis, or PST use (range: 0–6).
Covariates
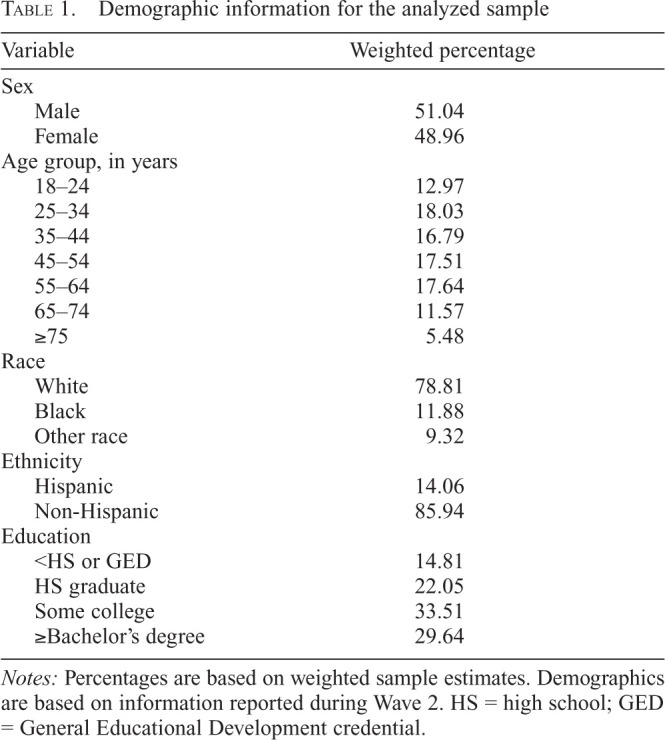
The following covariate set was included in all analyses: age, sex, education, race, and ethnicity. All demographic covariates were treated as time invariant and based on the earliest available observation from the participant. For available variables (i.e., age, gender, race, ethnicity), we included imputed observations to reduce missing data rates (see PATH data notes for imputation procedures). For covariates without imputed values available (i.e., education level), we used modal replacement for missing observations. All demographic covariates were treated as nominal (see Table 1 for categories).
Table 1.
Demographic information for the analyzed sample
| Variable | Weighted percentage |
|---|---|
| Sex | |
| Male | 51.04 |
| Female | 48.96 |
| Age group, in years | |
| 18–24 | 12.97 |
| 25–34 | 18.03 |
| 35–44 | 16.79 |
| 45–54 | 17.51 |
| 55–64 | 17.64 |
| 65–74 | 11.57 |
| > 75 | 5.48 |
| Race | |
| White | 78.81 |
| Black | 11.88 |
| Other race | 9.32 |
| Ethnicity | |
| Hispanic | 14.06 |
| Non-Hispanic | 85.94 |
| Education | |
| <HS or GED | 14.81 |
| HS graduate | 22.05 |
| Some college | 33.51 |
| ≥Bachelor’s degree | 29.64 |
Notes: Percentages are based on weighted sample estimates. Demographics are based on information reported during Wave 2. HS = high school; GED = General Educational Development credential.
Statistical analysis
All statistical analyses were conducted using Stata Version 16 (StataCorp LP, College Station, TX). Generalized structural equation models (gSEMs) were used to accommodate the non-Gaussian distributions of several outcome variables using generalized linear models. The general structure of the cross-lagged panel models is presented in Figure 1. As shown in this figure, comparable pathways were constrained to be identical across waves. All parameters were estimated using maximum likelihood. To incorporate the appropriate longitudinal weights, only participants who provided data at Wave 4 were included in the analyses. Separate analytic samples were created for each substance type. For alcohol, cannabis, and PST, the analytic sample was limited to individuals who reported using that substance at least once in their life. Individuals who did not endorse any history of use at Wave 2 but reported using during a later wave also were included in each analytic sample. We chose to omit individuals reporting no previous exposure to the drug class in question. We reasoned that it was unlikely that pain would motivate substance use among individuals with no prior experience with a specific substance. All analyses used Wave 4 longitudinal weights to produce nationally representative estimates and to account for participant dropout between waves. Wave 4 replicate weights were used to account for design variables, and variance terms were estimated using the balanced repeated replication method with Fay’s adjustment set to .3 (as recommended in the PATH data notes).
Figure 1.

Cross-lagged panel model with pattern of constrained effects. Pathways with matching labels were set to be identical. All pathways controlled for the following covariate set: age group, race, ethnicity, sex, and education. Substance use outcomes were modeled using logistic or negative binomial models.
The primary analyses tested the cross-lagged associations between pain intensity and each substance use outcome. All equations controlled for the past wave level of the outcome. Eight separate gSEMs were estimated for each substance use outcome variable (i.e., exceeding moderate drinking guidelines, total drinks, weekly cannabis use, weekly PST use, alcohol-related problems, cannabis-related problems, PST-related problems, total number of problems). For equations with count-based dependent variables (i.e., total drinks, number of substance use problems), we used negative binomial regression with coefficients reported as adjusted rate ratios (aRRs). For equations with binomial dependent variables (i.e., exceeding moderate drinking guidelines, weekly cannabis use, weekly PST use, alcohol-related problems, cannabis-related problems, PST-related problems), we used logistic regression with coefficients reported as adjusted odds ratios (aORs). For equations in which pain intensity ratings were the dependent variable, we used ordinary least squares regression. Marginal mean estimates (i.e., model predicted odds of meeting respective substance use criteria or predicted pain intensity or number of substance use problems) are reported for selected outcomes to aid in model interpretation. For continuous predictors, marginal estimates are reported at 1.5 SD above the mean level of the predictor. For these marginal estimates, all other covariates were held at the mean value. All the covariates described above were included in all equations constituting the gSEMs.
Results
Demographic and descriptive data
Demographic information is presented in Table 1. Descriptive information regarding substance use and pain outcomes among the analyzed sample are presented in Table 2. Only participants who reported using each respective substance at least once in their life were included in the parameter estimates or gSEMs for that outcome. The resulting samples for alcohol, cannabis, and PST use outcomes were as follows: n = 20,634, n = 11,411, and n = 6,710, respectively. As seen in Table 2, the average pain intensity rating was low and consistent across waves. Mean estimates for substance use outcomes also were generally consistent across waves. Participants in the alcohol use sample reported consuming approximately 15 drinks in the past month on average, with approximately 12% of the sample exceeding moderate drinking guidelines. Rates of substance use problems, weekly use of cannabis and PSTs, and frequency of substance use problems were low, consistent with the nature of the general population sample.
Table 2.
Sample sizes and descriptive statistics by wave and outcome variable

| Wave 2 | Wave 3 | Wave 4 | ||||
|---|---|---|---|---|---|---|
| Variable |
M or % (SE) |
n unweighted |
M or % (SE) |
n unweighted |
M or % (SE) |
n unweighted |
| Alcohol use | ||||||
| Total drinks | 15.38 (0.42) |
20,560 | 15.33 (0.43) |
20,557 | 15.47 (0.40) |
20,581 |
| Exceeded moderate drinking guidelines | 11.91% (0.32) |
20,560 | 12.16% (0.31) |
20,557 | 11.24% (0.30) |
20,581 |
| Alcohol use problems | 15.01% (0.40) |
20,265 | 15.26% (0.35) |
20,368 | 15.38% (0.38) |
20,358 |
| Cannabis use Weekly use | 21.69% (0.61) |
11,290 | 22.49% (0.57) |
11,431 | 23.90% (0.71) |
11,437 |
| Cannabis use problems | 5.67% (0.27) |
11,224 | 5.21% (0.25) |
11,304 | 5.52% (0.27) |
11,302 |
| PST use Weekly use | 8.43% (0.43) |
6,576 | 9.64% (0.50) |
6,647 | 9.69% (0.49) |
6,641 |
| PST use problems | 4.47% (0.33) |
6,535 | 4.45% (0.33) |
6,586 | 4.55% (0.36) |
6,583 |
| Substance use problems count | 0.13 (< 0.01) |
21,021 | 0.14 (< 0.01) |
21,160 | 0.14 (< 0.01) |
21,171 |
| Pain intensity | 2.44 (0.02) |
21,021 | 2.52 (0.03) |
21,140 | 2.55 (0.03) |
21,1150 |
Notes: PST = painkiller/sedative/tranquilizer. Mean and percentage of population are based on weighted estimates. % indicates the percentage of participants endorsing use pattern or problem. n = the number of participants included in each sample. Each sample included only individuals who endorsed a history of using the respective substance and provided enough data for the outcome. Substance use consequence count range: 0–6. Pain intensity range: 0–10.
Cross-lagged panel models
Results of the cross-lagged panel models are presented in Table 3. The autoregressive pathways were all significant (all ps < .001). The autoregressive pathway of pain intensity was consistent across substance use outcome models and of moderate magnitude (Bs = 0.58–0.62). All these pathways were positive and significant, suggesting moderate stability of pain intensity ratings over time. Autoregressive pathways for substance use outcome waves were, as expected, variable across different models. They were, however, positive and generally of high magnitude.
Table 3.
Cross-lagged panel model results

| Subsequent substance use | Subsequent pain intensity | |||||
|---|---|---|---|---|---|---|
| Variable | aOR/(aRR) | [95% CI] | p | B | [95% CI] | p |
| Alcohol use | ||||||
| Model 1a: Total drinks | ||||||
| Prior year pain intensity | (0.99) | [0.97, 1.00] | .125 | 0.60 | [0.58, 0.61] | <.001 |
| Prior year total drinks | (1.03) | [1.03, 1.03] | <.001 | <0.01 | [<0.01, <0.01] | .034 |
| Model 1b: Exceeded moderate drinking guidelines | ||||||
| Prior year pain intensity | 1.01 | [0.99, 1.02] | .464 | 0.60 | [0.58, 0.61] | <.001 |
| Prior year exceeded moderate drinking guidelines | 15.95 | [14.32, 17.77] | <.001 | 0.15 | [0.08, 0.23] | <.001 |
| Model 1c: Alcohol use problems | ||||||
| Prior year pain intensity | 1.05 | [1.03, 1.06] | <.001 | 0.60 | [0.58, 0.61] | <.001 |
| Prior year alcohol use problems | 13.63 | [12.40, 14.98] | <.001 | 0.17 | [0.11, 0.23] | <.001 |
| Cannabis use | ||||||
| Model 2a: Weekly cannabis use | ||||||
| Prior year pain intensity | 1.03 | [1.01, 1.04] | .002 | 0.59 | [0.57, 0.61] | <.001 |
| Prior year weekly cannabis use | 15.86 | [14.20, 17.70] | <.001 | 0.12 | [0.04, 0.19] | .003 |
| Model 2b: Cannabis use problems | ||||||
| Prior year pain intensity | 1.08 | [1.04, 1.12] | <.001 | 0.58 | [0.57, 0.60] | <.001 |
| Prior year cannabis use problems | 12.39 | [10.23, 15.01] | <.001 | 0.26 | [0.13, 0.38] | <.001 |
| PST | ||||||
| Model 3a: Weekly PST use | ||||||
| Prior year pain intensity | 1.12 | [1.09, 1.16] | <.001 | 0.62 | [0.59, 0.64] | <.001 |
| Prior year weekly PST use | 4.63 | [3.80, 5.65] | .002 | 0.26 | [0.10, 0.41] | .002 |
| Model 3b: PST use problems | ||||||
| Prior year pain intensity | 1.08 | [1.04, 1.13] | <.001 | 0.61 | [0.59, 0.64] | <.001 |
| Prior year PST use problems | 17.69 | [13.30, 23.52] | <.001 | 0.40 | [0.22, 0.59] | <.001 |
| Substance use problem count | ||||||
| Model 4a: Substance use problem count | ||||||
| Prior year pain intensity | (1.07) | [1.05, 1.09] | <.001 | 0.60 | [0.59, 0.62] | <.001 |
| Prior year substance use problem count | (2.33) | [2.21, 2.46] | <.001 | 0.07 | [0.03, 0.11] | <.001 |
Notes: PST = painkiller/sedative/tranquilizer; aOR = adjusted odds ratio; aRR = adjusted rate ratio.
Alcohol
There were 20,634 participants who endorsed at least one instance of alcohol use and were included in the alcohol-based models. In Models 1a and 1b, the pathways from total drinks and exceeding moderate drinking guidelines to pain intensity were significant (ps < .034); however, the pathways from pain intensity to total drinks and exceeding moderate drinking guidelines did not reach statistical significance (ps > .125). For an individual with a higher rate of total drinks (defined as 1.5 SD above the mean level [99.16 drinks]), the model estimated a pain intensity of 2.54 (SE = 0.03) the following year. The model estimated that an individual who exceeded moderate drinking guidelines would report a pain intensity of 2.63 (SE = 0.04) the following year.
In Model 1c, pain intensity predicted the occurrence of later alcohol consequences (aOR = 1.05, 95% CI [1.03, 1.06], p < .001), and alcohol problems predicted pain intensity (B = 0.17, 95% CI [0.11, 0.23], p < .001). The model predicted that an individual with a higher pain intensity rating (+1.5 SD, 6.54) would have an approximately 1 in 5 chance (17.24%; SE = 0.41%) of reporting alcohol use problems the following year. The model estimated that an individual experiencing alcohol use problems would report a pain intensity rating of 2.63 (SE = 0.03) the following year.
Cannabis
The pathway from weekly cannabis use to pain intensity (Model 2a) was significant and positive (B = 0.12, 95% CI [0.04, 0.19], p = .003), as was the pathway from pain to weekly cannabis use (aOR = 1.03, 95% CI [1.01, 1.04], p = .002). The model predicted that an individual with a pain intensity 1.5 SD above the mean would have an approximately 1 in 4 chance (24.18%, SE = 0.61%) of engaging in weekly cannabis use the following year. The model also estimated that an individual reporting weekly cannabis use would report a pain intensity rating of 2.81 (SE = 0.36) the following year.
Model 2b shows that the pathway from cannabis use problems to pain intensity was significant (B = 0.26, 95% CI [0.13, 0.38], p < .001), as was the reciprocal pathway from pain intensity to cannabis use problems (aOR = 1.08, 95% CI [1.04, 1.12], p < .001). The model estimated that an individual with a higher pain rating (+1.5 SD) would have an approximately 1 in 20 chance (6.47%, SE = 0.44%) of reporting cannabis use problems the following year. An individual reporting cannabis use problems was estimated to have a pain intensity rating of 2.95 (SE = 0.07) the following year.
Painkillers/sedatives/tranquilizers
As seen in Model 3a, the pathway from weekly PST use to pain intensity was significant (B = 0.26, 95% CI [0.10, 0.41], p = .002). The pathway from pain intensity to weekly PST use also was significant (aOR = 1.12, 95% CI [1.09, 1.16], p < .001). An individual with a higher pain intensity rating (+1.5 SD) was estimated to have an approximately 3 in 20 chance (13.02%, SE = 0.78%) of reporting weekly PST use the following year. The model estimated that an individual reporting weekly PST use would report a pain intensity rating of 3.65 (SE = 0.09) the following year.
There was a similar reciprocal association between pain intensity and PST problems. The pathway from pain intensity to PST problems was significant (aOR = 1.08, 95% CI [1.04, 1.13], p < .001), as was the reciprocal pathway from PST problems to pain intensity (B = 0.07, 95% CI [0.03, 0.11], p < .001). An individual with a higher pain intensity rating was estimated to have an approximately 1 in 20 chance (5.42%, SE = 0.44%) of reporting PST use problems the following year. A person reporting PST use problems was estimated to have a pain intensity rating of 3.79 (SE = 0.11) the following year.
Substance use problem count
As seen in Model 4a, the pathway from pain intensity to substance use problem count was significant (aRR = 1.07, 95% CI [1.05, 1.09], p < .001), as was the pathway from substance use problem count to pain intensity (B = 0.07, 95% CI [0.03, 0.11], p < .001). The model predicted that an individual with a higher pain intensity rating (+1.5 SD) would report 0.27 (SE = 0.02) substance use problems the following year. The model also estimated that individuals with higher levels of substance use problems (+1.5 SD, 1.30) would report a pain intensity rating of 2.60 (SE = 0.03) the following year.
Discussion
This study reports on the cross-lagged association between substance use and pain intensity in a nationally representative sample of adults with substance use history in the United States. Results were generally consistent with a reciprocal risk association between pain intensity and substance use. The models that did not produce evidence of significant bidirectional associations were those based on the quantity/frequency-based alcohol use outcomes (i.e., total drinks, exceeding moderate drinking guidelines). In these models, there was no evidence for an effect of pain intensity on subsequent alcohol use, although alcohol use predicted higher pain intensity the following year. Although the associations were small in magnitude, they were robust and observed across several drug classes. This may suggest a cumulative effect resulting in larger increases in both pain and substance use over multiple years. Similar models found evidence for reciprocal associations between pain and problems resulting from substance use.
This is, to our knowledge, the first study to document such a reciprocal risk association between pain intensity and substance use longitudinally in a nationally representative sample of people with substance use history.
These findings are largely consistent with the bidirectional risk model recently proposed by Ditre et al. (2019). This finding is important because it highlights a potential reciprocal pathway that may place adults in the general population at higher risk for clinically significant pain conditions and harmful substance use, a common comorbidity profile (Witkiewitz & Vowles, 2018). Indeed, given that pain is a commonly reported health concern in the adult population (Nahin, 2015), the health implications of the documented association are considerable. These findings raise the possibility that public health interventions and policy aimed at reducing substance use will have an ameliorative effect on pain levels in the general population.
We examined different categories of substances—including alcohol, cannabis, and PST—to compare these associations across different drug classes. Interestingly, the observed associations were largely consistent across drug classes. Our findings pertaining to alcohol and PST are largely consistent with previously published cross-sectional and clinical research showing that harmful alcohol (Zale et al., 2015) and opioid use (Lee et al., 2011) are associated with poorer pain outcomes. However, evidence for cannabis as a risk factor for pain is more mixed. Some prospective treatment studies find that cannabis use may reduce pain in patients with various pain conditions, although the evidence in favor of its efficacy is largely mixed and limited by methodological issues (Nugent et al., 2017). Other research finds that cannabis use may increase pain in specific clinical groups (Campbell et al., 2018); the results of the current study identify a similar effect of cannabis use on pain in the general population. A key difference among studies tracking pain in cannabis users is the length of follow-up. Studies reporting that cannabis improves pain outcomes typically follow patients for relatively brief durations, precluding examining long-term effects of cannabis on pain. This may explain the discrepancy between the findings of the current study and those reporting that cannabis use improves pain outcomes.
Given the observed reciprocal link between substance use and pain outcomes, we reiterate prior recommendations for routine pain and substance use screenings for individuals entering treatment or reporting either problem (Barry et al., 2013). Interventions that target pain conditions or substance use should attend to the reciprocal causal influence between these two factors, especially for patients who report co-occurring pain and substance use. Integrated treatment options that target both pain and substance use may improve outcomes in this population, as was shown in a recent clinical trial that delivered a combined psychosocial intervention addressing both substance use and pain in a group of adults reporting both problems (Ilgen et al., 2020). Even subclinical, nondisordered use of these drugs may be clinically relevant as a maintaining factor among individuals reporting pain.
This study contributes to our understanding of the association between substance use and pain; however, there are several limitations that should be considered for future research. First, pain was assessed using a single item measuring pain intensity over the past 7 days. There are other aspects of pain (e.g., pain interference) that are associated with substance use outcomes (Barry et al., 2013) that should be measured in future national surveys. Second, we examined changes that occurred in pain and substance use over two annual periods. Longer term follow-up periods using trajectory modeling may reveal larger reciprocal effects of pain and substance use on one another. Third, we were not able to specifically examine the role of opioid use in our analyses because opioid, benzodiazepine, and tranquilizer use was assessed using a single item in the PATH. Future surveys should separately assess opioid use. Similarly, it will be important for future surveys to assess both prescribed and nonprescribed opioids. Finally, although it was beyond the scope of our analyses, it will be important to examine individual traits that may moderate the associations between substance use and pain. For example, there are noted sex differences in both pain (Mogil, 2020) and substance use (McHugh et al., 2018); associations between these variables may differ between men and women. Other moderating factors (e.g., age, race) will be important subjects for future research.
In sum, the current study finds evidence for reciprocal patterns of risk between pain intensity and substance use in the general population. These findings suggest a maintaining role of substance use in pain and vice versa. It may be important to address both problems clinically when treating patients presenting with either concern, as they may act to maintain and increase one another over time. Reducing substance use may be a viable strategy for reducing or preventing pain in the general population, including people not currently experiencing clinically significant levels of pain.
Footnotes
This project was supported by National Institutes of Health Grants AA026890, AA025670, AA027473, AA027989, AA021818, DA045465, and DA038709.
References
- Angst M. S., Clark J. D. Opioid-induced hyperalgesia: A qualitative systematic review. Anesthesiology. 2006;104:570–587. doi: 10.1097/00000542-200603000-00025. doi:10.1097/00000542-200603000-00025. [DOI] [PubMed] [Google Scholar]
- Barry D. T., Pilver C. E., Hoff R. A., Potenza M. N. Pain interference and incident mood, anxiety, and substance-use disorders: Findings from a representative sample of men and women in the general population. Journal of Psychiatric Research. 2013;47:1658–1664. doi: 10.1016/j.jpsychires.2013.08.004. doi:10.1016/j.jpsychires.2013.08.004. [DOI] [PMC free article] [PubMed] [Google Scholar]
- Caldeiro R. M., Malte C. A., Calsyn D. A., Baer J. S., Nichol P., Kivlahan D. R., Saxon A. J. The association of persistent pain with out-patient addiction treatment outcomes and service utilization. Addiction. 2008;103:1996–2005. doi: 10.1111/j.1360-0443.2008.02358.x. doi:10.1111/j.1360-0443.2008.02358.x. [DOI] [PubMed] [Google Scholar]
- Campbell G., Hall W. D., Peacock A., Lintzeris N., Bruno R., Larance B., Degenhardt L. Effect of cannabis use in people with chronic non-cancer pain prescribed opioids: Findings from a 4-year prospective cohort study. The Lancet Public Health. 2018;3:e341–e350. doi: 10.1016/S2468-2667(18)30110-5. doi:10.1016/S2468-2667(18)30110-5. [DOI] [PMC free article] [PubMed] [Google Scholar]
- Castillo R. C., MacKenzie E. J., Wegener S. T., Bosse M. J. the LEAP Study Group. Prevalence of chronic pain seven years following limb threatening lower extremity trauma. Pain. 2006;124:321–329. doi: 10.1016/j.pain.2006.04.020. doi:10.1016/j.pain.2006.04.020. [DOI] [PubMed] [Google Scholar]
- Ditre J. W., Zale E. L., LaRowe L. R. A reciprocal model of pain and substance use: Transdiagnostic considerations, clinical implications, and future directions. Annual Review of Clinical Psychology. 2019;15:503–528. doi: 10.1146/annurev-clinpsy-050718-095440. doi:10.1146/annurev-clinpsy-050718-095440. [DOI] [PubMed] [Google Scholar]
- Griffin M. L., McDermott K. A., McHugh R. K., Fitzmaurice G. M., Jamison R. N., Weiss R. D. Longitudinal association between pain severity and subsequent opioid use in prescription opioid dependent patients with chronic pain. Drug and Alcohol Dependence. 2016;163:216–221. doi: 10.1016/j.drugalcdep.2016.04.023. doi:10.1016/j.drugalcdep.2016.04.023. [DOI] [PMC free article] [PubMed] [Google Scholar]
- Holmes A., Williamson O., Hogg M., Arnold C., Prosser A., Clements J., O’Donnell M. Predictors of pain 12 months after serious injury. Pain Medicine. 2010;11:1599–1611. doi: 10.1111/j.1526-4637.2010.00955.x. doi:10.1111/j.1526-4637.2010.00955.x. [DOI] [PubMed] [Google Scholar]
- Hyland A., Ambrose B. K., Conway K. P., Borek N., Lambert E., Carusi C., Compton W. M. Design and methods of Population Assessment of Tobacco and Health (PATH) Study. Tobacco Control. 2017;26:371–378. doi: 10.1136/tobaccocontrol-2016-052934. doi:10.1136/tobaccocontrol-2016-052934. [DOI] [PMC free article] [PubMed] [Google Scholar]
- Ilgen M. A., Coughlin L. N., Bohnert A. S. B., Chermack S., Price A., Kim H. M., Blow F. C. Efficacy of a psychosocial pain management intervention for men and women with substance use disorders and chronic pain: A randomized clinical trial. JAMA Psychiatry. 2020;77:1225. doi: 10.1001/jamapsychiatry.2020.2369. doi:10.1001/jamapsychiatry.2020.2369. [DOI] [PMC free article] [PubMed] [Google Scholar]
- Larson M. J., Paasche-Orlow M., Cheng D. M., Lloyd-Travaglini C., Saitz R., Samet J. H. Persistent pain is associated with substance use after detoxification: A prospective cohort analysis. Addiction. 2007;102:752–760. doi: 10.1111/j.1360-0443.2007.01759.x. doi:10.1111/j.1360-0443.2007.01759.x. [DOI] [PubMed] [Google Scholar]
- Lawton J., Simpson J. Predictors of alcohol use among people experiencing chronic pain. Psychology, Health and Medicine. 2009;14:487–501. doi: 10.1080/13548500902923177. doi:10.1080/13548500902923177. [DOI] [PubMed] [Google Scholar]
- Lee M., Silverman S. M., Hansen H., Patel V. B., Manchikanti L. A comprehensive review of opioid-induced hyperalgesia. Pain Physician. 2011;14:145–161. [PubMed] [Google Scholar]
- McDermott K. A., Joyner K. J., Hakes J. K., Okey S. A., Cougle J. R. Pain interference and alcohol, nicotine, and cannabis use disorder in a national sample of substance users. Drug and Alcohol Dependence. 2018;186:53–59. doi: 10.1016/j.drugalcdep.2018.01.011. doi:10.1016/j.drugalcdep.2018.01.011. [DOI] [PubMed] [Google Scholar]
- McHugh R. K., Votaw V. R., Sugarman D. E., Greenfield S. F. Sex and gender differences in substance use disorders. Clinical Psychology Review. 2018;66:12–23. doi: 10.1016/j.cpr.2017.10.012. doi:10.1016/j.cpr.2017.10.012. [DOI] [PMC free article] [PubMed] [Google Scholar]
- Mogil J. S. Qualitative sex differences in pain processing: Emerging evidence of a biased literature. Nature Reviews. Neuroscience. 2020;21:353–365. doi: 10.1038/s41583-020-0310-6. doi:10.1038/s41583-020-0310-6. [DOI] [PubMed] [Google Scholar]
- Nahin R. L. Estimates of pain prevalence and severity in adults: United States, 2012. Journal of Pain. 2015;16:769–780. doi: 10.1016/j.jpain.2015.05.002. doi:10.1016/j.jpain.2015.05.002. [DOI] [PMC free article] [PubMed] [Google Scholar]
- National Institute on Alcohol Abuse and Alcoholism. Helping patients who drink too much: A clinician’s guide updated edition. 2005. Retrieved from https://www.niaaa.nih.gov/alcohols-effects-health/professional-education-materials/helping-patients-who-drink-too-much-clinicians-guide.
- Nugent S. M., Morasco B. J., O’Neil M. E., Freeman M., Low A., Kondo K., Kansagara D. The effects of cannabis among adults with chronic pain and an overview of general harms: A systematic review. Annals of Internal Medicine. 2017;167:319–331. doi: 10.7326/M17-0155. doi:10.7326/M17-0155. [DOI] [PubMed] [Google Scholar]
- Smiley-McDonald H. M., Moore K. N., Heller D. C., Ropero-Miller J. D., McIntire G. L., Wallace F. N. Patterns of marijuana use in a 6-month pain management sample in the United States. Substance Abuse: Research and Treatment. 2017;11 doi: 10.1177/1178221817724783. doi:10.1177/1178221817724783. [DOI] [PMC free article] [PubMed] [Google Scholar]
- Substance Abuse and Mental Health Services Administration. Key substance use and mental health indicators in the United States: Results from the 2018 National Survey on Drug Use and Health. 2019. (HHS Publication No. PEP19-5068, NSDUH Series H-54). Retrieved from https://www.samhsa.gov/data/sites/default/files/cbhsq-reports/NSDUHNationalFindingsReport2018/NSDUHNationalFindingsReport2018.pdf.
- Turner J. A., Shortreed S. M., Saunders K. W., LeResche L., Von Korff M. Association of levels of opioid use with pain and activity interference among patients initiating chronic opioid therapy: A longitudinal study. Pain. 2016;157:849–857. doi: 10.1097/j.pain.0000000000000452. doi:10.1097/j.pain.0000000000000452. [DOI] [PMC free article] [PubMed] [Google Scholar]
- Vos T., Abajobir A. A., Abate K. H., Abbafati C., Abbas K. M., Abd-Allah F., Murray C. J. L. the GBD 2016 Disease and Injury Incidence and Prevalence Collaborators. Global, regional, and national incidence, prevalence, and years lived with disability for 328 diseases and injuries for 195 countries, 1990–2016: A systematic analysis for the Global Burden of Disease Study 2016. The Lancet. 2017;390:1211–1259. doi: 10.1016/S0140-6736(17)32154-2. doi:10.1016/S0140-6736(17)32154-2. [DOI] [PMC free article] [PubMed] [Google Scholar]
- Williams A. C. C., Craig K. D. Updating the definition of pain. Pain. 2016;157:2420–2423. doi: 10.1097/j.pain.0000000000000613. doi:10.1097/j.pain.0000000000000613. [DOI] [PubMed] [Google Scholar]
- Witkiewitz K., Vowles K. E. Alcohol and opioid use, co-use, and chronic pain in the context of the opioid epidemic: A critical review. Alcoholism: Clinical and Experimental Research. 2018;42:478–488. doi: 10.1111/acer.13594. doi:10.1111/acer.13594. [DOI] [PMC free article] [PubMed] [Google Scholar]
- Zale E. L., Maisto S. A., Ditre J. W. Interrelations between pain and alcohol: An integrative review. Clinical Psychology Review. 2015;37:57–71. doi: 10.1016/j.cpr.2015.02.005. doi:10.1016/j.cpr.2015.02.005. [DOI] [PMC free article] [PubMed] [Google Scholar]
- Zvolensky M. J., Cougle J. R., Bonn-Miller M. O., Norberg M. M., Johnson K., Kosiba J., Asmundson G. J. Chronic pain and marijuana use among a nationally representative sample of adults. American Journal on Addictions. 2011;20:538–542. doi: 10.1111/j.1521-0391.2011.00176.x. doi:10.1111/j.1521-0391.2011.00176.x. [DOI] [PubMed] [Google Scholar]