
Extended Data Fig. 3 |. Effect of MC3R Loss-of-Function mutations on height (cm) across time.
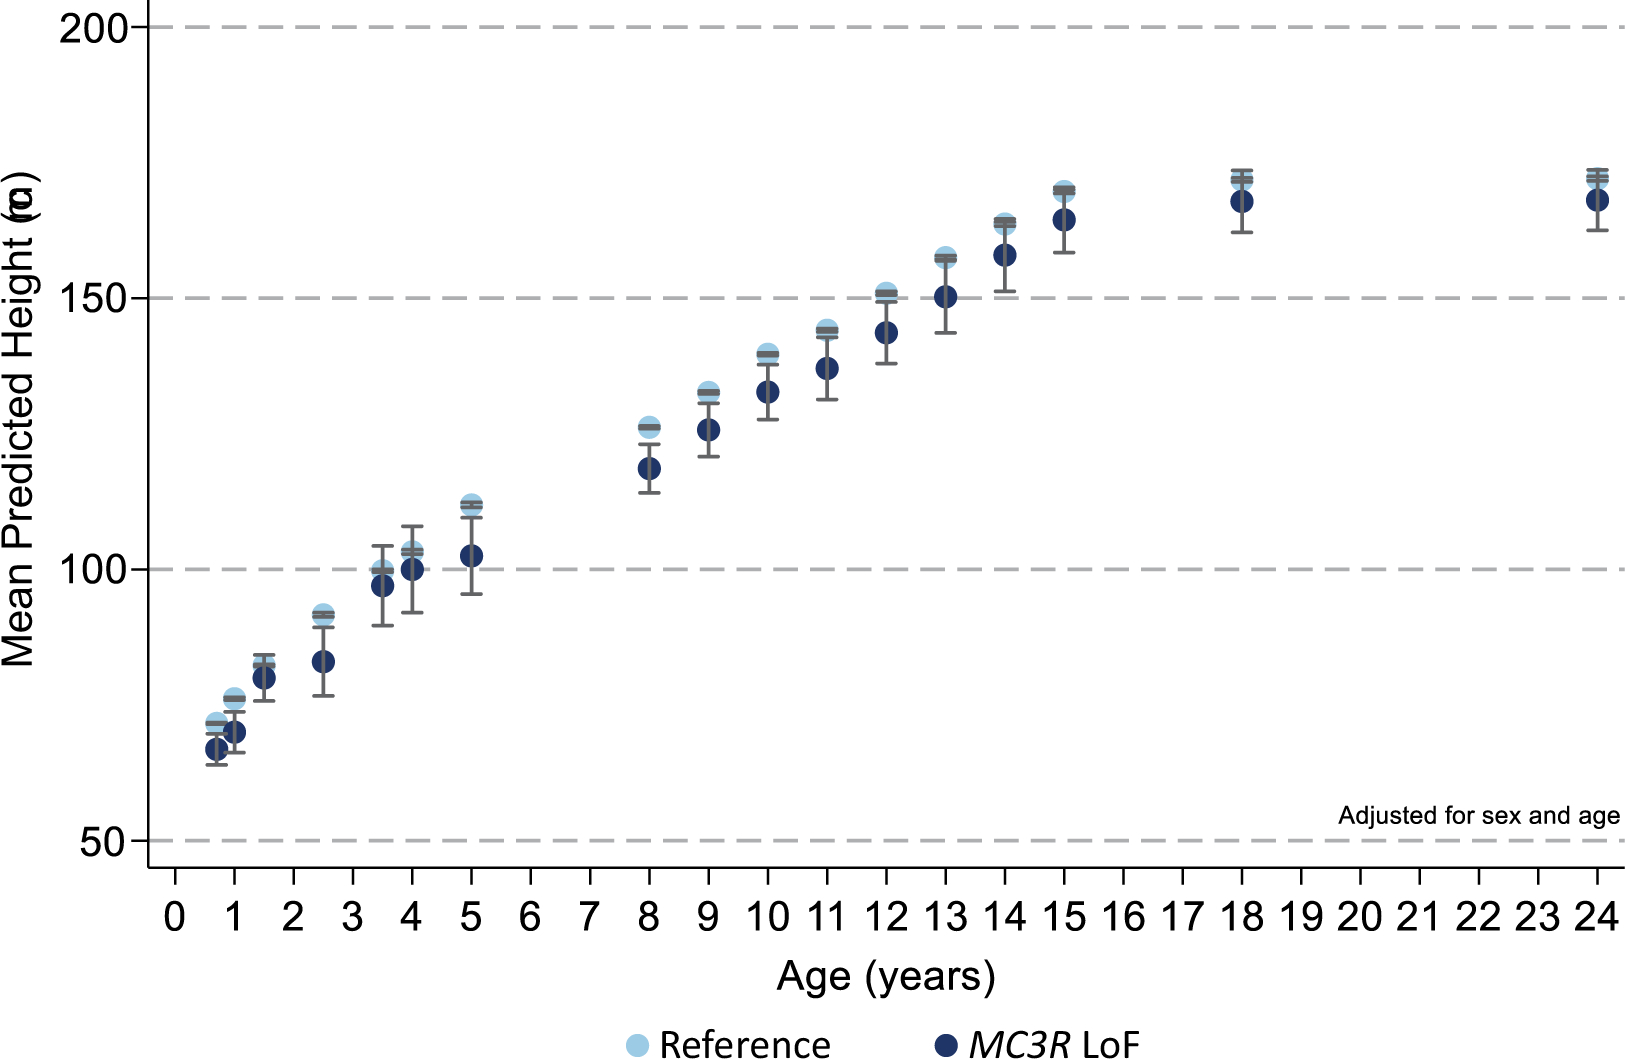
Carriers of MC3R LoF mutations (dark blue) had lower height throughout early life course compared to the reference group (light blue) after adjusting for sex and age. Figures only show results where the mutation group was represented by at least one individual at all time points between birth and 24 years. Mean ± 95% CI shown, N and p-values are listed in Supplementary Table 4.