

Abstract
Unintentional non-fire-related (UNFR) carbon monoxide (CO) poisoning is a leading cause of poisoning in the US and a preventable cause of death. We generated national estimates of accidental CO poisoning and characterized the populations most at risk.
UNFR CO poisoning cases were assessed using hospitalization and emergency department (ED) data from the Healthcare Costs and Utilization Project National Inpatient Sample and Nationwide Emergency Department Sample databases. We used hospitalization data from 2003 to 2013 and ED data from 2007 to 2013. We calculated trends using a linear regression of UNFR CO poisonings over the study period and age-adjusted rates using direct standardization and U.S. Census Bureau estimates.
During 2003–2013, approximately 14,365 persons (4.1 cases/million annually) with confirmed or probable UNFR CO poisoning were admitted to hospitals and the annual rate of poisonings showed a weak downward trend (p = 0.12). During 2007–2013, approximately 101,847 persons (48.3 visits/million annually) visited the ED and the annual rate of poisonings showed a significant downward trend (p ≤ 0.01). Most UNFR CO hospital cases involved patients who were older (aged 45–64 years), white, male, or living in the South or Midwest. Overall, the rate of hospitalizations did not change over the study period.
Unintentional CO poisoning is preventable and these cases represent the most recent national estimates. ED visits declined over the study period, but the hospitalization rates did not change. This emphasizes the need for prevention efforts, such as education in the ED setting, increased use of CO alarms, and proper use and maintenance of fuel-powered household appliances.
Keywords: Carbon monoxide, Surveillance, Unintentional, National, Environmental epidemiology
1. Introduction
Carbon monoxide (CO) is an odorless, tasteless, and colorless gas created by the incomplete combustion of carbon-based fuel products. CO is difficult to detect without special equipment, such as a CO alarm or monitor. When inhaled, CO binds to hemoglobin in red blood cells, reducing their ability to carry oxygen throughout the body. CO combines preferentially with hemoglobin heme groups to produce carboxyhemoglobin (COHb), which displaces oxygen and reduces systemic arterial oxygen [1], leading to CO poisoning. CO also decreases vascular resistance by displacing nitric oxide from blood platelets, resulting in smooth muscle relaxation [2]. CO poisoning is dose-dependent; symptoms worsen as the percentage of CO in the blood rises. Diagnosing CO poisoning can be difficult because of increased oxygen to the blood during the period between occurrence of symptoms and arrival at the emergency department (ED), and because of the non-specific clinical effects of CO poisoning [1]. The most common symptoms of CO poisoning are headache, nausea, dizziness, and vomiting and these are often mistaken as influenza or food poisoning. Severe poisoning can result in loss of consciousness, chest pain, cardiovascular disease, delayed neurologic sequelae, coma, and death. Patients with existing heart conditions or history of myocardial infarctions have an increased risk of severe poisoning [2]. Treatment can include hyperbaric oxygen therapy, supplemental oxygen treatment, and ventilator support using endotracheal tubes.
In the U.S., unintentional non-fire-related carbon monoxide (UNFR CO) poisonings are responsible for an estimated 450 deaths each year, more than result from any other non-medical toxicant [3], and are the leading cause of morbidity in post-disaster situations. In 2007, EDs reported approximately 21,000 visits related to CO poisoning [4]. In this study, we use the Healthcare Costs and Utilization Project (HCUP) databases to describe population trends for UNFR CO hospitalizations and ED visits and update national estimates of the burden of CO poisoning. We also assess UNFR hospitalizations and ED visits over time to examine possible longitudinal trends.
2. Methodology
HCUP is a family of databases sponsored by the Agency for Healthcare Quality and Research (AHRQ) [5]. Annual assessments of healthcare trends, diagnoses, and other statistics in the HCUP databases are nationally representative. This analysis used the National Inpatient Sample (NIS) and the Nationwide Emergency Department Sample (NEDS). We used the National Inpatient Sample (NIS) to assess the number of UNFR CO poisonings that resulted in hospitalizations. NIS is the largest all-payer inpatient healthcare database in the United States. Similarly, NEDS is the largest all-payer ED database in the United States. It approximates national estimates of ED visits in HCUP-participating hospitals. NEDS has sampled HCUP state partners from the HCUP state emergency department databases (SEDD) annually since 2006. Both databases are stratified probability samples that approximate a 20% sample of hospitals and hospital-based EDs. In the NIS and NEDS, weighting was used to create nationally representative estimates based upon trends in annual rates of hospitalizations and ED visits.
During the study period, NIS and NEDS both used the International Classification of Diseases, Ninth Revision, Clinical Modification (ICD-9-CM) diagnosis codes and E-codes to classify patients diagnosed with CO poisoning. CO poisoning cases are defined using criteria established in the Council for State and Territorial Epidemiologists (CSTE) position statement [6]. In this study, UNFR CO poisoning cases included all listed confirmed and probable diagnoses, with the exclusion of the following fire-related and intentional E-codes:
Confirmed cases: 986, E868.3, E868.8, E868.9, and E982.1
Probable cases: E868.2, E982.0
Excluded codes: E890 –E899, E950–E979, and E990–E999
We used SAS 9.3 software to conduct the statistical analysis of UNFR CO poisonings and for general trend analysis using the NIS and NEDS databases. For NIS, data from 2003 to 2013 were used for trend analysis of hospitalizations. For NEDS, data from 2007 to 2013 were used for trend analysis of ED visits. Annual age-adjusted rates were calculated, using direct standardization and the 2000 U.S. Census Bureau population estimates as the standard [7]. We stratified cases and calculated 95% confidence intervals (CI) for UNFR CO poisoning rates by sex, age, race/ethnicity, U.S. region of the hospital defined by HCUP, payer method, admission season, and mortality. The NEDS database does not record race; therefore, we did not analyze ED visits by race. In NIS, race was missing in approximately 20% of hospital observations. Admission seasons were defined as winter (December, January, and February), spring (March, April, May), summer (June, July, August), and fall (September, October, November). We estimated time trends using a linear regression model with the age-adjusted annual rates as the dependent variable.
3. Results
3.1. Hospitalizations
During 2003–2013, hospitals admitted approximately 14,365 persons with confirmed or probable UNFR CO poisoning. Tables 1 and 2 summarize the demographic characteristics of UNFR CO poisoning hospitalizations. The greatest portion of hospitalizations for CO poisoning were among adults aged 45–64 years (35.6%) (Table 1). More of the hospitalized patients were males (56.1%) than were females (43.9%). Whites (65.7%) accounted for the majority of cases, followed by blacks (16.9%) and Hispanics (10.8%). Regionally, the South (31.8%) had the largest percentage of hospital encounters, followed by the Midwest (29.0%) and Northeast (26.7%). The majority of patients used Medicare (34.4%) or private insurance (28.5%) for payment (Table 2). Cases occurred primarily in the winter (40.0%) and fall (25.3%), with January having the largest percentage of cases (14.7%).
Table 1.
UNFR CO poisoning hospitalizations in the United States, 2003–2013, NIS database.
| Demographics | N | (%) | Crude annual ratea | Age-adjusted annual ratea | Age-adjusted annual 95% confidence intervala | ||
|---|---|---|---|---|---|---|---|
| (Lower) | (Upper) | ||||||
| Sex | Male | 8031 | 56.14 | 4.88 | 5.85 | 5.72 | 5.98 |
| Female | 6273 | 43.86 | 3.70 | 4.44 | 4.33 | 4.55 | |
| Age (years)b | ≤14 | 1082 | 7.55 | 1.62 | - | 1.52 | 1.71 |
| 15–24 | 868 | 6.05 | 1.83 | - | 1.71 | 1.95 | |
| 25–44 | 3037 | 21.18 | 3.34 | - | 3.22 | 3.46 | |
| 45–64 | 5100 | 35.57 | 5.97 | - | 5.80 | 6.13 | |
| ≥65 | 4251 | 29.65 | 9.84 | - | 9.55 | 10.14 | |
| Racec | White | 7521 | 65.73 | 3.42 | 4.01 | 3.92 | 4.11 |
| Black | 1929 | 16.85 | 4.54 | 5.93 | 5.66 | 6.19 | |
| Hispanic | 1238 | 10.82 | 2.37 | 3.79 | 3.58 | 4.00 | |
| Asian or Pacific Islander | 83 | 0.73 | 0.49 | 1.50 | 1.18 | 1.82 | |
| Native American | 49 | 0.43 | 1.77 | 2.88 | 2.08 | 3.55 | |
| Other | 623 | 5.44 | |||||
| Region of hospital | Northeast | 3496 | 26.65 | 6.19 | 6.82 | 6.60 | 7.04 |
| Midwest | 3799 | 28.96 | 5.70 | 6.40 | 6.20 | 6.59 | |
| South | 4169 | 31.78 | 3.75 | 4.60 | 4.46 | 4.73 | |
| West | 1654 | 12.61 | 2.34 | 2.86 | 2.73 | 2.99 | |
| Mortality | Discharged alive | 14,142 | 98.45 | 0.07 | 0.06 | 0.06 | 0.07 |
| Died | 223 | 1.55 | 4.23 | 4.06 | 4.00 | 4.13 | |
| Total | 14,365 | 100 | 4.29 | 4.13 | 4.06 | 4.20 | |
Rates per million persons.
Un-adjusted age specific rates.
Missing N10% of data.
Table 2.
UNFR CO poisoning hospitalizations, United States, 2003–2013, NIS database.
| Demographics | N | (%) | |
|---|---|---|---|
| Expected payer method | Medicare | 4926 | 34.37 |
| Medicaid | 2356 | 16.44 | |
| Private insurance | 4083 | 28.49 | |
| Self-pay | 1673 | 11.67 | |
| No charge | 88 | 0.61 | |
| Other | 1205 | 8.41 | |
| Admission season | Winter | 5436 | 40.03 |
| Spring | 2752 | 20.26 | |
| Summer | 1953 | 14.38 | |
| Fall | 3439 | 25.32 |
Among the 14,365 persons hospitalized because of UNFR CO poisoning, nearly 2.0% died, with 223 confirmed deaths (b1 person/million annually) (Table 1). Approximately 67.8% of deaths were among males, more than twice the percentage of deaths among females (32.1%). The largest burden of deaths was among adults aged ≥65 years (47.2%).
After age-adjustment, approximately 4.13 persons/million were hospitalized annually (95% CI: 4.06, 4.20). During the period from 2003 to 2013 (Fig. 1), UNFR CO poisoning rates were highest in 2006 (5.85 cases/million [95% CI: 5.55, 6.15]) and 2007 (5.62 cases/million [95% CI: 5.32, 5.91). However, the annual rate changed little over the study period and the trend was not statistically significant (slope = 5.61, R2 = 0.25, p = 0.12). Adults aged 65 years or older had the largest rate of hospitalizations, approximately 9.84 cases/million annually (95% CI: 9.55, 10.14). Although whites (4.01 cases/million annually [95% CI: 3.92, 4.11]) accounted for the majority of UNFR CO poisoning cases, blacks had a higher age-adjusted annual rate (5.93 cases/million [95% CI: 5.66, 6.19]).
Fig. 1.
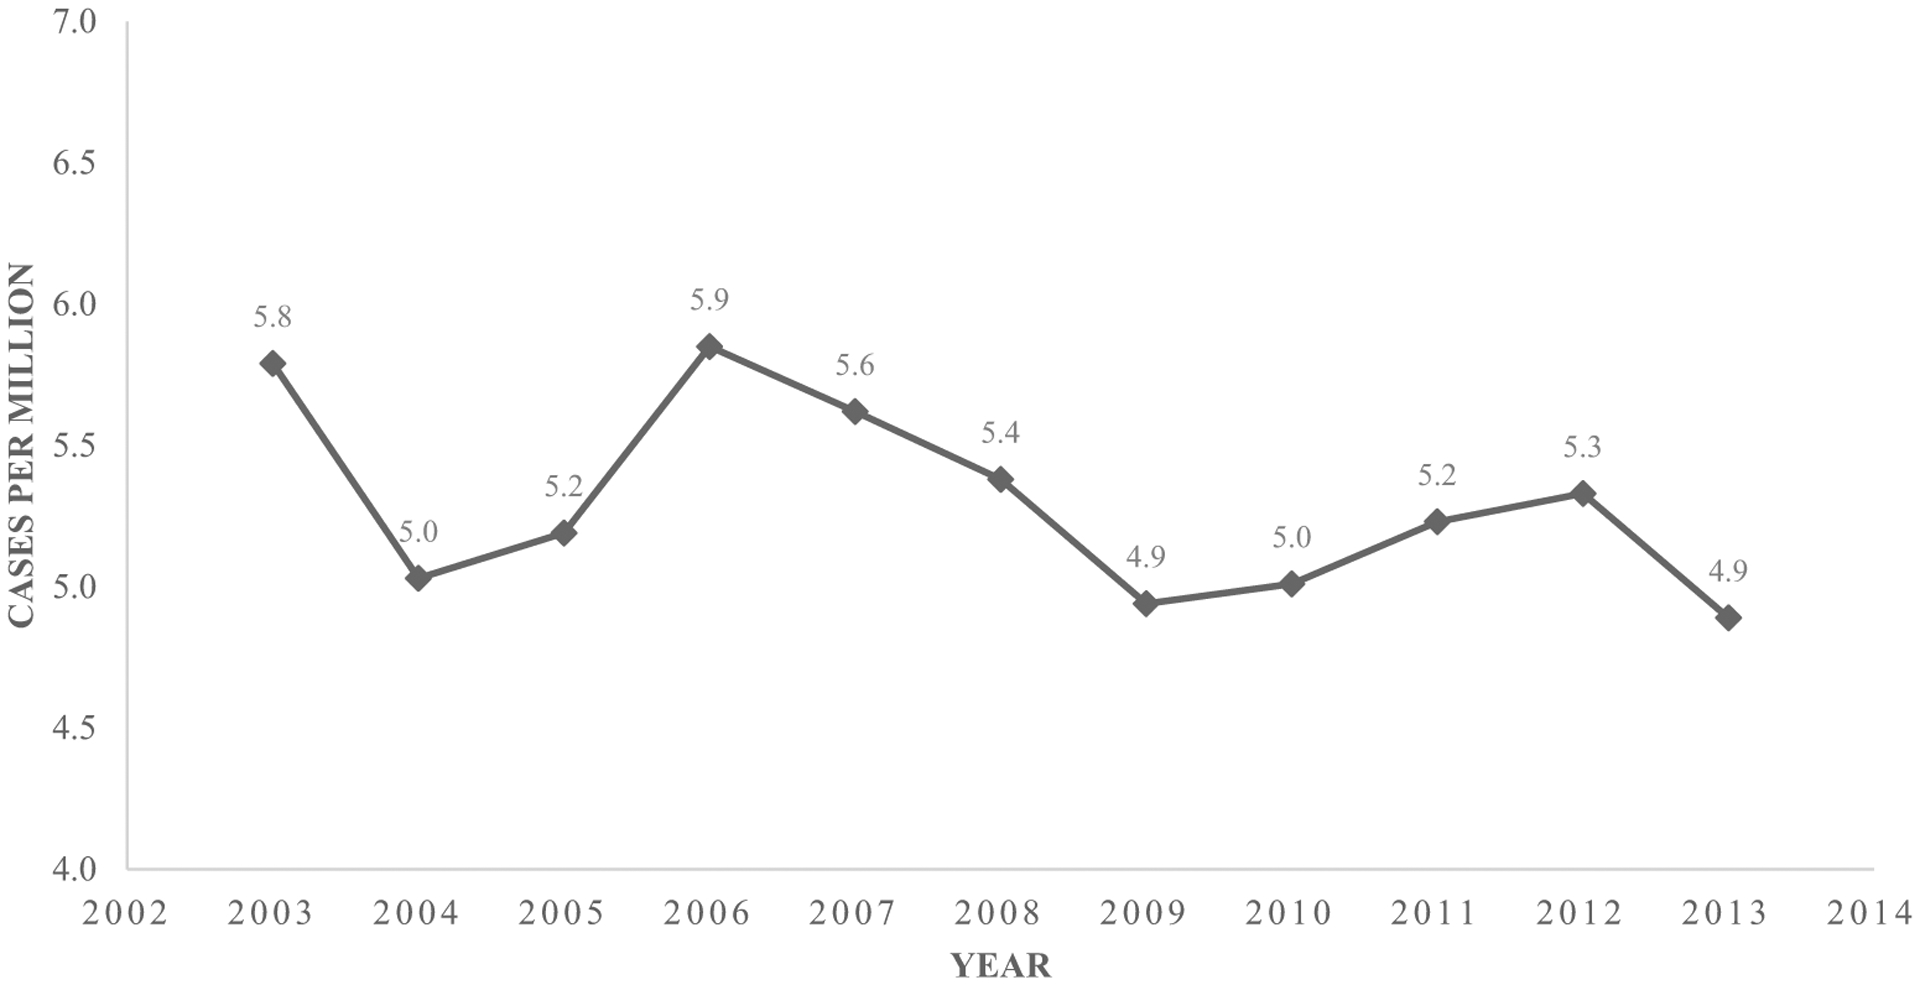
Annual UNFR CO poisonings hospitalizations, United States, 2003–2013, NIS database.
The Northeast (6.82 cases/million annually [95% CI: 6.60, 7.04]) and Midwest (6.40 cases/million annually [95% CI: 6.20, 6.59]) had the largest age-adjusted rates compared with the South (4.60 cases/million annually [95% CI: 4.46, 4.73]). Fig. 2 shows the seasonal change in rates by month and U.S. region. From April to September, the South had the largest rate of hospitalizations. From November to March, the Midwest and the Northeast had the largest rates of hospitalizations.
Fig. 2.
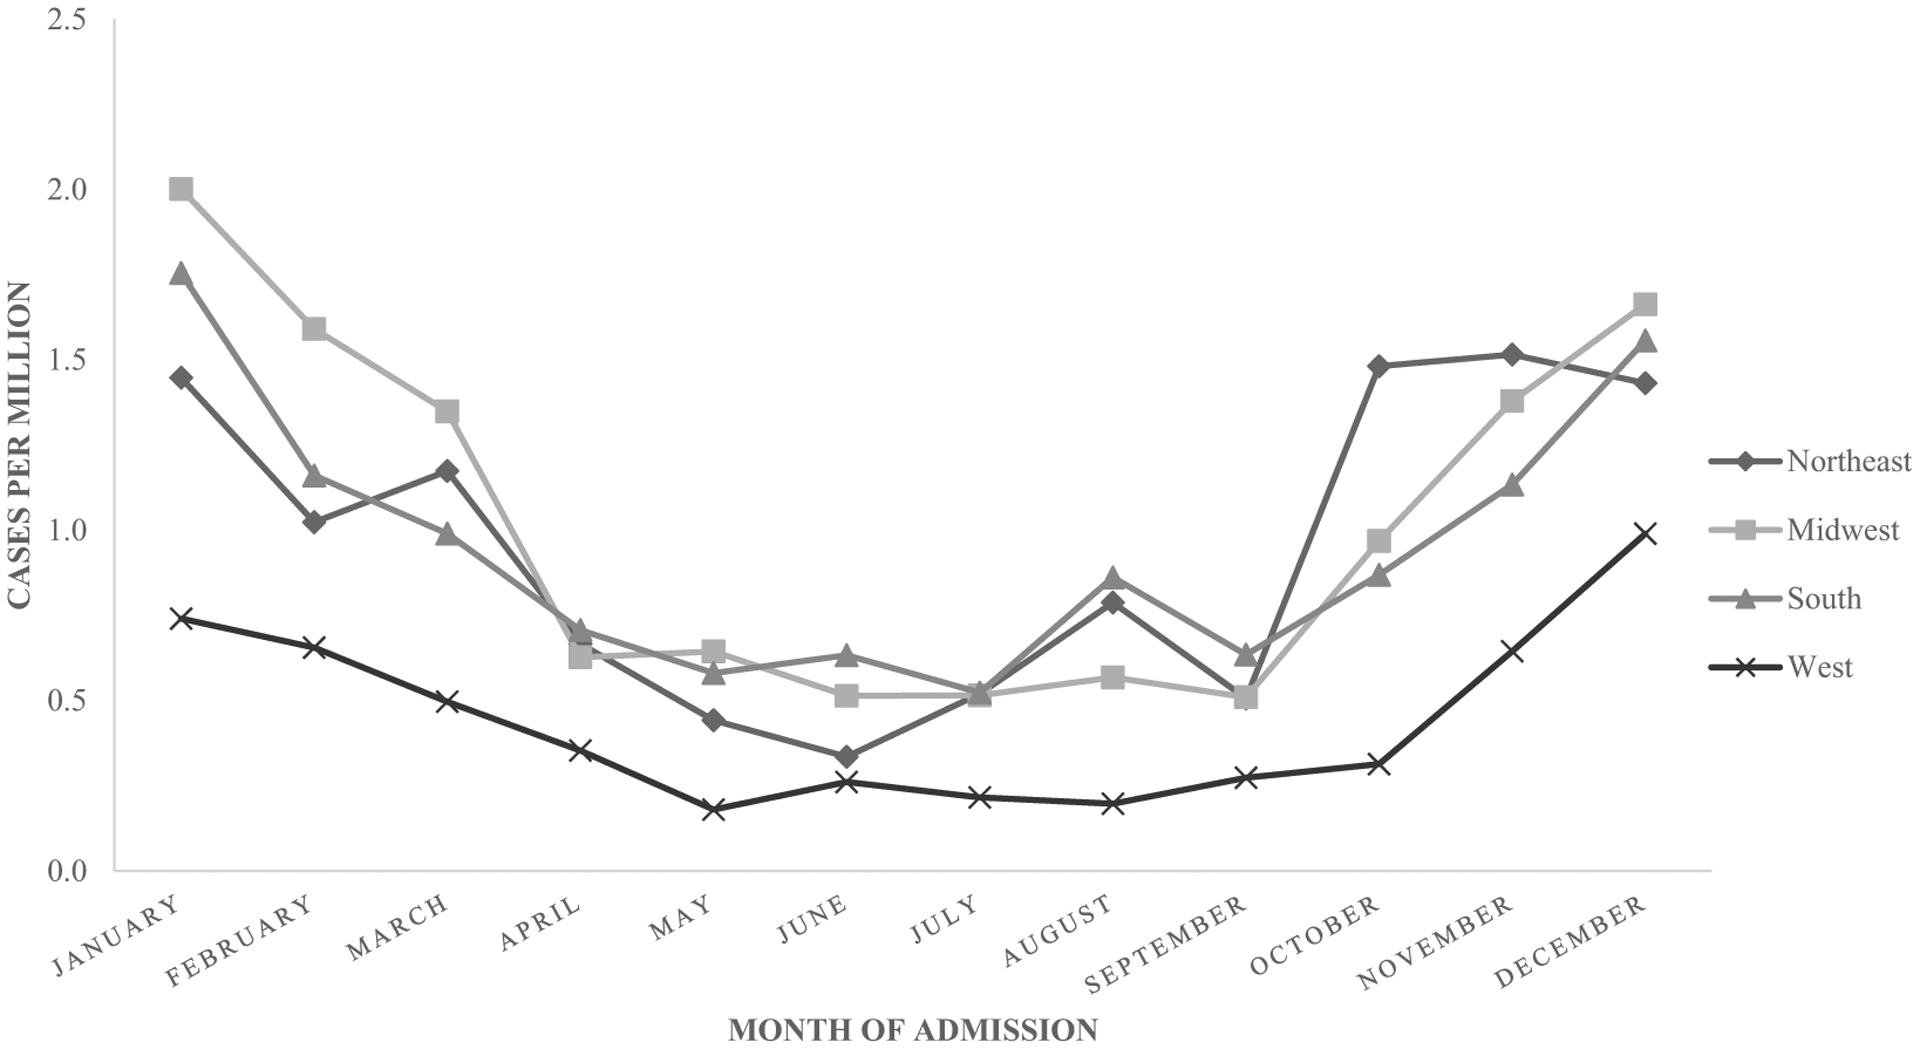
UNFR CO poisoning hospitalizations, by month and region, United States, 2003–2013, NIS database.
3.2. Emergency department
During 2007–2013, EDs saw 101,847 persons for UNFR CO poisoning. We saw a significant downward trend (slope = 59.20, R2 = 0.89, p ≤ 0.01) in ED visits by year (Fig. 3). The majority of ED patients seen for UNFR CO poisoning were aged 25–44 years (26.7%) and 45–64 years (26.2%) (Table 3). The percentages of male (48.7%) and female (51.3%) who visited EDs were approximately the same. Cases primarily occurred in the Northeast (34.0%) and Midwest (31.2%) regions. Payment method was largely private insurance (38.4%), followed by Medicaid (21.0%) (Table 4). The majority of cases occurred in the winter (41.4%) and fall (24.1%) (Table 4). Among the 101,847 patients seen in ED visits, 190 died (Table 3). When stratified by sex, men accounted for approximately 78% (148) of the deaths.
Fig. 3.
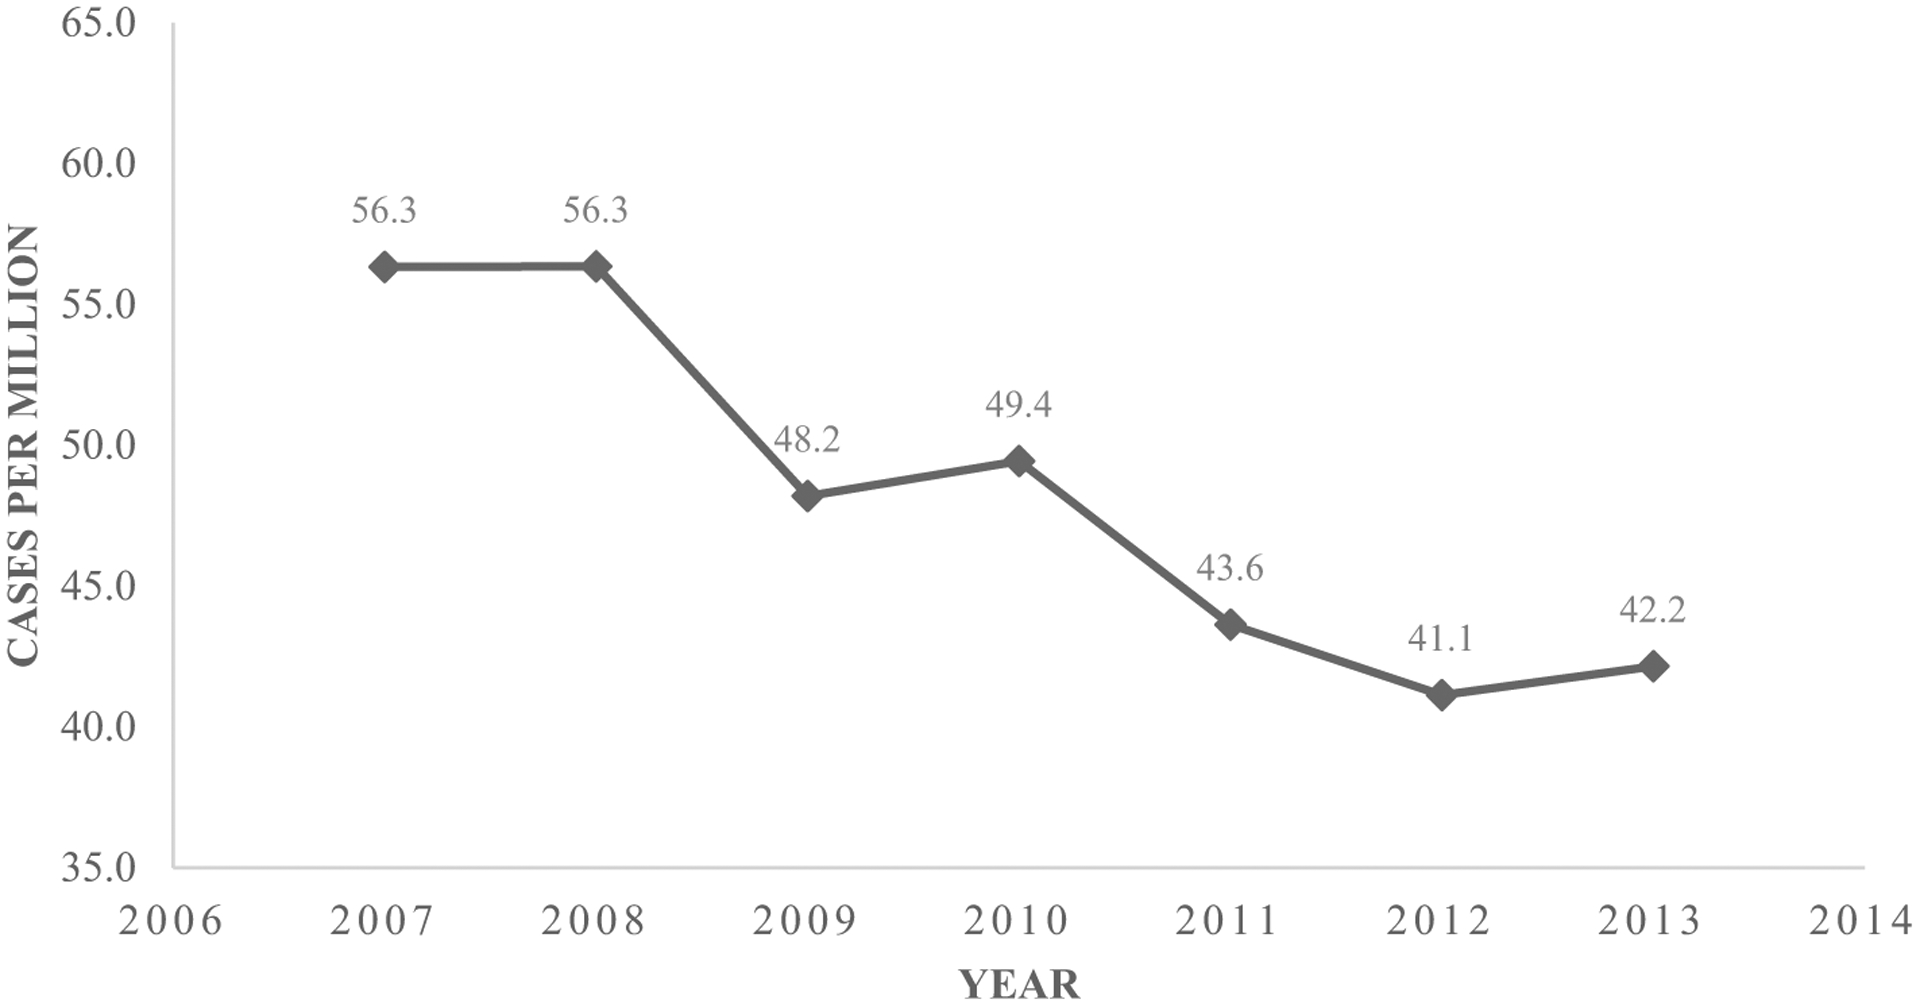
Annual UNFR CO poisoning ED visits, United States, 2007–2013, NEDS database.
Table 3.
UNFR CO poisoning ED visits, United States, 2007–2013, NEDS database.
| Demographics | N | (%) | Crude annual ratea | Age-adjusted annual ratea | Age-adjusted annual 95% confidence intervala | ||
|---|---|---|---|---|---|---|---|
| (Lower) | (Upper) | ||||||
| Sex | Male | 49,607 | 48.72 | 46.63 | 47.36 | 46.95 | 47.78 |
| Female | 52,218 | 51.28 | 47.51 | 49.26 | 48.84 | 49.68 | |
| Age (years)b | ≤14 | 22,848 | 19.75 | 53.48 | - | 52.78 | 54.17 |
| 15–24 | 15,415 | 14.12 | 50.46 | - | 49.66 | 51.26 | |
| 25–44 | 33,034 | 26.72 | 57.17 | - | 56.55 | 57.78 | |
| 45–64 | 21,932 | 26.19 | 38.72 | - | 38.20 | 39.23 | |
| ≥65 | 8618 | 13.22 | 30.14 | - | 29.50 | 30.78 | |
| Region of hospital | Northeast | 34,579 | 33.95 | 89.27 | 92.30 | 91.33 | 93.28 |
| Midwest | 31,732 | 31.16 | 67.72 | 69.61 | 68.84 | 70.37 | |
| South | 22,996 | 22.58 | 28.63 | 29.52 | 29.14 | 29.90 | |
| West | 12,539 | 12.31 | 24.87 | 20.72 | 20.35 | 21.08 | |
| Mortality | Discharged alive | 100,669 | 99.81 | 46.54 | 47.71 | 47.42 | 48.01 |
| Died in ED | 101 | 0.10 | 0.05 | 1.03 | 0.84 | 1.24 | |
| Died in hospital | 89 | 0.09 | 0.04 | 1.03 | 0.81 | 1.24 | |
| Total | 101,847 | 100 | 47.09 | 48.26 | 47.96 | 48.55 | |
Rates per million persons.
Un-adjusted age specific rates.
Table 4.
UNFR CO poisoning ED visits, United States, 2007–2013, NEDS database.
| Demographics | N | (%) | |
|---|---|---|---|
| Expected payer method | Medicare | 11,301 | 11.21 |
| Medicaid | 21,140 | 20.96 | |
| Private insurance | 38,742 | 38.42 | |
| Self-pay | 15,938 | 15.81 | |
| No charge | 493 | 0.49 | |
| Other | 13,222 | 13.11 | |
| Admission season | Winter | 38,673 | 41.39 |
| Spring | 18,426 | 19.72 | |
| Summer | 13,837 | 14.81 | |
| Fall | 22,496 | 24.08 |
After age-adjustment, 48.3 visits/million people occurred annually (95% CI: 47.96, 48.55). The annual rate of ED visits was 49.3/million (95% CI: 48.8, 49.7) for females and 47.4 visits/million annually (95% CI: 47.0, 47.8) for males. By region, the Northeast (92.3 visits/million [95% CI: 91.33, 93.28]) and the Midwest (69.6 visits/million [95% CI: 68.84, 70.37]) had the largest annual rates of ED visits (Fig. 4).
Fig. 4.
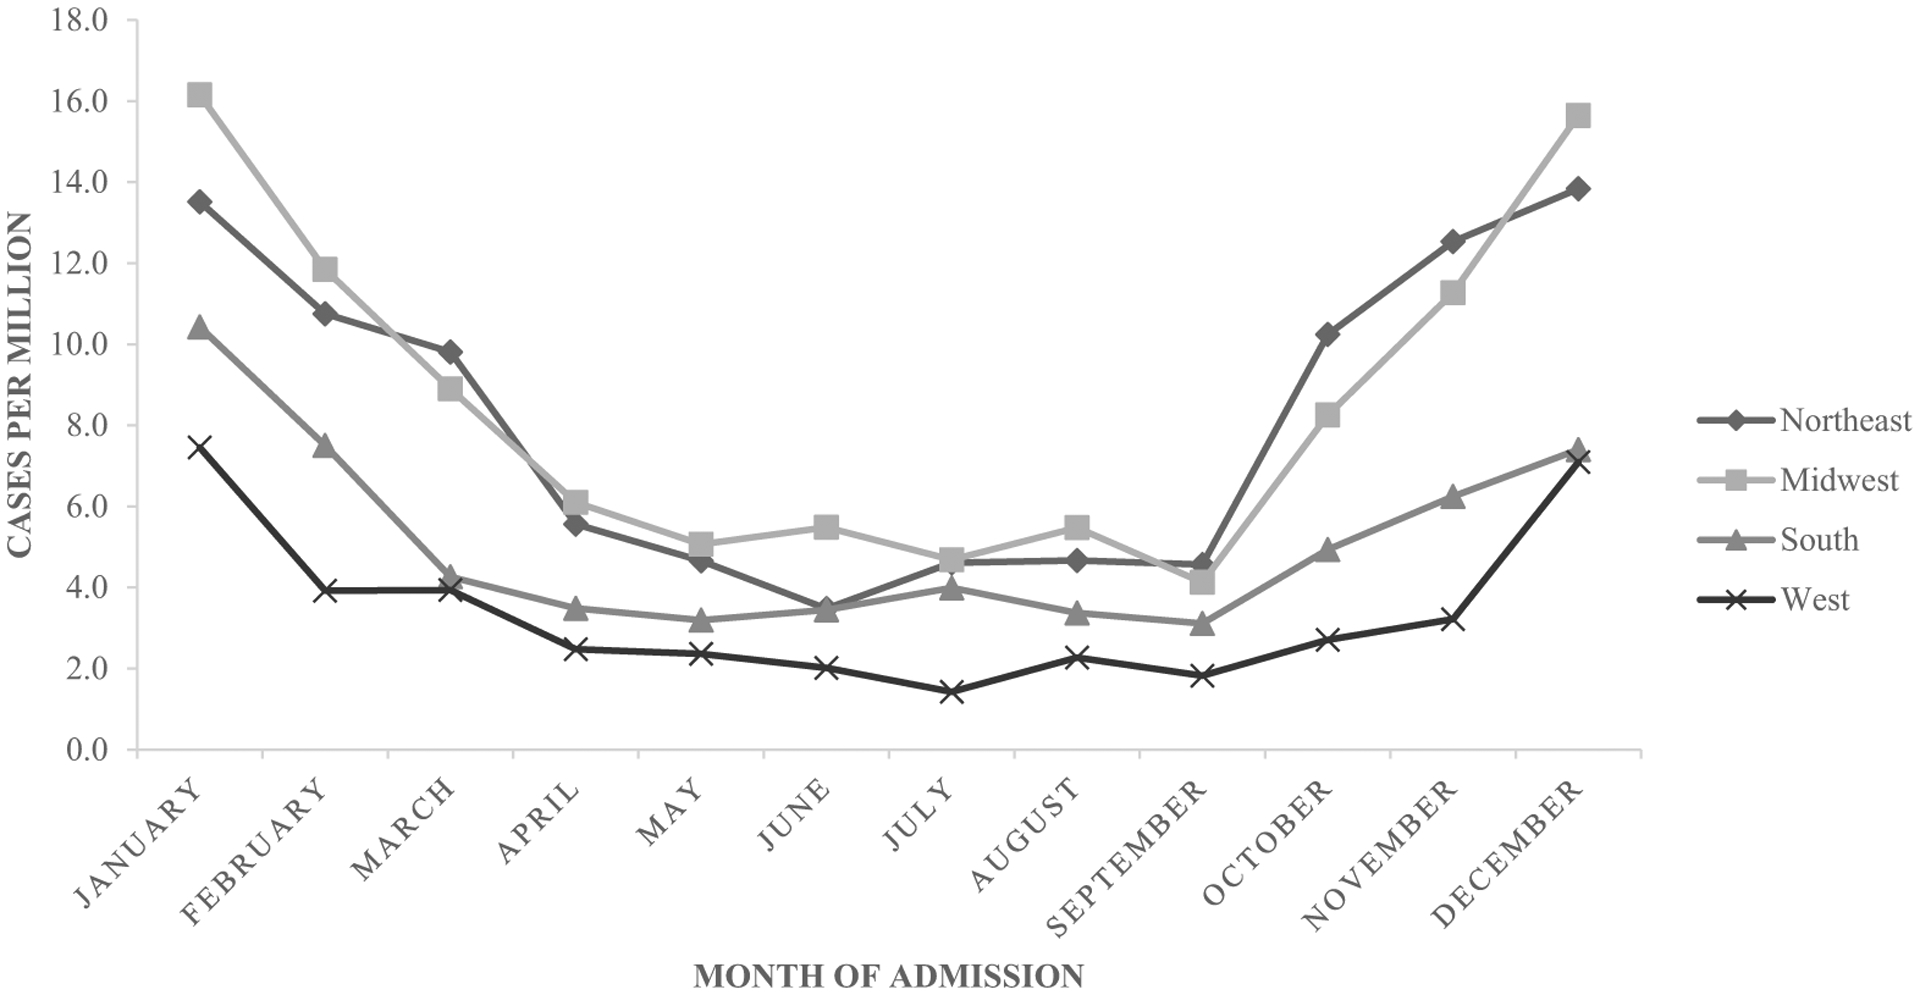
UNFR CO poisoning ED visits, by month and region, United States, 2007–2013, NEDS database.
4. Discussion
During 2003–2013, hospitals reported approximately 14,365 confirmed and probable cases of UNFR CO poisoning. During 2007–2013, EDs admitted approximately 101,847 CO poisoning cases. Although the trend in hospitalizations showed a weak downward trend, ED visits showed a significant downward trend. This decrease might be attributable to use of other urgent care facilities or that more of the ED visits resulted in hospital stays.
Past studies have shown that older, non-Hispanic white men living in the Midwest had the highest risk for UNFR CO poisoning [8]. In this study, the majority of CO poisoning hospitalizations also were among older, non-Hispanic white men. Possible reasons for hospitalization include presence of comorbid conditions, such as heart or chronic pulmonary disease, which increases the risk for severe symptoms in older populations [9]. Blacks had the highest annual rate of hospital visits, approximately 1.5 times the rate of whites. The largest number of ED visits were among persons ages 25–44 years. In addition, the majority of visits occurred in winter months.
Although EDs admitted similar percentages of males and females, a greater portion of hospitalized patients were male. Males might have greater potential for CO exposure because of engaging in high-risk behaviors such as improper placement of carbon-fuel based products during power outages [10]. Because of physiological differences, females were more likely to show symptoms earlier, thus receiving medical treatment for less severe poisonings [4, 11]. The exception to this difference in number of hospitalizations would be pregnant women, who have an increased risk for severe symptoms [9].
In contrast with previous studies, the South had the largest percentage of CO poisoning hospitalizations from April to September. In the South, this increase in hospitalizations might be a consequence of hurricanes, flooding, and other natural disasters, resulting in CO exposures from generators and gasoline-powered pressure washers used during cleanup in the weeks and months post-disaster [12]. The Northeast and the Midwest had the largest percentage of hospitalizations from November to March, which is consistent with other studies [13]. The highest frequency of cases occurred in winter months, possibly attributable to vehicle warm-up, improper maintenance of home heating systems, and loss of power during winter storms [11, 14, 15]. Many CO exposures are often the result of risk-taking behavior that occurs when a disaster situation arises and power sources are limited.
Deaths from CO poisoning were a rare occurrence in the ED and hospital during the study period. Most CO poisoning deaths occur in residences [11]. If a patient is able to make it to a hospital, they have a low probability of dying. Persons with severe symptoms of CO poisoning, including death, often are found near the original source of CO. However, persons (especially pregnant women) who are exposed but have less severe symptoms might also need medical attention [2]. Although HCUP does not list the source of exposure, we know from case reports and surveillance that generators, charcoal grills and briquettes, kerosene heaters, and stoves are the main household sources of UNFR CO poisoning [10].
The results of our study are subject to several limitations. First, the findings might underestimate the nationwide occurrences of CO poisoning because of the non-specific symptoms of CO poisoning and the possibility of misdiagnosis. For example, differential diagnoses can include food poisoning, depression, and flu-like illness. Because HCUP’s sampling and weighting process for nationally representative estimates does not include all states all years, we also might have made inaccurate generalizations about the population [4]. These generalizations might have affected the results, because we assumed that weighted samples were approximate depictions of the total population. In addition, we used confirmed and probable cases only. Although we have high confidence that these cases are CO poisoning, use of these definitions might underestimate the total number of cases. Classifications using ICD-9-CM codes also are susceptible to variation by coders. One healthcare professional might interpret and diagnose a particular case differently from another [10].
A strength of this study is that it produced a nationally representative number of cases of CO poisoning, based on HCUP’s large hospitalization and ED data. HCUP is the largest all-payer database (including the uninsured) and undergoes quality checks for accuracy and standardization. Therefore, these estimates are a close approximation to the true burden of CO poisoning in the United States.
Hospital administrative records are limited to exposures within the healthcare system. Other surveillance systems can supply additional information on exposures. The national carbon monoxide poisoning surveillance framework uses mortality records, CO alarm prevalence surveys, laboratory and hyperbaric chamber treatment data, and exposure data from the National Poison Data System (NPDS) to assess the full extent of CO poisoning cases [16]. ED and hospitalization data from studies such as ours are also used. This framework is comprehensive and includes resources to monitor and report CO exposures for surveillance. Local agencies use these data to produce intervention efforts to prevent CO poisoning.
CO poisoning is preventable. Because most CO poisoning cases occur inside the home, CO alarms are recommended for residential use [17, 18]. CO alarms should be placed on every floor [14] and in hallways near sleeping areas [18]. Their low cost makes them a practical intervention for preventing CO poisoning. Although CO detectors can reduce exposures, they must be properly installed and maintained to be effective, and their batteries need to be replaced every 6 months [11]. Hard-wired CO alarms should have battery back-ups.
Populations at high risk for CO poisoning might not be aware of the benefits of CO alarms, nor of the dangers of using gas-powered devices in the home. The 2005 HealthStyles Survey asked respondents to evaluate the safety of running a generator in a garage as long as the door is open [19]. Approximately 63.3% of respondents either agreed that the practice was safe or were unsure. These respondents tended to be older persons (≥65 years), non-Hispanic white men, and those living in the Midwest. When asked if running generators in the basement were safe, respondents who agreed the practice is safe or who were unsure tended to be non-Hispanic black, middle-aged (35–64 years) men, and from the Northeast, another high-risk population according to the survey. In the 2006 survey, less than half of the participants reported having a CO alarm. These results emphasize gaps in education about these products, especially in high-risk populations [19].
Disaster-related CO exposure also affects racial and ethnic minorities. These populations represent a disproportionate fraction of fatal and nonfatal disaster-related CO poisonings [10]. Various studies have noted a greater percentage of severe outcomes in immigrant and foreign-born communities [20]. In one study of CO poisoning among immigrants, 45% of households used English as their primary language, and 55% of households included at least one member whose primary language was not English [20].
5. Conclusion
This study reveals that ED visits because of UNFR CO poisoning have decreased annually, but trends in hospitalizations have changed little. Blacks are a high-risk population. In addition, those who are white males aged ≥50 years who live in the South or Midwest are consistently the most affected by CO exposure [4, 8, 11]. This might suggest that prevention efforts are not reaching target populations. These populations are a target audience for communication and intervention to eliminate education gaps and reduce unintentional CO poisoning mortality. Fire-fighters, state and local health agencies, and local television channels could promote CO detectors before disasters occur. Public service announcements before storms, after hurricane season, and during winter months could inform residents about the need for CO alarms and safe usage of fuel-powered appliances [21]. Alternative forms of communication, such as fact sheets and newspapers, can fill communication gaps for those without access to television or internet. To assess exposure to CO, healthcare professionals can measure COHb in patients who might be exposed and educate patients on the dangers of CO poisoning [22].
References
- [1].Varon J, Marik PE, Fromm RE Jr, Gueler A. Carbon monoxide poisoning: a review for clinicians. J Emerg Med 1999;17(1):87–93. [DOI] [PubMed] [Google Scholar]
- [2].Nikkanen H, Skolnik A. Diagnosis and management of carbon monoxide poisoning in the emergency department. Emerg Med Pract 2011;13(2):1–14. [PubMed] [Google Scholar]
- [3].Centers for Disease Control and Prevention (CDC). Nonfatal, unintentional, non-fire-related carbon monoxide exposures—United States, 2004–2006. MMWR Morb Mortal Wkly Rep 2008;57(33):896–9. [PubMed] [Google Scholar]
- [4].Iqbal S, Law HZ, Clower JH, Yip FY, Elixhauser A. Hospital burden of unintentional carbon monoxide poisoning in the United States, 2007. Am J Emerg Med 2012;30 (5):657–64. 10.1016/j.ajem.2011.03.003. [DOI] [PubMed] [Google Scholar]
- [5].HCUP Databases. Healthcare cost and utilization project (HCUP). Agency for Healthcare Research and Quality; 2003–2013. Available from www.hcup-us.ahrq.gov/databases.jsp [accessed May 30, 2018]. [PubMed]
- [6].Council of State and Territorial Epidemiologists (CSTE). Updates to 1998 case definition for acute carbon monoxide poisoning surveillance webpage. Available from http://www.cste.org/position%20statements/searchbyyear2007final.asp. [accessed November 21, 2016].
- [7].U.S. Census Bureau. Profile of general population and housing characteristics. Available from https://factfinder.census.gov/faces/tableservices/jsf/pages/productview.xhtml?src=CF; 2000. [accessed November 21, 2016].
- [8].Iqbal S, Clower JH, Boehmer TK, Yip FY, Garbe P. Carbon monoxide-related hospitalizations in the US: evaluation of a web-based query system for public health surveillance. Public Health Rep 2010;125(3):423–32. [DOI] [PMC free article] [PubMed] [Google Scholar]
- [9].Dydek TM. Investigating carbon monoxide poisonings. Carbon monoxide poisoning. Boca Raton, FL: CRC Press: Taylor & Francis Group; 2008. p. 287–304. [Google Scholar]
- [10].Iqbal S, Clower JH, Hernandez SA, Damon SA, Yip FY. A review of disaster-related carbon monoxide poisoning: surveillance, epidemiology, and opportunities for prevention. Am J Public Health 2012;102(10):1957–63. 10.2105/AJPH.2012.300674. [DOI] [PMC free article] [PubMed] [Google Scholar]
- [11].Sircar K, Clower J, Kyong Shin M, Bailey C, King M, Yip F. Carbon monoxide poisoning deaths in the United States, 1999 to 2012. Am J Emerg Med 2015;33(9):1140–5. [DOI] [PMC free article] [PubMed] [Google Scholar]
- [12].Waite T, Murray V, Baker D. Carbon monoxide poisoning and flooding: changes in risk before, during and after flooding require appropriate public health interventions. PLoS Curr 2014;3:6. 10.1371/currents.dis.2b2eb9e15f9b982784938803584487f1. [DOI] [PMC free article] [PubMed] [Google Scholar]
- [13].Centers for Disease Control and Prevention (CDC). Carbon monoxide exposures—United States, 2000–2009. MMWR Morb Mortal Wkly Rep 2011;60(30):1014–7. [PubMed] [Google Scholar]
- [14].Centers for Disease Control and Prevention. Carbon monoxide–related deaths—United States, 1999–2004. MMWR Morb Mortal Wkly Rep 2007;56(50):1309–12. [PubMed] [Google Scholar]
- [15].Johnson-Arbor KK, Quental AS, Li D. A comparison of carbon monoxide exposures after snowstorms and power outages. Am J Prev Med 2014;46(5):481–6. 10.1016/j.amepre.2014.01.006. [DOI] [PubMed] [Google Scholar]
- [16].Iqbal S, Clower JH, King M, Bell J, Yip FY. National carbon monoxide poisoning surveillance framework and recent estimates. Public Health Rep 2012. Sep 1;127(5): 486–96. [DOI] [PMC free article] [PubMed] [Google Scholar]
- [17].Raub JA, Mathieu-Nolf M, Hampson NB, Thom SR. Carbon monoxide poisoning—a public health perspective. Toxicology 2000;145(1):1–14. [DOI] [PubMed] [Google Scholar]
- [18].Anderson AR, Wu J. Top five industries resulting in injuries from acute chemical incidents—hazardous substance emergency events surveillance, nine states, 1999–2008. MMWR Morb Mortal Wkly Rep 2015;64(2):47–53. [PubMed] [Google Scholar]
- [19].King ME, Damon SA. Attitudes about carbon monoxide safety in the United States: results from the 2005 and 2006 HealthStyles survey. Public Health Rep 2011;126 (Suppl. 1):100–7. [DOI] [PMC free article] [PubMed] [Google Scholar]
- [20].Gulati RK, Kwan-Gett T, Hampson NB, Baer A, Shusterman D, Shandro JR, et al. Carbon monoxide epidemic among immigrant populations: King County, Washington, 2006. Am J Public Health 2009;99(9):1687–92. [DOI] [PMC free article] [PubMed] [Google Scholar]
- [21].Harduar-Morano L, Watkins S. Review of unintentional non-fire-related carbon monoxide poisoning morbidity and mortality in Florida, 1999–2007. Public Health Rep 2011;126(2):240. [DOI] [PMC free article] [PubMed] [Google Scholar]
- [22].Gallagher F, Mason HJ. Carbon monoxide poisoning in two workers using an LPG forklift truck within a coldstore. Occup Med (Lond) 2004;54(7):483–8. [DOI] [PubMed] [Google Scholar]