

Abstract
Some protein positions play special roles in determining the magnitude of protein function: at such “rheostat” positions, varied amino acid substitutions give rise to a continuum of functional outcomes, from wild type (or enhanced), to intermediate, to loss of function. This observed range raises interesting questions about the biophysical bases by which changes at single positions have such varied outcomes. Here, we assessed variants at position 98 in human aldolase A (“I98X”). Despite being ~17 Å from the active site and far from subunit interfaces, substitutions at position 98 have rheostatic contributions to the apparent cooperativity (n H ) associated with fructose‐1,6‐bisphosphate substrate binding and moderately affected binding affinity. Next, we crystallized representative I98X variants to assess structural consequences. Residues smaller than the native isoleucine (cysteine and serine) were readily accommodated, and the larger phenylalanine caused only a slight separation of the two parallel helixes. However, the diffraction quality was reduced for I98F, and further reduced for I98Y. Intriguingly, the resolutions of the I98X structures correlated with their n H values. We propose that substitution effects on both n H and crystal lattice disruption arise from changes in the population of aldolase A conformations in solution. In combination with results computed for rheostat positions in other proteins, the results from this study suggest that rheostat positions accommodate a wide range of side chains and that structural consequences manifest as shifted ensemble populations and/or dynamics changes.
Keywords: aldolase, mutation, rheostatic positions, structural repacking, substitution
Short abstract
1. INTRODUCTION
Understanding how each position of a protein contributes to function is central to such diverse applications as interpreting exome sequencing in personalized medicine and engineering novel protein functions for biotechnology. We previously showed that many proteins contain a class of amino acid positions with special abilities to alter protein function. 1 , 2 , 3 , 4 , 5 , 6 At these “rheostat” positions, substituting a range of amino acid types results in a striking continuum of functional outcomes. Indeed, rheostat positions can be likened to a volume dial on a stereo, with substitutions dialing the functional “volume” either up or down. Furthermore, substitutions at some rheostat positions modulated only a single functional parameter (e.g., K d for binding ligand) whereas substitutions at others simultaneously modulated multiple parameters (e.g., substrate affinity, K d for binding allosteric ligand, and the magnitude of allosteric coupling between them). 1 , 3 , 4 , 5 , 6 , 7
In addition to modulating function, many rheostat positions showed other noncanonical substitution outcomes. First, substitution outcomes often did not correlate with the textbook physicochemical similarities of amino acid side chains (e.g., pairs such as valine/isoleucine or phenylalanine/tyrosine did not have similar functional changes). 1 , 2 , 3 , 4 , 5 , 6 Second, substitution outcomes did not extrapolate among homologs, 2 which is indicative of extensive epistasis among rheostat positions. Along with functional modulation, these properties of rheostat positions contribute to the failures of current computational algorithms for predicting substitution outcomes. 8
To improve these algorithms, it is desirable to identify which positions have rheostat substitution outcomes 9 and to gain biochemical measures of 3 and structural insights into their amino acid variants. Although rheostat positions have now been identified in both soluble‐globular 1 , 2 , 3 , 4 and integral membrane proteins, 5 the number of proteins that have been biochemically evaluated for rheostat positions is still limited. We are striving to increase that number. To identify potential candidates in a new model system, we here exploited the moderate correlation between rheostat positions and phylogenetic relationships (e.g., positions conserved in subfamilies but varied across the entire family) that exists for three of our prior models. 2 , 3 , 5 Using this approach, we here identified position 98 of human aldolase A as a potential rheostat position and extended our biochemical and structural studies to this new model protein.
Aldolase catalyzes the glycolytic reaction that cleaves fructose‐1,6‐bisphosphate (Fru‐1,6‐BP) into dihydroxyacetone phosphate (DHAP) and glyceraldehyde‐3‐phosphate (G3P; e.g., References 10, 11, 12, 13). In the current study, we used initial velocity studies of this reaction to evaluate the apparent affinity of aldolase for the Fru‐1,6‐BP substrate and the cooperativity observed for that protein–ligand interaction. Our current results showed that a series of substitutions at position 98 (“I98X”) modulated the apparent cooperativity (n H ) of the protein–ligand interaction caused modest effects on the apparent substrate affinity, including one variant with slightly enhanced affinity.
To begin understanding the biophysical bases of these rheostat outcomes, we next determined the structures of representative I98X variants. These showed that the region around the 98th position easily accommodated the varied side chains and the overall Cα RMSD values were essentially identical, which is consistent with previous computational predictions for substitutions at rheostat positions in other protiens. 5 , 14 Nevertheless, the resolution of these new aldolase A structures correlated with the n H associated with substrate binding. Thus, based on the outcomes of this study, we hypothesize that one mechanism by which changes at rheostat positions modulate function is by shifting the prevalence of conformations in the structural ensemble in solution.
2. RESULTS AND DISCUSSION
Prior studies showed that substitutions at rheostat positions can modulate a range of protein activities, and that individual rheostat positions might alter more than one functional parameter. 1 , 3 , 4 , 5 The current studies of human aldolase were designed to detect rheostat effects on kinetic parameters related to the aldolase reaction, the cleavage of fructose‐1,6‐bisophate (Fru‐1,6‐BP) into DHAP and glyceraldhehyde‐3‐phosphate (G3P).
2.1. The influences of assay conditions on apparent cooperativity
Although Class I aldolases (including the human aldolase A isozyme) can support catalytic activity in their monomeric and dimeric forms, they are homotetramers under physiological conditions. 15 Nonetheless, whether human aldolase A binds the substrate with positive homotropic cooperativity (which, for a tetramer has a potential range from 1 to 4) has not been well established. Positive cooperativity has been reported for aldolase A, but so has both negative cooperativity and an absence of cooperativity. 12 , 15 , 16 , 17 , 18 , 19 , 20 Enzyme inactivation studies with D‐glyceraldehyde‐phosphate and inorganic phosphate show that the modification of one subunit was sufficient to abolish aldolase activity, consistent with possible regulatory interactions among active sites. 21
These reported discrepancies in the potential of regulatory communication among active sites may reflect the influence of assay design: (a) In an assay that couples the production of DHAP to NADH oxidation via the glycerol‐3‐phosphate dehydrogenase reaction, aldolase, and glycerol‐3‐phosphate dehydrogenase may form a substrate channeling pair. 22 , 23 , 24 , 25 , 26 That protein–protein interaction has the potential to alter the cooperativity of aldolase activity. (b) The use of glycerol‐3‐phosphate dehydrogenase in the assay can also be influenced by the exclusion/inclusion of triosephosphate isomerase to convert glyceraldehyde‐3‐phosphate to DHAP. When triosephosphate isomerase is not present, the DHAP is used by glycerol‐3‐phosphate dehydrogenase whereas glyceraldehyde‐3‐phosphate will build up as the aldolase reaction proceeds. In that scenario, the concentration of glyceraldehyde‐3‐phosphate will vary both with time in the reaction and the concentration of the Fru‐1,6‐BP substrate. Glyceraldehyde‐3‐phosphate inhibits aldolase noncompetitively 27 and the presence of a varying concentration of a noncompetitive inhibitor across the substrate concentration range is likely to influence the observed response curve. (c) In a different design, the glyceraldehyde‐3‐phosphate product can be coupled to NADH production via glyceraldehyde‐3‐phosphate dehydrogenase. However, again, aldolase may form a substrate‐channeling pair with glyceraldehyde‐3‐phosphate dehydrogenase 28 , 29 , 30 and any protein–protein interaction may alter cooperativity interactions between aldolase and its substrate. (d) The glyceraldehyde‐3‐phosphate dehydrogenase design can also be used with or without triose phosphate isomerase, but with no anticipated consequence on observed cooperativity. Thus, all the commonly available, enzymatically coupled assays used to monitor aldolase activity may influence observed cooperativity in the response of aldolase activity to varying concentrations of substrate. Nonetheless, by comparing to the wild type enzyme evaluated in the same assay, a mutation‐dependent change in the observed cooperativity (as quantified in the Hill coefficient, n H ) is the second parameter that we considered, along with K app, in our assessment of whether position 98 has a rheostatic contribution to function.
To further illuminate the effects of assay design on observed function, we assayed wild‐type aldolase A activity both in high and low buffer concentrations. Independent of whether Tris or triethanolamine was used as the buffer, observed cooperativity was greater in the lower buffer concentration (Figure S2). For studies of the variants, we chose to use the lower concentration of buffer to promote cooperativity, with the idea that mutations assayed in the same condition might alter cooperativity although we may not fully characterize the mechanism that gives rise to that cooperativity. Importantly, the lowest EDTA concentration (2.9 mM) was sufficient to chelate divalent cations, thereby inactivating any contaminating Escherichia coli aldolase from the partially purified samples, so that all observed activity is derived from the human isozyme.
2.2. Reproducibility provides context for interpreting substitution outcomes
In addition to the need to show data reproducibility, it is necessary to know the distribution of wild type values for any one functional parameter to evaluate whether responses from variant proteins differ from wild type. Therefore, four people in our laboratories replicated the response of wild type aldolase to varying concentrations of substrate: both technical replicates using the same protein preparation, and biological replicates using different protein preparations are included in Figure 1a. Within each of the 28 biological/technical replicates, data for each variant were collected three times (84 separate titrations; Figures 1 and 2). The average K app from all wild type replicates was 0.021 ± 0.008 mM, where the error is the SD for the distribution of observations. The range of K app values was 0.010 to 0.036 mM. The average n H from all wild type replicates was 2.8 ± 0.4, with a range of 2.4–3.5.
FIGURE 1.

Activity response curves aldolase A to varying Fru‐1,6‐BP concentration. (a) Evaluating reproducibility of K app determination for the wild type enzyme. For each titration, each point represents an average of three sample replicates. The titration curves included in this graph show 28 biological replicates, collected by four different individuals. As an example, technical replicates collected on 1 day are in black and biological replicates collected for different protein preparation on different days are in gray. Lines are best fits to Equation (1). (b) The response of human aldolase A I98X substitutions. Although not always apparent due to overlap in points, at each substrate concentration, data were collected in triplicate. The I98S position had low activity (possibly low expression, instability during protein preparation or low V max activity), thus when converted to relative activity that data sets show considerably more scatter than other data sets. Lines are best fits to Equation (1). When position 98 was substituted with glycine or tyrosine, no activity was detected
FIGURE 2.
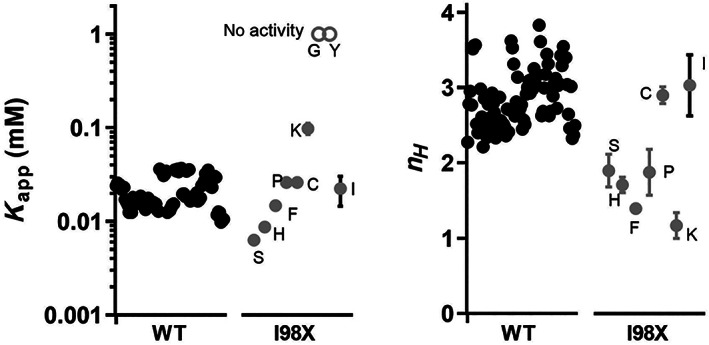
Comparison of K app and n H fit values for WT replicates and I98X variants. The wild‐type values (black dots) represent the >84 individual measurements obtained (see text for more detail). The errors of the wild type replicates are illustrated by their ranges of measurements; the averages and standard deviations for the wild type values are in Table 1. The values for the I98X variants (gray dots) represent the averages of three replicates; most error bars (gray lines) represent errors of the fits (standard deviations). The exception in the I98X column is the “I” data point (i.e., wild type protein), which represents the average and standard deviation of the 27 replicates that were collected on the same days as the other I98X variants; this difference is denoted with a black error bar. The “Y” and “G” variants are shown as high values on the K app plot (open gray dots); these variants lacked activity, which could arise from either a catastrophic effect on k cat or on K app and/or the absence of folded protein. For I98Y unfolding was ruled out by CD (Figure S3). Both the wild type and I98X data sets are displayed with horizontal offset to aid visual inspection of the data. The ranges of outcomes for I98X variants, as compared to the wild type ranges, confirm that position 98 is a rheostat for the control of n H and at least a moderate rheostat for the tuning of K app
2.3. Substitutions at position 98 alter aldolase function
For other model proteins, rheostat substitution outcomes were enriched in the set of nonconserved positions that diverge with speciation (i.e., a position is not conserved in the family but conserved in subfamilies). 3 Thus, we used similar analyses of the aldolase sequence alignment 31 to select position 98 in aldolase A for the current study. Indeed, various substitutions at position 98 yielded proteins that showed a range of responses in both K app and n H (Figures 1 and 2, Table 1). To determine whether position 98 was rheostatic for either parameter, we next considered the range of observed values compared to (a) the total accessible range for that parameter and (b) the range of values observed for wild‐type replicates.
TABLE 1.
Kinetic response fit parameters
| Protein | K app (mM) | Std from replicates | n H | Std from replicates |
|---|---|---|---|---|
| WT | 0.021 | 0.008 | 2.9 | 0.4 |
| Protein | K app (mM) | Error from fit | n H | Error from fit |
|---|---|---|---|---|
| I98C | 0.026 | 0.001 | 2.9 | 0.1 |
| I98F | 0.015 | 0.001 | 1.4 | 0.1 |
| I98H | 0.010 | 0.001 | 1.7 | 0.1 |
| I98K | 0.10 | 0.01 | 1.2 | 0.2 |
| I98P | 0.026 | 0.002 | 1.9 | 0.3 |
| I98S | 0.006 | 0.001 | 1.9 | 0.2 |
| I98G | No activity a | |||
| I98Y | No activity a | |||
A lack of detectible activity can be a result of improper folding, instability during protein preparation, or a lack of catalytic function even if the variant retains overall proper folding.
For K app, the range of values for the I98X variants spanned ~15‐fold (excluding variants with no activity), and relative to WT, included both enhanced and diminished values (Figures 1 and 2). The two variants with “no activity” (I98G and I98Y) further extend the range that is accessible by position 98. (Notably, CD shows that I98Y protein is folded; Figure S3). For context, this range of magnitudes for K app values was smaller than the range previously observed for human liver pyruvate kinase K app (>200‐fold for variants with detectable activity). 3 , 6 One possibility is that each protein may have a different range over which each functional parameter can be tuned via single substitutions. (e.g., one protein may have a 1,000‐fold range accessible by single residue substitutions, whereas a second protein may have only a 10‐fold range accessible by individual substitutions). Indeed, K app values for the human aldolase A, B, and C isozymes, which are considered functionally distinct, differ only ~10‐fold for Fru‐1,6‐BP. 11 Alternatively, the limitation may be for this single position: aldolase A position 98 may be “moderate” 3 in its ability to tune K app, lacking the wide response defined for a rheostat position 1 yet deviating too much from wild‐type to be neutral. 32
For n H , the accessible range is more easily defined: For a homotetramer, the theoretical upper limit is 4; a value of 1 indicates no cooperativity; negative cooperativity is indicated by values <1. For the latter, a value of 0.5 is a practical limit. The average of the observed WT n H values was 2.9 ± 0.4. The range of values observed for the I98X variants was much wider, with a maximum value of 2.9 ± 0.1 and dropping as low as 1.2 ± 0.2 (Table 1). Thus, position 98 appeared to exhibit rheostat substitution outcome for this parameter.
2.4. Structural accommodations of substitutions at position 98
As seen in the WT structure, position 98 is ~17 Å from the active site and distant from all inter‐subunit interfaces (Figure 3). Position 98 is located on Helix 6 that packs in a parallel fashion with Helix 3, and perpendicularly to Helix 4 (Figure 4). On the surface of the protein, the side chain of K101 from the C‐terminal end of the Helix 6 forms hydrogen bonding interactions with D68 and N71 of Helix 4. Interestingly, position 98 is near 10 isozyme‐specific positions that contribute to functional differences between aldolase A and B 11 (Figure S4), which suggests that many positions in this region can be substituted to modulate function.
FIGURE 3.

Structure of wild type human aldolase A. (Left) The homotetramer. (Right) A Zoomed in image of position I98 and a phosphate molecule that occupies the active site. The I98 position is distant from the active site and from subunit interfaces
FIGURE 4.

Crystallized structures of proteins substituted at position 98. The space between the two helices where the wild type I98 resides easily accommodates smaller amino acids. Substituting with phenylalanine (a larger amino acid) causes the two helices to separate, breaking hydrogen bonds between K101 and N71 and D68. This shift also seems a likely cause of stress in the crystal lattice that results in lower resolution of the I98F structure. Insertion of even larger amino acids like tyrosine into position 98 may cause sufficient lattice strain to prevent successful structure determination
To assess how the aldolase A structure could accommodate a wide range of side chains at position 98, several I98X variants were selected for structural determination. All five proteins were successfully crystallized (WT, I98C, I98S, I98F, I98Y). Structures were determined for WT and three variants. Despite extensive efforts, crystals of I98Y did not diffract to sufficient resolution for structure solution. (Note that circular dichroism spectra confirmed that WT and the variant proteins folded with comparable secondary structure; Figure S3.)
Overall, the structures of the I98X variants were essentially identical to wild‐type (Figure 4), with Cα RMSD that ranged from 0.17 to 0.41 Å for monomer comparisons to wild type and 0.26–0.46 Å for dimer comparisons. Examination of the region around position 98 showed that the smaller substitutions (Cys and Ser) were easily accommodated between Helices 3 and 6 (Figure 4). When substituted with the larger phenylalanine residue, Helices 3 and 6 separated slightly at their C‐terminal ends to accommodate the side chain. This separation disrupted hydrogen bonds between K101 with D68 and N71, but no other significant changes were noted in the structure.
The structural changes among the I98X variants are likely too small to account for the observed functional changes. Thus, the functional differences must arise from alterations in the ensemble of aldolase A conformations in solution, in structures of the other (non‐crystallized) conformations, and/or in the dynamic changes within or between structures of the ensemble. Indeed (and to our great surprise), the current study provides evidence for such effects. When we compared the kinetic data to the resolution of the structures, we noticed a correlation: a plot of the structural resolution versus n H shows a direct correlation (Figure 5). No such correlation was apparent between the resolution and K app values or between n H and K app (Figure S5).
FIGURE 5.
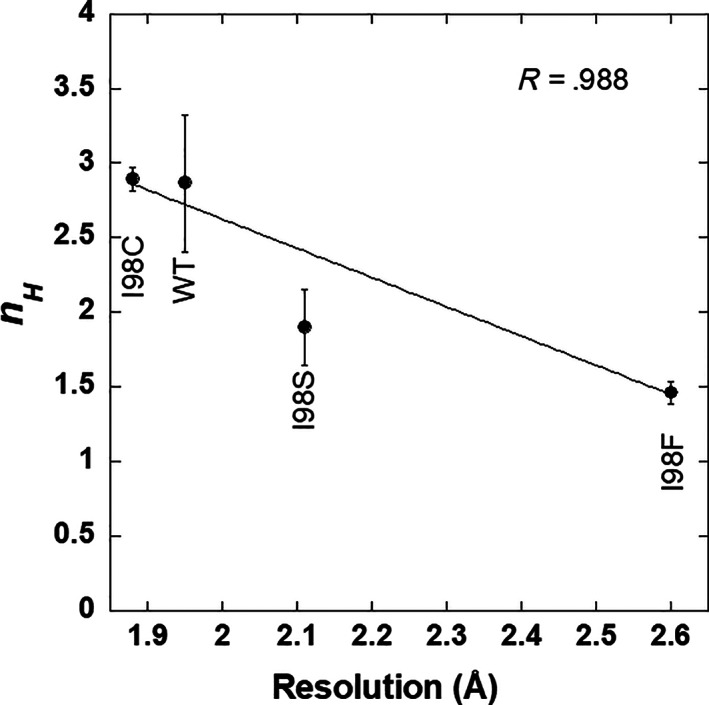
The correlation between cooperativity (i.e., n H ) and crystallographic resolution. Values and errors from Table 1 were used in an error‐weighted linear fit to obtain the line and R value
An explanation for this correlation can be derived from studies of factors known to affect crystal growth and thus crystal quality (seen most readily by changes in diffraction resolution): to efficiently form a high‐quality crystal lattice, it is most beneficial to have all protein molecules in the same oligomerization state (in this case, a tetramer) and in the same conformation. 33 , 34 , 35 , 36 That is, crystals will grow larger and diffract better when protein solutions are more homogeneous. If the solution instead comprises a mixture of oligomerization states and/or conformations, the crystal lattice will select for one of the available conformations (assuming no non‐crystallographic symmetry within an asymmetric unit). Of course, the population of protein in the ensemble in solution re‐equilibrates as molecules transition from being in solution to being in the protein crystal. Nonetheless, the occasional incorporation of a non‐favored conformation disrupts the lattice and lowers the diffraction resolution and the probability for incorporation of the non‐favorable conformation increases as the population of that non‐favorable conformation increases in solution.
In the current work, the high resolution of the WT structure leads us to propose that the lattice is selecting for a conformation that is prevalent in the solution of the WT protein. We propose that the lower diffraction resolution of the I98X variants arises because they have more heterogeneous distributions of conformations in solution. Likewise, the apparent cooperativity of aldolase A activity suggests that this protein can access multiple conformations in solution with a range of substrate affinities. Again, mutations at the I98X position show rheostatic shifts in n H , thereby indicating that some variants appear to be more cooperative than others; it follows that the conformational distributions likely differ for the I98X variants in solution.
Thus, the changes in both crystal resolution and n H that were observed among WT, I98C, I98S, and I98F support the conclusion that substituting position 98 influences the distribution of aldolase A conformations. The observation that these two parameters correlate suggests that they detect the same perturbation. Notably, the correlation between crystal resolution and the n H values appears to extend to the I98Y variant, which had the most extreme effects on diffraction resolution and enzyme activity, despite a similar fold as detected by CD. (Native‐like folding has been reported for other enzymatically compromised variants of aldolase. 10 , 37 ).
Intriguingly, a previous study of aldolase positions that confer isozyme‐specific functional differences found that many of these positions were located in regions of the wild‐type structure with high temperature factors. 11 These positions were also far from the active site, with 24 of 27 on the protein's surface (Figure S4). Spectroscopic studies of the “isozyme‐specific residue” (ISR) regions also suggested that aldolase adopts different conformations when fructose‐1‐phosphate is used as substrate instead of Fru‐1,6‐BP. 12 Thus, substitutions that alter protein dynamics and/or the distributions of conformations may be key to modulating aldolase function. In future studies, it will be interesting to compare and contrast changes in the distribution of the conformational landscape with changes in the structural flexibility of an individual conformation. Changes in the latter appear to mediate the functional changes associated with substituting a rheostat position in E. coli LacI. 14
3. CONCLUSION
Although only limited numbers of proteins have been biochemically evaluated for rheostat positions, these positions appear to be broadly distributed in many types of proteins. Here we expanded the identification of a rheostat position in human aldolase A. In addition, this study initiated an evaluation of which structural features are associated with rheostat positions. The structural data for I98X variants are consistent with the idea that the structure around a rheostat position accommodates a range of side chain types. Similar accommodations were computationally predicted for multiple variants at a rheostat position in the E. coli lactose repressor protein 14 and the sodium taurocholate co‐transporting polypeptide. 5
Thus, the ability to accommodate a range of side chains may be a general feature of proteins that contain rheostat positions and an important structural feature that allows the evolution of functional variation. This does not mean that substitutions at rheostat positions have zero structural consequences. For example, the aldolase A structures that crystallized for the I98X variants likely represent just one conformation of the functional ensemble; the altered resolution and n H values may result from shifts within this ensemble. Another possibility is that substitutions at rheostat positions lead to functionally important changes in protein dynamics, as have been computed for a rheostat position in LacI. 14 Because the aldolase A I98X structures represent one of the first structural evaluations of a rheostat position, more such positions should be characterized to evaluate whether a general feature associated with the presence of functional rheostat positions is the ability of the structure to accommodate multiple side chains with little or no structural rearrangements.
4. MATERIALS AND METHODS
4.1. Identification of positions with strong phylogenetic patterns of change
In prior work, 31 more than 1,500 sequences belonging to the aldolase family were identified using a BLAST search of the nonredundant protein database. 38 A 15% homology threshold was used to identify similar sequences, as strong structural and functional relationships can persist down to 15% identity. 39 Clustal Omega 40 was used to generate a multiple sequence alignment that was further refined using PROMALS. 41 Based on previous studies that identified that rheostat positions are enriched at positions that vary with speciation, 2 , 3 the algorithm TEA‐O 42 was used to detect changes in the sequence alignment that correlate with the major branch points of phylogenetic trees. Here, we used these algorithms to identify aldolase positions 51, 61, 64, 70, 98, 113, 123, 126, 142, 175, 177, 203, 206, 214, 220, 235, 257, 269, 283, and 296 as having high evolutionary patterning and lacking a co‐evolutionary pattern. Structurally, these positions are distributed throughout aldolase (Figure S1). Also of note, all active site positions (34, 43, 108, 147, 188, 230, 272, and 304) were excluded by these bioinformatic filters. Of the “phylogenetic” positions identified, we chose position 98 for the current study.
4.2. Generation of I98X variants
The coding region of human aldolase A (UniProtKB P04075) was cloned onto the NdeI and BamHI sites of the pET‐11a vector by GenScript (Piscataway, NJ). Mutations were created using Quikchange mutagenesis (Agilent) and primers (integrated DNA Technologies) that were degenerate in codon 98 to generate random substitutions. We previously defined rheostat positions as ones for which a set of substitutions samples at least half of the accessible functional range and demonstrated that 10 substitutions were sufficient to classify positions as a rheostat position. 1 Therefore, no effort was made to generate all possible substitutions at position 98. Once obtained, plasmids carrying mutated genes were transformed into BL21 E. coli and transformed cells were selected by adding ampicillin to the LB agar media. DNA from individual colonies was purified and then transformed a second time into BL21 E. coli, again using ampicillin as a selection marker. This DNA purification/second transformation step was used to avoid the potential of one colony containing two different mutant plasmids, an outcome that is possible due to the use of degenerate primers. 2 Individual colonies were selected and grown in LB media containing ampicillin and DNA was sequenced with Sanger sequencing across the targeted codon (GeneWiz, South Plainfield, NJ) to identify the sequence of the aldolase gene present. Colonies containing useful mutations were grown in LB media and cells were harvested using centrifugation. Cell pellets were frozen at −20°C until enzymatic assays were performed.
4.3. Protein preparation for high‐throughput enzymatic assays
Frozen cell pellets were thawed and diluted with sonication buffer (250 mM MOPS, 40 mM EDTA, 1% [vol/vol] glycerol, 2 mM DTT, and 1 μM PMSF, pH 7) to a final volume of 32.5 ml in a 50 ml conical centrifuge tube. While on ice, resuspended cells were disrupted with a Fisher Brand Sonic Dismembraner Model 500 at 100% amplitude, using a 5 s “on” and 45 s “off” cycle, until the total “on time” was 4 min. After the completion of sonication, 0.2 g of ammonium sulfate was added for each ml of solution, and samples were gently inverted until all ammonium sulfate was dissolved. The samples were centrifuged at 14,000 RPM for 45 min at 4°C in a Sorval SS‐34 rotor. For each 1 ml of the supernatant, 0.19 g of ammonium sulfate was added, and the sample was gently inverted until all ammonium sulfate was dissolved. The sample was centrifuged as before. The pellet from the second centrifugation step was subsequently dialyzed into 100 mM triethanolamine, 10 mM EDTA, 100 mM KCl, 1 mM DTT. This buffer was set to a pH of 7.4 at 30°C. Buffer was exchanged every 30 min for a total of three buffer changes. Samples were assayed immediately for enzymatic activity.
4.4. Enzymatic assays
Aldolase activity was measured by coupling glyceraldehyde‐3‐phosphate production with the glyceraldehyde‐3‐phosphate dehydrogenase reaction, which requires NADH. Therefore, the oxidation in NADH could be monitored by the loss in absorbance at 340 nm. All assays included 1 mM DTT, excess (~3U activity or 1.7 μl of the stock 10 g/ml) dialyzed glycerol‐3‐phosphate dehydrogenase (Roche Diagnostics), and 900 μM NADH. With the exceptions noted in Figure S2, assays were in 29 mM buffer (Tris or Triethanolamine), 2.9 mM EDTA, and 29 mM KCl. The reaction was initiated by the addition of Fru‐1,6‐BP (concentrations varied). Assays were carried out on a 96 well plate with technical triplicates collected in the same plate. The change of absorbance at A340 from NADH consumption was detected using a Molecular Devices SpectraMax 384 plus spectrophotometer.
An important feature of the assay design was the inclusion of a high concentration of EDTA and the absence of any added divalent cation to the assay. Aldolase from E. coli requires a divalent metal cation for activity. 43 The plasmid‐expressed, human aldolase does not require a divalent cation for activity. 43 Therefore, inclusion of EDTA in the purification and in the assay is anticipated to chelate any divalent cation that may be present, thus inhibiting E. coli aldolase and assuring that all activity is associated with the mammalian isozyme. As expected, control experiments for WT aldolase, with and without 2.9 mM EDTA, showed no difference in activity, indicating that any E. coli aldolase had no measurable activity in this assay design. Likewise, extracts from cells lacking the aldolase expression plasmid showed zero aldolase activity.
4.5. Analyses of kinetic activity
For all variants, the response of initial velocity (v) to changes in substrate concentration were first corrected for any background activity (activity in the absence of substrate). The corrected data at various concentrations of Fru‐1,6‐BP (FBP used in equation) were then fit to Equation (1) using fitting algorithms included in KaleidaGraph.
| (1) |
where V max is the maximum velocity, K app is the concentration of substrate that yields a rate equal to one‐half the V max, n H is the Hill coefficient and c is a background rate that results in an upward trend after the V max plateau has been reached. The use of K app is intended to represent both a K m when the n H value is equal to 1 and a K 0.5 value when the n H ≠ 1. Because protein samples were not completely purified (a necessary trade off to facilitate the high‐throughput data collecting needed in this study), the resulting V max values cannot be compared among substituted proteins. Therefore, after completing the initial fits, all data were normalized to the respective fit V max value and are presented in figures as a % of V max.
Both the K app and the n H values were compared to gain further insights into the functional role of position 98. Although data are presented in figures with triplicate data for each protein fit collectively (i.e., a single line), data analysis was completed by a non‐linear least squares fit of each separate data set to Equation (1) (triplicate determinations of K app and n H ). The fit parameters from those three data sets/fits were averaged and reported in Table 1, along with SDs of this mean.
4.6. Cloning and protein expression and purification for crystallography
For crystallographic studies, the wild type and variant human muscle aldolase A gene (UniProtKB: P04075) was codon optimized for expression in Escherichia coli and purchased from GenScript in a pET15TB‐L vector (Addgene plasmid 26093). The resulting plasmids encode the wild type or variant aldolase A protein with an N‐terminal hexahistidine tag that can be cleaved with TEV protease. The overexpression constructs for wild type and variant aldolase A were transformed into BL21(DE3) E. coli (New England Biolabs) and grown overnight at 37°C in 50 ml of LB Miller media with 50 μg/ml ampicillin in a shaker incubator (250 rpm). LB Miller broth (1 L) with 200 μg/ml ampicillin was inoculated with 10 ml of the overnight culture and grown at 37°C in a baffled flask in a shaker incubator (250 rpm). Protein expression was induced with a final concentration of 0.2 mM isopropyl β‐d‐1‐thiogalactopyranoside (IPTG) when the OD600nm reached 1.0 and the culture was further incubated at 30°C for 3 hr with shaking. The cells were harvested by centrifugation (6,000× g, 10 min, 4°C). The cell pellet was resuspended in 10 ml of 25 mM Tris–HCl pH 8.0, 50 mM imidazole, 10% glycerol, and 500 mM NaCl per liter of culture broth. Resuspended cells were lysed by passage through a French Press (35,000 psi) three times. The cell lysate was centrifuged at 12,000× g for 30 min at 4°C. The supernatant was injected onto a 25 ml chelating sepharose fast flow (GE Healthcare) column charged with nickel chloride and pre‐equilibrated with 25 mM Tris: HCl pH 8.0, 50 mM imidazole, 10% glycerol, 500 mM NaCl. The protein was eluted with a step gradient increasing the imidazole concentration to 300 mM imidazole. The pooled protein was injected onto a Superdex 200 gel‐filtration column (GE Healthcare), pre‐equilibrated with 25 mM Tricine pH 8.0, 20 mM potassium chloride. Aldolase A was concentrated using an Amicon® Ultracell® 30 K centrifugal concentrator to 12–29 mg/ml as determined by Bradford and stored at −80°C for later use. Proper folding for variant proteins was confirmed by comparing the circular dichroism spectrum for each variant to that of the wild type protein (Figure S3).
4.7. Protein crystallization
Recombinant wild‐type and variant aldolase A crystals were grown at 4°C using the sitting drop method. Interestingly, the I98F and I98Y variants only grew at 4°C, whereas the other variants grew at room temperature but were better quality at 4°C. Each drop contained 1.0 μl of protein mixed with an equal volume of reservoir solution (described for each variant below). Hexagonal pencil‐shaped rods formed and grew to full size after 1 week. Crystals were transferred into reservoir solution supplemented with 24% glycerol as the cryoprotectant and flash‐cooled in liquid nitrogen prior to data collection.
Wild‐type aldolase A crystals were grown using 12.4 mg/ml purified protein in a reservoir solution containing 10% (wt/vol) poly(ethylene glycol) (PEG) 8,000, 18% (vol/vol) glycerol in 0.04 M potassium phosphate, pH 5.75. The I98C variant crystals were grown using 12.0 mg/ml purified protein in a reservoir solution of 10% (wt/vol) PEG 8,000, 21% (vol/vol) glycerol in 0.04 M potassium phosphate, pH 6.0. For the I98S variant, crystals were grown using 19.6 mg/ml purified protein in a reservoir solution of 10% (wt/vol) PEG 8,000, 15% (vol/vol) glycerol in 0.04 M potassium phosphate, pH 6.0. The I98F variant of aldolase A crystals were grown using 29 mg/ml purified protein in a reservoir solution of 12% (wt/vol) PEG 8,000, 15% (vol/vol) glycerol in 0.04 M potassium phosphate, pH 5.75. The I98Y variant of aldolase A crystals were grown using 11.3 mg/ml purified protein in a reservoir solution of 14% (wt/vol) PEG 8,000, 24% (vol/vol) glycerol in 0.04 M potassium phosphate, pH 5.75.
4.8. Diffraction data collection and structure determination
Diffraction data were collected remotely using Blu‐Ice 44 on beamlines 12–2 (wild type, I98C, I98S and I98Y variants) and 9–2 (I98F variant) at the Stanford Synchrotron Radiation Laboratory (SSRL), Menlo Park, California, USA. All data sets were collected at a wavelength of 0.9795 Å with 0.15° oscillation and 0.2 s exposure (wild type, I98C and I98S variants), 1.0 s exposure (I98Y variant) or 5.5 s (I98F variant) at a temperature of 100 K. For wild‐type aldolase A, 90° of the data were collected with 65% attenuation and a crystal to detector distance of 404.4 mm. For the I98C variant, 90° of data were collected with 63.5% attenuation and a crystal to detector distance of 385.5 mm. For the I98S variant, 180° of data were collected with 0% attenuation and a crystal to detector distance of 409.2 mm. For the I98F variant, 90° of data were collected with 0% attenuation and a crystal to detector distance of 627.1 mm. For the I98Y variant, 60° of data were collected with 0% attenuation and a crystal to detector distance of 650.0 mm.
All data were processed in autoPROC 45 using an ellipsoidal resolution cutoff to account for the observed anisotropy. For the wild type aldolase A, the data was processed to 1.98 Å resolution with the ellipsoidal completeness in the outer shell of 79% at 1.98 Å resolution. The spherical completeness in the outer shell was 97% at 2.44 Å resolution. For the I98C variant, the data was processed to 1.89 Å resolution with the ellipsoidal completeness in the outer shell of 82% at 1.89 Å resolution. The spherical completeness in the outer shell was 96% at 2.29 Å resolution. For the I98S variant, the data was processed to 2.13 Å resolution with the ellipsoidal completeness in the outer shell of 66% at 2.13 Å resolution. The spherical completeness in the outer shell was 97% at 2.69 Å resolution. For the I98F variant, the data was processed to 2.60 Å resolution with the ellipsoidal completeness in the outer shell of 62% at 2.60 Å resolution. The spherical completeness in the outer shell was 99% at 2.89 Å resolution. For the I98Y variant, the data was processed to 4.74 Å resolution with the ellipsoidal completeness in the outer shell of 41.6% at 4.74 Å resolution. The spherical completeness in the outer shell was 97.3% at 7.30 Å resolution. The I98Y variant data was not high enough resolution to refine and deposit. Following PDB guidelines, we have deposited the merged intensities from AIMLESS 46 prior to resolution cutoff to allow unbiased reprocessing of the data. The crystals were all assigned to space group P6422 with unit cell dimensions for wild type, I98C and I98S variants of a = b = 162 Å, c = 168 Å, α = β = 90°, and γ = 120°, the I98F variant with unit cell dimensions a = b = 160 Å, c = 165 Å, α = β = 90°, and γ = 120° and I98Y variant with unit cell dimensions a = b = 161 Å, c = 167 Å, α = β = 90°, and γ (Table 2).
TABLE 2.
Data collection, processing, and refinement
| Variant | Wild type | I98C | I98S | I98F | I98Y |
|---|---|---|---|---|---|
| Diffraction source | 12‐2, SSRL | 12‐2, SSRL | 12‐2, SSRL | 9‐2, SSRL | 12‐2, SSRL |
| Wavelength (Å) | 0.97946 | 0.97946 | 0.97946 | 0.97946 | 0.97946 |
| Temperature (K) | 100 | 100 | 100 | 100 | 100 |
| Detector | PILATUS 6M | PILATUS 6M | PILATUS 6M | PILATUS 6M | PILATUS 6M |
| Crystal‐to‐detector distance (mm) | 404.4 | 385.5 | 409.2 | 627.1 | 650 |
| Rotation range per image (°) | 0.15 | 0.15 | 0.15 | 0.15 | 0.15 |
| Total rotation range (°) | 90 | 90 | 180 | 90 | 60 |
| Space group | P6 4 22 | P6 4 22 | P6 4 22 | P6 4 22 | P6 4 22 |
| a, b, c (Å) | 161.9, 161.9, 168.1 | 162.6, 162.6, 167.8 | 162.2, 162.2, 167.9 | 159.7, 159.7, 165.3 | 161.3, 161.3, 166.8 |
| α, β, γ (°) | 90, 90, 120 | 90, 90, 120 | 90, 90, 120 | 90, 90, 120 | 90, 90, 120 |
| Mosaicity (°) | 0.10 | 0.08 | 0.11 | 0.08 | 0.18 |
| Resolution range (Å) | 140.20–1.95 (2.20–1.95) | 107.85–1.89 (2.08–1.89) | 140.5–2.13 (2.42–2.13) | 138.29–2.60 (2.84–2.60) | 80.6–4.74 (5.99–4.74) |
| Total no. of reflections | 549,062 (32847) | 642,995 (33153) | 719,706 (32148) | 240,662 (7121) | 18,133 (1487) |
| No. of unique reflections | 56,578 (2830) | 65,292 (3266) | 39,448 (1972) | 26,180 (1309) | 2,757 (198) |
| Completeness (%) a | 93.8 (78.9) | 94.6 (81.5) | 88.4 (64.6) | 89.9 (61.3) | 80.7 (41.6) |
| Multiplicity | 9.7 (11.6) | 9.8 (10.2) | 18.2 (16.3) | 9.2 (5.4) | 6.6 (7.5) |
| ⟨I/σ(I)⟩ | 10.7 (2.2) | 14.4 (2.2) | 11.2 (2.1) | 12.7 (1.6) | 6.1 (1.6) |
| R p.i.m. (%) | 0.046 (0.356) | 0.027 (0.347) | 0.068 (0.738) | 0.041 (0.425) | 0.170 (1.186) |
| Overall B factor from Wilson plot (Å2) | 34.86 | 37.08 | 42.83 | 47.71 | |
| Resolution range (Å) | 40.85–1.95 (1.98–1.95) | 40.2–1.88 (1.95–1.88) | 37.27–2.11 (2.18–2.11) | 53.03–2.60 (2.69–2.60) | |
| No. of reflections | |||||
| Working set | 56,572 (363) | 65,277 (710) | 39,251 (319) | 26,141 (1) | |
| Test set | 2,803 (17) | 3,139 (33) | 1923 (12) | 1,271 (0) | |
| Final R cryst | 23.86 (23.60) | 24.51 (36.58) | 23.36 (35.95) | 21.29 (12.93) | |
| Final R free | 28.61 (34.39) | 28.56 (45.80) | 29.66 (31.74) | 25.92 | |
| No. of non‐H atoms | |||||
| Total | 5,668 | 5,693 | 5,477 | 5,471 | |
| Protein | 5,379 | 5,386 | 5,359 | 5,382 | |
| Ligand | 62 | 56 | 56 | 56 | |
| Water | 227 | 251 | 62 | 33 | |
| R.m.s. deviations | |||||
| Bonds (Å) | 0.02 | 0.024 | 0.017 | 0.017 | |
| Angles (°) | 1.54 | 1.86 | 1.7 | 1.76 | |
| Average B factor (Å2) | |||||
| Protein | 39.88 | 39.18 | 45.01 | 41.22 | |
| Ramachandran plot | |||||
| Most favored (%) | 95.42 | 95.32 | 93.55 | 92.12 | |
| Allowed (%) | 4.58 | 4.54 | 6.45 | 7.74 | |
| Outliers (%) | 0 | 0.14 | 0 | 0.14 |
Processed using an ellipsoidal resolution cutoff to account for the observed anisotropy. For spherical resolution/completeness, see text.
Molecular replacement calculations were performed using Phaser in the PHENIX program suite, 47 using the published human muscle aldolase A (PDB entry 1ALD) containing no solvent or ligand molecules as the search model. This yielded a clear solution with each structure (excluding the I98Y variant) containing a dimer in the asymmetric unit. Log likelihood gains ranged from 3,700–8,000 with TFZ scores of 19.9–21.9. The dimers in the asymmetric unit form a tetramer when crystallographic symmetry is applied, similar to the crystallographic tetramers observed in other human muscle aldolase structures (PDB: 1ALD, 2ALD, and 4ALD 13 , 48 ). Model building and refinement were performed using Coot 49 and phenix.refine 50 and waters were placed by phenix.refine, corrected manually and verified using a 2mF o –DF c electron‐density map contoured at 1.5 σ following a round of refinement. Phosphate ions and glycerol molecules were placed after the polypeptide backbone had been refined. The wild type and variant structures show translational pseudo‐symmetry resulting in higher‐than‐expected R cryst values. The summary data for the final models including residues and ligands built are provided in Table 3. Geometry analysis was performed by MolProbity. 51 A short unstructured loop is seen in all but one of the monomers in the four structures (Table 3). All residues were within allowed Ramachandran regions except for Pro189 in the B monomer of I98C and I98F. Structure figures were generated in PyMOL v2.1. (Schrödinger) and the atomic coordinates and structure factors have been deposited in the Protein Data Bank with accession codes 6XMH (wild type), 6XML (I98C variant), 6XMM (I98S variant), and 6XMO (I98F variant).
TABLE 3.
Model components
| Protein | PDB code | ASU a | Ordered residues by chain | Waters | Ligands b |
|---|---|---|---|---|---|
| WT | 2 | A: 5–345, 350–364 | 227 | Four phosphate, seven glycerol | |
| B: 6–345, 351–361 | |||||
| I98C | 2 | A: 6–345, 349–361 | 251 | Four phosphate, six glycerol | |
| B: 5–362 | |||||
| I98S | 2 | A: 5–345, 349–360 | 63 | Four phosphate, six glycerol | |
| B: 5–346, 350–360 | |||||
| I98F | 2 | A: 7–345, 351–364 | 33 | Four phosphate, six glycerol | |
| B: 7–345, 351–364 |
Number of monomers in the asymmetric unit.
Phophates and glycerol were in the well solution.
AUTHOR CONTRIBUTIONS
Kathryn D. Fenton: Methodology (equal). Kathleen M. Meeneely: Data curation (equal); methodology (equal). Tiffany Wu: Data curation (equal). Tyler A. Martin: Data curation (equal). Liskin Swint‐Kruse: Conceptualization (equal); funding acquisition (equal); project administration (equal). Aron W. Fenton: Conceptualization (equal); funding acquisition (equal); project administration (equal); supervision (equal). Audrey L. Lamb: Conceptualization (equal); funding acquisition (equal); project administration (equal); supervision (equal).
Supporting information
Appendix S1: Supporting information
ACKNOWLEDGEMENTS
We greatly appreciate Dr. Dean Tolan (Boston University) for his willingness to share the plasmid containing the aldolase gene and for answering a range of questions at the initiation of this study. This project served as a training tool in several ways and through those exercises at KUMC, Qingling Tang, Dipika Singh, Edina Kósa, Braelyn Page, Noah Brady, Larissa L. Dougherty, Carrie Hillebrand, Max Fairlamb, Kristen Schwingen, Nicole M Hoitsma, Hannah Bradford, and Brittni Jones all contributed (either as the trainer or the trainee) to data management, sequence evolutionary evaluations, creating mutations, and/or E. coli transformation with plasmid DNA. The crystallography of this project was initiated by Kathryn Brewer (KU‐Lawrence), serving as the basis of her undergraduate honors thesis, with technical guidance from Dr. Annemarie Chilton (KU‐Lawrence). Dr. Andie Cassity (KU‐Lawrence) grew crystals of the I98F protein. Funding was provided by NIH grant GM118589 and a grant from the W.M. Keck Foundation.
Fenton KD, Meneely KM, Wu T, Martin TA, Swint‐Kruse L, Fenton AW, et al. Substitutions at a rheostat position in human aldolase A cause a shift in the conformational population. Protein Science. 2022;31:357–370. 10.1002/pro.4222
Funding information National Institute of General Medical Sciences, Grant/Award Number: gm118589; W. M. Keck Foundation
Contributor Information
Aron W. Fenton, Email: afenton@kumc.edu.
Audrey L. Lamb, Email: audrey.lamb@utsa.edu.
REFERENCES
- 1. Hodges AM, Fenton AW, Dougherty LL, Overholt AC, Swint‐Kruse L. RheoScale: A tool to aggregate and quantify experimentally determined substitution outcomes for multiple variants at individual protein positions. Hum Mutat. 2018;39:1814–1826. [DOI] [PMC free article] [PubMed] [Google Scholar]
- 2. Meinhardt S, Manley MW Jr, Parente DJ, Swint‐Kruse L. Rheostats and toggle switches for modulating protein function. PLoS One. 2013;8:e83502. [DOI] [PMC free article] [PubMed] [Google Scholar]
- 3. Swint‐Kruse L, Martin TA, Page BM, et al. Rheostat functional outcomes occur when substitutions are introduced at nonconserved positions that diverge with speciation. Protein Sci. 2021;30:1833–1853. [DOI] [PMC free article] [PubMed] [Google Scholar]
- 4. Wu T, Swint‐Kruse L, Fenton AW. Functional tunability from a distance: Rheostat positions influence allosteric coupling between two distant binding sites. Sci Rep. 2019;9:16957. [DOI] [PMC free article] [PubMed] [Google Scholar]
- 5. Ruggiero MJ, Malhotra S, Fenton AW, Swint‐Kruse L, Karanicolas J, Hagenbuch B. A clinically‐relevant polymorphism in the Na(+)/taurocholate cotransporting polypeptide (NTCP) occurs at a rheostat position. J Biol Chem. 2021;296:100047. [DOI] [PMC free article] [PubMed] [Google Scholar]
- 6. Fenton AW, Page BM, Spellman‐Kruse A, Hagenbuch B, Swint‐Kruse L. Rheostat positions: A new classification of protein positions relevant to pharmacogenomics. Med Chem Res. 2020;29:1133–1146. [DOI] [PMC free article] [PubMed] [Google Scholar]
- 7. Bantis LE, Parent PJ, Fenton AW, Swint‐Kruse L. “Multiplex” rheostat positions cluster around allosterically critical regions of the lactose repressor protein. BioRxiv. 2020. 10.1101/2020.11.17.386979. [DOI]
- 8. Miller M, Bromberg Y, Swint‐Kruse L. Computational predictors fail to identify amino acid substitution effects at rheostat positions. Sci Rep. 2017;7:41329. [DOI] [PMC free article] [PubMed] [Google Scholar]
- 9. Miller M, Vitale D, Kahn PC, Rost B, Bromberg Y. Funtrp: Identifying protein positions for variation driven functional tuning. Nucleic Acids Res. 2019;47:e142. [DOI] [PMC free article] [PubMed] [Google Scholar]
- 10. Morris AJ, Tolan DR. Site‐directed mutagenesis identifies aspartate 33 as a previously unidentified critical residue in the catalytic mechanism of rabbit aldolase A. J Biol Chem. 1993;268:1095–1100. [PubMed] [Google Scholar]
- 11. Pezza JA, Choi KH, Berardini TZ, Beernink PT, Allen KN, Tolan DR. Spatial clustering of isozyme‐specific residues reveals unlikely determinants of isozyme specificity in fructose‐1,6‐bisphosphate aldolase. J Biol Chem. 2003;278:17307–17313. [DOI] [PubMed] [Google Scholar]
- 12. Rago F, Saltzberg D, Allen KN, Tolan DR. Enzyme substrate specificity conferred by distinct conformational pathways. J Am Chem Soc. 2015;137:13876–13886. [DOI] [PubMed] [Google Scholar]
- 13. Gamblin SJ, Davies GJ, Grimes JM, Jackson RM, Littlechild JA, Watson HC. Activity and specificity of human aldolases. J Mol Biol. 1991;219:573–576. [DOI] [PubMed] [Google Scholar]
- 14. Campitelli P, Swint‐Kruse L, Ozkan SB. Substitutions at nonconserved rheostat positions modulate function by rewiring long‐range, dynamic interactions. Mol Biol Evol. 2021;38:201–214. [DOI] [PMC free article] [PubMed] [Google Scholar]
- 15. Sherawat M, Tolan DR, Allen KN. Structure of a rabbit muscle fructose‐1,6‐bisphosphate aldolase A dimer variant. Acta Crystallogr. 2008;D64:543–550. [DOI] [PMC free article] [PubMed] [Google Scholar]
- 16. Sygusch J, Beaudry D. Allosteric communication in mammalian muscle aldolase. Biochem J. 1997;327:717–720. [DOI] [PMC free article] [PubMed] [Google Scholar]
- 17. Penhoet EE, Rutter WJ. Catalytic and immunochemical properties of homomeric and heteromeric combinations of aldolase subunits. J Biol Chem. 1971;246:318–323. [PubMed] [Google Scholar]
- 18. MacDonald JA, Storey KB. Purification and characterization of fructose bisphosphate aldolase from the ground squirrel, Spermophilus lateralis: Enzyme role in mammalian hibernation. Arch Biochem Biophys. 2002;408:279–285. [DOI] [PubMed] [Google Scholar]
- 19. Callens M, Kuntz DA, Opperdoes FR. Kinetic properties of fructose bisphosphate aldolase from Trypanosoma brucei compared to aldolase from rabbit muscle and Staphylococcus aureus. Mol Biochem Parasitol. 1991;47:1–9. [DOI] [PubMed] [Google Scholar]
- 20. Morse DE, Horecker BL. The mechanism of action of aldolases. Adv Enzymol Relat Areas Mol Biol. 1968;31:125–181. [DOI] [PubMed] [Google Scholar]
- 21. Sygusch J, Beaudry D. Subunit interaction in mammalian aldolases. Biochem J. 1997;323:671–676. [DOI] [PMC free article] [PubMed] [Google Scholar]
- 22. Vertessy BG, Orosz F, Ovadi J. Modulation of the interaction between aldolase and glycerol‐phosphate dehydrogenase by fructose phosphates. Biochim Biophys Acta. 1991;1078:236–242. 10.1016/0167-4838(91)90564-G [DOI] [PubMed] [Google Scholar]
- 23. Vertessy B, Ovadi J. A simple approach to detect active‐site‐directed enzyme‐enzyme interactions. The aldolase/glycerol‐phosphate‐dehydrogenase enzyme system. Eur J Biochem. 1987;164:655–659. [DOI] [PubMed] [Google Scholar]
- 24. Ovadi J, Matrai G, Bartha F, Batke J. Kinetic pathways of formation and dissociation of the glycerol‐3‐phosphate dehydrogenase‐fructose‐1,6‐bisphosphate aldolase complex. Biochem J. 1985;229:57–62. [DOI] [PMC free article] [PubMed] [Google Scholar]
- 25. Ovadi J, Mohamed Osman IR, Batke J. Interaction of the dissociable glycerol‐3‐phosphate dehydrogenase and fructose‐1,6‐bisphosphate aldolase. Quantitative analysis by an extrinsic fluorescence probe. Eur J Biochem. 1983;133:433–437. [DOI] [PubMed] [Google Scholar]
- 26. Batke J, Asboth G, Lakatos S, Schmitt B, Cohen R. Substrate‐induced dissociation of glycerol‐3‐phosphate dehydrogenase and its complex formation with fructose‐bisphosphate aldolase. Eur J Biochem. 1980;107:389–394. [DOI] [PubMed] [Google Scholar]
- 27. Hotz R, Leuthardt F. Concerning the inhibition of liver and muscle aldolase by glyceraldehyde‐3‐phosphate [German]. Helv Chim Acta. 1968;51:1305–1315. https://onlinelibrary.wiley.com/doi/10.1002/hlca.19680510613 [DOI] [PubMed] [Google Scholar]
- 28. Neuzil J, Danielson H, Welch GR, Ovadi J. Cooperative effect of fructose bisphosphate and glyceraldehyde‐3‐phosphate dehydrogenase on aldolase action. Biochim Biophys Acta. 1990;1037:307–312. [DOI] [PubMed] [Google Scholar]
- 29. Ouporov IV, Knull HR, Huber A, Thomasson KA. Brownian dynamics simulations of aldolase binding glyceraldehyde 3‐phosphate dehydrogenase and the possibility of substrate channeling. Biophys J. 2001;80:2527–2535. [DOI] [PMC free article] [PubMed] [Google Scholar]
- 30. Chumachenko YV. some evidence in favour of the partnership between rabbit muscle aldolase and glyceraldehyde 3‐phosphate dehydrogenase in the consecutive reactions. Ukr Biokhim Zh (1978). 1994;66:52–57. [PubMed] [Google Scholar]
- 31. Parente DJ, Ray JC, Swint‐Kruse L. Amino acid positions subject to multiple coevolutionary constraints can be robustly identified by their eigenvector network centrality scores. Proteins. 2015;83:2293–2306. [DOI] [PMC free article] [PubMed] [Google Scholar]
- 32. Martin TA, Wu T, Tang Q, et al. Identification of biochemically neutral positions in liver pyruvate kinase. Proteins. 2020;88:1340–1350. [DOI] [PMC free article] [PubMed] [Google Scholar]
- 33. Jancarik J, Pufan R, Hong C, Kim SH, Kim R. Optimum solubility (OS) screening: An efficient method to optimize buffer conditions for homogeneity and crystallization of proteins. Acta Crystallogr. 2004;D60:1670–1673. [DOI] [PubMed] [Google Scholar]
- 34. Zulauf M, D'Arcy A. Light scattering of proteins as a criterion for crystallization. J Cryst Growth. 1992;122:102–106. 10.1016/0022-0248(92)90232-8 [DOI] [Google Scholar]
- 35. Ferre‐D'Amare AR, Burley SK. Dynamic light scattering in evaluating crystallizability of macromolecules. Methods Enzymol. 1997;276:157–166. [DOI] [PubMed] [Google Scholar]
- 36. D'Arcy A. Crystallizing proteins—A rational approach? Acta Crystallogr. 1994;D50:469–471. [DOI] [PubMed] [Google Scholar]
- 37. Esposito G, Vitagliano L, Costanzo P, et al. Human aldolase A natural mutants: Relationship between flexibility of the C‐terminal region and enzyme function. Biochem J. 2004;380:51–56. [DOI] [PMC free article] [PubMed] [Google Scholar]
- 38. Altschul SF, Gertz EM, Agarwala R, Schaffer AA, Yu YK. PSI‐BLAST pseudocounts and the minimum description length principle. Nucleic Acids Res. 2009;37:815–824. [DOI] [PMC free article] [PubMed] [Google Scholar]
- 39. Tungtur S, Parente DJ, Swint‐Kruse L. Functionally important positions can comprise the majority of a protein's architecture. Proteins. 2011;79:1589–1608. [DOI] [PMC free article] [PubMed] [Google Scholar]
- 40. Madeira F, Park YM, Lee J, et al. The EMBL‐EBI search and sequence analysis tools APIs in 2019. Nucleic Acids Res. 2019;47:W636–W641. [DOI] [PMC free article] [PubMed] [Google Scholar]
- 41. Pei J, Kim BH, Grishin NV. PROMALS3D: A tool for multiple protein sequence and structure alignments. Nucleic Acids Res. 2008;36:2295–2300. [DOI] [PMC free article] [PubMed] [Google Scholar]
- 42. Ye K, Vriend G, IJzer AP. Tracing evolutionary pressure. Bioinformatics. 2008;24:908–915. [DOI] [PubMed] [Google Scholar]
- 43. Kobes RD, Simpson RT, Vallee RL, Rutter WJ. A functional role of metal ions in a class II aldolase. Biochemistry. 1969;8:585–588. [DOI] [PubMed] [Google Scholar]
- 44. McPhillips TM, McPhillips SE, Chiu HJ, et al. Blu‐ice and the distributed control system: Software for data acquisition and instrument control at macromolecular crystallography beamlines. J Synchrotron Radiat. 2002;9:401–406. [DOI] [PubMed] [Google Scholar]
- 45. Vonrhein C, Flensburg C, Keller P, et al. Data processing and analysis with the autoPROC toolbox. Acta Crystallogr. 2011;D67:293–302. [DOI] [PMC free article] [PubMed] [Google Scholar]
- 46. Evans PR, Murshudov GN. How good are my data and what is the resolution? Acta Crystallogr. 2013;D69:1204–1214. [DOI] [PMC free article] [PubMed] [Google Scholar]
- 47. McCoy AJ, Grosse‐Kunstleve RW, Adams PD, Winn MD, Storoni LC, Read RJ. Phaser crystallographic software. J Appl Cryst. 2007;40:658–674. [DOI] [PMC free article] [PubMed] [Google Scholar]
- 48. Dalby A, Dauter Z, Littlechild JA. Crystal structure of human muscle aldolase complexed with fructose 1,6‐bisphosphate: Mechanistic implications. Protein Sci. 1999;8:291–297. [DOI] [PMC free article] [PubMed] [Google Scholar]
- 49. Emsley P, Lohkamp B, Scott WG, Cowtan K. Features and development of coot. Acta Crystallogr. 2010;D66:486–501. [DOI] [PMC free article] [PubMed] [Google Scholar]
- 50. Adams PD, Afonine PV, Bunkoczi G, et al. PHENIX: A comprehensive python‐based system for macromolecular structure solution. Acta Crystallogr. 2010;D66:213–221. 10.1107/S0907444909052925 [DOI] [PMC free article] [PubMed] [Google Scholar]
- 51. Chen VB, Arendall WB 3rd, Headd JJ, et al. MolProbity: All‐atom structure validation for macromolecular crystallography. Acta Crystallogr. 2010;D66:12–21. [DOI] [PMC free article] [PubMed] [Google Scholar]
Associated Data
This section collects any data citations, data availability statements, or supplementary materials included in this article.
Supplementary Materials
Appendix S1: Supporting information