Real-world evidence on inactivated COVID-19 vaccines against the SARS-CoV-2 B.1.617.2 (Delta) variant is limited. The authors of this cohort study analyzed vaccination, surveillance, screening, tracing, and quarantine data to determine the effectiveness of inactivated COVID-19 vaccines against infections, pneumonia, and severe or critical illness caused by the Delta variant.
Visual Abstract. Effectiveness of Inactivated COVID-19 Vaccines Against the Delta Variant.
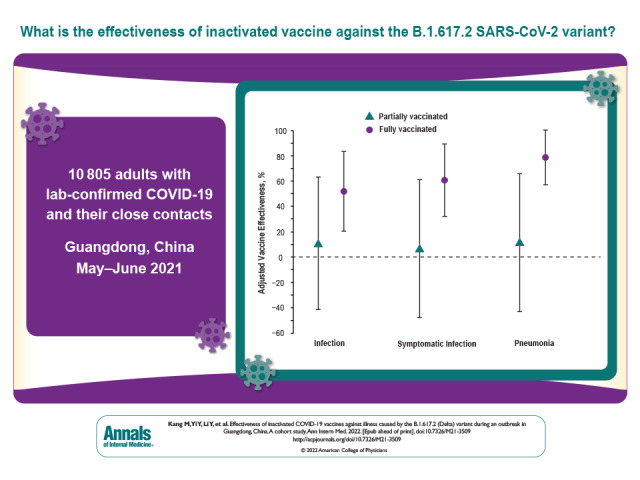
Real-world evidence on inactivated COVID-19 vaccines against the SARS-CoV-2 B.1.617.2 (Delta) variant is limited. The authors of this cohort study analyzed vaccination, surveillance, screening, tracing, and quarantine data to determine the effectiveness of inactivated COVID-19 vaccines against infections, pneumonia, and severe or critical illness caused by the Delta variant.
Abstract
Background:
Real-world evidence on inactivated COVID-19 vaccines against the highly transmissible B.1.617.2 (Delta) variant of SARS-CoV-2 is limited, leaving an important gap in the evidence base about inactivated COVID-19 vaccines for use by immunization programs.
Objective:
To estimate inactivated vaccine effectiveness (VE) against the B.1.617.2 variant.
Design:
Retrospective cohort study.
Setting:
The study was based on the first outbreak of the B.1.617.2 variant in mainland China that was discovered and traced in Guangdong in May and June 2021.
Participants:
10 805 adult case patients with laboratory-confirmed infection and close contacts.
Measurements:
Participants were categorized as unvaccinated, partially vaccinated (1 dose), and fully vaccinated (2 doses). We estimated VE against the primary outcome of pneumonia and the secondary outcomes of infections, symptomatic infections, and severe or critical illness associated with the B.1.617.2 variant.
Results:
Results are reported in the order of outcome severity. Of 10 805 participants, 1.3% contracted infections, 1.2% developed symptomatic infections, 1.1% had pneumonia, and 0.2% had severe or critical illness. The adjusted VEs of full vaccination were 51.8% (95% CI, 20.3% to 83.2%) against infection, 60.4% (CI, 31.8% to 88.9%) against symptomatic infection, and 78.4% (CI, 56.9% to 99.9%) against pneumonia. Also, full vaccination was 100% (CI, 98.4% to 100.0%) effective against severe or critical illness. By contrast, the adjusted VEs of partial vaccination against infection, symptomatic infection, and pneumonia were 10.7% (CI, −41.2% to 62.6%), 6.8% (CI, −47.4% to 61.0%), and 11.6% (CI, −42.6% to 65.8%), respectively.
Limitation:
Observational study with possible unmeasured confounders; insufficient data to do reliable subgroup analyses by age and vaccine brand.
Conclusion:
Full vaccination with inactivated vaccines is effective against the B.1.617.2 variant. Effort should be made to ensure full vaccination of target populations.
Primary Funding Source:
National Natural Science Foundation of China and Key-Area Research and Development Program of Guangdong Province.
Vaccination is considered an indispensable part of the long-term management of the COVID-19 pandemic (1, 2). Because of an unprecedented global effort to develop COVID-19 vaccines, numerous types of vaccines were approved in many jurisdictions by early 2021 (2–4). Among these, several were developed using whole-virus inactivation technology and have received partial or full approval in China and many other countries (4–7). In China alone, 4 inactivated vaccines have been distributed and administered: HB02 (Sinopharm), WIV04 (Sinopharm), CoronaVac (Sinovac), and BICV (Biokangtai), among which HB02 and CoronaVac were used most frequently (4, 8). Because of their long shelf life without the need for ultracold chain storage, inactivated vaccines are relatively easy to store and dispense (9–11). Combined with their documented efficacy from randomized clinical trials (RCTs), this may make inactivated vaccines a near-ideal candidate for mass immunization programs in low- and middle-income countries (8, 9, 12).
Although RCTs are the gold standard to estimate efficacy, their results may have limited generalizability because of participant selection and exclusion criteria and implementation restrictions. Real-world evidence supplements RCT data by providing insight on comparative effectiveness in various situations: among populations excluded from or insufficiently included in licensure RCTs, under different settings and epidemiologic situations, using alternative outcomes, or comparing a different lineage of the pathogen (13, 14). To date, published real-world evidence on COVID-19 vaccines has largely focused on messenger RNA (mRNA) vaccines, and these findings are similar to corresponding RCT results (15–19). Real-world evidence on inactivated vaccines remains sparse. One study in Chile assessed the effectiveness of CoronaVac, an inactivated vaccine used for mass vaccination in more than 20 countries, and provided convincing evidence of its protective effect against COVID-19 (20).
Owing to the effectively implemented zero-infection strategy, China has managed to clear all sporadic local outbreaks since April 2020, most of which lasted for less than 3 weeks and infected fewer than 100 persons. In late May 2021, an outbreak of a highly transmissible variant of SARS-CoV-2, the B.1.617.2 (Delta) variant, was discovered and traced in Guangdong, China (21). Characterized by spike protein mutations T19R, Δ157-158, L452R, T478K, D614G, P681R, and D950N, the B.1.617.2 variant reproduces at a faster rate than previous lineages seen in China, posing substantial challenges for disease control (21, 22). This was the first outbreak of the B.1.617.2 variant in mainland China. It lasted from 21 May to 18 June 2021, during which time 167 persons infected with the Delta variant were identified in clinical settings, in quarantine, or through community screenings. In addition to case identification, contact tracing of the outbreak continued through 23 June 2021, after which no more cases were reported. Before the start of this outbreak, China had already started to rapidly roll out mass immunization campaigns, and Guangdong province was one of the forerunners of vaccine deployment. Specifically, more than 90 million doses of inactivated vaccine were administered in Guangdong before mid-June 2021. As such, the outbreak was an opportunity to gain insight into the effectiveness of inactivated vaccines against the B.1.617.2 variant.
By analyzing vaccination, surveillance, screening, tracing, and quarantine data on China's COVID-19 prevention and control, we could assess the real-world effectiveness of inactivated vaccines against COVID-19 caused by the B.1.617.2 variant. More than 2 billion doses of inactivated COVID-19 vaccine have been administered in more than 80 countries and regions. Thus, evidence on the effectiveness of inactivated vaccines against the rampantly growing variant is critical for public health agencies and communities globally.
Methods
Study Population and Design
The local outbreak in Guangdong was started by an imported infection from abroad; that patient transmitted it to a local resident, who was the index case patient. All secondary local cases were well traced and linked to the index case in a single long chain of transmission (23, 24). In accordance with national and provincial protocols for COVID-19 prevention and control, close contacts were defined as all people who lived in the same household or stayed in the same public space without protection within close proximity in the 4 days before illness onset for symptomatic cases or sampling of the first positive specimen for asymptomatic cases (25). All close contacts were traced, mandatorily quarantined in centralized managed facilities, and followed with multiple reverse transcriptase polymerase chain reaction tests; they became part of our study cohort as the outbreak was proceeding and being managed. The Close Contacts Management section of the Appendix gives additional information on close contact definition and management, and the Laboratory Confirmation section gives information on specifications of test kits. Of note, all case patients were themselves close contacts of their upstream cases before they became infected. Therefore, the case patients and their close contacts made up a cohort together and should not be considered independent groups in an outbreak with a clear chain of transmission. We did a retrospective cohort analysis of all infected individuals and their close contacts identified in the Guangdong outbreak.
In addition to the index case (the first local infection), health authorities identified 12 500 individuals, including secondary case patients and close contacts. All positive specimens were subject to whole-genome sequencing. Individuals were excluded if basic demographic information was missing or if they received noninactivated vaccines. Because immunization campaigns in China requested a 21-day interval after the first dose and COVID-19 vaccines were provided only to adults until July 2021, persons who received 2 doses of vaccine but less than 21 days apart or were younger than 18 years were also excluded.
This study was approved by the institutional ethics committee of the Guangdong Provincial Center for Disease Control and Prevention. The data in the study were collected per administrative requirements of disease control and surveillance and were anonymized for analysis. Participants were informed about the requirements of disease surveillance and provided oral consent.
Vaccination Status
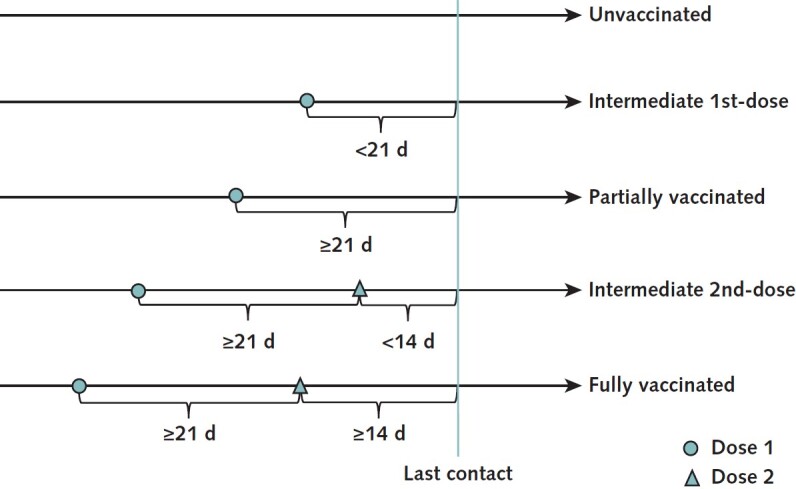
To determine vaccination status, we used the number of doses received and time elapsed since the most recent dose. On the basis of vaccination electronic records, participants were categorized into an unvaccinated group, a partially vaccinated (1-dose) group, and a fully vaccinated (2-dose) group. The unvaccinated group consisted of persons who did not receive any COVID-19 vaccines before their last known contact with a confirmed case patient. The partially vaccinated group comprised those who received their first dose 21 days or more before the last known contact. Persons who received their second dose at least 14 days before the last known contact made up the fully vaccinated group. Our primary analysis was a 3-group comparison. Those who received their first dose within 21 days (intermediate first dose) or their second dose within 14 days (intermediate second dose) before the last known contact were excluded from the primary analysis to avoid ambiguity in definition. Figure 1 illustrates categorization of the groups.
Figure 1. Vaccination status definitions.
Outcomes
The primary outcome was pneumonia caused by the B.1.617.2 variant of SARS-CoV-2. Secondary outcomes were infections, symptomatic infections, and severe or critical illness associated with the B.1.617.2 variant. However, results are reported following the hierarchy of outcome severity. Symptoms and severity were defined according to China's Diagnosis and Treatment Protocol for COVID-19 Patients (26). Pneumonia was diagnosed using chest imaging characteristics. Severe cases were those in which the patient had a respiratory rate above 30 breaths/min, resting blood oxygen saturation of 93% or lower, or Pao 2–FIo 2 ratio of 300 mm Hg or lower (26). In critical cases, patients had respiratory failure leading to mechanical ventilation, experienced shock, or sustained any other organ failure that required intensive care (26). Severity was based on a participant's most serious manifestations during the follow-up period.
Characteristics and Covariates
Epidemiologic investigators collected sociodemographic information, including age, sex, address, occupation, and contact frequency. These variables could potentially confound the vaccine effectiveness (VE) estimates by correlating with both vaccination and outcomes and were used as covariates in subsequent analyses. Age was categorized as 18 to 34 years, 35 to 49 years, or 50 years or older. In adherence to the national prevention and control scheme, investigators adjudicated contact frequency as occasionally, sometimes, or frequently. Contact frequency might correlate with vaccination status because vaccinated persons could be tempted to reduce adherence to nonpharmaceutical measures, such as social distancing (27, 28). Occupation might have been associated with vaccination status, in that professionals in occupations with high exposure risk were granted priority for vaccination during early 2021. To control potential confounding due to cross-occupation heterogeneity in the chances of vaccination and exposure to the virus during social interaction, we created indicators of working in restaurant services, working as a health care provider, and being currently unemployed. In addition, geographic area might lead to bias in estimation of VE if left unadjusted for because areas with different intensity of transmission might also have had different access to vaccines. Specifically, 2 subdistricts in Guangzhou (subdistricts A and B for simplicity) were epicenters of the outbreak. The cases in these 2 communities accounted for more than 60% of all outbreak cases. As such, residents of these 2 subdistricts could have had higher risk for exposure, yet access to vaccines in these communities was not necessarily the same as in other places. Therefore, an indicator was created for each of the 2 epicenter subdistricts and used as a covariate in addition to the sociodemographic variables.
Statistical Analysis
Primary Analysis
Characteristics of participants in each group were described using mean values (with SDs) and percentages. To estimate the unadjusted VE, the risk ratio (RR) of each outcome was calculated in reference to the unvaccinated group and subtracted from 1. In addition, we used multivariable logistic regressions to account for covariates that could potentially confound effect estimates. To estimate adjusted VE (aVE) from multivariable logistic regressions, we first calculated the adjusted RR (aRR) that equaled the ratio of the predicted event probability in each vaccination group to that in the unvaccinated group; the Adjusted Risk Ratio section of the Appendix elaborates on this (29–31). The aVE was then calculated as 1 − aRR. We used aRRs to calculate aVEs because RRs are intuitively understandable for cohort studies and because odds ratios consistently underestimated RRs for protection effects, leading to potentially exaggerated VE estimates (32). The SEs of aRRs were estimated using the delta method, which is frequently used for nonlinear transformations of regression coefficients (33). We used Stata, version 16 (StataCorp), with the logit routine and its postestimation features for analyses.
Sensitivity Analysis
In a prespecified sensitivity analysis, vaccination status was based on each person's number of doses before the outbreak. In this analysis, anyone who received their first dose but not their second dose before 7 May 2021 (14 days before 21 May 2021) was assigned to the partially vaccinated group, whereas those who received both doses before 7 May 2021 made up the fully vaccinated group. Those who received the initial dose after 7 May 2021 were excluded from this analysis. In addition, a between-dose window was not considered when determining vaccination status.
We also did several post hoc sensitivity analyses, making 1 change to the base case at a time (Post Hoc Sensitivity Analyses section of the Appendix). Specifically, we included all vaccination statuses as distinct exposure groups, used cluster-robust SEs, and replaced logistic regressions with Poisson regressions that allowed direct estimation of incidence rate ratios in the sensitivity analyses. To examine the potential effect of unmeasured confounders, we computed the E-values (E-Value section of the Appendix), which are the minimum strengths of association, on the RR scale, that unmeasured confounders would need to have with both the vaccination status and the outcomes to fully explain away a specific vaccination status–outcome association, conditional on the measured covariates (34).
Role of the Funding Source
The National Natural Science Foundation of China and Key-Area Research and Development Program of Guangdong Province had no role in study design, data collection, data analysis, data interpretation, or writing of the report.
Results
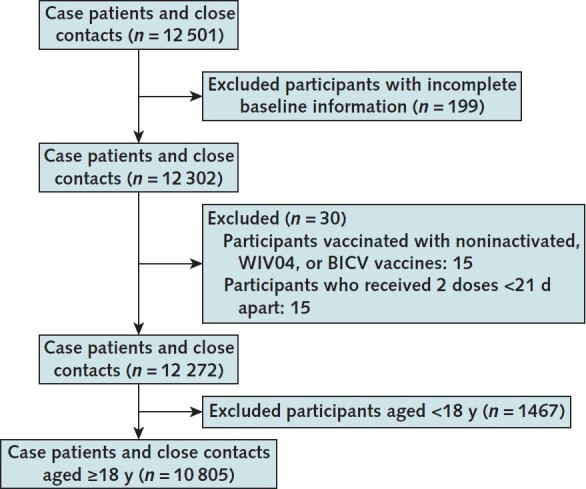
We applied the inclusion and exclusion criteria to the 12 501 cases and close contacts that were eligible for initial inclusion. Among these, 199 persons (1.6%) had missing sociodemographic information, 7 (0.1%) were vaccinated with noninactivated vaccines, 8 (0.1%) were vaccinated with WIV04 or BICV vaccines (excluded because of limited sample sizes), 15 (0.1%) had received 2 doses less than 21 days apart, and 1467 (11.7%) were younger than 18 years. Consequently, 10 805 participants met all inclusion and no exclusion criteria, none of whom had been previously infected with SARS-CoV-2. The participants were grouped into 5 categories based on vaccination history. Figure 2 shows the selection flow chart.
Figure 2. Study flow diagram.
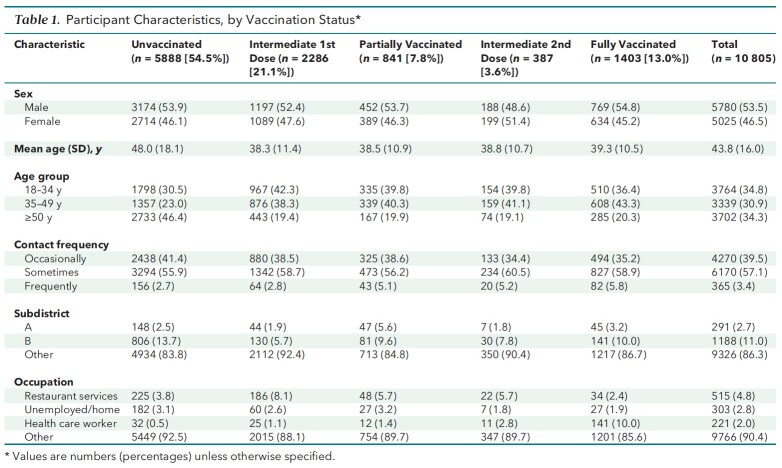
Of the 10 805 persons who met inclusion but not exclusion criteria, 5888 (54.5%) were unvaccinated, 2286 (21.1%) had an intermediate first dose, 841 (7.8%) were partially vaccinated, 387 (3.6%) had an intermediate second dose, and 1403 (13.0%) were fully vaccinated (Table 1). Appendix Table 1 shows the distribution of the vaccine brands among vaccinated participants.
Table 1.
Participant Characteristics, by Vaccination Status*
Appendix Table 1.
Number of Individuals, by Vaccination Status, Across Vaccine Brands*
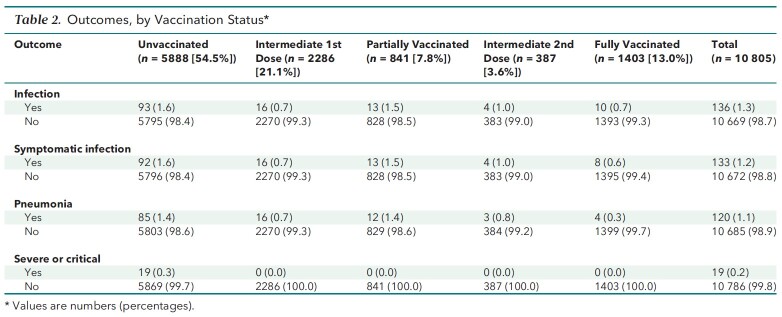
Across the 5 groups, age, contact frequency, living in subdistrict A or B, and occupation were unbalanced, whereas sex was distributed similarly. The unvaccinated group had the greatest mean age (48.0 years), the highest proportion of participants aged 50 years or older (46.4%), the highest proportion of occasional contact (41.4%), and the lowest proportion of frequent contact (2.7%). In addition, the unvaccinated group had a higher percentage of subdistrict B residents (13.7%) than any other group, whereas its percentage of subdistrict A residents (2.5%) was lower than that of the partially and fully vaccinated groups, but not of the intermediate first-dose and second-dose groups. The unvaccinated group had a proportion of unemployed participants (3.1%) second only to that of the partially vaccinated group and had the second-lowest proportion of restaurant services professionals (3.8%)—surpassed only by the fully vaccinated group. Table 1 lists the characteristics of the groups, and Table 2 summarizes the outcomes.
Table 2.
Outcomes, by Vaccination Status*
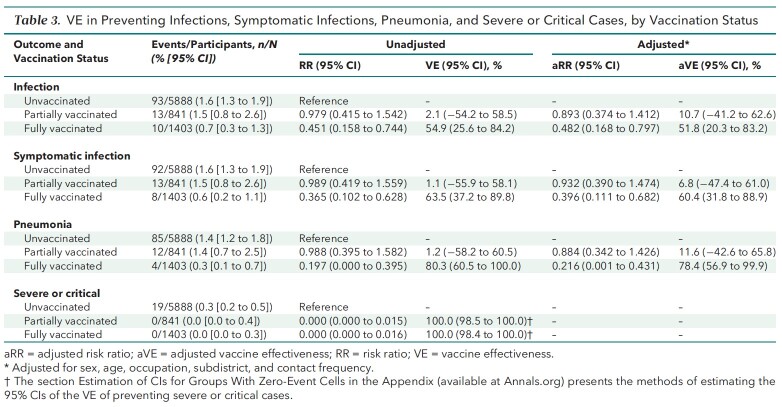
Unadjusted VE estimates are shown in Table 3. In the unvaccinated, partially vaccinated, and fully vaccinated groups, 93 (1.6%), 13 (1.5%), and 10 (0.7%) persons, respectively, had infections, corresponding to RRs of 0.979 (95% CI, 0.415 to 1.542) in the partially vaccinated group and 0.451 (CI, 0.158 to 0.744) in the fully vaccinated group. Accordingly, the unadjusted VEs of partial and full vaccination against infection were 2.1% (CI, −54.2% to 58.5%) and 54.9% (CI, 25.6% to 84.2%), respectively. Also, 92 persons (1.6%) in the unvaccinated group, 13 (1.5%) in the partially vaccinated group, and 8 (0.6%) in the fully vaccinated group had symptomatic infections, which amounted to RRs of 0.989 (CI, 0.419 to 1.559) in the partially vaccinated group and 0.365 (CI, 0.102 to 0.628) in the fully vaccinated group. Based on the RR results, the unadjusted VEs against symptomatic infection associated with the B.1.617.2 variant among the partially and fully vaccinated groups were 1.1% (CI, −55.9% to 58.1%) and 63.5% (CI, 37.2% to 89.8%), respectively.
Table 3.
VE in Preventing Infections, Symptomatic Infections, Pneumonia, and Severe or Critical Cases, by Vaccination Status
There were 85 cases (1.4%) of COVID-19 pneumonia in the unvaccinated group, 12 (1.4%) in the partially vaccinated group, and 4 (0.3%) in the fully vaccinated group. As such, the RRs of pneumonia associated with partial and full vaccination were 0.988 (CI, 0.395 to 1.582) and 0.197 (CI, 0.000 to 0.395), respectively, which corresponded to unadjusted VEs of 1.2% (CI, −58.2% to 60.5%) and 80.3% (CI, 60.5% to 100.0%) against pneumonia caused by the B.1.617.2 variant.
No severe or critical cases occurred among vaccinated participants. By contrast, unvaccinated participants had 19 (0.3%) severe or critical cases. As such, the unadjusted VEs of partial and full vaccination were 100.0% (CI, 98.5% to 100.0%) and 100.0% (CI, 98.4% to 100.0%), respectively, against severe or critical COVID-19 caused by the B.1.617.2 variant.
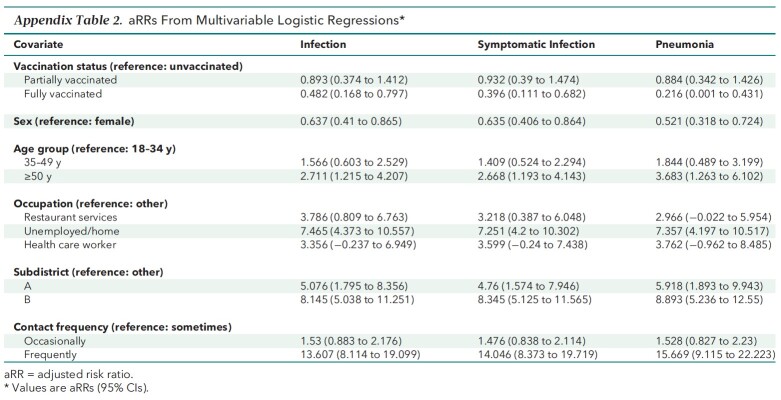
The aVEs and aRRs from multivariable logistic regressions are presented in Table 3 and Appendix Table 2. The main findings on aVEs are also shown in Figure 3. Multivariable analyses of severe or critical cases could not be done. On the basis of aRRs and aVEs, partial vaccination (compared with no vaccination) was not associated with a statistically significant difference in the incidence of any outcome. However, the aRRs of full vaccination against infection (0.482 [CI, 0.168 to 0.797]), symptomatic infection (0.396 [CI, 0.111 to 0.682]), and pneumonia (0.216 [CI, 0.001 to 0.431]) were significant. The corresponding aVEs were 51.8% (CI, 20.3% to 83.2%), 60.4% (CI, 31.8% to 88.9%), and 78.4% (CI, 56.9% to 99.9%).
Appendix Table 2.
aRRs From Multivariable Logistic Regressions*
Figure 3. Adjusted VE against outcomes of different severity associated with the B.
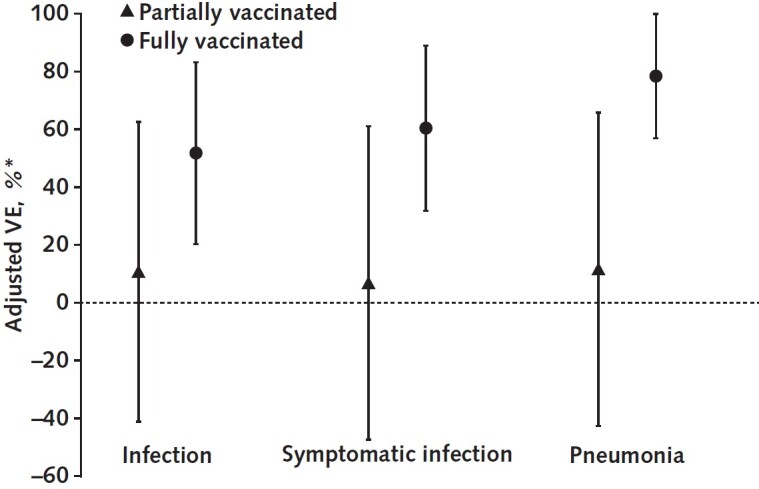
1.617.2 variant, by vaccination status. VE = vaccine effectiveness.
* Adjusted for sex, age, occupation, subdistrict, and contact frequency.
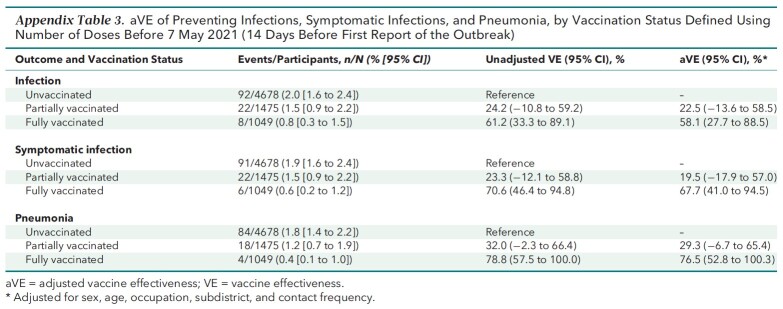
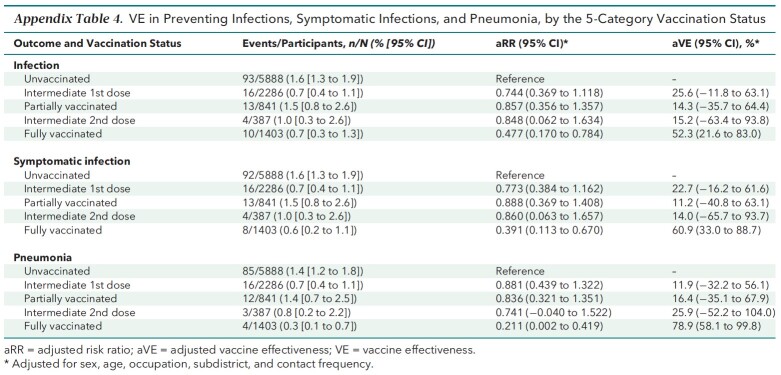
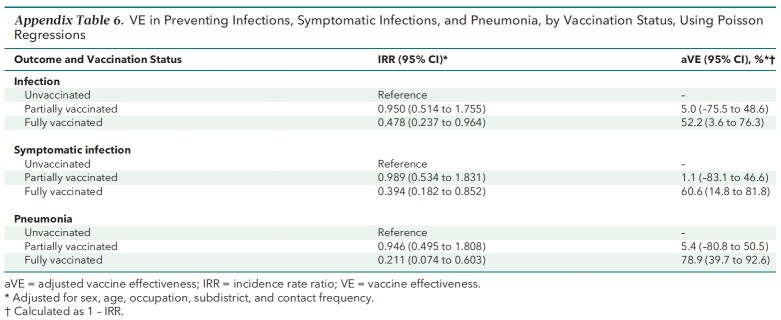
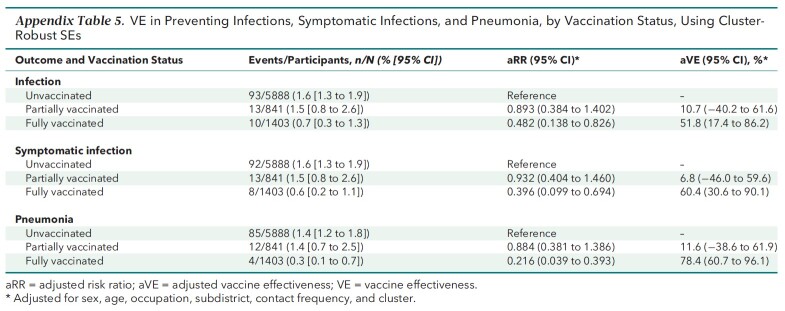
Appendix Table 3 shows the results of the prespecified sensitivity analyses using an alternative definition for vaccination status. Full vaccination was consistently effective against all outcomes, whereas partial vaccination was not. Also, the results of the post hoc sensitivity analyses (Appendix Tables 4 to 6) resembled the base-case results. The E-values for the strengths of association between unmeasured confounders and both the vaccination status and outcomes needed to explain away the aRR are listed in Appendix Table 7 and discussed in the E-Value section of the Appendix.
Appendix Table 3.
aVE of Preventing Infections, Symptomatic Infections, and Pneumonia, by Vaccination Status Defined Using Number of Doses Before 7 May 2021 (14 Days Before First Report of the Outbreak)
Appendix Table 4.
VE in Preventing Infections, Symptomatic Infections, and Pneumonia, by the 5-Category Vaccination Status
Appendix Table 6.
VE in Preventing Infections, Symptomatic Infections, and Pneumonia, by Vaccination Status, Using Poisson Regressions
Appendix Table 7.
E-Values for aRRs of Vaccination Statuses From the Base-Case Multivariable Logistic Regressions*
Appendix Table 5.
VE in Preventing Infections, Symptomatic Infections, and Pneumonia, by Vaccination Status, Using Cluster-Robust SEs
Discussion
Our study evaluated the effectiveness of inactivated COVID-19 vaccines against infections, symptomatic infections, pneumonia, and severe or critical illness caused by the B.1.617.2 variant in a real-world setting. By analyzing the cohort from a single transmission chain, we showed that the VEs of inactivated vaccines against the B.1.617.2 variant were 52% for SARS-CoV-2 infection, 60% for symptomatic COVID-19, 78% for COVID-19 pneumonia, and 100% for severe or critical COVID-19.
Our findings confirm the VE of inactivated vaccines against COVID-19 that has been reported by clinical and real-world studies (8, 12, 20). For example, an RCT in Brazil showed that CoronaVac, one of the inactivated vaccines, was 51% efficacious against symptomatic infections (12). In addition, a real-world study in Chile estimated that the VEs of CoronaVac against symptoms and hospitalizations due to COVID-19 caused by early lineages of SARS-CoV-2 were 66% and 88%, respectively (20). More, our findings confirm that inactivated COVID-19 vaccines will be effective even when the B.1.617.2 variant is prevalent, echoing recent findings on the effectiveness of mRNA-based vaccines against illness caused by that variant (22). However, inactivated vaccines may not be equally effective against the B.1.617.2 and other variants—a pattern shared by other vaccines (20, 22). Of note, the effect sizes of vaccines from the present study were not necessarily outstanding compared with reports in the literature (22, 35, 36).
CoronaVac and HB02 are both authorized by the World Health Organization for emergency use and together accounted for almost half of the COVID-19 vaccine doses dispensed globally as of October 2021 (37, 38). Therefore, our study has important policy implications. First, it is critically important to continue mass immunization programs to ensure full vaccination of the target population. As indicated by the results, partial vaccination with inactivated vaccines provides insufficient protection. Second, inactivated vaccines are a viable option to prevent COVID-19 despite recent mutations of the virus. Third, the estimates of VE against infections and illness call for refreshed evaluations of strategies to manage the pandemic in the long term. For example, preventing symptomatic infections remains an important task of global public health efforts because symptomatic patients are the ones suffering from illness and requiring medical attention. Fourth, although the current findings on VE are encouraging, recent reports on immunity waning are alarming, such that booster shots may be warranted (38, 39). Given their real-world effectiveness as well as convenient stocking and distribution, inactivated vaccines should be considered an option for immunity reinforcement programs on completion of population-level, 2-dose vaccination.
To our knowledge, this study adds unique contributions to the scientific literature. First, it expanded on a previous study on the real-word effectiveness of inactivated vaccines by investigating 2 instead of 1 specific type of vaccine in this class (20). Second, it provided preliminary evidence of the VE of inactivated vaccines against the B.1.617.2 variant using a cohort study design. Third, it is the first study that documented the effectiveness of COVID-19 vaccines against clinical outcomes other than intermediate end points of COVID-19 in mainland China using a relatively large sample size. By combining these features, the present study generated new evidence that helps informed decision making in regions that heavily engage inactivated vaccines to combat the pandemic, such as Southeast Asia and Latin America. A caveat for the interpretation of results is that the VE estimates may not necessarily apply equally to both brands of inactivated vaccines.
Our study has limitations. First, as with all observational studies, and although we controlled for known covariates, residual unmeasured confounders might have compromised the validity of the analyses. Second, moderate incidence rates and vaccination rates undermined the feasibility of subgroup analyses. For example, only 6 persons aged 60 years or older were fully vaccinated because the priority target group during the initial rollout was those aged 18 to 59 years; this makes reliable subgroup analyses by age impossible. A related concern was that the precision of the estimates, which were dependent on subgroup sample sizes and the number of infections, was suboptimal as reflected by the wide CIs. Third, although hospitalization is a routinely used outcome in the evaluation of VE, we did not use it because all patients with COVID-19 were hospitalized in China regardless of severity. In the present study, the outcome of severe or critical illness was used in lieu of hospitalization. Despite these limitations, we believe that our study provides useful insights on the effectiveness of vaccines and suggests that full vaccination with inactivated vaccines may be effective against COVID-19 associated with the B.1.617.2 variant of SARS-CoV-2.
Appendix: Appendix Methods
Close Contacts Management
Definition of Close Contacts
Close contacts are individuals who lived in the same household or stayed in the same public space without protection within close proximity in the 4 days before illness onset for symptomatic cases or sampling of the first positive specimen for asymptomatic cases. According to the epidemiologic investigation results and the digital information provided by government agencies, epidemiologic investigation professionals identify close contacts according to the following principles: 1) people who share living space; 2) direct caregivers or those who provide diagnosis, treatment, and nursing services; 3) health care workers who may be exposed to contaminated aerosols by conducting medical activities; 4) persons in close contact in the same place (for example, office, workshop, the same shift at workplace, elevator, canteen, or classroom); 5) persons who dine together, entertain together, and provide dining and entertainment services in a closed environment; 6) health care workers, family members, or other persons who attend an infected individual to provide medical or personal care; 7) persons who share a ride in the same vehicle and have close contact (within 1 meter) with an infected person, including caregivers and companions (for example, family members, colleagues, or friends); 8) persons exposed to environments and objects contaminated by infected persons; and 9) other persons who meet the criteria of close contact as assessed by onsite investigators.
Close Contacts Tracing
The local centers for disease control completed epidemiologic investigations of newly reported cases and traced and registered those patients' close contacts. They should have submitted the case investigation forms and close contact registration forms to the online reporting system as soon as possible. Close contact registration forms contain both sociodemographic and contact information, such as age, sex, address, occupation, times of last contact, and contact frequency.
Definition of Contact Frequency
“Occasionally” represented transient exposure, “sometimes” meant multiple nonenduring exposures, and “frequent” indicated multiple enduring exposures, such as people sharing a living space or workplace.
Management of Close Contacts
All close contacts were subject to quarantines following the 2-stage “14 + 7” model, which comprised a 14-day centralized quarantine stage and 1 week of home isolation (or centralized quarantine if self-isolation at home was not feasible).
For close contacts, the period of centralized quarantine for medical observation in designated facilities was 14 days after the last contact with a confirmed case patient or an asymptomatic infected person without effective protections.
The reverse transcriptase polymerase chain reaction tests were done on days 1, 4, 7, 10, and 14 during the centralized quarantine period for medical observation in designated facilities. Individuals released from quarantine practiced self-isolation at home for 7 days, during which they were tested again on days 2 and 7.
When the 21-day, 2-stage management period ended, the individual was dismissed from medical observation immediately if this person had no abnormal findings or symptoms.
Laboratory Confirmation
Four commercial reverse transcriptase polymerase chain reaction kits (DaAn Gene, BioGerm, BioPerfectus, and Easy Diagnosis) targeting the open reading frame (ORF1ab) and nucleocapsid protein genes were used to detect SARS-CoV-2 RNA during the outbreak.
When the case patients or close contacts were discharged from the hospital or released from quarantine, 2 nasopharyngeal swab samples should have been collected at the same time and tested with different reverse transcriptase polymerase chain reaction kits to avoid false negatives. In principle, the 2 tests are carried out by different testing institutions.
Adjusted Risk Ratio
After multivariable logistic regressions, the average risk for each outcome that would be expected if all participants in the analytic sample had received a specific vaccination exposure can be calculated. The ratio of the average predicted risks between 2 vaccination statuses represents the aRR of 1 group over the other. As such, the aRR was computed as the ratio of the average predicted risk (calculated over the entire sample) by setting the value of a specific exposure group indicator to 1 (that is, assuming everyone was in this group) over the average predicted risk by setting of the value of the reference exposure group indicator to 1 (assuming everyone was in the reference group) (29–31). For example, let PFV be the mean of predicted probabilities of pneumonia over the entire analytic sample when vaccination status is set to full vaccination, and let PNV be the corresponding value when the vaccination status of everyone is set to no vaccination; then:
 |
 |
Adjusted RR is then calculated as PFV / PNV. When there are no covariates other than the vaccination status exposure variables, the RR estimated this way is the same as the unadjusted RR computed conventionally. The estimation can be implemented in Stata using the following example code:
logit pneumonia i.vaccination i.sex i.age_groups i.occupation i.subdistrict i.contact_frequency, or
margins i.vaccination, post
nlcom (aRR:_b[1.vaccination] / _b[0.vaccination])
In this example, “1.vaccination” stands for a specific vaccination status group—for example, the full vaccination group—whereas “0.vaccination” stands for the reference vaccination group—for example, the no-vaccination group.
Post Hoc Sensitivity Analyses
Post hoc sensitivity analyses were done to further examine the robustness of results, per reviewer recommendations. In these analyses, 1 change was made to the base case at a time. In the first post hoc sensitivity analysis, all vaccination status groups were included in the multivariable analyses of VE. Namely, the groups were the unvaccinated group, the intermediate first-dose group, the partially vaccinated group, the intermediate second-dose group, and the fully vaccinated group. In the second post hoc sensitivity analysis, clusters were taken into account in the multivariable logistic regressions. The close contacts of each case in the transmission chain made up a cluster. Clusters could potentially affect the estimates of SEs of VEs. To that end, we estimated the VEs by using multivariable logistic regressions with cluster-robust SEs in this sensitivity analysis. In the third post hoc sensitivity analysis, the multivariable analyses in the base case were repeated using Poisson regressions in lieu of logistic regressions. The outputs from the multivariable Poisson regressions were incidence rate ratios. In all post hoc sensitivity analyses, the specification of covariates in the multivariable regressions remained the same as that in the base-case analysis.
E-Value
To test the robustness of the VE estimates to potential unmeasured confounders, we computed the E-values for both the aRRs and the upper bounds of their CIs (34). In observational studies, estimates of causal effects may be biased by confounders that correlate with both the exposure of interest (for example, fully vaccinated) and the outcomes (for example, pneumonia). When a confounder has a sufficiently sizeable amount of correlation with both the exposure and the outcome, the estimated effects in observational studies may be nullified. That is, the observed effects may be fully attributable to confounding bias rather than true effects. The E-value is a single metric that quantifies the sufficiently sizeable amount of correlation that an unmeasured confounder would need to have with both a specific vaccination status and a certain outcome to negate the observed VE (in the scale of RR) after adjustment for the measured covariates. As such, a larger E-value suggests stronger required confounder associations with the exposure and the outcome to explain away the observed VE. Of note, the aRRs should be less than 1 for VEs to exist; the upper bounds of statistically insignificant aRRs were greater than 1 to begin with. By definition, the E-values of such upper bounds were 1 (34).
Based on the results in Appendix Table 7, the E-values for full vaccination ranged from 3.6 to 8.7 and the range of E-values for the upper bounds of CIs was 1.8 to 4.1 for the outcomes of infection, symptomatic infection, and pneumonia, indicating that moderate to strong confounder associations with full vaccination and the outcomes needed to be present simultaneously to explain away the observed VE. Specifically, the statistical significance of the VE of full vaccination for infection could be explained away if there existed an unmeasured confounder that was associated with both full vaccination and infection with a strength at least as large as an RR of 1.8. The corresponding E-values of the VE of full vaccination for symptomatic infection and pneumonia were 2.3 and 4.1, respectively.
Estimation of CIs for Groups With Zero-Event Cells
The estimation of CIs for groups with zero-event cells was based on Bayesian binomial regressions as proposed by Möller and Ahrenfeldt (40). A set of example code to conduct this analysis in Stata is provided below.
bayes, nomleinitial noi rseed(20211015): binreg severe i.vaccination, rr asis
Footnotes
This article was published at Annals.org on 1 February 2022.
* Min Kang and Yao Yi contributed equally to this work.
References
- 1. Griffin M , Sohrabi C , Alsafi Z , et al. Preparing for COVID-19 exit strategies. Ann Med Surg (Lond). 2021;61:88-92. [PMID: ] doi: 10.1016/j.amsu.2020.12.012 [DOI] [PMC free article] [PubMed] [Google Scholar]
- 2. Moore S , Hill EM , Tildesley MJ , et al. Vaccination and non-pharmaceutical interventions for COVID-19: a mathematical modelling study. Lancet Infect Dis. 2021;21:793-802. [PMID: ] doi: 10.1016/S1473-3099(21)00143-2 [DOI] [PMC free article] [PubMed] [Google Scholar]
- 3. Forni G , Mantovani A ; COVID-19 Commission of Accademia Nazionale dei Lincei, Rome. COVID-19 vaccines: where we stand and challenges ahead. Cell Death Differ. 2021;28:626-639. [PMID: ] doi: 10.1038/s41418-020-00720-9 [DOI] [PMC free article] [PubMed] [Google Scholar]
- 4. Baraniuk C . What do we know about China's covid-19 vaccines. BMJ. 2021;373:n912. [PMID: ] doi: 10.1136/bmj.n912 [DOI] [PubMed] [Google Scholar]
- 5. Baraniuk C . Covid-19: What do we know about Sputnik V and other Russian vaccines. BMJ. 2021;372:n743. [PMID: ] doi: 10.1136/bmj.n743 [DOI] [PubMed] [Google Scholar]
- 6. Thiagarajan K . What do we know about India's Covaxin vaccine. BMJ. 2021;373:n997. [PMID: ] doi: 10.1136/bmj.n997 [DOI] [PubMed] [Google Scholar]
- 7. Liu R, Shen M, Kerry F. Kangtai Biological's COVID-19 vaccine gets emergency use approval in China. Reuters. 14 May 2021. Accessed at www.reuters.com/article/us-health-coronavirus-vaccine-kangtai-idUSKBN2CV1F6 on 27 June 2021.
- 8. Al Kaabi N, Zhang Y, Xia S, et al.. Effect of 2 inactivated SARS-CoV-2 vaccines on symptomatic COVID-19 infection in adults: a randomized clinical trial. JAMA. 2021;326:35-45. [PMID: ] doi: 10.1001/jama.2021.8565 [DOI] [PMC free article] [PubMed] [Google Scholar]
- 9. Rostad CA , Anderson EJ . Optimism and caution for an inactivated COVID-19 vaccine. Lancet Infect Dis. 2021;21:581-582. [PMID: ] doi: 10.1016/S1473-3099(20)30988-9 [DOI] [PMC free article] [PubMed] [Google Scholar]
- 10. Mallapaty S . China COVID vaccine reports mixed results — what does that mean for the pandemic. Nature. 2021. [PMID: ] doi: 10.1038/d41586-021-00094-z [DOI] [PubMed] [Google Scholar]
- 11. Holm MR , Poland GA . Critical aspects of packaging, storage, preparation, and administration of mRNA and adenovirus-vectored COVID-19 vaccines for optimal efficacy [Editorial]. Vaccine. 2021;39:457-459. [PMID: ] doi: 10.1016/j.vaccine.2020.12.017 [DOI] [PMC free article] [PubMed] [Google Scholar]
- 12. Palacios R, Batista AP, Albuquerque CSN, et al. Efficacy and safety of a COVID-19 inactivated vaccine in healthcare professionals in Brazil: the PROFISCOV study. SSRN. Preprint posted online 14 April 2021. doi: 10.2139/ssrn.3822780 [DOI]
- 13. Berger ML , Sox H , Willke RJ , et al. Good practices for real-world data studies of treatment and/or comparative effectiveness: recommendations from the joint ISPOR-ISPE Special Task Force on real-world evidence in health care decision making. Pharmacoepidemiol Drug Saf. 2017;26:1033-1039. [PMID: ] doi: 10.1002/pds.4297 [DOI] [PMC free article] [PubMed] [Google Scholar]
- 14. Bartlett VL , Dhruva SS , Shah ND , et al. Feasibility of using real-world data to replicate clinical trial evidence. JAMA Netw Open. 2019;2:e1912869. [PMID: ] doi: 10.1001/jamanetworkopen.2019.12869 [DOI] [PMC free article] [PubMed] [Google Scholar]
- 15. Haas EJ , Angulo FJ , McLaughlin JM , et al. Impact and effectiveness of mRNA BNT162b2 vaccine against SARS-CoV-2 infections and COVID-19 cases, hospitalisations, and deaths following a nationwide vaccination campaign in Israel: an observational study using national surveillance data. Lancet. 2021;397:1819-1829. [PMID: ] doi: 10.1016/S0140-6736(21)00947-8 [DOI] [PMC free article] [PubMed] [Google Scholar]
- 16. Dagan N , Barda N , Kepten E , et al. BNT162b2 mRNA Covid-19 vaccine in a nationwide mass vaccination setting. N Engl J Med. 2021;384:1412-1423. [PMID: ] doi: 10.1056/NEJMoa2101765 [DOI] [PMC free article] [PubMed] [Google Scholar]
- 17. Swift MD , Breeher LE , Tande AJ , et al. Effectiveness of messenger RNA coronavirus disease 2019 (COVID-19) vaccines against severe acute respiratory syndrome coronavirus 2 (SARS-CoV-2) infection in a cohort of healthcare personnel. Clin Infect Dis. 2021;73:e1376-e1379. [PMID: ] doi: 10.1093/cid/ciab361 [DOI] [PMC free article] [PubMed] [Google Scholar]
- 18. Pilishvili T , Fleming-Dutra KE , Farrar JL , et al; Vaccine Effectiveness Among Healthcare Personnel Study Team. Interim estimates of vaccine effectiveness of Pfizer-BioNTech and Moderna COVID-19 vaccines among health care personnel — 33 U.S. sites, January–March 2021. MMWR Morb Mortal Wkly Rep. 2021;70:753-758. [PMID: ] doi: 10.15585/mmwr.mm7020e2 [DOI] [PMC free article] [PubMed] [Google Scholar]
- 19. Thompson MG , Burgess JL , Naleway AL , et al. Prevention and attenuation of Covid-19 with the BNT162b2 and mRNA-1273 Vaccines. N Engl J Med. 2021;385:320-329. [PMID: ] doi: 10.1056/NEJMoa2107058 [DOI] [PMC free article] [PubMed] [Google Scholar]
- 20. Jara A , Undurraga EA , González C , et al. Effectiveness of an inactivated SARS-CoV-2 vaccine in Chile. N Engl J Med. 2021;385:875-884. [PMID: ] doi: 10.1056/NEJMoa2107715 [DOI] [PMC free article] [PubMed] [Google Scholar]
- 21. Campbell F , Archer B , Laurenson-Schafer H , et al. Increased transmissibility and global spread of SARS-CoV-2 variants of concern as at June 2021. Euro Surveill. 2021;26. [PMID: ] doi: 10.2807/1560-7917.ES.2021.26.24.2100509 [DOI] [PMC free article] [PubMed] [Google Scholar]
- 22. Lopez Bernal J, Andrews N, Gower C, et al.. Effectiveness of Covid-19 vaccines against the B.1.617.2 (delta) variant. N Engl J Med. 2021;385:585-594. [PMID: ] doi: 10.1056/NEJMoa2108891 [DOI] [PMC free article] [PubMed] [Google Scholar]
- 23. Wang Y , Chen R , Hu F , et al. Transmission, viral kinetics and clinical characteristics of the emergent SARS-CoV-2 Delta VOC in Guangzhou, China. EClinicalMedicine. 2021;40:101129. [PMID: ] doi: 10.1016/j.eclinm.2021.101129 [DOI] [PMC free article] [PubMed] [Google Scholar]
- 24. Zhang M , Xiao J , Deng A , et al. Transmission dynamics of an outbreak of the COVID-19 Delta variant B.1.617.2 — Guangdong Province, China, May–June 2021. China CDC Wkly. 2021;3:584-586. [PMID: ] doi: 10.46234/ccdcw2021.148 [DOI] [PMC free article] [PubMed] [Google Scholar]
- 25. National Health Commission of the People's Republic of China. The Prevention and Control Scheme of COVID-19. 8th ed. In Chinese. 14 May 2021. Accessed at www.nhc.gov.cn/jkj/s3577/202105/6f1e8ec6c4a540d99fafef52fc86d0f8/files/4a860a7e85d14d55a22fbab0bbe77cd9.pdf on 6 June 2021.
- 26. The General Office of National Health Commission of China, National Traditional Chinese Medicine Administration. Diagnosis and treatment protocol for COVID-19 patients (tentative 8th edition). Infectious Diseases & Immunity. 2021;1:8-16. doi: 10.1097/01.ID9.0000733564.2178 [DOI] [PMC free article] [PubMed]
- 27. Trogen B , Caplan A . Risk compensation and COVID-19 vaccines [Editorial]. Ann Intern Med. 2021;174:858-859. [PMID: ] doi: 10.7326/M20-8251 [DOI] [PMC free article] [PubMed] [Google Scholar]
- 28. Andersson O , Campos-Mercade P , Meier AN , et al. Anticipation of COVID-19 vaccines reduces willingness to socially distance. J Health Econ. 2021;80:102530. [PMID: ] doi: 10.1016/j.jhealeco.2021.102530 [DOI] [PMC free article] [PubMed] [Google Scholar]
- 29. Norton EC, Miller MM, Kleinman LC. Computing adjusted risk ratios and risk differences in Stata. Stata J. 2013;13:492-509. doi: 10.22004/ag.econ.249804 [DOI]
- 30. Kleinman LC , Norton EC . What's the risk? A simple approach for estimating adjusted risk measures from nonlinear models including logistic regression. Health Serv Res. 2009;44:288-302. [PMID: ] doi: 10.1111/j.1475-6773.2008.00900.x [DOI] [PMC free article] [PubMed] [Google Scholar]
- 31. Cummings P. Methods for estimating adjusted risk ratios. Stata J. 2009;9:175-96. doi: 10.1177/1536867x0900900201 [DOI]
- 32. Davies HT , Crombie IK , Tavakoli M . When can odds ratios mislead. BMJ. 1998;316:989-91. [PMID: ] [DOI] [PMC free article] [PubMed] [Google Scholar]
- 33. Cox C. Delta method. In: Armitage P, Colton T, eds. Encyclopedia of Biostatistics. 2nd ed. J Wiley; 2005:1550-2.
- 34. VanderWeele TJ , Ding P . Sensitivity analysis in observational research: introducing the E-value. Ann Intern Med. 2017;167:268-274. [PMID: ] doi: 10.7326/M16-2607 [DOI] [PubMed] [Google Scholar]
- 35. Fowlkes A , Gaglani M , Groover K , et al; HEROES-RECOVER Cohorts. Effectiveness of COVID-19 vaccines in preventing SARS-CoV-2 infection among frontline workers before and during B.1.617.2 (Delta) variant predominance — eight U.S. locations, December 2020–August 2021. MMWR Morb Mortal Wkly Rep. 2021;70:1167-1169. [PMID: ] doi: 10.15585/mmwr.mm7034e4 [DOI] [PMC free article] [PubMed] [Google Scholar]
- 36. Reis BY , Barda N , Leshchinsky M , et al. Effectiveness of BNT162b2 vaccine against delta variant in adolescents [Letter]. N Engl J Med. 2021;385:2101-2103. [PMID: ] doi: 10.1056/NEJMc2114290 [DOI] [PMC free article] [PubMed] [Google Scholar]
- 37. Li M , Lou F , Fan H . SARS-CoV-2 variants of concern Delta: a great challenge to prevention and control of COVID-19. Signal Transduct Target Ther. 2021;6:349. [PMID: ] doi: 10.1038/s41392-021-00767-1 [DOI] [PMC free article] [PubMed] [Google Scholar]
- 38. Mallapaty S . China's COVID vaccines have been crucial — now immunity is waning. Nature. 2021;598:398-399. [PMID: ] doi: 10.1038/d41586-021-02796-w [DOI] [PubMed] [Google Scholar]
- 39. Altmann DM , Boyton RJ . Waning immunity to SARS-CoV-2: implications for vaccine booster strategies. Lancet Respir Med. 2021;9:1356-1358. [PMID: ] doi: 10.1016/S2213-2600(21)00458-6 [DOI] [PMC free article] [PubMed] [Google Scholar]
- 40. Möller S , Ahrenfeldt LJ . Estimating relative risk when observing zero events—frequentist inference and Bayesian credibility intervals. Int J Environ Res Public Health. 2021;18. [PMID: ] doi: 10.3390/ijerph18115527 [DOI] [PMC free article] [PubMed] [Google Scholar]


