



Abstract
Purpose:
To assess racial/ethnic and socioeconomic disparities in the difference between atherosclerotic vascular disease prevalence measured by a multi-task convolutional neural network (CNN) deep learning model using frontal chest radiographs (CXRs) and the prevalence reflected by administrative hierarchical condition categories (HCC) codes, in two cohorts of patients with coronavirus disease 2019 (COVID-19).
Methods:
A CNN model, previously published, was trained to predict atherosclerotic disease from ambulatory frontal CXRs. The model was then validated on two cohorts of COVID-19 patients: 814 ambulatory patients from a suburban location (presenting 3/14/20 to 10/24/20, the internal ambulatory cohort) and 485 hospitalized patients from an inner-city location (hospitalized 3/14/2020 and 8/12/2020, the external hospitalized cohort). The CNN model predictions were validated against electronic health record (EHR) administrative codes in both cohorts and assessed using the area under the receiver operating characteristic (ROC) curves (AUCs). The CXRs from the ambulatory cohort were also reviewed by two board-certified radiologists and compared to the CNN-predicted values for the same cohort to produce an ROC and AUC. The atherosclerosis diagnosis discrepancy, Δvasc, refers to the difference between the predicted value and presence or absence of the vascular disease ICD10 code, was calculated. Linear regression determined the association of Δvasc with the covariates of age, sex, race/ethnicity, language preference and social deprivation index (SDI). Logistic regression was used to look for an association between the presence of any HCC codes with Δvasc and other covariates.
Results:
The CNN prediction for vascular disease from frontal CXRs in the ambulatory cohort had an AUC of 0.85 (95% confidence interval (CI) = 0.82–0.89) and in the hospitalized cohort had an AUC of 0.69 (95% CI = 0.64–0.75) against the EHR data. In the ambulatory cohort, the consensus radiologists’ reading had an AUC of 0.89 (95% CI = 0.86–0.92) relative to the CNN. Multivariate linear regression of Δvasc in the ambulatory cohort demonstrated a significant negative association with non-English language preference (β = −0.083, P < 0.05) and Black or Hispanic race/ethnicity (β = −0.048, P < 0.05) and a positive association with age (β = 0.005, P < 0.001) and sex (β = 0.044, P < 0.05). For the hospitalized cohort, age was also significant (β = 0.003, P < 0.01), as was SDI (β = 0.002, P < 0.05). The Δvasc variable (odds ratio (OR) = 0.34), Black or Hispanic race/ethnicity (OR= 1.58), non-English language preference (OR = 1.74) and site (OR = 0.22) were independent predictors of having one or more HCC codes (all P < 0.01) in the combined patient cohort.
Conclusions:
A CNN model was predictive of aortic atherosclerosis in two cohorts (one ambulatory and one hospitalized) with COVID-19. The discrepancy between the CNN model and the administrative code, Δvasc, was associated with language preference in the ambulatory cohort; in the hospitalized cohort, this discrepancy was associated with SDI. The absence of administrative code(s) was associated with Δvasc in the combined cohorts, suggesting that Δvasc is an independent predictor of health disparities. This may suggest that biomarkers extracted from routine imaging studies and compared with EHR data could play a role in enhancing value-based healthcare for traditionally underserved or disadvantaged patients where barriers to care exist.
Summary Statement:
Value-based care can be impacted when evaluating imaging biomarkers and social determinants of health detected through deep learning algorithms.
Introduction
Comorbidities are strongly associated with increased severity of coronavirus disease 2019 (COVID-19) infections, disproportionately affecting racial and ethnic minorities [1]. Many factors contribute to these disparities, including socioeconomics, geography, environment, and healthcare accessibility, all potentially resulting in underdiagnosis and undertreatment of disease [2]. Racial/ethnic minority populations tend to have a greater degree of underlying comorbidities, which can increase the risk of mortality from COVID-19 [2,3,4]. Non-White patients hospitalized with COVID-19 infection were more likely to have a higher severity of infection, on admission chest radiographs (CXRs), associated with limited English proficiency [5]. Detecting and measuring health disparities remains difficult and complex [6] and requires new technologies and techniques in a multidisciplinary approach.
In tandem with an increasing recognition of structural health disparities within the US healthcare delivery system, transformative progress towards value-based healthcare (VBH) is occurring. VBH is a data-dependent operational construct that emphasizes improved outcomes and decreased costs by managing chronic comorbidities, with reimbursements proportional to disease burden [7]. The Centers for Medicare and Medicaid Services maintain specific ICD-10 codes, hierarchical condition categories (HCCs), which have predictive power for future hospital costs [8]. HCCs contain groupings of multiple ICD-10 codes, generated through encounters with healthcare providers and recorded in administrative data. These data elements are often more reproducible and amenable to analysis than manual review of electronic health records (EHRs). These administrative data also predict mortality in patients with COVID-19 [9]. Using a convolutional neural network (CNN) to connect HCCs to CXRs can convert the images into useful biomarkers of patients’ chronic disease burden [10].
Deep learning (DL) has been extensively documented to propagate healthcare disparities and biases, mostly through the use of biased training data, limiting its generalizability [11]. Conversely, it is possible to use DL algorithms to detect such disparities. We chose thoracic atherosclerosis, most commonly identified by calcification of the aortic knob, as our primary feature. Although the visual detection of thoracic atherosclerosis is trivial, the systemic nature of atherosclerosis and its association with multiple disease processes (cardiac, renal, peripheral arterial, cerebrovascular disease, and diabetes) make it relevant as a potential biomarker. Using a CNN-based DL classifier [10] on CXRs of COVID-19 patients, we can predict the presence of vascular disease. This prediction can then be compared to administrative data to determine the discrepancy between the classifier’s prediction and the presence or absence of the administrative code for vascular disease.
We hypothesize that this discrepancy is associated with factors that change the interaction of patients with the healthcare system, which may alter administrative practices and ultimately coding. Regression can be used to find any association of demographic, racial and socioeconomic factors with the discrepancy between the prediction and administrative data.
Methods
Study Population
This retrospective study was approved by the institutional review board and was granted waivers of informed consent at the institutions where the two cohorts were based.
There are two cohorts in this study. The first validation cohort (internal ambulatory COVID+, N = 814) was seen between 3/14/2020 and 10/24/20 and had a positive real-time reverse transcription polymerase chain reaction (RT-PCR) COVID-19 test in the ambulatory or immediate care setting at DuPage Medical Group, a large multispecialty group in the suburbs of Chicago. To evaluate non-acute findings related to chronic medical conditions, the search for frontal CXRs was expanded from 4/26/2018 to 10/23/2020 in this ambulatory COVID+ cohort, as the development of thoracic atherosclerotic vascular disease is a lengthy process.
The second cohort (external hospitalized COVID+, N = 485) was seen at a large urban tertiary academic hospital in Chicago, University of Illinois Hospital, between 3/14/2020 and 8/12/2020 and received a frontal CXR in the emergency department and a positive RT-PCR COVID-19 test.
Image Acquisition and Analysis
CXRs for the ambulatory COVID+ cohort were obtained conventionally with digital posteroanterior radiography (no portable radiographs). CXRs for the hospitalized COVID+ cohort were all portable. All CXRs were extracted from a picture archiving and communication system utilizing a scripted method (SikuliX, 2.0.2) and saved as de-identified 8-bit grayscale portable network graphics (PNG) files (ambulatory cohort) or 24-bit joint photographic experts group (JPEG) files (hospitalized cohort).
DL CXR Classifier
A CNN-based DL classifier was used to produce an estimate of the likelihood of vascular disease (administrative code HCC-108). This tool has been described previously [10] and was developed on patients like the ambulatory cohort, over a retrospective period of 10 years. All the CXRs were analyzed by this tool using a high-resolution PNG or JPEG file. The result is an estimate of the likelihood of the presence of a code in HCC-108 category (atherosclerotic vascular disease) ranging from 0 to 1. Occlusion-based attribution maps, in which areas of the image are occluded to quantify how the model’s prediction changes for the class [12], were generated as a sanity check (Captum 0.3.1).
Clinical Data
Clinical variables included sex, age, self-reported race/ethnicity, language preference, body mass index (BMI) and history of vascular disease as determined by ICD-10 codes from the EHR and administrative data. For patients who did not self-report, race/ethnicity data were imputed using geolocation and surname from US census data [13]. Self-reported races were categorized as Black or Hispanic and all others for the purposes of modeling.
Social Deprivation Index (SDI)
To control for geographic health inequities, we imputed the publicly available SDI by referencing the associated zip code tabulation areas [14]. The SDI is based on the American Community Survey and is used “to quantify levels of disadvantage across small areas, evaluate their associations with health outcomes, and address health inequities” [15]. SDI is a metric that combines demographic data of poverty, high school dropouts, renting, overcrowding, lack of car ownership, and unemployment into a granular zip-code-level ranking. SDI, together with other measures, can be used to identify areas that may need additional healthcare resources.
Consensus Interpretation
Expert interpretations of CXRs were provided by two board-certified radiologists (A.P. and N.S.) with 11 years and 10 years of post-training experience, respectively, for the presence or absence of thoracic aortic atherosclerosis in the ambulatory cohort. Both radiologists were blinded to the results of the DL classifier or any clinical characteristics. Cohen’s kappa coefficient was calculated to measure inter-rater reliability of the two radiologists, and cases of disagreement were reconciled by consensus. The CXRs from the hospitalized cohort were not interpreted by the radiologists due to Health Insurance Portability and Accountability Act limitations.
Statistical Analysis
Demographic characteristics, clinical findings and CXR DL outcomes were compared between the internal ambulatory and external hospitalized cohorts using two-sided χ2 tests and t-tests. Models for each cohort were generated to evaluate the classifier’s predictions of vascular disease against the ground truth (administrative data), using a receiver operator curve (ROC) in which the area under the curve (AUC) was calculated. The classifier’s predictions of vascular disease for the ambulatory cohort were further evaluated against the radiologists’ reading. Confidence intervals (CIs) and comparison of ROCs were produced using DeLong’s method [16].
The numerical difference between the presence or absence of the administrative code for vascular disease (HCC-108) and the classifier’s predictions of vascular disease was defined as Δvasc and ranged between −1 and +1. Multivariate linear regression was performed to examine the association of age, sex, race/ethnicity, language preference, and SDI. Linear model beta coefficients (β), R squared (R2) values and P values were generated. We further evaluated the associations of Δvasc, age, sex, race/ethnicity, language preference, and SDI with the likelihood of having none vs. one or more HCC codes using logistic regression and generated odds ratios (ORs) and CIs for these associations. P < 0.05 was deemed statistically significant, and analysis was conducted in R version 4 (R Foundation for Statistical Computing, Vienna, Austria).
Results
Patient Characteristics
A total of 1,299 patients were included in this study, 814 from the internal ambulatory COVID+ cohort and 485 from the external hospitalized COVID+ cohort (Fig. 1, Table 1). Participants in the hospitalized cohort compared to the ambulatory cohort were more likely to be older (51 vs. 63 years old, P < 0.001), Black (8% vs. 48%, P < 0.001) or Hispanic (8% vs. 48%, P < 0.001), and to have a non-English language preference (8% vs. 25%, P < 0.001) and a higher mean SDI (31 vs. 88, P < 0.001) (Fig. 2). Race was imputed for 42 (5%) patients in the ambulatory cohort and 6 patients (0.01%) in the hospitalized cohort. The hospitalized cohort had a higher prevalence of vascular disease compared to the ambulatory cohort (21% vs. 8%). The DL classifier predicted both higher age and a higher index of vascular disease in the hospitalized cohort compared to the ambulatory cohort, findings that were both consistent with the EHR data. A model evaluating the classifier’s predictions for vascular disease as compared to the EHR-based administrative data (HCC-108) showed an AUC of 0.851 (95% CI = 0.816–0.887) in the ambulatory cohort and 0.694 (95% CI = 0.641–0.748) in the hospitalized cohort with a P < 0.001, using DeLong’s method. The relationship between the classifier’s predictions for vascular disease and the radiologists’ consensus interpretation had a ROC AUC of 0.89 (95% CI = 0.86–0.92), with the radiologists having a Cohen’s kappa of 0.92, demonstrating strong agreement.
Figure 1:
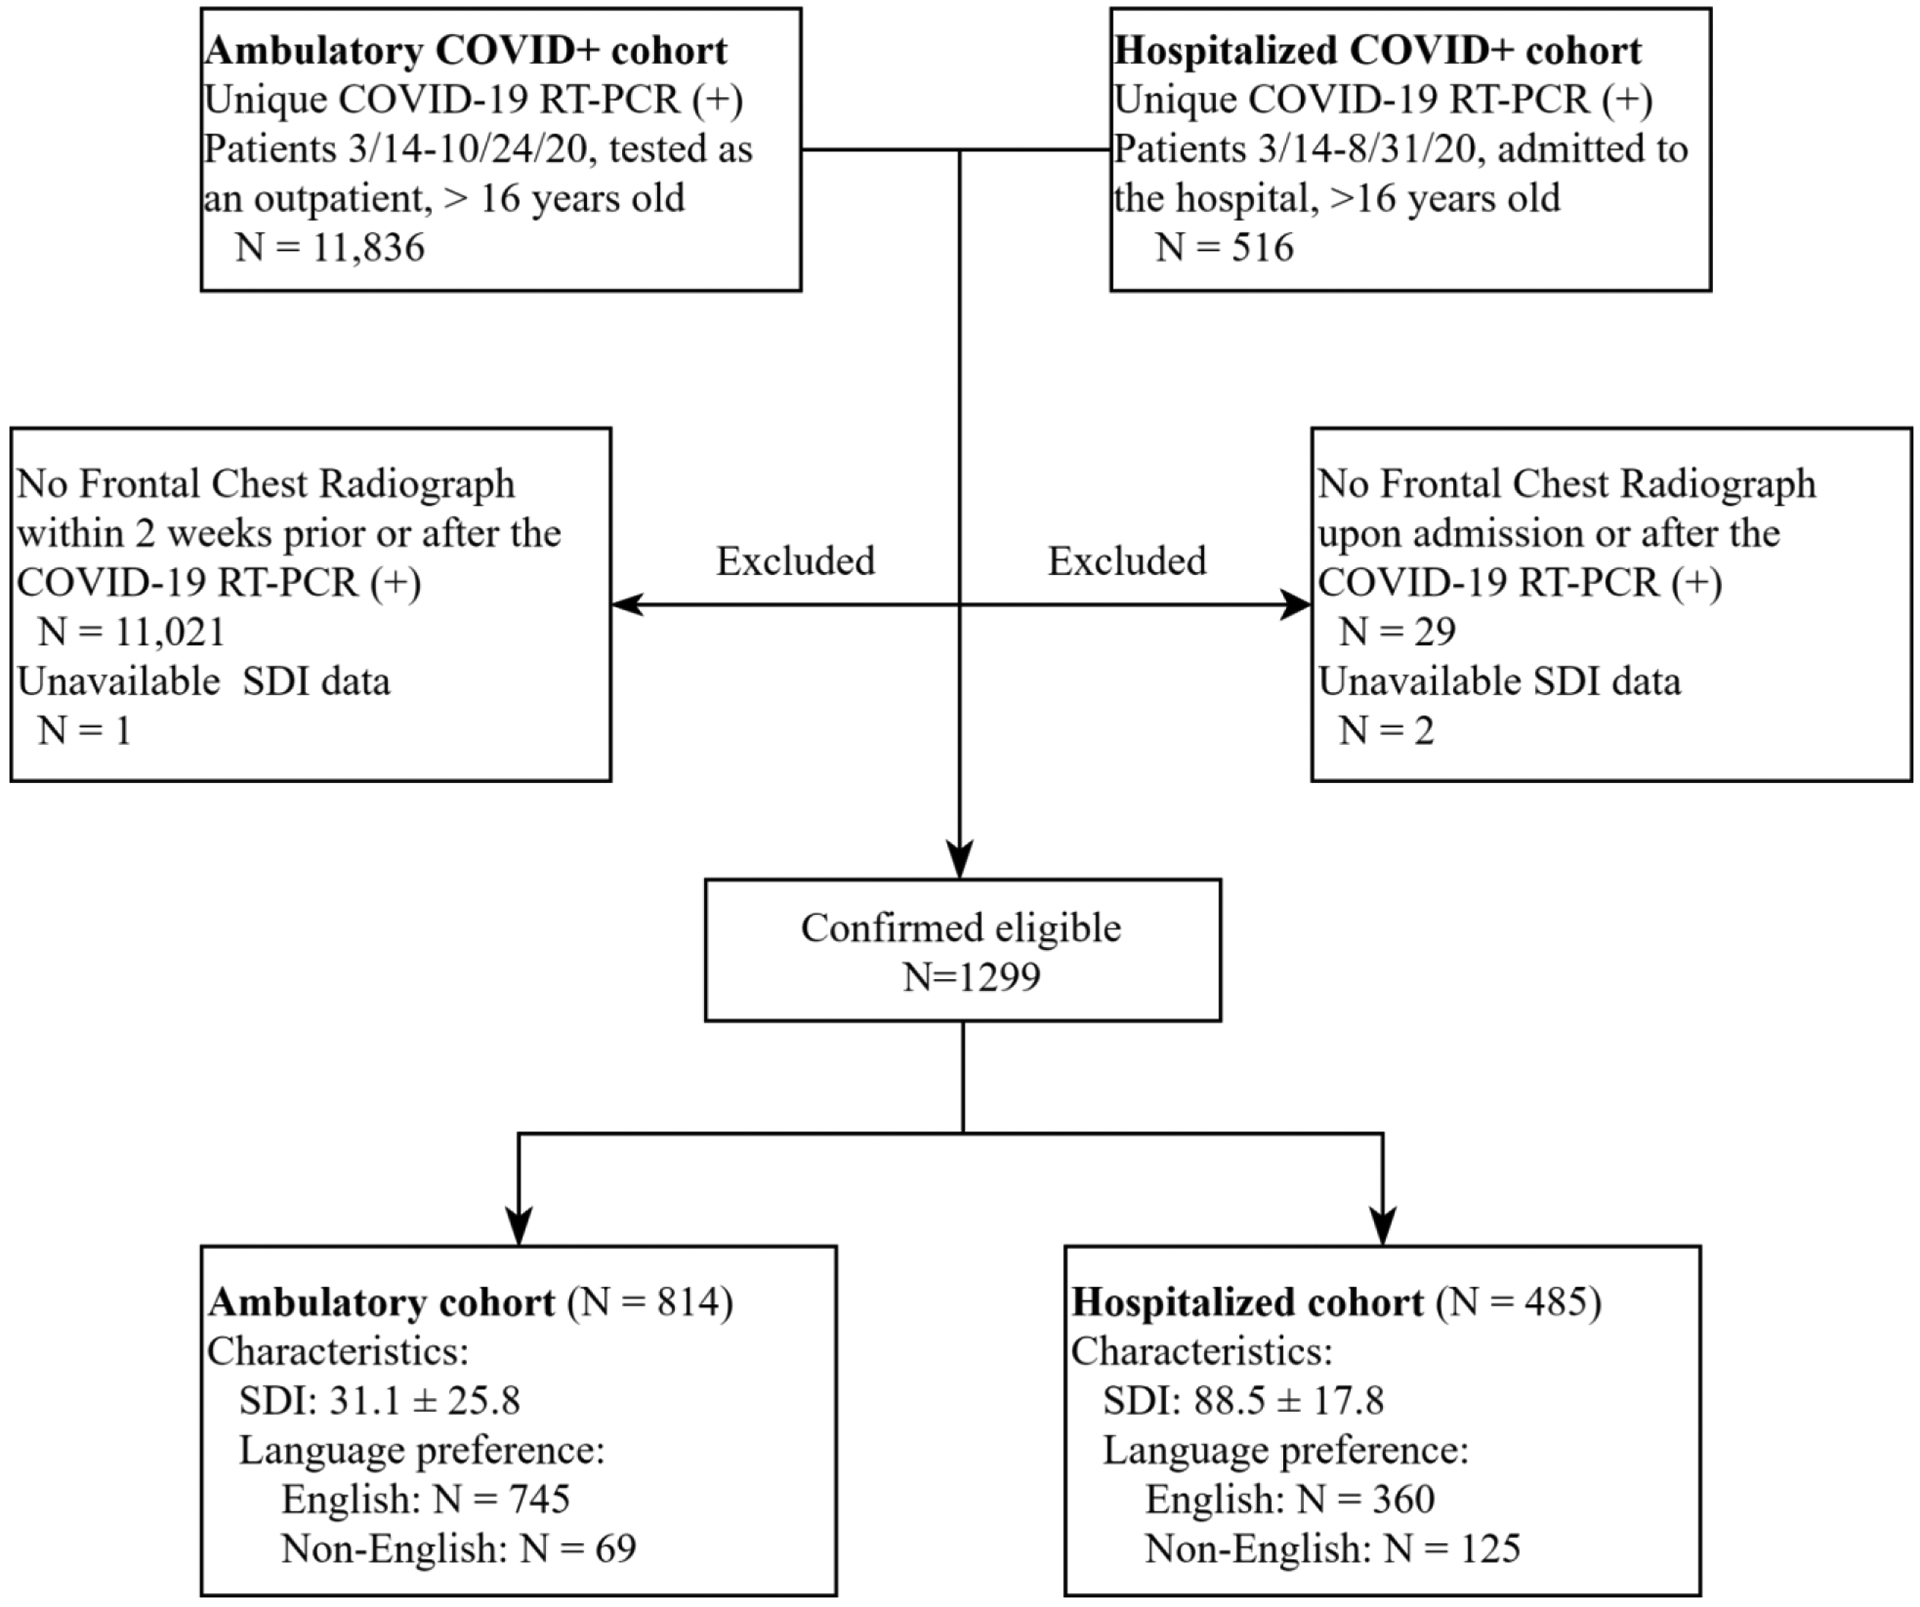
Flowchart of patient inclusion per cohort. Patients with no or negative real-time reverse transcription polymerase chain reaction (RT-PCR) test results, patients who did not undergo chest radiography, and patients with no social deprivation index (SDI) information were excluded. A total of 1,299 patients were eligible for this study. Abbreviations: COVID-19 = coronavirus disease 2019, SDI = social deprivation index.
Table 1:
Demographics, Clinical Findings and CNN CXR Characteristics per Cohort
| Characteristicsa | Ambulatory (N = 814) | Hospitalized (N = 485) | P value |
|---|---|---|---|
| Age, mean (SD) | 50.8 (16.2) | 56.3 (16.4) | <0.001 |
| Sex | 0.554 | ||
| Male | 389 (47.8%) | 240 (49.5%) | |
| Female | 425 (52.2%) | 245 (50.5%) | |
| Race/ethnicity | <0.001 | ||
| White | 562 (69%) | 27 (5.6%) | |
| Black | 65 (8%) | 234 (48.2%) | |
| Hispanic | 124 (15.2%) | 220 (45.4%) | |
| Asian | 63 (7.7%) | 4 (0.8%) | |
| Language preference | <0.001 | ||
| English | 745 (91.5%) | 360 (74.2%) | |
| Non-English | 69 (8.5%) | 125 (25.8%) | |
| SDI, mean (SD) | 31.1 (25.7) | 88.5 (17.8) | <0.001 |
| BMI, mean (SD) | 30.8 (7.08) * | 32.2 (10.1) | 0.089 |
| Vascular disease diagnosis (EHR HCC-108) | 72 (8.8%) | 105 (21.6%) | <0.001 |
| Patients without any HCC codes | 455 (56%) | 88 (18%) | |
| DL model predictions using frontal CXR | |||
| Predicted age, mean (SD) | 54.2 (13.6) | 60.7 (10.4) | <0.001 |
| Vascular disease (HCC-108) probability output, mean (SD)b | 0.254 (0.231) | 0.413 (0.212) | <0.001 |
Data are given as number (percentage) for each group, unless otherwise specified.
Normalized probability from 0 to 1 of vascular disease output by the DL classifier.
14 participants did not have a recorded BMI in the ambulatory cohort.
Abbreviations: BMI = body mass index, CNN = convolutional neural network, CXR = chest radiograph, DL = deep learning, EHR = electronic health record, SD = standard deviation, SDI = social deprivation index.
Figure 2:
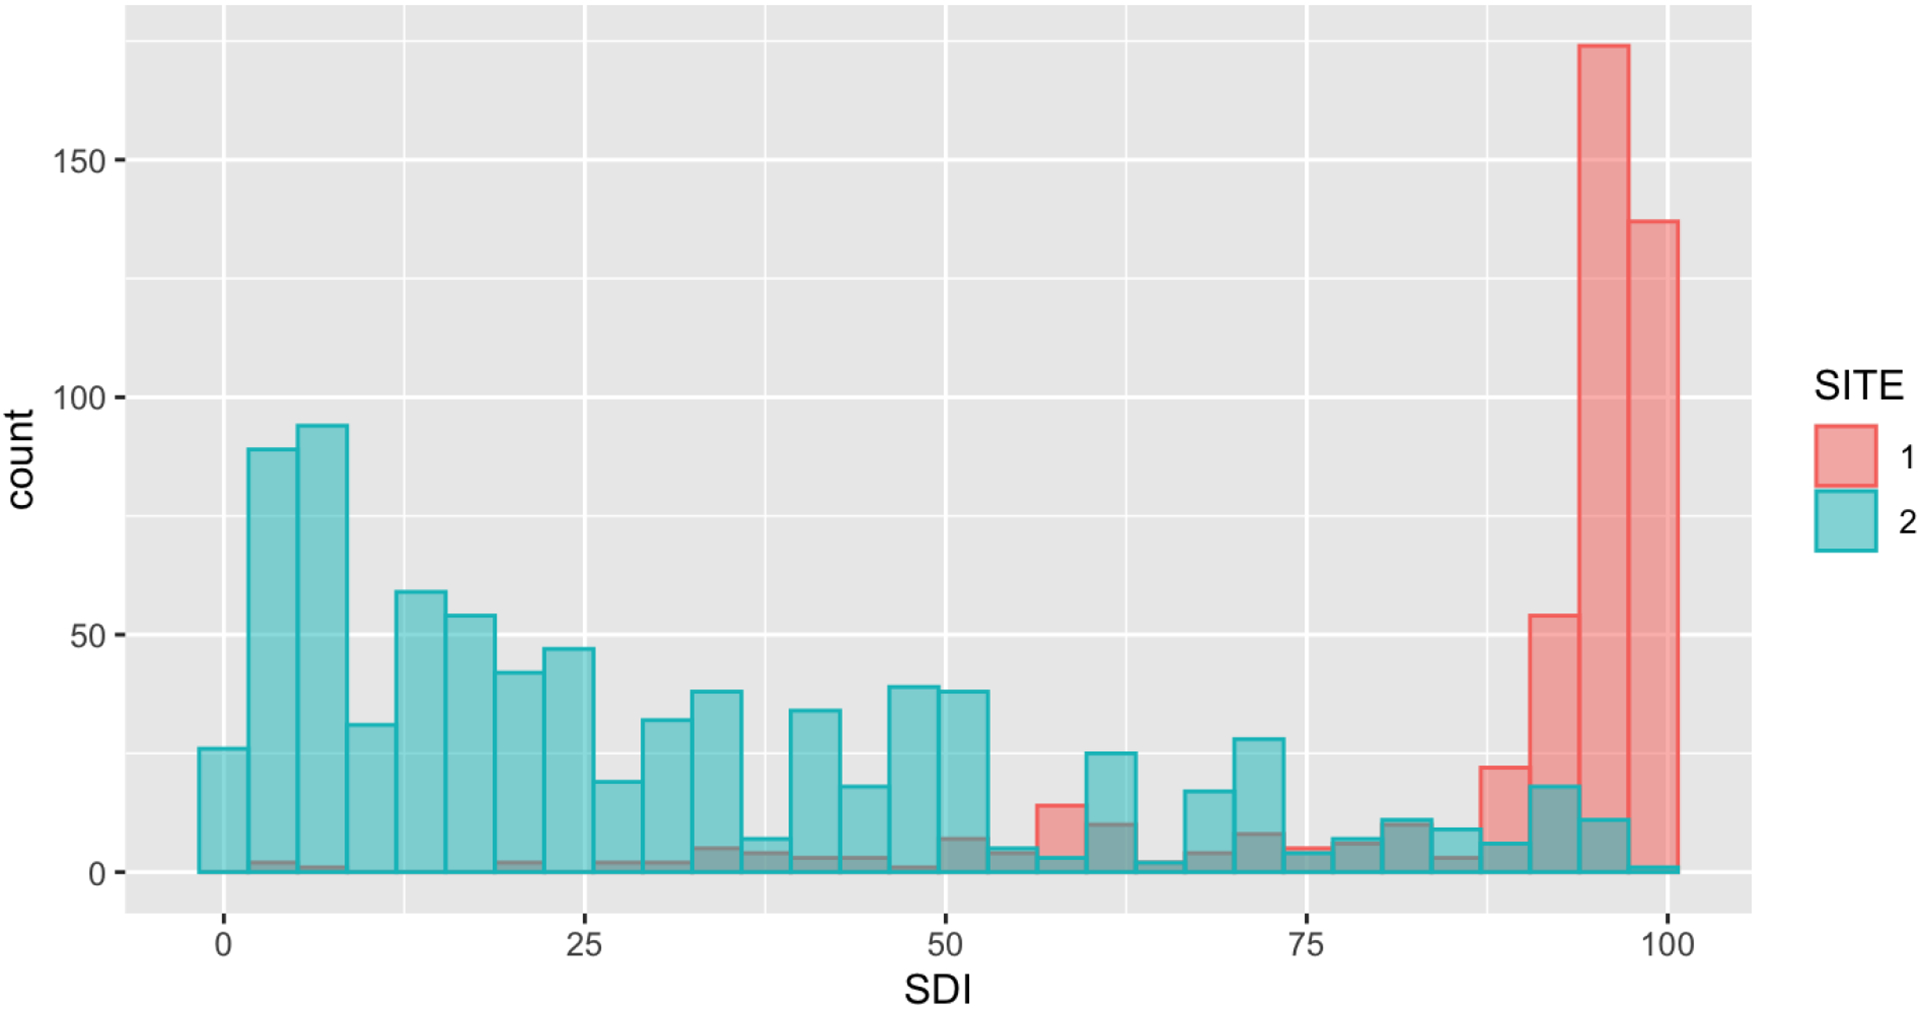
Histogram distribution of the social deprivation index (SDI) across two sites (Site 1, hospitalized cohort; site 2, ambulatory cohort) showing a bimodal distribution and wide separation of the two cohorts should be readily apparent.
Figure 3 shows representative frontal CXRs from the ambulatory (Fig. 3, A) and hospitalized (Fig. 3, B) cohorts, demonstrating how the DL model analyzed the radiographs and generated the likelihoods of vascular disease.
Figure 3:
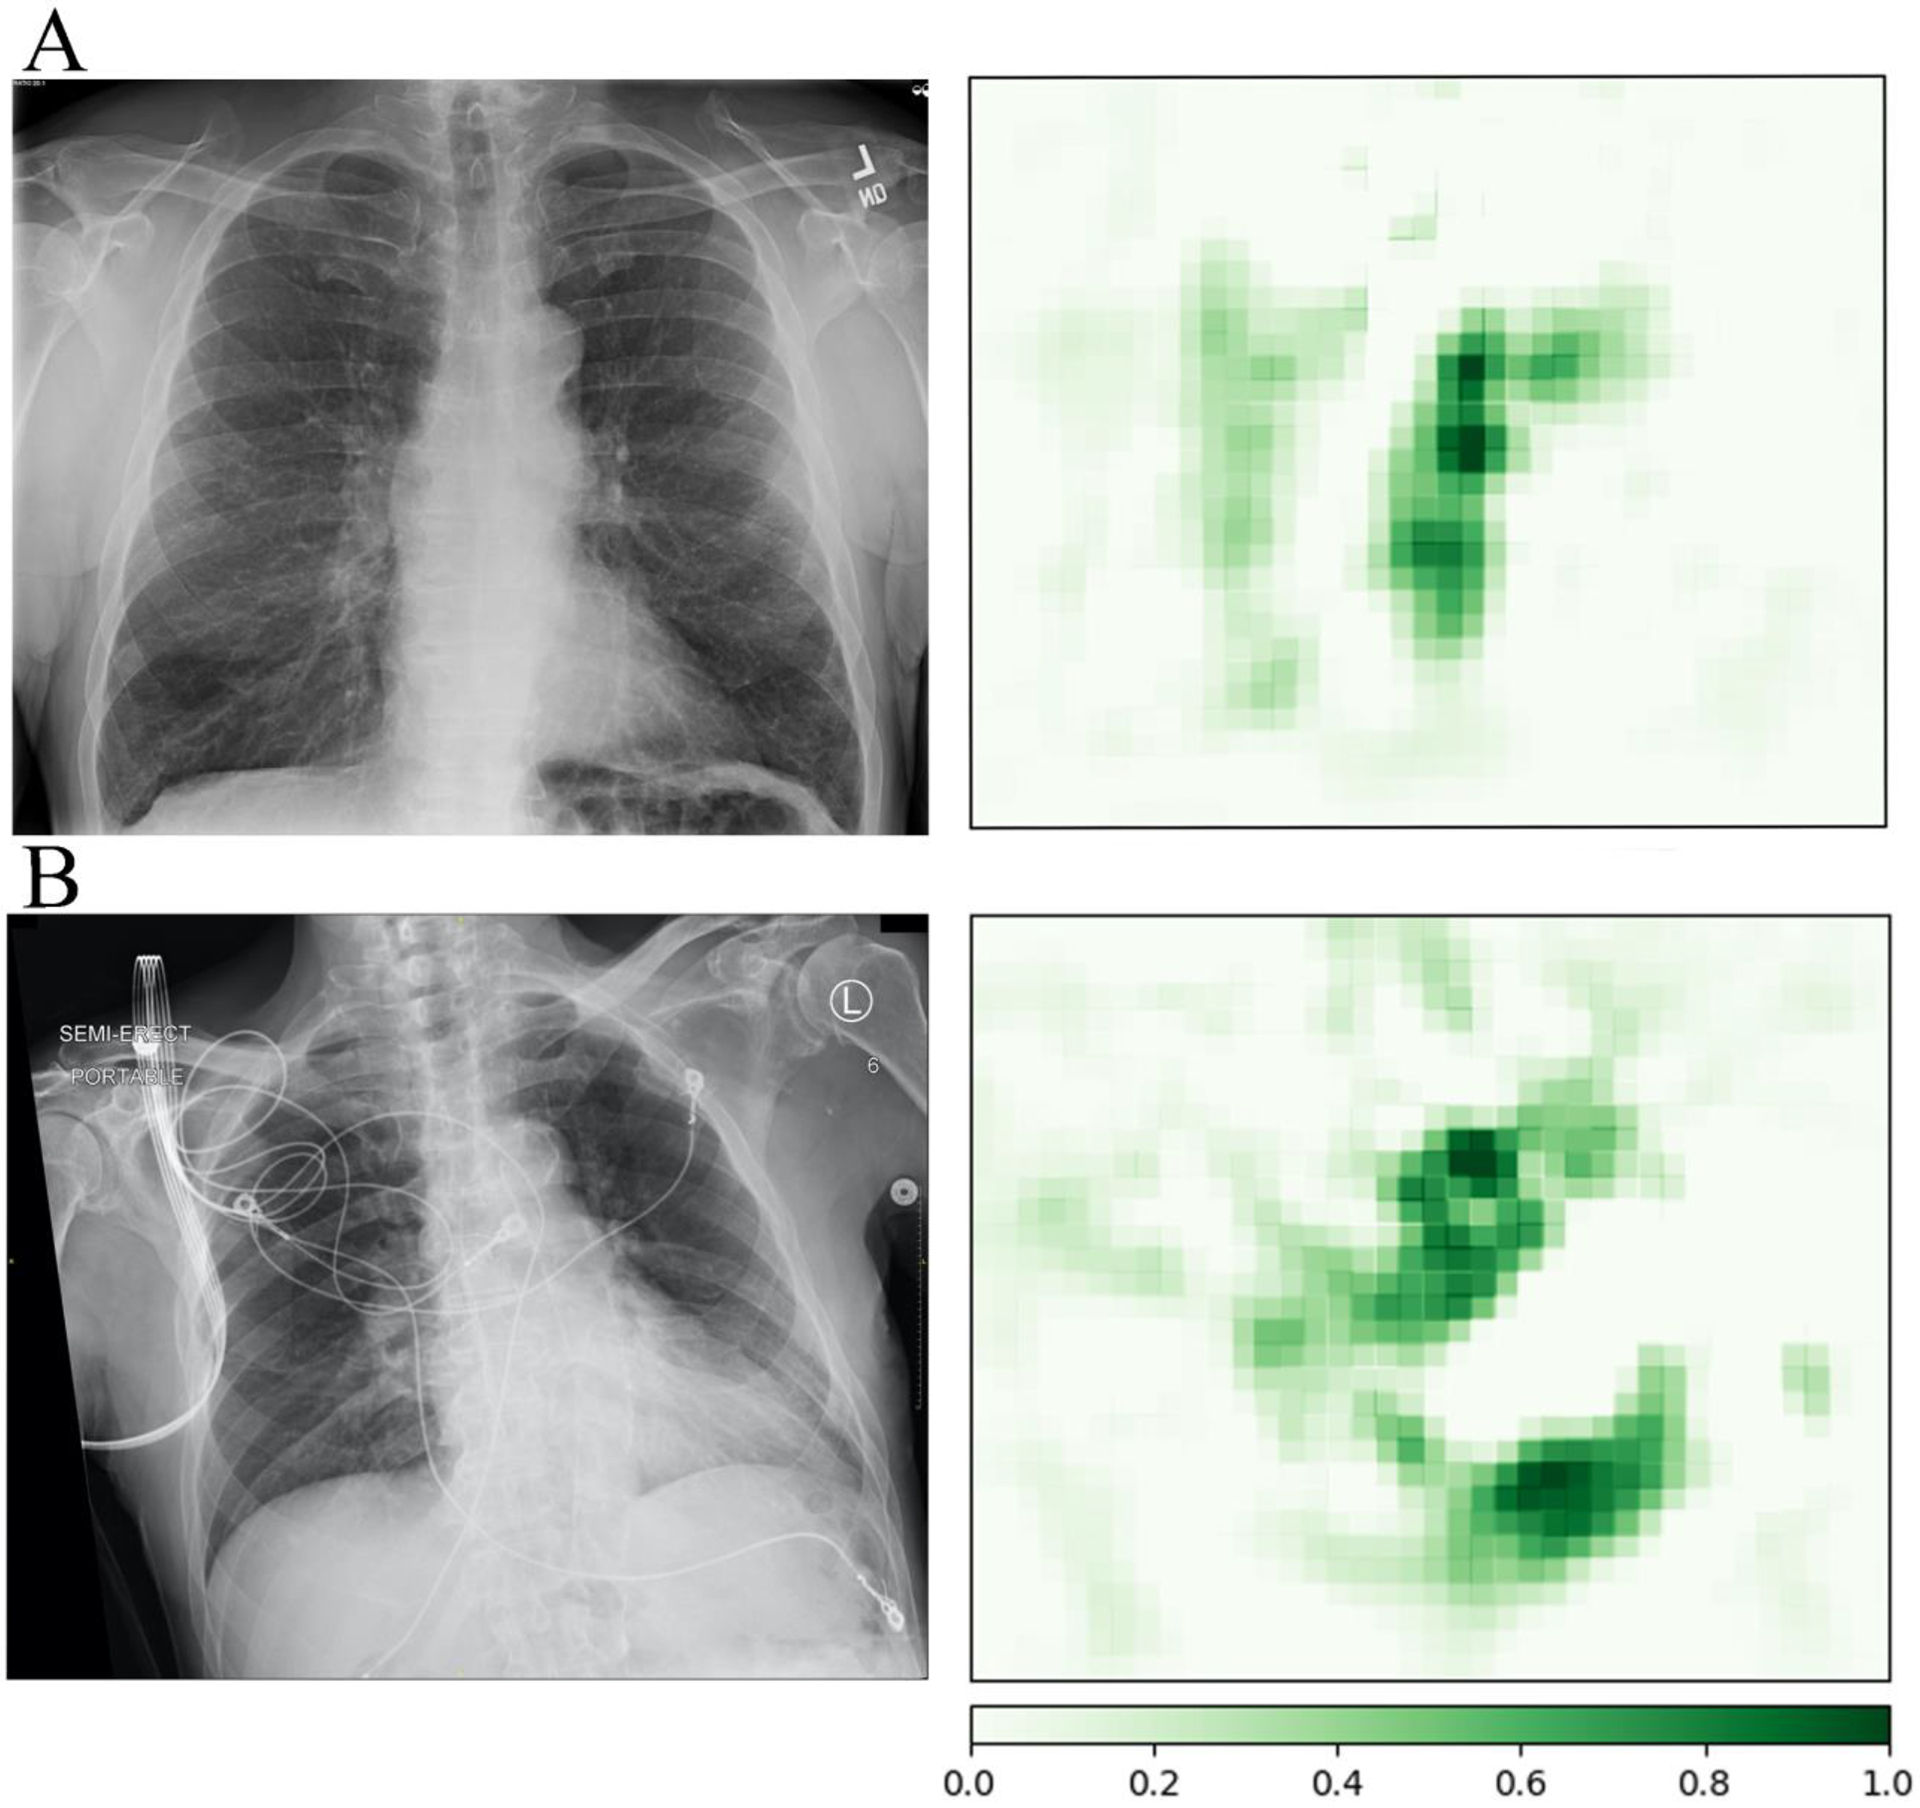
Occlusion maps with the input chest radiograph on the left and output positive attribution map on the right. The darker green areas, when occluded from the image, positively impact the model’s prediction more significantly, representing a higher number on the scale. Occlusion maps for the prediction of vascular disease in a 63-year-old White male patient (A) without an associated electronic health record diagnosis code from the ambulatory cohort and an 86-year-old Black male patient (B) also without a diagnosis of vascular disease from the hospitalized cohort. Positive attributions primarily relate to the aorta, with calcified atherosclerotic visible at the aortic knob.
Modeling of Δvasc
As shown in Table 2, linear regression modeling of Δvasc in the ambulatory cohort demonstrated significant associations with age, sex, Black or Hispanic race/ethnicity, and non-English language preference, but no significant association with SDI. In the hospitalized cohort, the significant associations were with SDI and age.
Table 2:
Modeling the Difference Between the CNN-Predicted and Administrative Prevalence of Vascular Disease, Δvasc
| Characteristic | Ambulatory | Hospitalized | ||
|---|---|---|---|---|
| Coefficient | P value | Coefficient | P value | |
| Age | 0.005 | <0.001 | 0.003 | <0.01 |
| Sex | 0.044 | <0.05 | NA | NS |
| Black or Hispanic race/ethnicity | −0.048 | <0.05 | NA | NS |
| Non-English language preference | −0.083 | <0.05 | NA | NS |
| SDI | NA | NS | 0.002 | <0.05 |
| Adjusted R2 | .11 | .022 | ||
| P value | <0.001 | 0.0201 | ||
Abbreviations: CNN = convolutional neural network, NS = non-significant, NA= not applicable. SDI = social deprivation index.
The likelihood of having none vs. one or more HCC codes was associated with Δvasc (OR = 0.336, 95% CI = 0.209–0.538, P < 0.001), age (OR = 1.059, 95% CI = 1.049–1.069, P < 0.001), Black or Hispanic race/ethnicity (OR = 1.576, 95% CI = 1.124–2.210, P < 0.01), and non-English language preference (OR = 1.738, 95% CI = 1.170–2.583, P < 0.01) (Table 3).
Table 3:
Associations between none and one or more HCC codes for the combined cohort of ambulatory and hospitalized patients, using binomial logistic regression. Data are presented as odds ratios (OR) with 95% CI in parentheses.
| Characteristic | Odds ratio (95% confidence interval) | P value |
|---|---|---|
| Age | 1.059 (1.049–1.069) | <0.001 |
| Ambulatory Site (Ref. Hospitalized Site) | 0.215 (0.149–0.312) | <0.001 |
| Black or Hispanic Race/ethnicity (Ref. White or Asian) | 1.576 (1.124–2.210) | 0.008 |
| Non-English Language preference (Ref. English Language) | 1.738 (1.169–2.584) | 0.006 |
| Δvasc | 0.336 (0.209–0.538) | <0.001 |
Abbreviations: HCC = hierarchical condition category.
Discussion
In this study we adapted a previously published CNN DL model to identify the presence of thoracic atherosclerotic disease from frontal CXRs and then combined these results with EHR administrative data from two cohorts with linear models. We found the CNN DL classifier to be predictive of vascular disease, validated in two disparate COVID-19 cohorts. The prediction of vascular disease was associated with multiple demographic findings of age, sex, self-reported race/ethnicity, language preference, and zip-code-based SDI, which is a proxy for poverty and social disparities strongly associated with reduced health and healthcare access. It is often difficult to understand exactly what an image-based CNN is using to make a prediction. Occlusion mapping can be used to visualize the portion of the image that is most important for the likelihood of the diagnosis. The occlusion mapping in our cohort demonstrates positive attribution to the cardiovascular structures for vascular disease (Fig. 3).
Our data demonstrated a discrepancy between the CXR classifier and the EHR-based administrative code for vascular disease. There were significant associations with race/ethnicity, SDI, and language preference, which varied in our two socioeconomically and ethnically diverse cohorts. This discrepancy was associated with higher SDI values in a cohort with a higher mean SDI, but not in a more affluent, lower-risk cohort with a much lower mean SDI. This may mean that social deprivation must reach a certain level threshold before it affects coding discrepancy.
We found that the likelihood of having any administrative (HCC) code was associated with vascular diagnosis discrepancy (Δvasc), age, Black or Hispanic race/ethnicity and non-English language preference (Table 3). Although there are many unmeasured variables, this suggests that it is possible that the discrepancies in administrative codes are associated with socioeconomic and ethnic factors.
As we transition to a more value-based model for healthcare delivery and reimbursement, it will be increasingly important to extract the maximum possible administrative codes from available data, as cost-effective care and institutional profitability are tightly linked in VBH [17]. Extracting data from a radiograph and feeding through a trained model to identify ‘at risk’ patients who might benefit from extra clinical, ancillary, and administrative attention may help to meet VBH management metrics and improve overall patient care and institutional reimbursement. We offer this work as a proof of concept, with specific model improvements left as future work for interested investigators.
Traditionally, comorbidities have been obtained through patient history and medical records, but there are known racial disparities in provider-patient informing of incidental medical findings [14]. In addition, there are known linguistic barriers, such as speaking only a non-English language, which have been magnified during the COVID-19 pandemic [18]. Although aortic atherosclerosis is exceedingly common with advanced age [19], the discrepancy in its reporting may indicate more important health disparities. DL algorithms are deterministic, meaning that they will produce the same result for the same image, while radiologists have stochastic elements in their results, which is why we used Cohen’s kappa to evaluate inter-observer variability in the radiologists’ interpretations. Cohen’s kappa between the two radiologists was very strong at 0.92 but was not 1.0.
If underserved patients most at risk for poor health outcomes are similarly most at risk for failure in provider-patient informing and missing information due to language limitations, can a radiological study fill the gap? We believe so. Automated notification of treating physicians by EHR, text message, or email could be implemented to alert them that a patient, based on the imaging findings, might have undocumented pathologies that warrant further investigation.
It is interesting that the larger the discrepancy factor Δvasc, the more likely there were no codes present (Table 3). This might be completely normal and expected for young adults in their 20s, but our cohorts had mean ages in the 50s. We live in a global, hyper-mobile world where people of many different ethnicities, national origins, and economic means may present for care. For example, a 55-year-old non-English-speaking refugee might present de novo for the first time in a US medical care setting with numerous barriers in access to care. The Δvasc, and its association with a lack of HCC coding documentation, may indicate a potential “tip of the iceberg” situation, with more extensive undocumented and likely undertreated pathology lurking under an initial presentation, such as COVID-19 in this setting.
This is relevant not only for the rare John Doe patient but also in cases of demographic information missing from the chart by error, patient inability to provide history or inability to obtain data from prior institutions. Imaging biomarkers extracted from CXRs offer unique opportunities to identify undocumented, underdiagnosed, or undiagnosed illnesses in high-risk patients, because they are relatively common and inexpensive tests, frequently performed either around or at admission [20, 21]. Moreover, imaging biomarkers can alert the medical staff of underlying medical conditions not previously diagnosed, this helps the clinician having a comprehensive approach for conditions not previously known by regular methods (chart review, history taking, etc.). CXRs are almost always done on presentation consistent with COVID-19 in the emergency department or immediate care clinics. In addition, such imaging biomarkers may unmask health disparities not readily apparent from other data sources. Our DL model allowed us to make a prediction regarding the probability of thoracic vascular disease as a comorbidity and was correlated with administrative EHR diagnoses. HCC codes are also predictive of repeat admission [22].
Our study was limited by several factors. First, we did not perform a manual chart review on our cohorts to assess for additional clinical documentation of associated comorbidities, like vascular disease. Absent/missing diagnoses may have been lost upon transfer from one health system to another, omitted by provider error, or contained within unstructured EHR data, like clinical notes. Though a limitation, this is one of the factors that we reviewed by looking at the difference between DL estimated disease and administrative data. Lastly, the implementation of DL models remains a technical challenge for many institutions and practices, with relatively few data collection standards or standards of algorithmic development and a lack of widespread adoption. Although we showed the predictive power of the DL classifier when using the hospitalized portable CXRs, the CNN was not trained on portable films.
In conclusion, DL techniques have a well-deserved reputation for propagating biases in medicine. Still, here we show how it can help mitigate these biases—in particular, detecting thoracic vascular disease that may be a biomarker for at-risk patients with poor SDI scores, of non-White ethnicity, or with a non-English language preference. Clearly, a multitude of barriers can exist. Critically, this approach performs independently of any additional clinical data, permitting use where patient history and exam information is unknown or difficult to obtain.
TAKE-HOME POINTS.
A deep learning chest radiograph classifier was predictive of thoracic atherosclerotic vascular disease in patients with coronavirus disease 2019 (COVID-19) as compared to presence of the administrative code for vascular disease in electronic health records.
The discrepancy between the classifier predictions and coded vascular disease demonstrated significant associations with race/ethnicity, social deprivation index (SDI) and language preference. These discrepancies were associated with an at-risk cohort with higher mean SDI, but not a more affluent cohort with lower mean SDI. This may mean that social deprivation must surpass a threshold before it has an impact. Furthermore, absence of coded vascular disease, even when controlling for age, sex, site, race/ethnicity, and language, was itself suggested as a potential marker for underdiagnosis or underdocumentation.
Acknowledgments:
Research reported in this publication is part of MIDRC (The Medical Imaging Data Resource Center) and was made possible by the National Institute of Biomedical Imaging and Bioengineering (NIBIB) of the National Institutes of Health under contracts 75N92020C00008 and 75N92020C00021.
The authors would like to thank Melinda Willis and Monica Harrington for editing and reviewing this manuscript. The author would like to also thank Patrick Cole and Andrew Chen for their deep learning expertise.
Abbreviations:
- AUC
area under the curve
- BMI
body mass index
- CI
confidence interval
- CNN
convolutional neural network
- COVID-19
coronavirus disease 2019
- CXR
chest radiograph
- DL
deep learning
- EHR
electronic health record
- HCC
hierarchical condition category
- JPEG
joint photographic experts group
- OR
odds ratio
- PNG
portable network graphics
- ROC
receiver operating characteristic
- RT-PCR
real-time reverse transcription polymerase chain reaction
- SDI
social deprivation index
- VBH
value-based healthcare
Footnotes
Publisher's Disclaimer: This is a PDF file of an unedited manuscript that has been accepted for publication. As a service to our customers we are providing this early version of the manuscript. The manuscript will undergo copyediting, typesetting, and review of the resulting proof before it is published in its final form. Please note that during the production process errors may be discovered which could affect the content, and all legal disclaimers that apply to the journal pertain.
The author(s) declare(s) that they had full access to all of the data in this study and the author(s) take(s) complete responsibility for the integrity of the data and the accuracy of the data analysis.
References
- 1.Richardson S, Hirsch JS, Narasimhan M, et al. Presenting characteristics, comorbidities, and outcomes among 5700 patients hospitalized with COVID-19 in the New York City area. JAMA 2020;323(20):2052–2059. [DOI] [PMC free article] [PubMed] [Google Scholar]
- 2.Webb Hooper M, Nápoles AM, Pérez-Stable EJ. COVID-19 and racial/ethnic disparities. JAMA 2020;323(24):2466–2467. doi: 10.1001/jama.2020.8598 [DOI] [PMC free article] [PubMed] [Google Scholar]
- 3.Williamson EJ, Walker AJ, Bhaskaran K, et al. Factors associated with COVID-19-related death using OpenSAFELY. Nature 2020;584(7821):430–436. [DOI] [PMC free article] [PubMed] [Google Scholar]
- 4.Yang J, Zheng Y, Gou X, et al. Prevalence of comorbidities and its effects in patients infected with SARS-Cov-2: a systematic review and meta-analysis. Int J Infect Dis 2020;94:91–95. [DOI] [PMC free article] [PubMed] [Google Scholar]
- 5.Joseph NP, Reid NJ, Som A, et al. Racial and ethnic disparities in disease severity on admission chest radiographs among patients admitted with confirmed coronavirus disease 2019: a retrospective cohort study. Radiology 2020;297(3):E303–E312. [DOI] [PMC free article] [PubMed] [Google Scholar]
- 6.Ward JB, Gartner DR, Keyes KM, Fliss MD, McClure ES, Robinson WR. How do we assess a racial disparity in health? Distribution, interaction, and interpretation in epidemiological studies. Ann Epidemiol 2019. Jan;29:1–7. [DOI] [PMC free article] [PubMed] [Google Scholar]
- 7.Brady AP, Bello JA, Derchi LE, et al. Radiology in the era of value-based healthcare: A multi-society expert statement from the ACR, CAR, ESR, IS3R, RANZCR, and RSNA. Radiology 2021;298(3):486–491. [DOI] [PubMed] [Google Scholar]
- 8.Juhnke C, Bethge S, Mühlbacher AC. A review on methods of risk adjustment and their use in integrated healthcare systems. Int J Integr Care 2016;16(4):4. doi: 10.5334/ijic.2500 [DOI] [PMC free article] [PubMed] [Google Scholar]
- 9.King JT Jr, Yoon JS, Rentsch CT, et al. Development and validation of a 30-day mortality index based on pre-existing medical administrative data from 13,323 COVID-19 patients: The Veterans Health Administration COVID-19 (Vaco) Index. PLoS One 2020;15(11):e0241825. [DOI] [PMC free article] [PubMed] [Google Scholar]
- 10.Pyrros A, Flanders AE, Rodríguez-Fernández JM, et al. Predicting prolonged hospitalization and supplemental oxygenation in patients with COVID-19 infection from ambulatory chest radiographs using deep learning. Acad Radiol. 2021;S1076–6332(21)00217–8. doi: 10.1016/j.acra.2021.05.002 [DOI] [PMC free article] [PubMed] [Google Scholar]
- 11.Straw I The automation of bias in medical Artificial Intelligence (AI): Decoding the past to create a better future. Artif Intell Med 2020. Nov;110:101965. [DOI] [PubMed] [Google Scholar]
- 12.Captum model interpretability for pytorch. Accessed June 30, 2021. https://captum.ai/
- 13.Who Are You? Bayesian Prediction of Racial Category Using Surname and Geolocation website. Updated May 17, 2021. Accessed June 30, 2021. https://github.com/kosukeimai/wru
- 14.Schut RA. Racial disparities in provider-patient communication of incidental medical findings. Soc Sci Med. 2021. Apr 6;277:113901. [DOI] [PMC free article] [PubMed] [Google Scholar]
- 15.Robert Graham Center. Social Deprivation Index (SDI) website. Accessed June 30, 2021. https://www.graham-center.org/rgc/maps-data-tools/sdi/social-deprivation-index.html
- 16.DeLong ER, DeLong DM, Clarke-Pearson DL. Comparing the areas under two or more correlated receiver operating characteristic curves: a nonparametric approach. Biometrics 1988;44:837–845. [PubMed] [Google Scholar]
- 17.Henkel RJ, Maryland PA. The risks and rewards of value-based reimbursement. Front Health Serv Manage 2015;32(2):3–16. [PubMed] [Google Scholar]
- 18.Ortega P, Martínez G, Diamond L. Language and health equity during COVID-19: lessons and opportunities. J Health Care Poor Underserved 2020;31(4):1530–1535. [DOI] [PMC free article] [PubMed] [Google Scholar]
- 19.Gallino A, Aboyans V, Diehm C, et al. Non-coronary atherosclerosis. Eur Heart J 2014. May;35(17):1112–1119. [DOI] [PubMed] [Google Scholar]
- 20.Kerr IH. The preoperative chest X-ray. Br J Anaesth. 1974;46(8):558–563. [DOI] [PubMed] [Google Scholar]
- 21.American College of Radiology. ACR Appropriateness Criteria: Routine Chest Radiography. https://acsearch.acr.org/docs/69451/Narrative/
- 22.Mosley DG, Peterson E, Martin DC. Do hierarchical condition category model scores predict hospitalization risk in newly enrolled Medicare advantage participants as well as probability of repeated admission scores? J Am Geriatr Soc 2009;57(12):2306–2310. [DOI] [PubMed] [Google Scholar]