

Abstract
Breath-by-breath oxygen-carbon dioxide (O2-CO2) exchange ratio (bER) is a respiratory gas exchange (RGE) metric, which is the ratio of the changes in the partial pressure of O2 (ΔPO2) to CO2 (ΔPCO2) between end-inspiration and end-expiration, has been demonstrated to characterize the cerebrovascular responses to breath-hold challenge in healthy individuals. We aimed to explore whether bER could characterize cerebrovascular responses in patients with chronic mild traumatic brain injury (mTBI) under breath-hold challenge. We also investigated the correlation between bER and the severity of post-concussion symptoms. Blood-oxygenation-level-dependent (BOLD) images were acquired using functional magnetic resonance imaging (fMRI) on 10 patients with chronic mTBI and 10 controls without brain injury history when performing a breath-hold task. Time series of RGE metrics of ΔPO2, ΔPCO2, and bER were computed, and their cross-correlation with regional change in BOLD (ΔBOLD) was calculated. Symptom burden was assessed using the Rivermead Post Concussion Questionnaire (RPQ), and its correlation with RGE changes was also measured. Compared with controls, a diffuse decrease in the correlation between regional ΔBOLD and bER was found in the brain of patients with mTBI (pfdr < 0.05). No significant difference was found between patients and controls for the correlation of regional ΔBOLD with ΔPO2 and ΔPCO2. Symptom severity indicated by RPQ scores increased with a decrease in the averaged changes of bER (ρ = 0.79, p = 0.01) and ΔPO2 (ρ = 0.70, p = 0.03) in breath-hold epochs. Our imaging and symptom severity findings suggest that bER can be used to characterize cerebrovascular responses to breath hold in patients with mTBI. The RGE may contribute to the post-concussive symptom severity.
Keywords: breath-hold challenge, functional magnetic resonance imaging, mild traumatic brain injury, O2-CO2 exchange ratio
Introduction
Traumatic brain injury (TBI) is a global public health problem.1 A spectrum of post-concussion symptoms varying from headaches, fatigue, sleep, and cognitive disturbances may persist for months or years after TBI.2 Perturbations in microvascular flow are believed to precede neuronal dysfunction after TBI.3–5
Exogenous carbon dioxide (CO2) challenge in conjunction with functional magnetic resonance imaging (fMRI) measurement of blood-oxygenation-level-dependent (BOLD) signal in the brain has been used to show reduced/delayed cerebrovascular reactivity (CVR) in patients with chronic TBI.6–8 The CO2 administration, however, involves a complex gas delivery setup. An alternative method for CVR assessment is a breath-hold challenge.9–14 Increase in cerebral blood flow (CBF) is well established during breath holding. While authors in the recent neuroimaging literature believe that CBF increase during breath holding is because of hypercapnia only,15–17 our team attributed CBF increase in breath holding to the synergistic effect of both mild hypoxemia and mild hypercapnia because of the continual oxygen (O2) uptake and CO2 release in the closed breathing circuit during breath holding.18
An increase in O2 uptake had been demonstrated repeatedly to be larger than an increase in CO2 release during breath holding since 1946, resulting in a reduction in respiratory exchange ratio (RER), a ratio of CO2 to O2 at a steady state.19–24 The RER results in these studies are consistent with the findings in our recent breath-hold study, where the dynamic breath-by-breath O2-CO2 exchange ratio (bER), a ratio of breath-by-breath O2 uptake to CO2 release, was increased during breath holding.18
The bER is defined as the ratio of the changes in the partial pressure of oxygen (ΔPO2) to the change in the partial pressure of carbon dioxide (ΔPCO2) between end-inspiration and end-expiration.18 The time-averaged value of bER is related to the reciprocal of RER. The bER was found to demonstrate a strong positive correlation with dynamic global and regional cerebral hemodynamic responses under breath-hold challenge18; an increase in bER corresponds to an increase in CBF. The bER changes were also superior to ΔPCO2 changes in coupling with global and regional cerebrovascular responses to breath holding.18
The regional CVR in response to external CO2 challenge resembled that in response to bER, more than that in response to ΔPCO2 under breath-hold challenge.18 Notably, ΔPCO2 is interchangeable with the end-tidal partial pressure of CO2 (PETCO2) given the low ambient CO2 level. All these findings lend motivation to investigate whether bER can characterize the cerebrovascular responses to breath-hold challenge in patients better than ΔPCO2 (PETCO2).
In the current study, we aimed to characterize the cerebrovascular responses to RGE metrics of ΔPO2, ΔPCO2, and bER in patients with mild traumatic brain injury (mTBI) under breath-hold challenge. We hypothesized that the cerebrovascular responses to breath-hold challenge measured by BOLD signal changes (ΔBOLD) would have a stronger correlation with bER than with ΔPCO2 in patients with mTBI. The ΔBOLD would also be less correlated with bER in compromised brain regions of patients than in normal brain regions of age-matched controls. Temporal and frequency features of RGE metrics in their coherence with ΔBOLD were also examined. The potential clinical impact was evaluated by correlating RGE metrics with symptom severity indicated by the Rivermead Post Concussion Questionnaire (RPQ) scores.
Methods
Study design
We performed a prospective breath-hold fMRI study on a cohort of patients with chronic mTBI and age-matched controls without a history of brain injuries. All the experimental procedures were explained to the subjects. Signed informed consent was obtained before participating in the study. All procedures were performed in compliance with the Declaration of Helsinki and approved by the Massachusetts General Hospital (MGH) Human Research Committee.
Participants
Patients with a diagnosis of mTBI for at least three months since the head impact were recruited at the MGH Neurology Clinic. The patients did not have a loss of consciousness or had a loss of consciousness of <30 min duration, and the Glasgow Coma Scale (GCS) score was ≥13.25,26 No abnormality was reported in the structural brain images. Control subjects without a history of brain injuries were also recruited.
MRI acquisition
Three-dimensional T1-MEMPRAGE (TR/TE1/TE2/TE3/TE4 = 2530/1.64/3.5/5.36/7.22 msec, matrix = 256 × 256 × 176, resolution = 1 × 1 × 1mm3) and T2-SPACE FLAIR (TR/TE/TI = 5000/355/1800 msec, matrix = 192 × 192 × 176, resolution = 1 × 1 × 1 mm3) images were acquired on a 3-Tesla scanner (Siemens Medical, Erlangen, Germany). The BOLD-fMRI images were acquired with gradient-echo EPI sequence (TR/TE = 1450/30 msec, matrix = 64 × 64, resolution = 3.4 × 3.4 × 5 mm3), while the subject was performing the breath-hold task.
The timing of the breath-hold task was presented visually to the subject by a computer using the software Eprime Professional 2.0 (Psychology Software Tools, Inc., Pittsburgh, PA) (Fig. 1). A breath-hold rehearsal was given before fMRI. No special instruction on the breath holding after inhalation or exhalation was delivered to the subjects because BOLD signal amplitude has been suggested to depend on the depth of inspiration immediately preceding the breath-hold period,27 and end-expiration breath hold may induce significant head motion.28
FIG. 1.

The paradigm of breath-hold challenge. Subjects were instructed via visual cues to perform six epochs of 30-sec breath hold interleaved with 60–90 sec of free breathing. They were asked to have free breathing when white crosshair was projected on the screen with a black background and hold their breaths when the white crosshair changed to red. Yellow shades represent the breath-hold epochs.
The partial pressure of O2 (PO2) and CO2 (PCO2) and respiration were measured simultaneously with MRI acquisition. A small nasal tubing was placed at the subject's nostril to sample PCO2 and PO2 via gas analyzers (Capstar-100, Oxystar-100, CWE, Inc., Ardmore, PA) after calibrating to the barometric pressure immediately before the scan and correcting for vapor pressure. Respiration was measured using a respiratory bellow connected to a spirometer (FE141, ADInstruments, Inc., Colorado Springs, CO). All the physiological measurements were synchronized using trigger signals from the MRI scanner.
Physiological data processing
The physiological data were analyzed using Matlab R2014a (Mathworks, Inc., Natick, MA). Technical delay of PCO2 and PO2 was corrected by cross-correlating the time series of PCO2 and PO2 with respiratory phases determined from the respiratory bellow. End-inspiration (I) and end-expiration (E) were defined on the time series of PO2 and PCO2, and were verified by the inspiratory and expiratory phases on the respiration time series. Changes in the gas parameters in the breath-hold periods were interpolated by the values measured immediately before and after the breath-hold periods.
The bER, the ratio of the change in PO2 (ΔPO2 = inspired PO2–expired PO2) to the change in PCO2 (ΔPCO2 = expired PCO2–inspired PCO2), is measured between end-inspiration and end-expiration in each respiratory cycle. The bER, ΔPO2 and ΔPCO2 measured in the baseline periods—i.e., the period before the first breath-hold epoch—were calculated. Because the breath-hold duration might vary from one epoch to another, the changes of bER, ΔPO2, and ΔPCO2 in each breath-hold epoch were normalized to a 30-sec breath-hold epoch by dividing the changes to the actual breath-hold duration in seconds and multiplying by 30.21 The normalized changes of each parameter over the six breath-hold epochs were then averaged.
Image processing
All the BOLD-fMRI data were analyzed using software AFNI.29 The first 12 volumes of each functional dataset collected before equilibrium magnetization was reached were discarded. Each functional dataset was corrected for slice timing, motion-corrected, and coregistered to the first image of the functional dataset. The time series of each voxel was detrended with the fifth order of polynomials to remove the low drift frequency, and the components of motion were removed using orthogonal projection.
Head motions were quantified and compared between patients and controls (Supplementary Fig. S1). The clean time series was then normalized to its mean intensity value. Voxels located within the ventricles and outside the brain were excluded from the following analyses of functional images. Individual subject brain volumes with time series of percent BOLD signal changes (ΔBOLD) were derived.
Hilbert Transform analysis30 was used to measure the cross-correlation between the ΔBOLD and the reference time series of RGE metrics (bER, ΔPO2, and ΔPCO2) in each voxel. Fisher Z-transformation was used to convert the cross-correlation coefficients in the individual subject maps to Fisher's z scores. Individual subject brain volumes with Fisher's z scores were then registered onto the subjects' anatomical scans and transformed to the standardized space of Talairach and Tournoux31 for group analysis.
Wavelet Transform coherence32 was used to measure the dynamic changes in coupling between the time series of RGE metrics and ΔBOLD extracted from brain regions in the time-frequency domain. The analysis procedures were the same as those described in our other breath-hold study.18 The brain regions in gray and white matter were segmented using the software FreeSurfer.33,34
An example of squared wavelet coherence between bER and ΔBOLD in gray matter from a representative patient under breath-hold challenge is shown in Supplementary Fig. S2. The percentage of significant coherence (sCoh%) defined as the percentage of time during which the magnitude of wavelet transform coherence was significantly different from the red noise outside the cone of influence was used to quantify the dynamic coupling between the time series of each RGE metric and ΔBOLD (Supplementary Fig. 2C).
Statistical analysis
Continuous variables (i.e., age and RGE metrics) were summarized as median and interquartile range (IQR), and group (mTBI and control) differences were assessed using the Kruskal-Wallis tests. Categorical variable (i.e., gender) was summarized as frequencies; group difference was assessed using the Chi-square test. Spearman correlation analyses were used to correlate in pairs the RPQ scores, time after injury, age, and breath-hold duration, and normalized changes in RGE metrics (bER, ΔPO2 and ΔPCO2) averaged over the six breath-hold epochs. Significant differences or correlations were considered at p < 0.05.
Unpaired t tests (3dttest++) in AFNI were used to compare the cerebrovascular responses to breath-hold challenge (i.e., Fisher's z scores from Hilbert Transform analysis) between patients and controls. Multiple comparisons were corrected using the equitable thresholding and clustering (ETAC) method.35 The group results were painted onto the averaged brain surfaces reconstructed by FreeSurfer.33,34
The sCoh% at the phase lags of 0±π/2 and ±π/2 from the individual subject wavelet transform analysis were separately plotted for mTBI and control groups to explore the Fourier periods/frequency bandwidths that oscillations of ΔBOLD in gray and white matter were in synchrony with each physiological time series of bER, ΔPO2, and ΔPCO2 when the subjects were performing breath-hold tasks.
The sCoh% of RGE metrics with ΔBOLD in the six frequency bandwidths (0.008–0.015 Hz, 0.016–0.03 Hz, 0.031–0.062 Hz, 0.063–0.124 Hz, 0.125–0.249 Hz, and 0.25–0.5 Hz) extracted in the brain regions showing significant differences in Fisher's z scores between mTBI and control groups was calculated for each subject. The distribution of sCoh% in these brain regions of the mTBI and control groups was then compared using the Kolmogorov-Smirnov test. Significant differences in the distribution of the sCoh% were considered at p < 0.05.
Results
Twenty subjects aged from 20 to 57 years were included. Ten of them were patients with a diagnosis of mTBI (median = 38 years, IQR = 25.75–46.75 years; 5M and 5F). The selected clinical characteristics of the patients are shown in Table 1. The remaining 10 were control subjects without brain injury history (median = 28 years, IQR = 25.25–34.25 years; 6M and 4F). No significant differences in age (p = 0.34) and sex (p = 0.65) were found between patients with mTBI and control subjects.
Table 1.
Selected Clinical Characteristics of the Patients with Mild Traumatic Brain Injury
| Subjects | Sex | Age | Time after injury (days) | Cause of injury | RPQ scores |
|---|---|---|---|---|---|
| m1 | F | 44 | 846 | Motor vehicle accident | 34 |
| m2 | F | 47 | 1704 | Motor vehicle accident | 27 |
| m3 | M | 38 | 109 | Sports injury (basketball) | 6 |
| m4 | M | 37 | 1614 | Motor vehicle accident | 29 |
| m5 | M | 49 | 1579 | Motor vehicle accident | 45 |
| m6 | M | 57 | 237 | Sports injury (skiing) | 2 |
| m7 | F | 22 | 630 | Fall | 41 |
| m8 | F | 20 | 1000 | Fall | 0 |
| m9 | F | 21 | 2588 | Sports injury (soccer) | 16 |
| m10 | F | 46 | 481 | Motor vehicle accident | 24 |
RPQ, Rivermead Post Concussion Questionnaire; M, male; F, female.
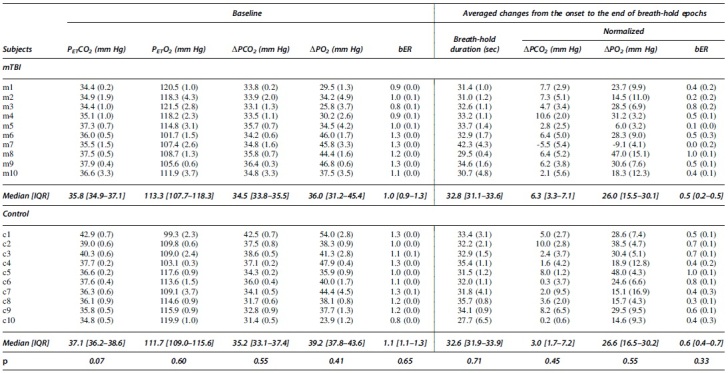
The bER, ΔPO2, and ΔPCO2 measured in the baseline periods were summarized in Table 2. The averaged breath-hold duration, the averaged changes of bER, ΔPO2, and ΔPCO2 over the six breath-hold epochs were also included. The averaged changes of ΔPO2 during breath holding were almost three to four folds larger than those of ΔPCO2. No significant difference in the RGE metrics was found between mTBI and control groups in the baseline periods and breath-hold epochs (p > 0.05). No structural abnormality was identified in the T1-weighted and T2 FLAIR images of all subjects.
Table 2.
Baseline Respiratory Gas Exchange Values before the First Breath-Hold Epoch and the Averaged Changes of Respiratory Gas Exchange Metrics during Breath Holding
|
Baseline mean values (standard deviation [SD]) of PETCO2, PETO2, ΔPCO2, ΔPO2, and bER for all subjects before the first breath-hold epoch (left). The changes (SD) of breath-hold duration, ΔPCO2, ΔPO2, and bER from the onset to the end of the breath-hold epoch averaged more than six breath-hold epochs (right). Medians and interquartile ranges [IQR] were used to summarize respiratory gas exchange metrics in groups. No significant differences was found in the respiratory gas exchange metrics between patients with mild traumatic brain injury and controls (p > 0.05) (bottom row).
Correlation among RPQ scores, time after injury, age, and changes in RGE metrics
The correlation results among RPQ scores, time after injury, age, breath-hold durations, and RGE metrics changes are summarized in Fig. 2. During breath holding, a significant correlation was found between RPQ scores and the averaged changes in bER (Spearman rho = -0.79, p = 0.01), between RPQ scores and the averaged changes in ΔPO2 (Spearman rho = -0.70, p = 0.03), and between the averaged changes in bER and ΔPO2 (Spearman rho = 0.95, p < 0.001). No significant correlation was found in the remaining correlation pairs (p > 0.05).
FIG. 2.

Correlation among Rivermead Post Concussion Questionnaire (RPQ) scores, time after injury, age, breath-hold duration, and respiratory gas exchange (RGE) metric changes from the onset to the end of the breath-hold periods averaged over six breath-hold epochs. A significant correlation was found between RPQ scores and the averaged changes in breath-by-breath O2-CO2 exchange ratio (bER), between RPQ scores and the averaged changes in partial pressure of oxygen (ΔPO2), and between the averaged changes in bER and ΔPO2. No significant correlation was found between breath-hold duration and RGE metrics.
Comparison of the cross-correlation of ΔBOLD with RGE metrics between patients with mTBI and controls
Time series of ΔBOLD in left gray matter and the corresponding RGE metrics in a representative patient with mTBI and a control subject under breath-hold challenge are shown in Fig. 3. The time series of bER followed more closely to ΔBOLD than ΔPO2 and ΔPCO2 in both representative patient and control subject.
FIG. 3.

Time series of regional change in blood-oxygenation-level-dependent (ΔBOLD) signals in left gray matter and the corresponding breath-by-breath O2-CO2 exchange ratio (bER), change in partial pressure of oxygen (ΔPO2), change in partial pressure of carbon dioxide (ΔPCO2), end tidal partial pressure of oxygen (PETO2), and end tidal partial pressure of carbon dioxide (PETCO2) in a representative patient with mild traumatic brain injury (mTBI) (A) and a representative control subject without brain injury history (B) under breath-hold challenge. Shaded areas represent breath-hold periods. Thin green lines represent PO2, while the thin blue lines represent PCO2. Thick green lines and thick blue lines represent PETO2 and PETCO2, respectively. In the representative control subject, the time series of bER followed closely to the ΔBOLD. A significant increase in ΔPO2 was observed in all breath-hold epochs, while an increase in ΔPCO2 was shown in only three of six breath-hold epochs. In the representative patient, an increase in ΔBOLD but decreases in both ΔPO2 and ΔPCO2 were observed from the second to the sixth breath-hold epochs. The bER was found to increase in the second and the fifth breath-hold epochs.
Compared with control subjects, a significant decrease in the cross-correlation between ΔBOLD and bER was mapped by fMRI in patients with mTBI at superior and middle frontal, precentral, and postcentral, insular, superior parietal, middle and inferior temporal, paracentral, precuneus, posterior cingulate, cuneus, lingual, hippocampal and parahippocampal areas (pfdr < 0.05) (Fig. 4). No significant difference was found in the cross-correlation of ΔBOLD with ΔPO2 and ΔPCO2 between patients and controls.
FIG. 4.

The comparison of the cross-correlation of regional change in blood-oxygenation-level-dependent (ΔBOLD) signals with breath-by-breath O2-CO2 exchange ratio (bER) between patients with mild traumatic brain injury (mTBI) and controls. Warmer colors represent a stronger correlation in patients, while cooler colors represent a weaker correlation in patients when compared with controls. Diffuse decrease in correlation between ΔBOLD and bER was found in patients with mTBI. Multiple comparisons were corrected at a false discovery rate pfdr< 0.05. SF, superior frontal; MF, middle frontal; PrC, precentral; PoC, postcentral; Ins, insular; SP, superior parietal; MT, middle temporal; IT, inferior temporal; ParaC, paracentral; PreC, precuneus; PC, posterior cingulate; Cun, cuneus; Ling, lingual; Parahipp, parahippocampal.
Dynamic coupling between RGE metrics and ΔBOLD
In both the patients with mTBI and the control subjects, the dynamic coupling indicated by the sCoh% between bER and ΔBOLD at phase lag of 0±π/2 was the highest in the frequency range of 0.008–0.03 Hz while that between ΔPCO2 and ΔBOLD was the lowest in the same frequency range (Fig. 5). The dynamic coupling between RGE metrics and ΔBOLD was weak at the phase lag of π±π/2, and the sCoh% stayed around 20% or below (Supplementary Fig. S3). Comparing with control subjects, the dynamic coupling of bER and ΔPO2 with ΔBOLD in the frequency range of 0.008–0.03 Hz and at phase lag of 0±π/2 was reduced in patients (Fig. 5).
FIG. 5.

The percentage of significant coherence between time series of respiratory gas exchange (RGE) metrics (breath-by-breath O2-CO2 exchange ratio [bER], change in partial pressure of oxygen [ΔPO2], change in partial pressure of carbon dioxide [ΔPCO2]) and regional change in blood-oxygenation-level-dependent (ΔBOLD) signals at the phase lag 0±π/2 in patients with mild traumatic brain injury (mTBI) and controls. The mean percentages of significant coherence in the frequency bandwidths from 0.008 to 0.25 Hz were plotted (thick color lines). Color shaded areas represent standard error of the mean. Large variations in the percentages of significant coherence were found across the patients and the reduced coherence of bER and ΔPO2 with ΔBOLD compared with controls. LRGM, left and right gray matter; LRWM, left and right white matter.
In the brain regions showing significant differences in the Fisher's z scores between mTBI and control groups, the distribution of the sCoh% for the dynamic coupling of bER with ΔBOLD was significantly different between mTBI and control groups at the frequency bandwidths of 0.008–0.015 Hz and phase lag of 0±π/2 (p = 0.03) (Fig. 6). No significant difference in the distribution of sCoh% was found between patients and controls for the dynamic coupling of ΔPO2 and ΔPCO2 with ΔBOLD in all frequency bandwidths and phase lag of 0±π/2.
FIG. 6.

Comparison of the percentage of significant coherence of respiratory gas exchange (RGE) metrics (breath-by-breath O2-CO2 exchange ratio [bER], change in partial pressure of oxygen [ΔPO2], change in partial pressure of carbon dioxide [ΔPCO2]) and regional change in blood-oxygenation-level-dependent (ΔBOLD) signals in selected brain regions at the phase lag 0±π/2 between patients with mild traumatic brain injury and controls. Each grey circle represents the percentage of significant coherence for each subject in the frequency range shown on the x-axis. The thick horizontal black line, the box, and the vertical rod represent the mean, 95% confidence interval, and standard deviation of the group. The distribution of the percentage of significant coherence of bER with ΔBOLD in patients was significantly different from controls at 0.008–0.015 Hz (p = 0.03). LRGM, left and right gray matter; LRWM, left and right white matter.
Discussion
To our knowledge, this is the first study to characterize cerebrovascular responses with bER under brief breath-hold challenge in patients. We showed that the dynamic coupling of cerebrovascular responses with bER and ΔPO2 was stronger than that with ΔPCO2 in patients with chronic mTBI, similar to our previous breath-hold results on healthy subjects.18 In patients with mTBI, the bER-ΔBOLD correlation under brief breath-hold challenge was significantly reduced in multiple brain regions when compared with control subjects who did not have a brain injury history.
The averaged changes in bER and ΔPO2 in the breath-hold epochs decreased with increased symptom severity indicated by RPQ scores, while no such changes were observed between ΔPCO2 and RPQ scores. Patients with more severe symptoms showed a smaller increase in bER during breath holding. The correlation between the symptom severity and the changes in bER and ΔPO2 during breath holding could not be attributed to the breath-hold duration, because the changes in RGE metrics (bER, ΔPO2, and ΔPCO2) were normalized to a 30-sec breath-hold epoch, and the breath-hold duration was not correlated with RPQ, age, or changes in RGE metrics.
Many research teams19–24 including ours18 reported earlier a larger increase of O2 uptake than CO2 release under breath-hold challenge, resulting in reduced RER or increased bER for healthy subjects. Our current gas measurements on patients with mTBI again suggest the synergistic role of mild hypoxemia and mild hypercapnia during breath holding. A strong correlation of the changes in bER with ΔPO2 but not with ΔPCO2 in patients during breath holding (Fig. 2) indicates that bER, being the ratio of ΔPO2 to ΔPCO2, is predominantly affected by ΔPO2.
In this study, we showed a significant decrease in the correlation between ΔBOLD and bER in response to breath-hold challenge in multiple brain regions of patients using Hilbert Transform analysis (Fig. 4). These brain regions are responsible for the brain functions for attention, memory, visual processing, auditory processing, executive and autonomic functions.36 They also showed a general pattern that resembles the structurally atrophied regions of patients with mTBI reported by Warner and associates.36 The intermittent cross-correlations between bER and ΔBOLD were then characterized as a function of both time and frequency in these brain regions using Wavelet Transform coherence analysis based on continuous wavelet transform.32,37
Like our previous breath-hold study in healthy individuals,18 bER had the most robust dynamic coupling with cerebral ΔBOLD for both patients with mTBI and controls at the frequency range of 0.008–0.03 Hz; ΔPCO2 had the weakest coupling while ΔPO2 had an intermediate coupling (Fig. 5). Compared with controls, the coherence of bER with ΔBOLD was reduced in patients at the frequency range of 0.008–0.03 Hz. Concerns of using BOLD signal as a CBF surrogate had been addressed by another independent verification of the coupling between bER and CBF18 using CBF velocity measured by transcranial Doppler ultrasound at a sampling rate of 100 Hz.
The dynamic coupling between bER and ΔBOLD was then measured in the selected brain regions showing a decreased correlation in Hilbert Transform analysis and showed significant intersubject variations among patients at the frequency range of 0.008–0.015 Hz compared with controls (Fig. 6). Such intersubject variability may be due to the heterogeneity of brain injuries.
The bER, but not ΔPO2 or ΔPCO2, showed a significant difference in coupling with ΔBOLD between patients and controls at the frequency range of 0.008–0.015 Hz. Given that bER is predominantly affected by ΔPO2, we attributed the somewhat surprising lack of statistical significance for ΔPO2-ΔBOLD to the effect of ventilatory volume fluctuations common to both ΔPO2 and ΔPCO2. In comparison with ΔPO2, the format of bER as a ratio of ΔPO2 to ΔPCO2 has the advantage of being less affected by the ventilatory volume fluctuations resulting from isolated deep breaths. Future studies with a larger sample size are warranted to clarify the role between bER and ΔPO2.
Conclusion
The bER is a more useful metric than ΔPCO2 (i.e., PETCO2) to characterize the cerebrovascular responses to breath-hold challenge in patients with mTBI. The correlation between bER changes and symptom severity during breath holding also suggests a relationship between RGE and post-concussion symptoms. Future studies with a large cohort of subjects would help explore the underlying mechanisms between RGE, cerebral hemodynamics, and post-concussion symptoms in patients with mTBI.
Supplementary Material
Acknowledgment
The original contributions presented in the study are included in the article/supplementary materials. Further inquiries can be directed to the corresponding author.
Authors' Contributions
Suk-Tak Chan, design and conceptualized study; data collection and analysis; data interpretation; drafted the manuscript for intellectual content; Cora Ordway, data collection and analysis; Ronald J. Calvano, design and conceptualized study; data analysis; data interpretation; revision of manuscript; Ferdinando S. Buonanno, design and conceptualized study; data interpretation; revision of manuscript; Bruce R. Rosen, drafted the manuscript for intellectual content; revision of manuscript; Kenneth K. Kwong, design and conceptualized study; data collection and analysis; data interpretation; drafted the manuscript for intellectual content; revision of manuscript.
Funding Information
This research was performed in whole at the Athinoula A. Martinos Center for Biomedical Imaging at the Massachusetts General Hospital, using resources provided by the Center for Functional Neuroimaging Technologies, P41EB015896, a P41 Biotechnology Resource Grant supported by the National Institute of Biomedical Imaging and Bioengineering (NIBIB), National Institutes of Health, as well as the Shared Instrumentation Grant S10RR023043. This study was also supported, in part, by National Center for Complementary and Integrative Health (NCCIH) grant (R21AT010955).
Author Disclosure Statement
No competing financial interests exist.
Supplementary Material
References
- 1. Global Burden of Disease 2018 Traumatic Brain Injury and Spinal Cord Injury Collaborators. (2019). Global, regional, and national burden of traumatic brain injury and spinal cord injury, 1990-2016: a systematic analysis for the Global Burden of Disease Study 2016. Lancet Neurol. 18, 56–87. [DOI] [PMC free article] [PubMed] [Google Scholar]
- 2. Ryan, L.M., and Warden, D.L. (2003). Post concussion syndrome. Int. Rev. Psychiatry 15, 310–316. [DOI] [PubMed] [Google Scholar]
- 3. Kenney, K., Amyot, F., Haber, M., Pronger, A., Bogoslovsky, T., Moore, C., and Diaz-Arrastia, R. (2016). Cerebral vascular injury in traumatic brain injury. Exp. Neurol. 275, 353–366. [DOI] [PubMed] [Google Scholar]
- 4. Werner, C., and Engelhard, K. (2007). Pathophysiology of traumatic brain injury. Br. J. Anaesth. 99, 4–9. [DOI] [PubMed] [Google Scholar]
- 5. Oppenheimer, D.R. (1968). Microscopic lesions in the brain following head injury. J. Neurol. Neurosurg. Psychiatry 31, 299–306. [DOI] [PMC free article] [PubMed] [Google Scholar]
- 6. Amyot, F., Kenney, K., Moore, C., Haber, M., Turtzo, L.C., Shenouda, C., Silverman, E., Gong, Y., Qu, B.X., Harburg, L., Lu, H.Y., Wassermann, E.M., and Diaz-Arrastia, R. (2018). Imaging of cerebrovascular function in chronic traumatic brain injury. J. Neurotrauma 35, 1116–1123. [DOI] [PMC free article] [PubMed] [Google Scholar]
- 7. Mutch, W.A., Ellis, M.J., Ryner, L.N., Ruth Graham, M., Dufault, B., Gregson, B., Hall, T., Bunge, M., Essig, M., Fisher, J.A., Duffin, J., and Mikulis, D.J. (2016). Brain magnetic resonance imaging CO2 stress testing in adolescent postconcussion syndrome. J. Neurosurg. 125, 648–660. [DOI] [PubMed] [Google Scholar]
- 8. Dodd, A.B., Lu, H., Wertz, C.J., Ling, J.M., Shaff, N.A., Wasserott, B.C., Meier, T.B., Park, G., Oglesbee, S.J., Phillips, J.P., Campbell, R.A., Liu, P., and Mayer, A.R. (2020). Persistent alterations in cerebrovascular reactivity in response to hypercapnia following pediatric mild traumatic brain injury. J. Cereb. Blood Flow Metab. 40, 2491–2504. [DOI] [PMC free article] [PubMed] [Google Scholar]
- 9. Kastrup, A., Li, T.Q., Glover, G.H., and Moseley, M.E. (1999). Cerebral blood flow-related signal changes during breath-holding. AJNR Am. J. Neuroradiol. 20, 1233–1238. [PMC free article] [PubMed] [Google Scholar]
- 10. Markus, H.S., and Harrison, M.J. (1992). Estimation of cerebrovascular reactivity using transcranial Doppler, including the use of breath-holding as the vasodilatory stimulus. Stroke 23, 668–673. [DOI] [PubMed] [Google Scholar]
- 11. Ratnatunga, C., and Adiseshiah, M. (1990). Increase in middle cerebral artery velocity on breath holding: a simplified test of cerebral perfusion reserve. Eur. J. Vasc. Surg. 4, 519–523. [DOI] [PubMed] [Google Scholar]
- 12. Vernieri, F., Pasqualetti, P., Passarelli, F., Rossini, P.M., and Silvestrini, M. (1999). Outcome of carotid artery occlusion is predicted by cerebrovascular reactivity. Stroke 30, 593–598. [DOI] [PubMed] [Google Scholar]
- 13. Silvestrini, M., Vernieri, F., Troisi, E., Passarelli, F., Matteis, M., Pasqualetti, P., Rossini, P.M., and Caltagirone, C. (1999). Cerebrovascular reactivity in carotid artery occlusion: possible implications for surgical management of selected groups of patients. Acta Neurol. Scand. 99, 187–191. [DOI] [PubMed] [Google Scholar]
- 14. Pillai, J.J., and Mikulis, D.J. (2015). Cerebrovascular reactivity mapping: an evolving standard for clinical functional imaging. AJNR Am. J. Neuroradiol. 36, 7–13. [DOI] [PMC free article] [PubMed] [Google Scholar]
- 15. Bright, M.G., and Murphy, K. (2013). Reliable quantification of BOLD fMRI cerebrovascular reactivity despite poor breath-hold performance. NeuroImage 83, 559–568. [DOI] [PMC free article] [PubMed] [Google Scholar]
- 16. Murphy, K., Harris, A.D., and Wise, R.G. (2011). Robustly measuring vascular reactivity differences with breath-hold: normalising stimulus-evoked and resting state BOLD fMRI data. NeuroImage 54, 369–379. [DOI] [PubMed] [Google Scholar]
- 17. Tancredi, F.B., and Hoge, R.D. (2013). Comparison of cerebral vascular reactivity measures obtained using breath-holding and CO2 inhalation. J. Cereb. Blood Flow Metab. 33, 1066–1074. [DOI] [PMC free article] [PubMed] [Google Scholar]
- 18. Chan, S.T., Evans, K.C., Song, T.Y., Selb, J., van der Kouwe, A., Rosen, B.R., Zheng, Y.P., Ahn, A., and Kwong, K.K. (2020). Cerebrovascular reactivity assessment with O2-CO2 exchange ratio under brief breath hold challenge. PLoS One 15, e0225915. [DOI] [PMC free article] [PubMed] [Google Scholar]
- 19. Dubois, A.B. (1952). Alveolar CO2 and O2 during breath holding, expiration, and inspiration. J. Appl. Physiol. 5, 1–12. [DOI] [PubMed] [Google Scholar]
- 20. Hong, S.K., Lin, Y.C., Lally, D.A., Yim, B.J., Kominami, N., Hong, P.W., and Moore, T.O. (1971). Alveolar gas exchanges and cardiovascular functions during breath holding with air. J. Appl. Physiol 30, 540–547. [DOI] [PubMed] [Google Scholar]
- 21. Lindholm, P., and Linnarsson, D. (2002). Pulmonary gas exchange during apnoea in exercising men. Eur. J. Appl. Physiol. 86, 487–491. [DOI] [PubMed] [Google Scholar]
- 22. Lindholm, P., and Lundgren, C.E. (2006). Alveolar gas composition before and after maximal breath-holds in competitive divers. Undersea Hyperb. Med. 33, 463–467. [PubMed] [Google Scholar]
- 23. Otis, A.B., Rahn, H., and Fenn, W.O. (1948). Alveolar gas changes during breath holding. Am. J. Physiol. 152, 674–686. [DOI] [PubMed] [Google Scholar]
- 24. Ferris, E.B., Engel, G.L., Stevens, C.D., and Webb, J. (1946). Voluntary breathholding. III. The relation of the maximum time of breathholding to the oxygen and carbon dioxide tensions of arterial blood, with a note on its clinical and physiological significance. J. Clin. Invest. 25, 734–743. [DOI] [PMC free article] [PubMed] [Google Scholar]
- 25. Mayer, A.R., Quinn, D.K., and Master, C.L. (2017). The spectrum of mild traumatic brain injury: a review. Neurology 89, 623–632. [DOI] [PMC free article] [PubMed] [Google Scholar]
- 26. O'Neil, M.E., Carlson, K., Storzbach, D., Brenner, L., Freeman, M., Quinones, A., Motu'apuaka, M., Ensley, M., and Kansagara, D. (2013). In: Complications of Mild Traumatic Brain Injury in Veterans and Military Personnel: A Systematic Review. Washington (DC); Department of Veterans Affairs. [PubMed] [Google Scholar]
- 27. Thomason, M.E., and Glover, G.H. (2008). Controlled inspiration depth reduces variance in breath-holding-induced BOLD signal. Neuroimage 39, 206–214. [DOI] [PMC free article] [PubMed] [Google Scholar]
- 28. Thomason, M.E., Foland, L.C., and Glover, G.H. (2007). Calibration of BOLD fMRI using breath holding reduces group variance during a cognitive task. Hum. Brain Mapp. 28, 59–68. [DOI] [PMC free article] [PubMed] [Google Scholar]
- 29. Cox, R.W. (1996). AFNI: software for analysis and visualization of functional magnetic resonance neuroimages. Comput. Biomed. Res. 29, 162–173. [DOI] [PubMed] [Google Scholar]
- 30. Saad, Z.S., DeYoe, E.A. ,and Ropella, K.M. (2003). Estimation of FMRI response delays. Neuroimage 18, 494–504. [DOI] [PubMed] [Google Scholar]
- 31. Talairach, J., and Tournoux, P. (1988). Co-Planar Stereotaxic Atlas of the Human Brain: 3-Dimensional Proportional System: An Approach to Cerebral Imaging. Stuttgart; New York: Georg Thieme; 1988. [Google Scholar]
- 32. Grinsted, A., Moore, J.C., and Jevrejeva, S. (2004). Application of the cross wavelet transform and wavelet coherence to geophysical time series. Nonlin. Processes Geophys. 11, 561–566. [Google Scholar]
- 33. Dale, A.M., Fischl, B., and Sereno, M.I. (1999). Cortical surface-based analysis. I. Segmentation and surface reconstruction. Neuroimage 9, 179–194. [DOI] [PubMed] [Google Scholar]
- 34. Fischl, B., Sereno, M.I., and Dale, A.M. (1999). Cortical surface-based analysis. II: inflation, flattening, and a surface-based coordinate system. Neuroimage 9, 195–207. [DOI] [PubMed] [Google Scholar]
- 35. Cox, R.W. (2019). Equitable thresholding and clustering: a novel method for functional magnetic resonance imaging clustering in AFNI. Brain Connect. 9, 529–538. [DOI] [PMC free article] [PubMed] [Google Scholar]
- 36. Warner, M.A., Youn, T.S., Davis, T., Chandra, A., Marquez de la Plata, C., Moore, C., Harper, C., Madden, C.J., Spence, J., McColl, R., Devous, M., King, R.D., and Diaz-Arrastia, R. (2010). Regionally selective atrophy after traumatic axonal injury. Arch. Neurol. 67, 1336–1344. [DOI] [PMC free article] [PubMed] [Google Scholar]
- 37. Torrence, C., and Compo, G.P. (1998). A practical guide to wavelet analysis. Bull. Am. Meteorol. Soc. 79, 61–78. [Google Scholar]
Associated Data
This section collects any data citations, data availability statements, or supplementary materials included in this article.