Abstract
Metabolomics analyses suggest changes in amino acid abundance, particularly L-arginine (L-ARG), occur in tuberculosis patients. Immune cells require L-ARG to fuel effector functions following infection. We have previously described an L-ARG synthesis pathway in immune cells, however its role in antigen presenting cells (APCs) has yet to be uncovered. Using a co-culture system with mycobacterial-specific CD4+ T cells, we show APC L-ARG synthesis supported T cell viability and proliferation, and activated T cells contained APC-derived L-ARG. We hypothesize APCs supply L-ARG to support T cell activation under nutrient limiting conditions. This work expands the current model of APC-T cell interactions and provides insight into the effects of nutrient availability in immune cells.
INTRODUCTION
Metabolomics analyses suggest changes in amino acid availability predict the onset of Mycobacterium tuberculosis (Mtb) infection and highlight differences in abundance of L-arginine (L-ARG) and related metabolites, indicating Mtb infection alters L-ARG metabolism (1, 2). L-ARG is utilized by immune cells following mycobacterial infection (3). Macrophages direct L-ARG to fuel NO synthesis and restrict L-ARG availability via arginase 1 (Arg1), while CD4+ T cells require L-ARG for viability, proliferation, and differentiation (3–10). L-ARG is synthesized from L-citrulline (L-CIT) via argininosuccinate synthase 1 (Ass1) and argininosuccinate lyase (Asl) (7, 8, 11–13). Immune cells require this pathway to control mycobacterial infection and rescue T cell functions when L-ARG is limiting (7, 11, 14). Thus, L-ARG and its synthesis are central to immune cell functions.
Following infection, APCs present Ag on MHC Class II, upregulate expression of costimulatory receptors, produce cytokines, and migrate to lymph nodes to activate T cells (3). Despite their importance, APCs are understudied in both mycobacterial infection and L-ARG metabolism. Our published data suggest CD11c+ cells, which include multiple APC populations, require L-ARG synthesis to reduce mycobacterial burden in vivo (14). Considering the importance of Ag presentation for coordination of T cell responses, we hypothesized APC L-ARG synthesis supported CD4+ T cell activation.
Herein, we employ bone marrow derived dendritic cells (BMDCs) and peritoneal macrophages (PMΦs) to explore the necessity of APC L-ARG synthesis on CD4+ T cell priming. Our data show APCs 1) express the L-ARG synthesis pathway, 2) promote CD4+ T cell viability and proliferation via L-ARG synthesis, and 3) supply synthesized L-ARG to T cells. Collectively, these data support a mechanism by which APCs support T cell activation by nutrient sharing.
MATERIALS AND METHODS
Mice.
Mice were housed and bred in the Cincinnati Children’s Hospital Medical Center (CCHMC) Division of Veterinary Services. Strains were obtained from The Jackson Laboratories: B6.129S7-Asltm1Brle/J; B6.Cg-Tg(Tek-cre)1Ywa/J; C57BL/6-Tg(H2-Kb-Tcra,-Tcrb)P25Ktk/J. Mice of both sexes and littermate controls were used when possible. All procedures were approved by the CCHMC Institutional Animal Care and Use Committee.
Cell Culture Media.
BMDC-RPMI: 10% fetal bovine serum (FBS, HyClone), 1% L-glutamine (Gibco), 1% Penicillin/Streptomycin (P/S, Gibco), 55μM 2-ME (Sigma), and 10μg/mL mouse GM-CSF (R&D Systems) in RPMI-1640 (Corning). Complete (C)-DMEM: 10% bovine calf serum (BCS, HyClone,) and 1% P/S in standard DMEM (Corning). L-ARG-free SILAC RPMI: 10% dialyzed FBS (Corning), 1% P/S, 219μM L-lysine-HCl (Sigma), and 55μM 2-ME in SILAC RPMI-1640 (Thermo Scientific).
APC Preparation.
BMDCs: 2×10⁶ bone marrow cells were cultured in BMDC-RPMI and fed on day 3 and 6. Non-adherent BMDCs were collected on day 8. PMΦs: mice were administered 1ml sterile thioglycolate i.p. (Remel). After 4d, peritoneal cells were collected by lavage, red cell lysed, and resuspended in C-DMEM. RNA/protein analysis: APCs were plated at 1×10⁶ cells/well in 12 well plates overnight. Media was replaced with C-DMEM with 100ng/mL Pam3CSK4 (InvivoGen) and/or 2ng/mL mouse recombinant IFNγ (Gibco). T cell co-culture: 2×10⁴ BMDCs or 4×10⁴ PMΦs/well were plated in 96 well round bottom plates (Midwest Scientific) with 50μM P25 peptide (United Biochemical Research, FQDAYNAAGGHNAVF) and incubated overnight, followed by PBS wash and addition of T cells for 96hr prior to analysis, as described below. To inhibit PMΦ nitric oxide production, 100μM 1400w (Cayman Chemical) was added as indicated.
RNA.
APCs were lysed in Trizol (Invitrogen). cDNA was synthesized using SuperScript II reverse transcriptase with oligo dT and random primers (Invitrogen), amplified with SybrGreen (Applied Biosystems), and analyzed on a 7500 Fast RT-PCR System (Applied Biosystems). Primers: Asl (F:5’ACTCTTGGAGGTGCAGAAGC3’, R:5’AGTAGCTCCCGGTCCACAC3’); Ass1 (F:5’CTCGCAGACAGGTGGAGATT3’, R:5’GCCAGTGAATAGCAGGTGAG3’); Solute carrier (Slc) 3a2 (F:5’AGCTACGGGGATGAGCTTG3’, R:5’ TTGGGATGTGAAAGATGCTG3’); Slc7a1 (F:5’CCCGGACATATTTGCTGTG3’, R:5’TGAAGCACAAGACCAGGACA3’); Slc7a2 (F:5’CAACAACGGGTGAAGAGGTT3’, R:5’CCCCAAAGTAAGCCATAAAGC3’); Slc7a5 (F:5’GGTATGATGTGGCTCCGATT3’, R:5’GACACGGCAATGAGGAAGAG3’); Slc7a6 (F:5’TGCCTGCGTTACTGTTCAAT3’, R:5’CAGACAAGCCCACGAAGAAC3’); Slc7a7 (F:5’GGCCTTTCTATTGTGGGTCA3’, R:5’TGCAGAGGCAGAAGATGATG3’); Slc7a8 (F:5’CGGTTGCAGGACAGATAGTC3’, R:5’GCCCAGAACAGCAGGTAGAT3’); RNA Polymerase 2 Subunit A (Polr2a, F:5’AGGACACTGGACCGCTCATG3’, R:5’GCATAATATTCTCAGAGACTCCCTTCA3’).
Immunoblot.
RIPA lysates were separated by Tris–HCl buffered 4–15% gradient SDS-PAGE (Bio-Rad), transferred to Protran membranes (GE), and blocked in 3% milk (Bio-Rad) in TBST. Asl (Abcam), Ass1 (Thermo Scientific), and Grb2 (BD Biosciences) were detected by immunoblot with fluorescent secondary Abs [IRDye 800CW Goat anti-Rabbit, IRDye 800CW Goat anti-Mouse, IRDye 680RD Donkey anti-Goat (LI-COR)]. Images and densitometry were acquired using LI-COR Odyssey CLx and Image Studio 5.2.
T cells.
Mouse lymph nodes and spleens were harvested, processed to single cell suspensions, and RBC lysed. CD4+ cells were isolated via MACS (Miltenyi), incubated with 2μM CellTrace Violet (Gibco) followed by addition of BCS v/v, resuspended in L-ARG-free SILAC RPMI, and plated at 2×10⁵ cells/well. Polyclonal cells were stimulated with 1.5μg/mL α-CD3 and 2.5μg/mL α-CD28 (BioXCell) with 20IU/mL mouse recombinant IL-2 (Invitrogen). L-ARG-HCl and L-CIT (Sigma), or 1,2,3,4,5-13C5 L-ARG and 1,2,3,4,5-13C5 L-CIT (Cambridge Isotope Laboratories) were added as indicated. For supernatant transfer, 150μL culture supernatant were added to 50μL cells and polyclonal stimulant in L-ARG-free SILAC RPMI. Proliferation was analyzed by flow cytometry after 96h.
Flow cytometry.
Cells were incubated with fixable viability dye (eBiosciences) diluted 1:1000, blocked in 5% normal mouse serum, and stained with surface Abs diluted 1:200 [CD4 (GK1.5); CD11b (M1/70); CD11c (N417); CD45.2 (104); CD80 (16–10A1); CD86 (GL1); MHC Class II I-A/I-E (M5/114.15.2) all from Biolegend, eBiosciences, or Invitrogen]. All dilutions were in FACS buffer (1% BCS in PBS). Cells were fixed with Foxp3 Fixation/Permeabilization kit (eBiosciences). Data were acquired on a BD FACSCanto flow cytometer and analyzed by FlowJo.
Mass Spectrometry (MS).
Cells were MACS-isolated with mouse UltraPure CD11c microbeads (Miltenyi) and flow through cells were used. Peptide MS: RIPA lysates from 1×10⁶ cells were mixed with Laemmli solubilization buffer, separated by Bis-Tris buffered 4–12% gradient SDS-PAGE (Invitrogen), and visualized by Coomassie stain. The protein region was excised, reduced with dithiothreitol, alkylated with iodoacetamine, trypsin-digested overnight, and recovered as described (15). Peptides were dried and reconstituted to 0.2μg/μL in 0.1% formic acid. Data were collected on Orbitrap Eclipse mass spectrometer coupled to Dionex Ultimate 3000 RSLCnano (Thermo Scientific). Peptide was injected onto a 5mm nanoviper μ-Precolumn (i.d. 300μm, C18 PepMap 100, 5.0μm, 100Å, Thermo Scientific) at 5μl/min in formic acid/H2O 0.1/99.9 (v/v) for 5min. For chromatographic separation, the trap-column was switched to align with EASY-Spray column PepMap RSLC C18 with a 150mm column (i.d. 75μm, C18, 3.0μm, 100Å). Peptides were eluted using variable mobile phase gradient from 98% phase A (Formic acid/H2O 0.1/99.9, v/v) to 32% phase B (Formic Acid/Acetonitrile 0.1/99.9, v/v) for 60min at 300nL/min. MS1 were collected in Orbitrap (120,000 resolution; maximum injection 50ms; AGC 4×10⁵). Charge states between 2 and 6 were required for MS2 analysis with 20s dynamic exclusion window and cycle time 2.5s. MS2 scans were performed in ion trap with HCD fragmentation (isolation window 0.8Da; NCE 30%; maximum injection 40ms; AGC 5×10⁴) and recorded using Xcalibur 4.3 (Thermo Scientific). Protein identification was done using Proteome Discoverer 2.4 (Thermo Scientific) against mouse database and Sequest HT search algorithm with 13C5-L-ARG added to search parameters to identify modified peptides (reported at >99% confidence). Small molecule MS: Amino acids were extracted from 5×10⁶ cells in methanol or supernatant by protein precipitation and centrifugation and measured with Parallel Reaction Monitoring-based targeted quantification using Vanquish UHPLC coupled to Q Exactive Plus Hybrid Quadrupole-Orbitrap Mass Spectrometer (Thermo Scientific), with stable isotopic-labeled amino acids as internal standards. A 100×2.1mm Atlantis HILIC column (Waters Corp) was used for chromatographic separation, with gradient mobile phase with binary solvent system [80% mobile phase B (95% acetonitrile/5% H2O/0.1% formic acid/1.5 mM ammonium formate) to 35% mobile phase A (H2O/0.1% formic acid/1.5 mM ammonium formate) at 0.5 mL/min for 8min]. Electrospray ionization settings: positive ionization, spray voltage 3.50kV; capillary temperature 260°C; sheath gas flow rate 49; aux gas flow rate 12; S-lens radio frequency level 50. For MS2, precursor ions of L-ARG/13C5-L-ARG and L-CIT/13C5-L-CIT were fragmented with normalized collision energy 45 and 32, respectively. Scan settings: 70,000 resolution, AGC target 2e5, maximum IT 100ms, precursor isolation window 1.0m/z. Data were acquired and processed with Xcalibur™ 4.3. MS2 spectrum was used for amino acid identification. Transition m/z 175.1190→116.0708 and 180.1356→121.0875 were used for quantification of L-ARG and 13C5 L-ARG; Transition m/z 176.1020→113.0710 and 181.1197→117.0845 were used for quantification of L-CIT and 13C5 L-CIT. Peak areas of fragment ions were extracted using 10ppm mass window and integrated across elution profile.
Statistics.
Error bars are SD. Data were analyzed for significance in GraphPad Prism, with test and significance indicators detailed in figure legends.
RESULTS AND DISCUSSION
BMDCs express L-ARG synthesis enzymes.
We first examined whether BMDCs express L-ARG synthesis enzymes (Fig 1a). According to ImmGen, DC subtypes express Asl and Ass1 at comparable levels to macrophages and T cells by RNAseq and microarray, albeit at lower levels than urea cycle utilizing tissues (16). BMDCs stimulated with P3C, a TLR2 agonist, for 2, 8, or 24h expressed both Asl and Ass1 (Fig 1b). Immunoblot confirmed Asl and Ass1 proteins to be constitutively present in Aslflox/flox (AslWT) BMDCs, while BMDCs from Aslflox/flox;Tie-2-cre (AslΔHem) mice lacked Asl (Fig 1c–d). These data show BMDCs constitutively express L-ARG synthesis enzymes and establish a model to probe the importance of this pathway in APC functions.
Figure 1. BMDCs express L-ARG synthesis enzymes.
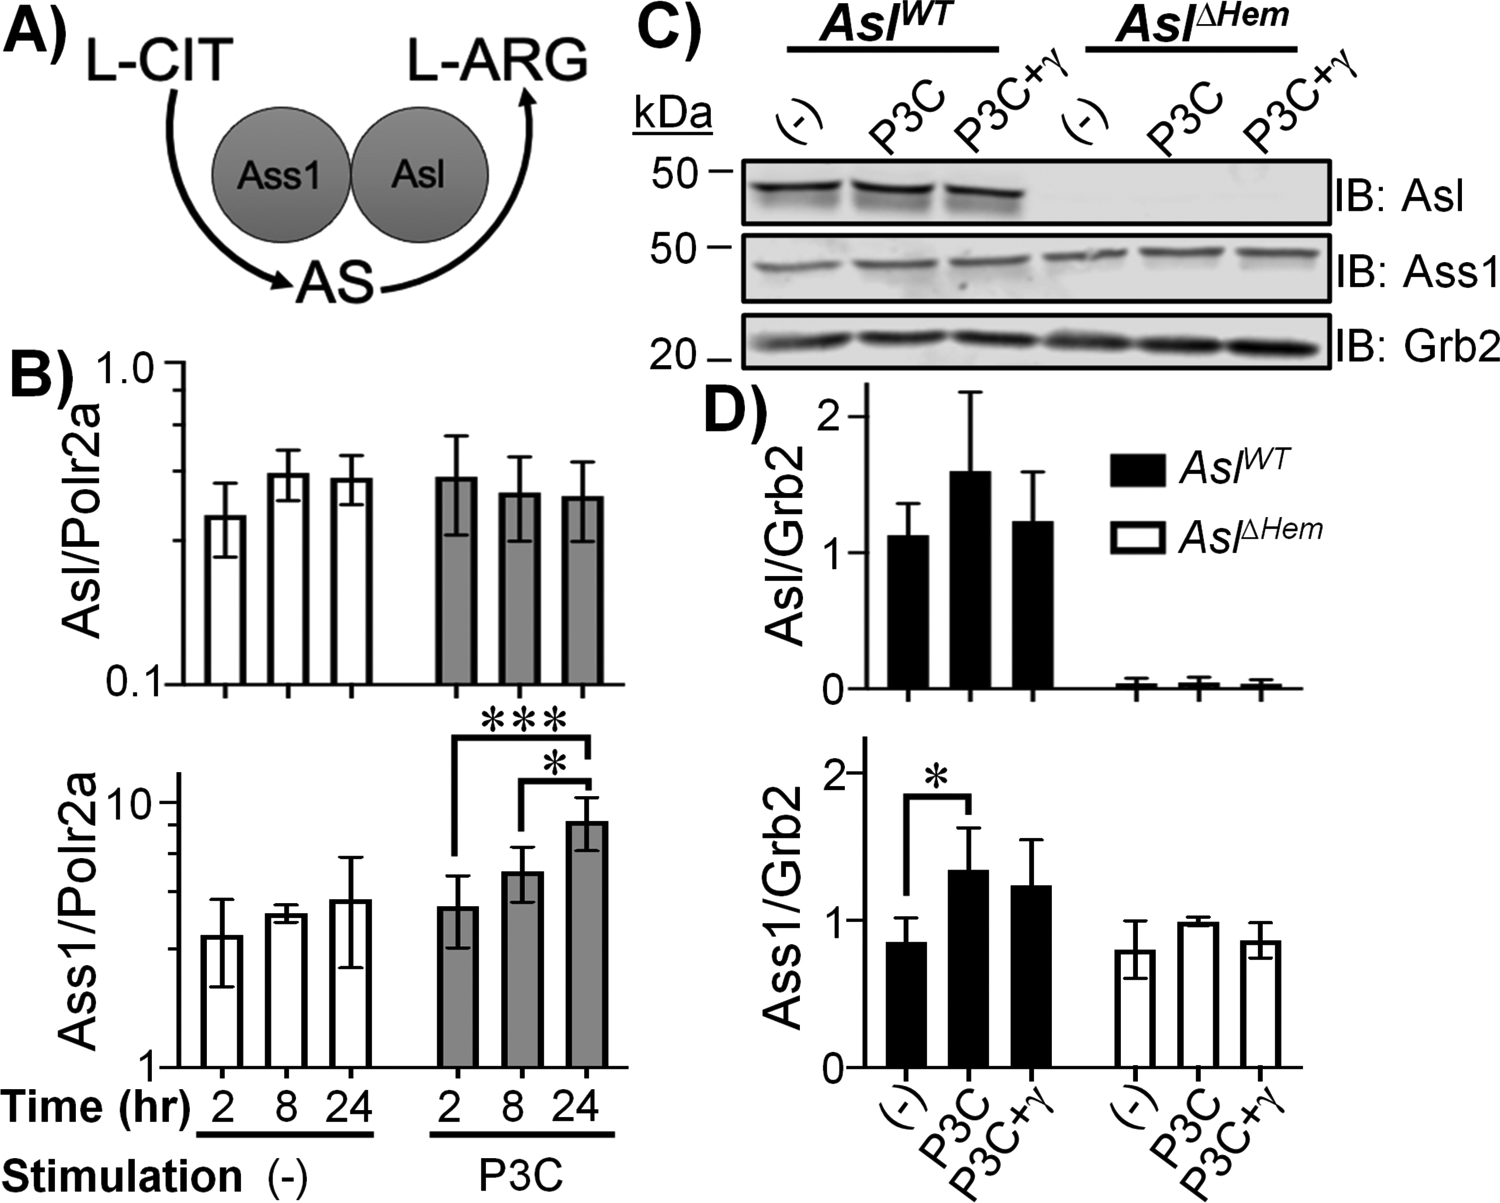
(A) L-ARG synthesis pathway. (B) AslWT BMDCs were unstimulated (−) or stimulated with P3C for 2, 8, or 24h. Asl and Ass1 expression were determined by qRT-PCR. Data are mean±SD (N=6, 2 experiments). *p < 0.05, ***p < 0.001 by ANOVA with Tukey post hoc analysis. (C-D) AslWT and AslΔHem BMDCs were unstimulated (−) or stimulated with P3C±IFN-γ for 24h. Protein lysates were subjected to immunoblot (C) and densitometry analysis (D). Data are mean±SD (N≥3, 2 experiments). *p < 0.05, **p < 0.01 by Student’s t-test compared to (−) of same timepoint.
BMDC L-ARG synthesis supports CD4+ T cell viability and proliferation.
A main APC role is to prime adaptive immune responses, so we next determined the impact of BMDC L-ARG synthesis on T cell activation. We characterized surface Ag presentation and co-stimulatory markers in AslWT and AslΔHem BMDCs and observed no significant differences in MHC Class II, CD80, or CD86 expression (Supplemental Fig 1). Next, we developed a BMDC-CD4+ T cell co-culture assay. Although lymph node concentrations of L-ARG and L-CIT have not been determined, we have shown serum concentrations of L-ARG and L-CIT range from 100–200μM and <100μM, respectively, over the course of mycobacterial infection, yet lung amino acid concentrations change dramatically (14). Thus, we sought to develop a model that encompasses a range of amino acid concentrations.
AslWT or AslΔHem BMDCs were loaded with mycobacterial peptide P25 (17). MACS-isolated (Supplemental Fig 2a–b) CD4+ T cells from P25k mice, expressing TCRs specific for P25 (17), were co-cultured with BMDCs in media containing 0μM, 10μM, 100μM, or 1000μM L-ARG or L-CIT. Of note, RPMI contains 1000μM L-ARG while DMEM contains 400μM L-ARG. Thus, this titration includes relevant physiological and supraphysiologic amino acid concentrations.
With L-ARG present, few differences were found in live or proliferating CD4+ T cells regardless of BMDC genotype (Fig 2a–c). T cell viability and proliferation improved with increasing L-ARG, consistent with published data (4, 9, 10, 13). T cells co-cultured with AslΔHem BMDCs displayed impaired viability and proliferation at 10μM and 100μM L-CIT compared to those cultured with AslWT BMDCs (Fig 2b,d). Given T cells also express L-ARG synthesis enzymes, it is interesting proliferation is impaired under these conditions. When AslWT CD4+ T cells alone were subjected to stimulation with α-CD3/CD28 Abs and IL-2 in 1000μM L-ARG, robust viability and proliferation were observed (Supplemental Fig 2c–e). While this effect was lost in the absence of L-ARG, proliferation and viability were restored in the presence of 1000μM L-CIT, indicating T cell intrinsic L-ARG synthesis supports T cell functions (Supplemental Fig 2c–e). T cell L-ARG synthesis, however, was not sufficient to rescue T cell viability and proliferation at low L-CIT concentrations (Fig 2d), suggesting APC L-ARG synthesis supports CD4+ T cell proliferation when L-ARG is limiting.
Figure 2. BMDC L-ARG synthesis supports T cell viability and proliferation.
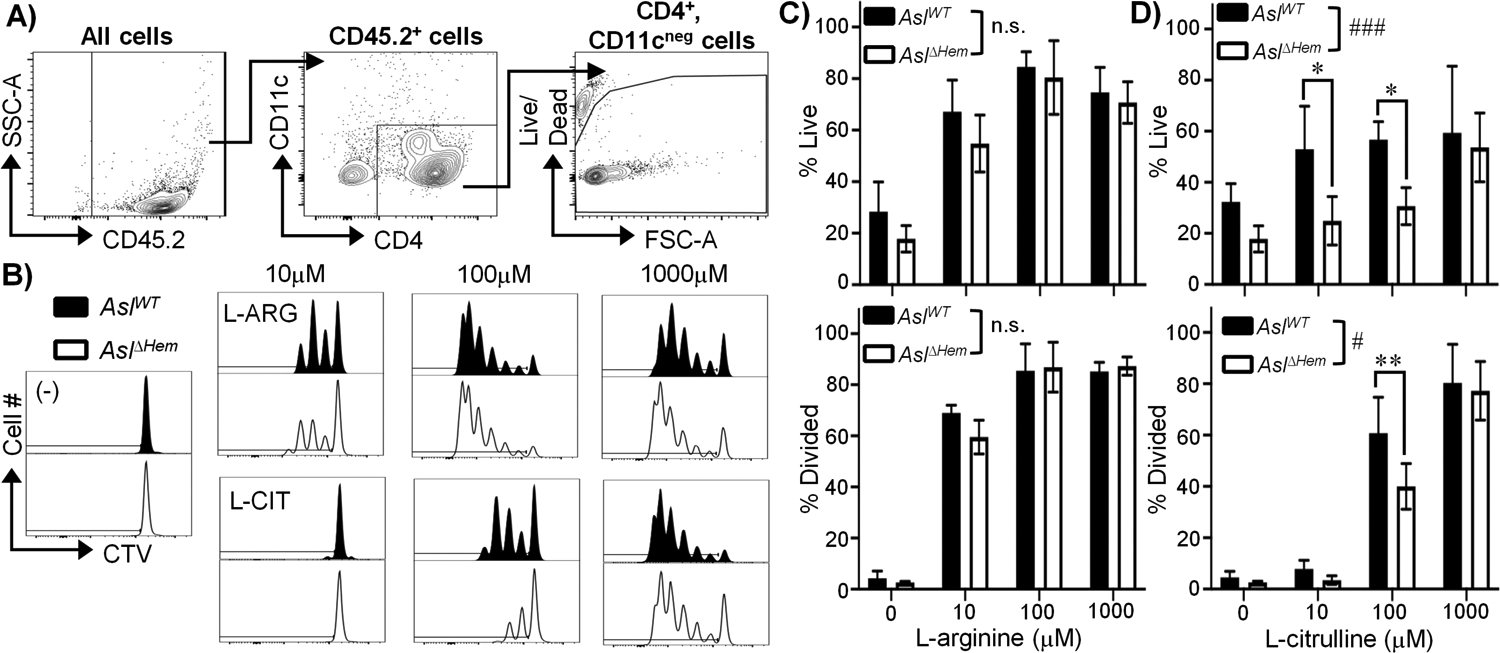
(A-D) CTV-stained P25k CD4+ T cells were co-cultured with P25-loaded AslWT or AslΔHem BMDCs for 96h with amino acids as indicated. (A) Flow cytometry gating for CD45.2+; CD4+, CD11cneg; live cells. (B) Representative live CD4+ T cell proliferation histograms. Graphical representation of live and divided cells cultured in L-ARG (C) or L-CIT (D). Data are mean±SD (N≥5, 2 experiments). # p < 0.05, ### p < 0.001, n.s - not significnat by 2-way ANOVA of overall effect of BMDC genotype on T cell function in L-ARG or L-CIT. *p < 0.05, **p <0.01 by Sidak post hoc analysis as indicated.
APC L-ARG synthesis supports CD4+ T cell functions in the absence of T cell intrinsic L-ARG synthesis
T cells require a source of L-ARG, either via culture media or intrinsic synthesis, to support their functions (7, 8, 12, 13). When subjected to α-CD3/CD28 Abs and IL-2 stimulation in 1mM (1000μM) L-ARG, robust CD4+ T cell viability and proliferation are observed (Supplemental Figure 2c–e). Again, while this was lost in the absence of L-ARG, viability and proliferation were restored in AslWT T cells – but not AslΔHem T cells – when 1mM L-CIT was provided (Supplemental Fig 2c–e). Still, these and previously published data have not considered APC L-ARG synthesis. Hence, we sought to determine if APC L-ARG synthesis supported T cell functions when T cells lack a direct L-ARG source.
AslWT or AslΔHem P25k T cells were co-cultured with AslWT or AslΔHem BMDCs in media containing L-ARG, L-CIT, or neither amino acid; 1mM was used as this was sufficient to restore AslWT T cell proliferation regardless of BMDC genotype (Fig 2). We observed robust T cell viability and proliferation in L-ARG, which was expectedly decreased in conditions lacking L-ARG and L-CIT (Fig 3a–c). Viability and proliferation of AslWT T cells were rescued in the presence of L-CIT, regardless of BMDC genotype (Fig 3a–c). Surprisingly, when AslΔHem T cells were cultured with AslWT BMDCs, T cell functions were restored in L-CIT – an effect that was lost when cultured with AslΔHem BMDCs (Fig 3a–c). We observed similar results using ex vivo isolated AslWT or AslΔHem PMΦs as APCs (Supplemental Fig 2f–m). These data suggest intrinsic L-ARG synthesis is not required to preserve T cell functions when in the vicinity of L-ARG-synthesizing APCs. This may explain why mice with T cells lacking L-ARG synthesis in a previous report did not display changes in mycobacterial burden as APCs in this setting retained L-ARG synthesis capabilities (7)- an area to be revisited in future studies.
Figure 3. BMDC L-ARG synthesis supports CD4+ T cell functions in the absence of T cell intrinsic L-ARG synthesis.
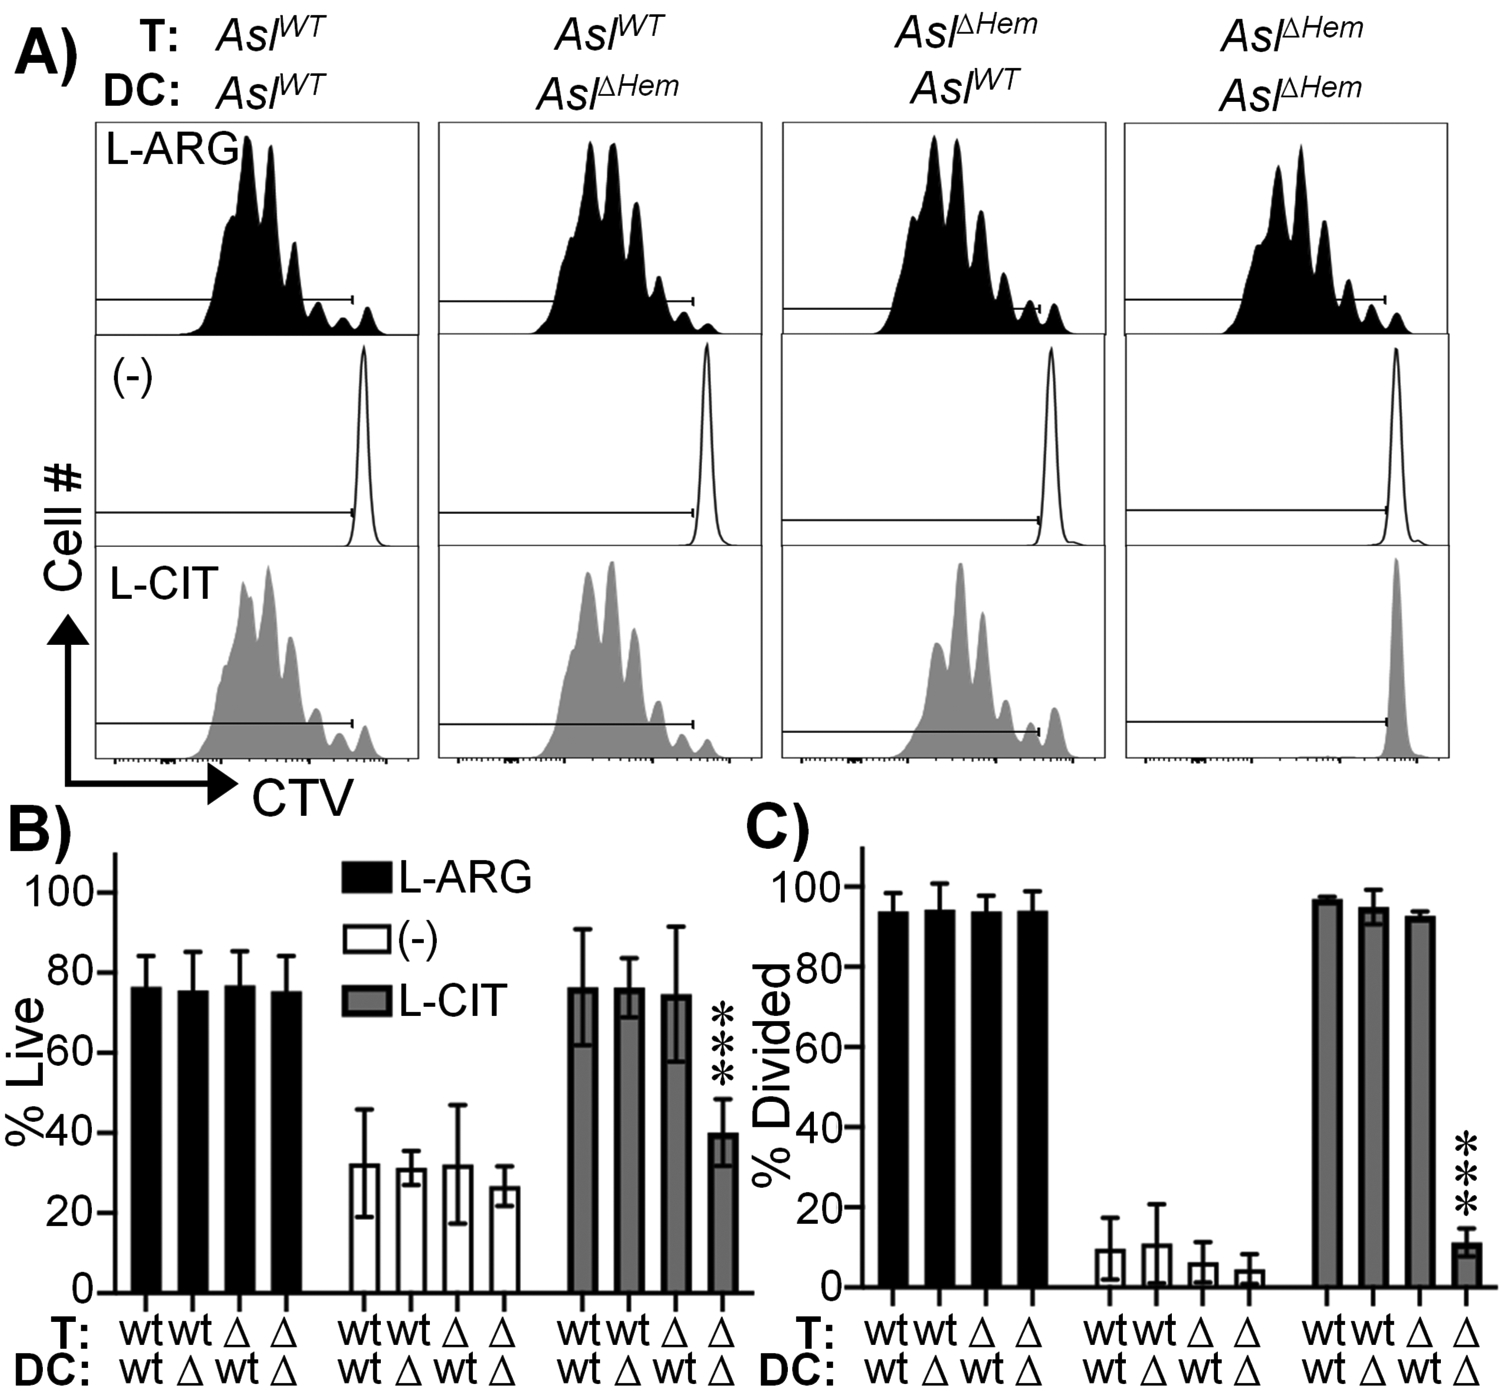
CTV-stained P25k AslWT or AslΔHem CD4+ T cells were co-cultured with P25-loaded AslWT or AslΔHem BMDCs for 96h. Cells were gated as in figure 2. (A) Representative live CD4+ T cell proliferation histograms. Graphical representation of live (B) and divided (C) cells. Media contained 1mM L-ARG (black), 1mM L-CIT (gray), or neither (white). Data are mean±SD (N=9, 3 experiments). ***p < 0.001 by Student’s t-test compared to 1mM L-ARG for same BMDC/T cell group.
Asl-deficient CD4+ T cells contain synthesized L-ARG.
We next hypothesized APCs were providing L-ARG to sustain CD4+ T cell activity. AslWT or AslΔHem P25k T cells were co-cultured with AslWT or AslΔHem BMDCs as above, but media contained 1mM 13C5 L-ARG, 13C5 L-CIT, or 12C5 L-CIT. Use of 13C5 L-CIT allows tracking of synthesized L-ARG, while 13C5 L-ARG and 12C5 L-CIT serve as positive and negative controls, respectively. After 96h, T cells were MACS-enriched (Supplemental Fig 3a–b) and subjected to MS to detect 13C5 L-ARG (Fig 4a).
Figure 4. Asl-deficient CD4+ T cells contain synthesized L-ARG.
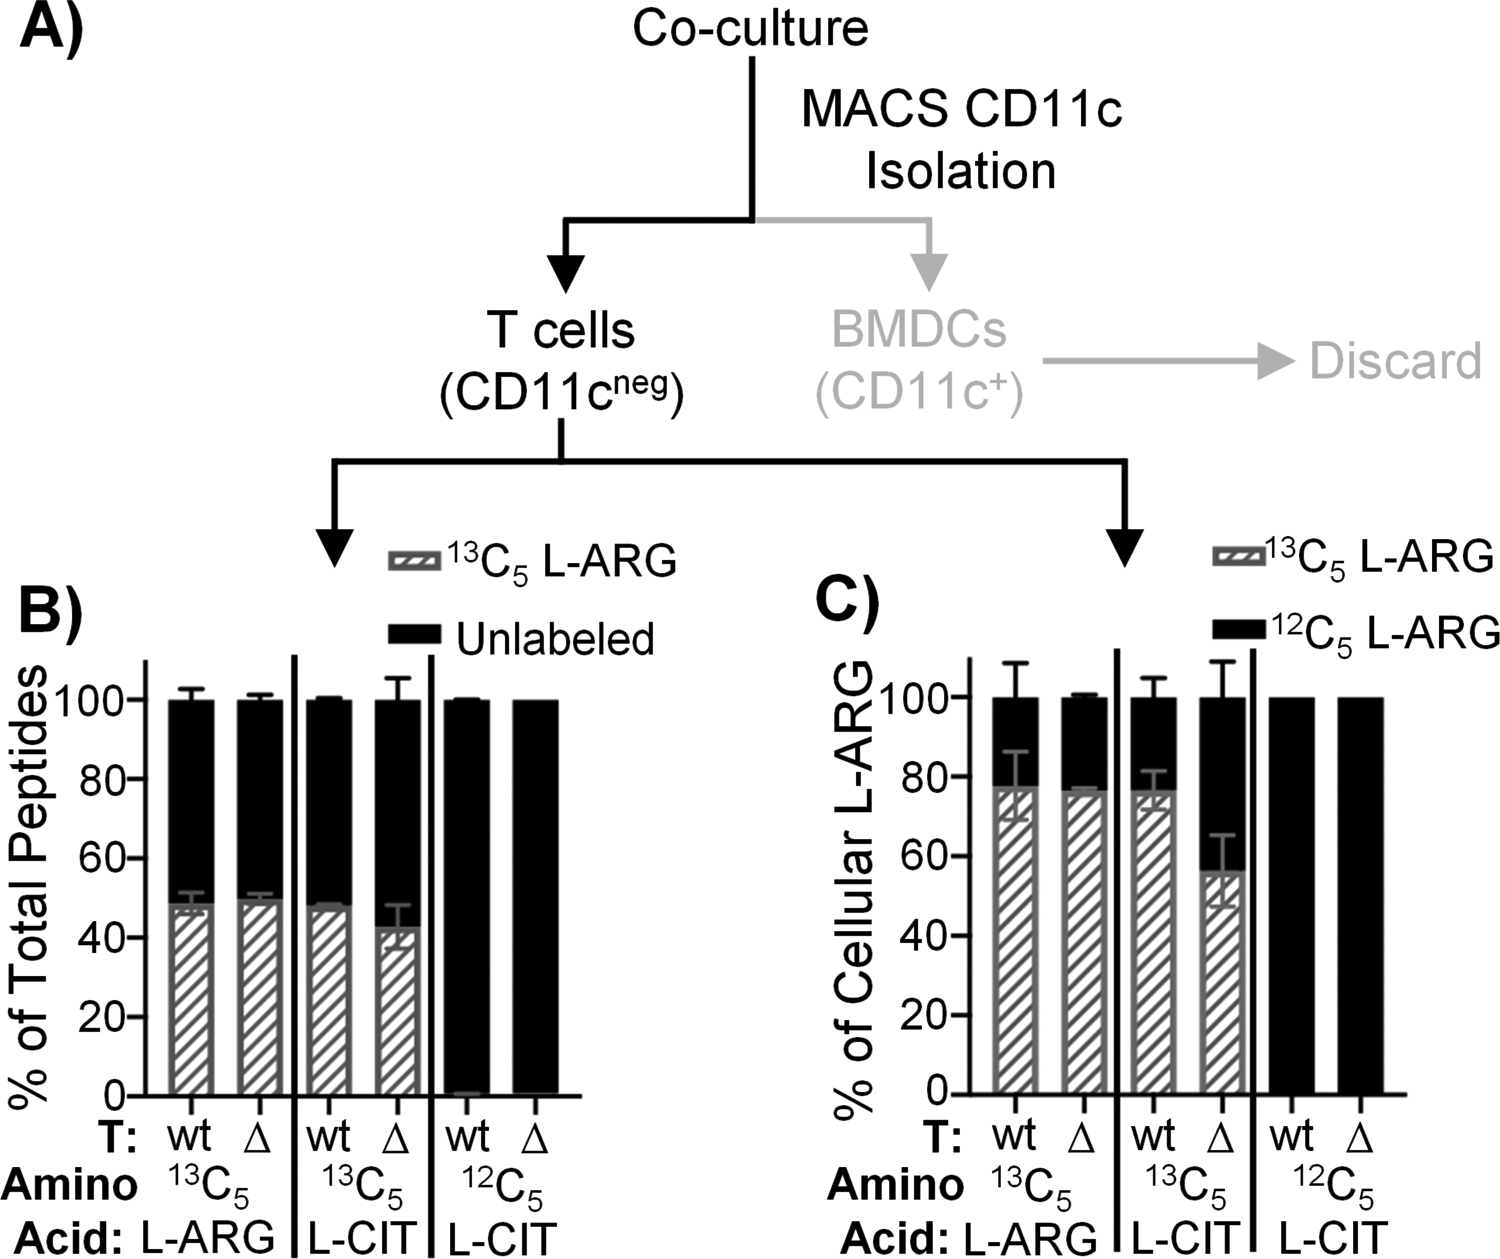
(A) Experimental setup. AslWT or AslΔHem P25k CD4+ T cells were co-cultured with P25-loaded AslWT or AslΔHem BMDCs for 96h. Media contained 1mM 13C5 L-ARG, 13C5 L-CIT, or 12C5 L-CIT. T cells were isolated by CD11c MACS and prepared for peptide or small molecule MS analysis. B) Percentage of total peptides containing 13C5 L-ARG (gray hashed) or unlabeled (black). Data are mean±SD (N=3, 2 experiments). C) Percentage of 13C5 L-ARG (gray hashed) or 12C5 L-ARG (black) within total free L-ARG. Data are mean±SD (N=2, 2 experiments).
Activated T cells proliferate, requiring protein synthesis to form new cells. Thus, we first assessed 13C5 L-ARG incorporation into T cell proteins. As a positive control, T cells cultured in 13C5 L-ARG show 13C5 L-ARG incorporation into 50% of peptides – the entire estimated pool of L-ARG-containing peptides as trypsin digestion results in peptides terminating in L-ARG or L-lysine in equal ratios (18) (Fig 4b, Supplemental Fig 3c–d). When AslWT T cells were cultured in 13C5 L-CIT, we also observed 13C5 L-ARG integration into 50% of peptides, owing to T cell intrinsic L-ARG synthesis. We found similar 13C5 L-ARG incorporation when AslΔHem T cells were cultured with AslWT BMDCs in 13C5 L-CIT (Fig 4b, Supplemental Fig 3d), suggesting L-ARG synthesized from BMDCs was utilized for de novo T cell protein synthesis. When AslΔHem T cells were cultured with AslΔHem BMDCs in 13C5 L-CIT, no 13C5 L-ARG was detected (Supplemental Fig 3c–d).
To validate these findings we detected non-peptide-incorporated T cell L-ARG. T cells cultured in 13C5 L-ARG derived 80% of their cellular L-ARG from 13C5 L-ARG (Fig 4c, Supplemental Fig 3e–f). When AslWT T cells were cultured with AslWT BMDCs in 13C5 L-CIT, 80% of cellular L-ARG was 13C5 labeled (Fig 4c, Supplemental Fig 3e–f). Similar to peptide MS, when AslΔHem T cells were cultured with AslWT BMDCs in 13C5 L-CIT, the majority of cellular L-ARG was 13C5 labeled (Fig 4c, Supplemental Fig 3e–f).
Given APC extracellular vesicles assist in T cell priming following infection and mediate cellular mRNA and/or protein transfer (19, 20), we were curious if T cells acquired Asl protein from BMDCs. Using CD4+ T cells isolated post co-culture, we were unable to detect Asl protein in AslΔHem T cells (Supplemental Fig 3g–h). Thus, BMDCs do not supply T cells with L-ARG synthesis machinery.
BMDC-synthesized L-ARG is found within the extracellular milieu and fuels CD4+ T cell viability and proliferation.
Given BMDC-synthesized L-ARG can be found in CD4+ T cells, we hypothesized BMDCs exported synthesized L-ARG for use by nearby T cells. We first defined APC amino acid transporter expression, identifying L-ARG importers (Slc7a1, Slc7a2) and CD98hc (Slc3a2) that pairs with L-CIT transporters (Slc7a5, Slc7a8) and L-ARG exporters (Slc7a6, Slc7a7) (Supplemental Fig S4) (8, 21). Next, MS analysis of culture supernatants revealed exported L-ARG from AslWT BMDC cultures provided L-CIT (Fig 5a). Though only ~25μM L-ARG was detected – presumably the majority of L-ARG was used in the initial culture – its transfer to AslΔHem CD4+ T cells was sufficient to promote viability and proliferation in the absence of additional L-ARG (Fig 5b–d). Thus, we concluded BMDCs synthesize and release L-ARG into the extracellular milieu, supporting T cell viability and proliferation.
Figure 5. BMDC-synthesized L-ARG is found within the extracellular milieu and fuels CD4+ T cell viability and proliferation.
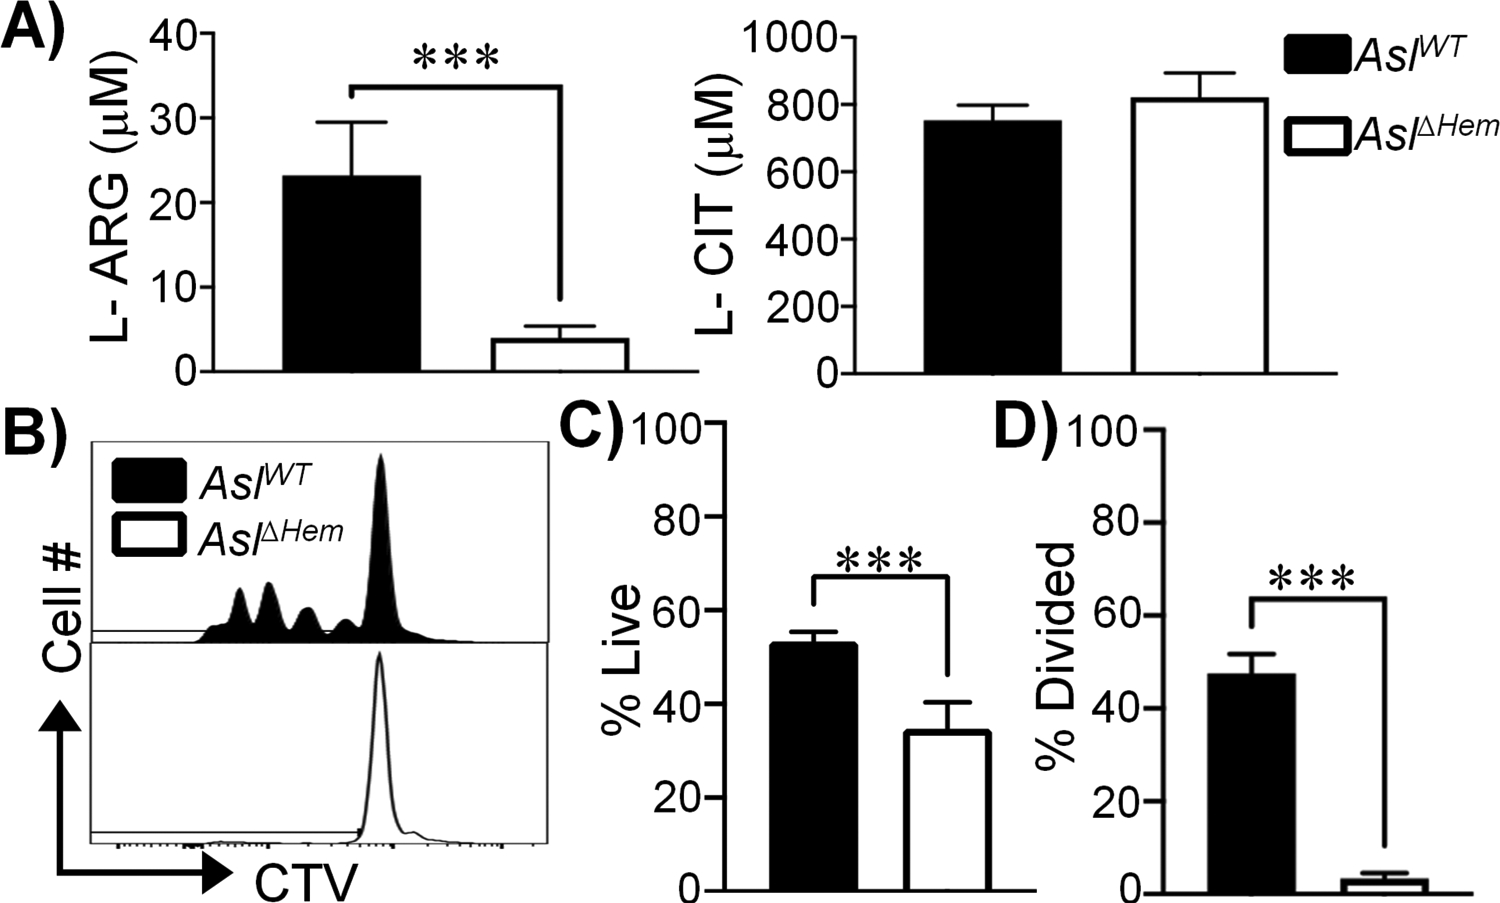
(A) L-ARG and L-CIT concentration in supernatants collected from co-cultures of AslΔHem CD4+ T cells with AslWT or AslΔHem BMDCs originally in media containing 1mM L-CIT. Data are mean+SD (N=5, 2 experiments). (B-D) CTV-stained AslΔHem CD4+ T cells were stimulated with α-CD3/CD28 and IL-2 for 96h. Media contained supernatants from AslΔHem CD4+ T cells co-cultured with AslWT (black) or AslΔHem (white) BMDCs originally supplemented 1mM L-CIT. (B) Representative live CD4+ T cell proliferation histograms. Graphical representation of live (C) and divided (D) cells. Data are mean+SD (N=6, 2 experiments). ***p < 0.001 by Student’s t-test.
Systemic activation of L-ARG metabolism may serve as a biomarker of TB infection (1, 2). Myeloid L-ARG synthesis is required for optimal control of in vivo mycobacterial infection (14). However, the role of APC L-ARG synthesis was previously unclear. Here we have shown APC L-ARG synthesis supports T cell viability and proliferation, and APC-derived L-ARG can be found in T cells. The literature supports a mechanism of T cell regulation via L-ARG depletion by myeloid Arg1, which has been implicated as a driver of immunosuppression (3, 7, 22–24). Our data, however, introduce a converse phenomenon in which APCs supply T cells with L-ARG. Further studies are needed to determine if this extends to other nutrients, how these nutrients are supplied, and in vivo applicability. In summary, our findings reveal a novel mechanism of nutrient sharing between APCs and T cells supporting T cell functions when L-ARG is limiting.
Supplementary Material
KEY POINTS.
APC L-ARG synthesis supports T cell viability and proliferation.
T cells contain APC-derived L-ARG.
APCs secrete L-ARG into the extracellular milieu to fuel T cell functions.
ACKNOWLEDGEMENTS
We thank Drs. S.S. Way, T. Alenghat, H. Deshmukh, K. Araki, G. Deepe, K. Wikenheiser-Brokamp, F. McCormack, D. Hildeman and their laboratories for invaluable discussions during manuscript preparation. This work benefitted from data assembled by the ImmGen consortium. Flow cytometric data were acquired using equipment in the Research Flow Cytometry Core in the CCHMC Division of Rheumatology.
GRANT SUPPORT
This work was supported by R21AI148612 (JEQ), CCHMC Research Innovation and Pilot Award (JEQ), Infectious Diseases Society of America Grant for Emerging Researchers and Clinical Mentorship (RRC), UC Graduate Student Government Research Fellowship (RRC), T32AI118697 (MCM appointee), and the CCHMC Division of Infectious Diseases. Peptide MS data were collected in the UC Proteomics Laboratory with support of an NIH Shared Instrumentation Grant (S10OD026717, KDG).
REFERENCES
- 1.Weiner J 3rd, Maertzdorf J, Sutherland JS, Duffy FJ, Thompson E, Suliman S, McEwen G, Thiel B, Parida SK, Zyla J, Hanekom WA, Mohney RP, Boom WH, Mayanja-Kizza H, Howe R, Dockrell HM, Ottenhoff THM, Scriba TJ, Zak DE, Walzl G, and Kaufmann SHE. 2018. Metabolite changes in blood predict the onset of tuberculosis. Nat Commun 9: 5208. [DOI] [PMC free article] [PubMed] [Google Scholar]
- 2.Vrieling F, Alisjahbana B, Sahiratmadja E, van Crevel R, Harms AC, Hankemeier T, Ottenhoff THM, and Joosten SA. 2019. Plasma metabolomics in tuberculosis patients with and without concurrent type 2 diabetes at diagnosis and during antibiotic treatment. Sci Rep 9: 18669. [DOI] [PMC free article] [PubMed] [Google Scholar]
- 3.Crowther RR, and Qualls JE. 2020. Metabolic Regulation of Immune Responses to Mycobacterium tuberculosis: A Spotlight on L-Arginine and L-Tryptophan Metabolism. Front Immunol 11: 628432. [DOI] [PMC free article] [PubMed] [Google Scholar]
- 4.Rodriguez PC, Quiceno DG, and Ochoa AC. 2007. L-arginine availability regulates T-lymphocyte cell-cycle progression. Blood 109: 1568–1573. [DOI] [PMC free article] [PubMed] [Google Scholar]
- 5.McKell MC, Crowther RR, Schmidt SM, Robillard MC, Cantrell R, Lehn MA, Janssen EM, and Qualls JE. 2021. Promotion of Anti-Tuberculosis Macrophage Activity by L-Arginine in the Absence of Nitric Oxide. Front Immunol 12: 653571. [DOI] [PMC free article] [PubMed] [Google Scholar]
- 6.Rapovy SM, Zhao J, Bricker RL, Schmidt SM, Setchell KD, and Qualls JE. 2015. Differential Requirements for L-Citrulline and L-Arginine during Antimycobacterial Macrophage Activity. J Immunol 195: 3293–3300. [DOI] [PMC free article] [PubMed] [Google Scholar]
- 7.Lange SM, McKell MC, Schmidt SM, Hossfeld AP, Chaturvedi V, Kinder JM, McAlees JW, Lewkowich IP, Way SS, Turner J, and Qualls JE. 2017. l-Citrulline Metabolism in Mice Augments CD4+ T Cell Proliferation and Cytokine Production In Vitro, and Accumulation in the Mycobacteria-Infected Lung. Frontiers in Immunology 8. [DOI] [PMC free article] [PubMed] [Google Scholar]
- 8.Werner A, Koschke M, Leuchtner N, Luckner-Minden C, Habermeier A, Rupp J, Heinrich C, Conradi R, Closs EI, and Munder M. 2017. Reconstitution of T Cell Proliferation under Arginine Limitation: Activated Human T Cells Take Up Citrulline via L-Type Amino Acid Transporter 1 and Use It to Regenerate Arginine after Induction of Argininosuccinate Synthase Expression. Frontiers in Immunology 8. [DOI] [PMC free article] [PubMed] [Google Scholar]
- 9.Rodriguez PC, Zea AH, DeSalvo J, Culotta KS, Zabaleta J, Quiceno DG, Ochoa JB, and Ochoa AC. 2003. L-Arginine Consumption by Macrophages Modulates the Expression of CD3ζ Chain in T Lymphocytes. The Journal of Immunology 171: 1232–1239. [DOI] [PubMed] [Google Scholar]
- 10.Ochoa JB, Strange J, Kearney P, Gellin G, Endean E, and Fitzpatrick E. 2001. Effects of L-Arginine on the Proliferation of T Lymphocyte Subpopulations. Journal of Parenteral and Enteral Nutrition 25: 23–29. [DOI] [PubMed] [Google Scholar]
- 11.Qualls JE, Subramanian C, Rafi W, Smith AM, Balouzian L, DeFreitas AA, Shirey KA, Reutterer B, Kernbauer E, Stockinger S, Decker T, Miyairi I, Vogel SN, Salgame P, Rock CO, and Murray PJ. 2012. Sustained generation of nitric oxide and control of mycobacterial infection requires argininosuccinate synthase 1. Cell Host Microbe 12: 313–323. [DOI] [PMC free article] [PubMed] [Google Scholar]
- 12.Tarasenko TN, Gomez-Rodriguez J, and McGuire PJ. 2015. Impaired T cell function in argininosuccinate synthetase deficiency. Journal of Leukocyte Biology 97: 273–278. [DOI] [PMC free article] [PubMed] [Google Scholar]
- 13.Bansal V, Rodriguez P, Wu G, Eichler DC, Zabaleta J, Taheri F, and Ochoa JB. 2004. Citrulline Can Preserve Proliferation and Prevent the Loss of CD3 ζ Chain Under Conditions of Low Arginine. Journal of Parenteral and Enteral Nutrition 28: 423–430. [DOI] [PubMed] [Google Scholar]
- 14.Lange SM, McKell MC, Schmidt SM, Zhao J, Crowther RR, Green LC, Bricker RL, Arnett E, Köhler SE, Schlesinger LS, Setchell KDR, and Qualls JE. 2019. L-Arginine Synthesis from L-Citrulline in Myeloid Cells Drives Host Defense against Mycobacteria In Vivo. The Journal of Immunology: ji1801569. [DOI] [PMC free article] [PubMed] [Google Scholar]
- 15.Eismann T, Huber N, Shin T, Kuboki S, Galloway E, Wyder M, Edwards MJ, Greis KD, Shertzer HG, Fisher AB, and Lentsch AB. 2009. Peroxiredoxin-6 protects against mitochondrial dysfunction and liver injury during ischemia-reperfusion in mice. Am J Physiol Gastrointest Liver Physiol 296: G266–274. [DOI] [PMC free article] [PubMed] [Google Scholar]
- 16.Heng TS, and Painter MW. 2008. The Immunological Genome Project: networks of gene expression in immune cells. Nat Immunol 9: 1091–1094. [DOI] [PubMed] [Google Scholar]
- 17.Tamura T, Ariga H, Kinashi T, Uehara S, Kikuchi T, Nakada M, Tokunaga T, Xu W, Kariyone A, Saito T, Kitamura T, Maxwell G, Takaki S, and Takatsu K. 2004. The role of antigenic peptide in CD4+ T helper phenotype development in a T cell receptor transgenic model. Int Immunol 16: 1691–1699. [DOI] [PubMed] [Google Scholar]
- 18.Zhuang Y, Ma F, Li-Ling J, Xu X, and Li Y. 2003. Comparative analysis of amino acid usage and protein length distribution between alternatively and non-alternatively spliced genes across six eukaryotic genomes. Mol Biol Evol 20: 1978–1985. [DOI] [PubMed] [Google Scholar]
- 19.Smith VL, Cheng Y, Bryant BR, and Schorey JS. 2017. Exosomes function in antigen presentation during an in vivo Mycobacterium tuberculosis infection. Sci Rep 7: 43578. [DOI] [PMC free article] [PubMed] [Google Scholar]
- 20.Maas SLN, Breakefield XO, and Weaver AM. 2017. Extracellular Vesicles: Unique Intercellular Delivery Vehicles. Trends Cell Biol 27: 172–188. [DOI] [PMC free article] [PubMed] [Google Scholar]
- 21.Closs EI, Simon A, Vékony N, and Rotmann A. 2004. Plasma membrane transporters for arginine. J Nutr 134: 2752S–2759S; discussion 2765S-2767S. [DOI] [PubMed] [Google Scholar]
- 22.Fletcher M, Ramirez ME, Sierra RA, Raber P, Thevenot P, Al-Khami AA, Sanchez-Pino D, Hernandez C, Wyczechowska DD, Ochoa AC, and Rodriguez PC. 2015. L-Arginine Depletion Blunts Antitumor T-cell Responses by Inducing Myeloid-Derived Suppressor Cells. Cancer Research 75: 275–283. [DOI] [PMC free article] [PubMed] [Google Scholar]
- 23.Geiger R, Rieckmann JC, Wolf T, Basso C, Feng Y, Fuhrer T, Kogadeeva M, Picotti P, Meissner F, Mann M, Zamboni N, Sallusto F, and Lanzavecchia A. 2016. L-Arginine Modulates T Cell Metabolism and Enhances Survival and Anti-tumor Activity. Cell 167: 829–842.e813. [DOI] [PMC free article] [PubMed] [Google Scholar]
- 24.Bronte V, Serafini P, Mazzoni A, Segal DM, and Zanovello P. 2003. L-arginine metabolism in myeloid cells controls T-lymphocyte functions. Trends in Immunology 24: 301–305. [DOI] [PubMed] [Google Scholar]
Associated Data
This section collects any data citations, data availability statements, or supplementary materials included in this article.


