

Summary
We test the hypothesis that glioblastoma harbors quiescent cancer stem cells that evade anti-proliferative therapies. Functional characterization of spontaneous glioblastomas from genetically engineered mice reveals essential quiescent stem-like cells that can be directly isolated from tumors. A derived quiescent cancer stem cell specific gene expression signature is enriched in pre-formed patient xenograft single cell clusters that lack proliferative gene expression. A refined human 118-gene signature is preserved in quiescent single cell populations from primary and recurrent human glioblastomas. The F3 cell surface receptor mRNA, expressed in the conserved signature, identifies quiescent tumor cells by antibody immunohistochemistry. F3 antibody sorted glioblastoma cells exhibit stem cell gene expression, enhanced self-renewal in culture, drive tumor initiation, serial transplantation, and reconstitute tumor heterogeneity. Upon chemotherapy, the spared cancer stem cell pool becomes activated and accelerates transition to proliferation. These results help explain conventional treatment failure and lay a conceptual framework for alternative therapies.
Keywords: Glioblastoma, cancer stem cells, quiescence, single cell RNA sequencing, F3 receptor, temozolomide, chemoresistance, recurrence, heterogeneity
eTOC Blurb
Tumor recurrence is a challenge in glioblastoma (GBM) treatment. Xie, Laks et al. characterize quiescent cancer stem cells, in both mouse and human GBM, that become activated upon chemotherapy, thus paving the way for interrogation of the cancer stem cell role in GBM recurrence and the identification of potentially actionable vulnerabilities.
Graphical Abstract
Introduction
The standard of care for glioblastoma (GBM) is resection followed by radiation and chemotherapy that inevitably fails. The cancer stem cell (CSC) concept, first documented in lymphoma has been implicated in solid tumors including GBM and postulates a pathologic recapitulation of the hierarchical stem cell niche (Chen et al., 2012a; Clarke et al., 2006; Dick, 2008; Lan et al., 2017; Lee et al., 2018; Singh et al., 2004). Seminal studies using progressive dilution of primary human GBM cells in transplantation first indicated that only limited subsets of dissociated GBM cells retain the potential to reseed tumors in immunocompromised mice (Singh et al., 2004). Additional studies using barcoded human GBM cells in orthotopic transplantation further supported a hierarchical process in tumor progression (Lan et al., 2017). However, tools to directly isolate and study the specific properties of tumor cells at the apex of the tumor hierarchy in vivo or in homogeneous freshly purified preparations, have not been available. Instead, GBM CSCs or glioma stem cells (GSCs) are operationally and functionally defined in mixed populations of cells that have capacity to form spheres in vitro and to seed tumors in vivo (Gimple et al., 2019; Prager et al., 2019). However, it remains unclear, how these putative CSC preparations defined in the culture setting may relate to the situation in vivo where GBM is a highly heterogeneous and invasive tumor that resides within a highly interactive central nervous system tumor microenvironment (Monje et al., 2020).
One potential explanation for the ineffectiveness of conventional chemotherapy in GBM may be related to the hypothesis that in vivo the cells at the apex of the tumor hierarchy (CSC) are quiescent and thus, may evade conventional therapies designed to specifically target proliferating cells (Parada et al., 2017; Suva and Tirosh, 2020). Genetically engineered spontaneous GBM mouse models have provided functional support for this hypothesis, but similar evidence is lacking in human GBM studies (Chen et al., 2012a). With the advent of single cell sequencing, the intratumoral cellular heterogeneity and transcriptional plasticity in human GBM has been highlighted and further, the resulting analytics have been interpreted to suggest that the tumor cell population is composed of plastic or alternatively, proliferative cancer stem cells (Bhaduri et al., 2020; Couturier et al., 2020; Neftel et al., 2019; Piccirillo et al., 2009).
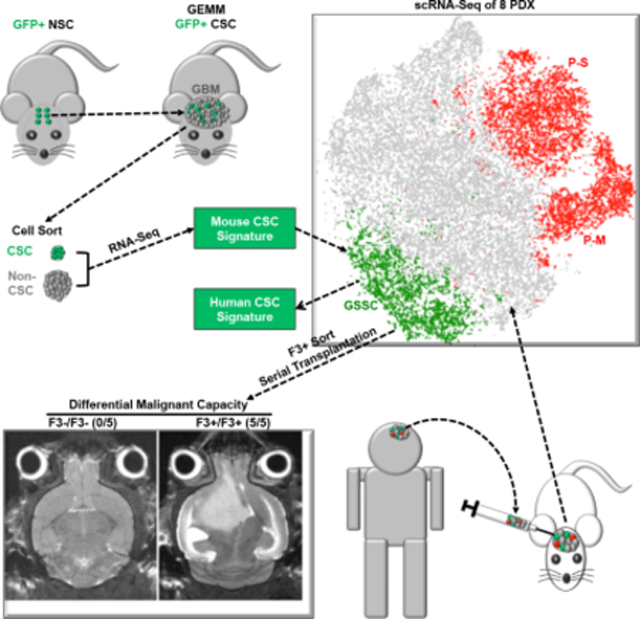
In order to rigorously assess the quiescent GBM CSC hypothesis, we set out to empirically identify, isolate, and characterize them in vivo. Under the premise that spontaneous glioma genetically engineered mouse models (GEMMs) would provide the most favorable experimental entry point, we first tested, identified, and isolated quiescent CSC in this system. Once identified, we demonstrated in vivo quiescence and extracted unique transcriptional features. Derivation of a quiescent murine GBM CSC gene expression signature permitted the next step: to examine whether specific human GBM cells retain conservation of the unique stem-like gene signature, in vivo quiescence, and associated functional properties.
Results
CGD transgene mediates GBM formation from Neural Stem Cells
Using mouse models, we have demonstrated an association between neural stem cells (NSC) and the origin of GBM (Alcantara Llaguno et al., 2009; Alcantara Llaguno et al., 2019; Lee et al., 2018; Li et al., 2013; Vanner et al., 2014) and also proposed a quiescent stem-like cell to be responsible for GBM recurrence (Chen et al., 2012a; Zhu et al., 2005). We sought to provide a definitive link first through use of a transgene (CGD) that specifies expression in adult NSC, and expresses three proteins, CreERT2, histone 2B tagged enhanced GFP (H2B-eGFP), and human diphtheria toxin receptor (hDTR), from one transcript (Fig. 1A)(Alcantara Llaguno et al., 2009; Imayoshi et al., 2006; Mignone et al., 2004; Xie et al., 2020; Yu et al., 2008; Zimmerman et al., 1994). Comprehensive characterization of the transgene in adult murine brain demonstrated GFP expression in greater than 96% of subventricular zone (SVZ) neural stem and progenitor cells (Xie et al., 2020). Tamoxifen (TMX) induced loss of the GBM relevant tumor suppressors, Nf1, Trp53 and Pten (CGD-Nfflox/+;Trp53flox/+;Ptenflox/+) in adult mice resulted in spontaneous and fully penetrant GBM development (Fig. 1A) (Alcantara Llaguno et al., 2015; Chen et al., 2012a; Chen et al., 2012b). All mice died within three to seven months post TMX with high-grade gliomas and spontaneous loss of heterozygosity at the Nf1 and Trp53 loci (Fig. 1B–D). A GFP+;Ki67− cell population was identified in all tumors and sorting and quantification of GFP+ cells indicated that GFP+ GBM cell represented fewer than 6% for a majority of tumors (22/26; Fig. 1E–F & S1A). When tumor cells were plated at low density following sorting, GFP+, GFP− and DAPI− (mixed viable) cells produce doublets within 24 hours (Fig. S1B&C). However, GFP− cells showed limited sphere forming potential and transitioning from GFP− to GFP+ cells was never observed (Fig. S1D–F). In contrast, GFP+ cells demonstrate enhanced tumor sphere formation and gradual differentiation as assayed by reduction of GFP fluorescence (Fig. S1E–F). Thus, the minority tumor population of CGD-GFP+ GBM cells harbor unique stem cell-like properties.
Figure 1. CGD transgene GFP labels putative GBM CSC initiated from wild-type neural stem cells.

(A) Upper panel: Depiction of transgenic products generated from CGD transgene. Cre-ERT2, H2B-eGFP, and hDTR are translated from the same transcript through ribosomal skipping. Lower Panel: Cartoon illustrates localization of GFP proteins in NSC of wild-type SVZ (left) and, upon Cre induction, putative GBM CSC. (B) Hematoxylin and eosin (H&E) staining of spontaneous GBM (dotted red line) in representative brain sagittal section from CGD;Nf1fl/+;Trp53fl/+;Ptenfl/+ mice. Actively dividing GBM cells are highlighted by red circles (right panel). Scale bars in left and right panels: 1mm and 20um. (C) CGD-GBM mice develop high-grade gliomas (HGG). (D) Survival curves demonstrate fully penetrant mortality induced by CGD transgene following tamoxifen administration within three to seven months after induction. (E) Representative FACS sorting images show a 4% GFP+ cell compartment in a spontaneous CGD-GBM. (F) 22 of 26 CGD GBM contain fewer than 6% GFP+ cells. See also Figure S1.
GFP+ GBM cells are quiescent cancer stem cells
We further characterized the in vivo mitotically silent GFP+/Ki67− GBM cells that when placed in culture entered the cell cycle. To assess tumor forming potential of GFP+ versus GFP− GBM cells, pools of one thousand or four thousand GBM cells obtained from freshly dissected, dissociated, and GFP-sorted, spontaneous tumors were orthotopically allografted into brains of recipient mice. The GFP+ cell cohorts exhibited significantly accelerated tumor development and morbidity compared to the GFP− tumor cells (Fig. 2A). Survival and histological outcomes indicated that whereas GFP+ cohorts developed hypercellular tumors and retained quiescent (Ki67−) GFP+ cells, GFP− tumor cell injected cohorts formed slower growing, less cell dense masses lacking GFP+ cells and with limited proliferative (Ki67+) cells (Fig. S2A–C). Staining with GBM related markers including Gfap, Olig2, Pdgfrα, Nestin, NeuN, and Ki67 revealed enhanced expression and typical cellular heterogeneity in tumors derived from GFP+ cells (Fig. S2D), similar to that observed in spontaneous GBM harboring the same mutations (Alcantara Llaguno et al., 2009; Alcantara Llaguno et al., 2019; Zhu et al., 2005). To assess in vivo self-renewal, GBM cells were harvested from the primary allografts and subjected to secondary orthotopic transplantation (Fig. 2B). One or four thousand freshly sorted GBM cells harvested from the original GFP+ cell allograft tumors, or from the GFP− allograft tumors were re-implanted into recipient mouse brains. All GFP+ secondary transplants showed rapid tumor formation and mortality. In striking contrast, secondary GFP− implantations uniformly failed to form tumors reflecting the exhausted proliferative and self-renewing potential of once transplanted GFP− tumor cells (Fig. 2B). To account for variable non-tumor cell contamination in the GFP− sorted cells, four-fold excess GFP− cells were used for transplantation experiments (Fig. 2A–B).
Figure 2. Quiescent GFP+ GBM cancer stem cells accelerate tumor initiation and serial transplantation.

(A) Survival curves of passage 1 (P1) mice transplanted with 1000 (GFP+: light green; GFP−: light blue) or 4000 (GFP+: dark green; GFP−: dark blue) cells isolated from spontaneous (P0) CGD tumors. (B) Survival curves of Passage 2 (P2) mice transplanted with 1000 (red) or 4000 (green) GFP+ P1 tumor cells versus 4000 GFP− P1 tumor cells. P values in A and B were calculated with Log-rank (Mantel-Cox) test. (C-F) Immunofluorescence (IF) images of (C) a spontaneous mouse GBM, (D) a primary GFP+ cell transplanted GBM, (E) a secondary GFP+ cell transplanted GBM, and (F) a tertiary GFP+ cell transplanted GBM. GFP+ cells are rare and remain Ki67− throughout the serial transplantations. Scale bar: 20μm.
We further examined the ability of GFP+ GBM cells to sustain tumor formation following successive transplantations. Ten thousand sorted quiescent GFP+ spontaneous GBM cells (P0; Fig. 2C) were implanted into primary recipient mouse brains (P1; Fig. 2D). When the recipients showed symptoms, the tumor was dissected and sorted for GFP+ cells that were again implanted into a second recipient (P2; Fig. 2E). Following tumor formation, GFP+ GBM cells were again sorted and re-allografted (P3; Fig. 2F). When P3 mice became symptomatic the experiment was terminated and all tumors (P0-P3) were analyzed (Fig. 2C–F). In each subsequent transplantation the engrafted tumors showed reconstitution of heterogeneity including persistence of quiescent GFP+ cells separated from Ki67+ proliferative cells. Thus both in vitro and in vivo, CGD labeled GFP+ GBM cells exhibit all functional characteristics of CSC while the GFP− tumor population has limited tumor initiation capacity reflective of the constrained growth and self-renewal capacity of the constituent proliferating (Ki67+;GFP−) cells. We also assessed the effect of diphtheria toxin targeted ablation of CGD transgene expressing GFP+ cells in allograft tumors seeded with ten thousand unsorted GBM cells. Intracranial delivery of a single dose of the toxin two weeks post implantation significantly prolonged survival, eradicated GFP+ GBM cells, and diminished proliferative Ki67+ cells (Fig. S2E–H). In sum, these data provide conclusive evidence that spontaneous mouse GBM harboring the CGD transgene, contain a relatively minor quiescent GFP+ tumor cell cohort that displays unique and striking functional CSC properties including tumor initiation and self-renewal in vivo that are absent in the remaining majority of GBM cells.
For transcriptional analysis, core tumor regions of eight spontaneous GBM samples were collected. GFP+ CSC and GFP− mixed cell populations (including tumor and non-tumor components) were sorted and subjected to RNA-Seq (Fig. S3A–B). After removal of one outlier tumor sample based on batch effect analysis, among the seven remaining tumors, 72% variance was consolidated into principal component 1 with GFP+ and GFP− cells clearly forming two clusters (Fig. 3A). Differentially expressed gene expression (DEG) analysis illustrated by volcano plot identified 728 genes selectively enriched in the GFP+ murine CSC samples (Fig. 3B, Table S1A). Gene set enrichment analysis (GSEA) identified several biological processes significantly (FDR<0.05) correlated with GFP+ cells including cilium and astrocytic related expression, two features commonly associated with NSC (Fig. S3C–D) (Alvarez-Satta et al., 2019; Doetsch et al., 1999).
Figure 3. Murine GBM cancer stem cell signature enrichment in unsupervised human GBM clusters.

(A) Principal component (PC) analysis of RNA sequencing from GFP+ CSC and GFP− cells sorted from seven spontaneous CGD-GBM illustrates segregation of two transcriptional cohorts. (B) Volcano plot summarizes differentially expressed genes (DEG) between GFP+ CSC and GFP− cells from seven tumors. Some DEG including CGD transgene and various stem cell related genes are highlighted. (C-F) tSNE projections of integrated 8 PDX dataset. (C) Individual PDX samples shown in different colors (T =PDX tumor) illustrate equivalent cell distribution for each tumor. (D) tSNE of unsupervised gene expression clustering depicts 6 clusters colored randomly. (E) Green colored cells surpass the AUCell threshold for enrichment of the murine CSC signature with all other cells in grey (see Methods). (F) Integrated tumor cells enriched for the mouse CSC signature (integrated GSSC; green), mitotic (P-M; red), S-phase (P-S; red) signatures, oligodendrocyte signature (cluster 1; blue), and neuron signature (cluster 5; purple). (G) Heatmaps of 8 PDX integrated dataset by clusters, showing enrichment of the mitotic (M; red) and S-phase (S; red) signatures (see Methods) in the proliferative clusters P. Rows indicate genes, columns indicate clusters, and the scale of the heatmaps are at the top right. The columns are arranged in a dendrogram according to clustering by similarity, indicating the two P clusters are distinct, proliferative groups. G is the integrated GSSC cluster. See also Figure S3.
CSC signature marks selective pre-aggregated human GBM single cell clusters
To explore whether the mouse GBM 728 gene CSC signature was conserved in human GBM, the mouse to human gene conversion tool (R package homologene::mouse2human) (https://www.ncbi.nlm.nih.gov/homologene) was applied and 566 human gene ortholog designations were acquired (Table S1B). For this analysis, eight independent IDH wildtype GBM patient derived orthotopic xenografts (PDX T1-T8; see Table S2 and Methods) harboring diverse somatic mutations and representative of all TCGA GBM classifications were selected for single cell RNA sequencing (scRNA-Seq). All PDX samples represented early passage tumors generated from GBM freshly resected prior to patient therapy and established directly into orthotopic engraftment without exposure to growth factors or undergoing cell culture (Table S2A). After mouse cell removal, the transcriptomes of four to seven thousand single tumor cells were sequenced per sample (Table S2B). In total, 30,680 human GBM cells were sequenced and integrated into one dataset by application of the Seurat multi-canonical correlation analysis (MultiCCA) strategy that corrects for batch effects (Butler et al., 2018). This integration followed by unsupervised clustering was depicted as six identifiable cell clusters on a tSNE plot and all eight tumors were well represented within each cluster (Fig. 3C–D).
Each cell was then probed for expression of the murine to human CSC 566 gene signature (AUCell, see Methods), and only one of the six unsupervised clusters exhibited specific enrichment and was termed integrated GSSC (glioblastoma stem cell signature cluster) (Fig. 3E–F & S3E). Heatmaps for proliferating (mitosis plus S-phase) gene signatures identified two separate respective cell clusters named integrated P (proliferative cell clusters) that did not coincide with the GSSC group (Whitfield et al., 2002) (Fig. 3F–G). The integrated GSSC cluster accounted for 11.6% amongst the thirty thousand sequenced cells and contained contributions from each of the eight PDX tumors sequenced (Fig. S3F–G, see Table S2B and Methods). Further, differentially expressed gene (DEG) analysis identified genes enriched in each cluster (Fig. S3H, Table S3A–B). AUCell analyses with known signatures for different brain cell types identified cluster 1 as related to oligodendrocytic lineage GBM cells, cluster 5 as related to neuronal lineage cells, while cluster 0 showed no obvious lineage relationship (Fig. S3I–J, Table S3C)(Zhang et al., 2014). Thus, application of the functional murine GBM-CSC signature identifies a putative cognate human GBM CSC population that is unified (pre-clustered; integrated GSSC) on the basis of transcriptional cohesion. For each individual tumor of the eight sampled, we determined the identity of each integrated GSSC cell, divulged their locations within unsupervised clusters as illustrated by tSNE maps formed by single tumor analysis, and found them to be concentrated within one to three distinct non-proliferative clusters (Fig. 4A, right panels). When each individual PDX tumor was probed on a per cell basis for enrichment of the converted murine 566 gene CSC signature (AUCell, see Methods; Table S1B), unique individual GSSC clusters were also identified (Fig. 4A–B). In each case, the single PDX GSSC group coincided substantially with the subset of tumor cells that contributed to the integrated GSSC cluster (Fig. 4A, middle and right panels), demonstrating reproducible clustering. Heatmaps of the individual PDX datasets probed with the proliferative gene signature identified one to three separate clusters, distinct from the GSSC clusters, named “P” groups (proliferative, Fig. S4A). Thus, the GSSC GBM cell group designation is conserved as a quiescent, transcriptionally defined unit across genetically diverse individual GBM.
Figure 4. Human PDX unsupervised cell clustering reveals pre-clustered cells enriched for the murine GFP+ CSC signature.

(A) Each triptych panel indicates one individual tumor. Within each panel on the left is the tSNE projection with randomly assigned colors to each cluster. The middle panel is colored by cell type designation (see Methods, green = GSSC, red = P, grey = others). Right panel is the same tSNE map highlighting in green the cells present within the integrated GSSC group of the integrated 8 PDX dataset for that specific tumor. (B) Violin plots for 8 individual PDX tumors depicting the AUCell enrichment scores for the murine CSC signature by cell clusters. The black horizontal bars indicate mean values. (green = GSSC, red = P, grey = others). See also Figure S4.
We next examined the designated GBM GSSC cluster cells for expression of genes associated with stemness. An adult murine quiescent NSC transcriptional signature (Xie et al., 2020) (Table S3C) was used to query on a per cell basis the integrated PDX single cell data (AUCell). Greatest enrichment was found within the integrated GSSC group (Fig. S4B). In contrast, a transcriptional signature derived from adult proliferating neural progenitors distinguished the proliferative cell clusters (P) but not the GSSC cluster (Fig. S4C, Table S3C). Additionally, independently reported stem cell signatures for embryonic human radial glial stem cells (Pollen et al., 2015) and common quiescent stem cells (Cheung and Rando, 2013) were found to be enriched in the integrated GSSC group (Fig. S4D–E, Table S3C). Thus, stem cell but not progenitor signatures are enriched in the integrated GSSC group of human GBM cells.
Human CSC signature includes the F3 transmembrane receptor gene
Differential gene expression analysis of the 566 gene signature GSSC cluster cells yielded a condensed 118-gene human transcriptional signature present within each of the eight individual PDX tumors (118-GS signature, Table S3C, Methods). This 118-GS signature includes many neural stem cell associated transcription factors including SOX2, ZFP36L1, ID2, ID3, ID4, and the NOTCH pathway genes HES1, HES4, HES5 (Lasorella et al., 2014; Rajakulendran et al., 2019; Suva et al., 2014; Weng et al., 2019). We surveyed the 118-GS signature to identify DEG encoding extracellular receptors that might serve for prospective FACS mediated enrichment of the 118-GS cluster cells from patient derived GBM. Three candidate receptor genes, F3, CD44, and EDNRB, were found enriched in this cluster (Fig. S5A). Among them, only F3 receptor expression was present in stem cell and GBM CSC related signatures, including the murine GBM CSC signature, the murine SVZ NSC signature, and a human radial glial stem cell signature (Fig. S5B; Pollen et al., 2015). Furthermore, when the eight individual GBM PDX single cell datasets were probed for expression of F3 receptor mRNA versus KI67 mRNA, as represented in Figure 5A–A11 violin plots, all eight samples showed enriched F3 expression in the GSSC and Ki67 in the proliferative clusters respectively (Figure S5C–C1). To extend the validity and generality of mRNA expression to F3 and KI67 protein expression, six independent GBM PDX tumors (T1, T2, T3, T5, T7, T8) were subjected to immunohistochemical analysis and the data demonstrate that for each tumor, F3 specific antibodies stain rare noncycling tumor cells that are distinct from proliferating (KI67+) cells (Fig. 5B–B11; and Table S4A). Quantification for the average of additional ten (13 primary and 3 recurrent GBM in total) samples confirmed the results (Fig. S5D–D1 & Table S4A–C).
Figure 5. F3 mRNA and protein expression identify quiescent GBM PDX CSC.

(A-A11) Three representative, of eight examined, GBM PDX unsupervised cell cluster violin plots depicting elevated F3 receptor gene expression in GS designated cell clusters (top) and KI67 mRNA in the proliferative clusters (bottom). Horizontal black bars indicate mean values. (B-B11) Tumor sections from same three representative PDX, of sixteen total examined, illustrate F3 protein expression mutually exclusive from KI67+ cells in GBM PDX. DAPI staining shown in grey (right panels). White arrowheads indicate F3+ cells. White circles highlight proliferative KI67+ cells. Far right shows quantitation for F3+/KI67− (F+K−); F3−/KI67+ (F−K+); and F3+/KI67+ (F+K+) GBM cells. Mean ± SEM, n=6 sections, Scale bars: 40μm. (C) qRT-PCR measurements validate enrichment of 118-human GS signature genes F3, TIMP3, ID3, APOE, and EDNRB in F3+ sorted PDX cells (see also Fig. S5B–B1). n=2 technical replicates for each group. (D-G) Representative images and statistical analyses of (D-E) doublet formation assays for F3 sorted cells; and (F-G) sphere formation assays enhanced in F3+ fraction, while depleted for F3− cells. Red circles highlight doublets in D and spheres in F. Enlarged insets demonstrate spheres only in F3+ fraction. Doublets are shown when no spheres could be identified. **P<0.01, ****P<0.0001. Mean ± SEM, n = 5 technical replicates, Scale bars: 100μm. (H) Limiting dilution transplants with primary F3 antibody sorted PDX cells illustrates enhanced tumor formation in F3+ cell fraction. N/A: not available. (I) Survival curves of primary transplants with either 2000 or 4000 cells exhibit significantly worse outcomes with F3+ sorted GBM cell transplants as compared to F3− cells. (J) Survival curves show accelerated mortality for recipients of F3+ secondary transplants and no survival defect in recipients of F3− secondary transplants. (K) Representative magnetic resonance imaging (MRI) of whole mouse brains at day 97 post-secondary orthotopic transplantation in panel C depict no tumors in F3− secondary transplants while F3+ transplants uniformly exhibit large invasive tumors. Ratios in parenthesis indicate fraction of detected tumors. (L) Principal component analysis of bulk RNAseq data illustrates two cohorts of tumor cells formed by F3+ cancer stem cells and F3− GBM cells sorted from four and six PDX samples respectively. (M) Volcano plot summarizes DEG between F3+ and F3− cells. Examples of CSC DEG including F3 are highlighted. See also Figure S5.
F3 antibody was next used for sorting of GBM cells (Fig. S5E) and F3 positive cell fractions were examined for expression of CSC representative genes and for functional stem-like properties in primary culture. Sorted cells from three independent PDX samples were subjected to RT-PCR for representative CSC signature genes. In all cases, the F3+ fraction enriched all CSC genes tested including F3, TIMP3, ID3, APOE, and EDNRB (Fig. 5C; Fig. S5F–F1 & Table S3C). Next low-density doublet and sphere formation assays were performed to verify self-renewal as previously demonstrated for murine CSC (Fig. S1D–F). By close analogy to GFP+ murine CSC, freshly dissected quiescent F3+ human GBM cells produced the most and largest tumor spheres in three representative PDX samples compared to the F3− fraction or to mixed DAPI− cultures (Fig. 5D–G & Fig. S5G–G1, see Table S2A & Methods). Thus, unsorted dissociated human GBM cell sphere formation is driven by the minority F3+ tumor cell population. In aggregate, these data demonstrate that F3+ GBM cells adhere to the hallmarks of CSC in culture while the F3 negative tumor cell population lacks these properties. We also evaluated TCGA data for F3 expression and identified that increasing F3 mRNA levels correlated with shortened survival from time of diagnosis (p<0.0001, median survival difference = 3.9 months, Fig. S5H).
Quiescent in vivo human GBM cancer stem cells
We next turned to more relevant in vivo assays to assess the relative tumor formation potential of freshly sorted F3+ versus F3− GBM cells from PDX samples (see Methods). Multiple assays consistently demonstrated the unique tumorigenic potency of F3+ GBM cells. Serial dilution of sorted tumor cells for transplantation demonstrated that F3+ sorted GBM cells retain full tumor formation potential as the transplanted cell number is reduced from 4000 to 100, while F3− GBM cells show increasingly impaired tumor formation beginning with the first dilution to 2000 tumor cells (Fig. 5H). In a second assay, mice were orthotopically transplanted with either 4000 F3+ or F3− GBM cells and aged. Figure 5I illustrates that F3+ tumor cells resulted in significantly increased and accelerated mortality. F3+ versus F3− magnetic resonance imaging (MRI) studies at day 60 showed all F3+ cell recipient mice already exhibited classic enhancing GBM lesions at the site of injection (Fig. S5I) that greatly expanded by day 78 (Fig. S5J). In contrast, F3− tumor cell transplantation recipients uniformly showed no MRI signal at day 60 and comparatively reduced enhancement by day 78, reflecting lagging residual tumor development at the site of injection. We next re-transplanted passage one residual tumor cells derived from F3− cell injected GBM (F3−/F3− cells) and these cells showed no tumor initiation capability and no recipient mortality (Fig. 5J–K). In contrast, F3+ cells derived from passage one F3+ cell injected GBM (F3+/F3+ cells) exhibited enhanced tumor development and mortality (Fig. 5J–K). In aggregate, these data demonstrate that antibodies against the F3 protein which marks quiescent cells in GBM tumor sections and is enriched in CSC mRNA signatures, effectively distinguishes a limited fraction of human GBM cells that rarely cycle in vivo but have greatly increased potential to initiate tumors over successive passages and in vitro have enhanced self-renewal capabilities. These data are entirely consistent with those observed for mouse GFP+ GBM CSC (Figs. 1; S1; 2; & S2). In contrast, F3− GBM cells, like murine GFP− cells, lack sphere and tumor formation potential.
We next performed RNA sequencing of freshly sorted F3+ and F3− GBM PDX cells and principle component analysis depicts two distinct cohorts (Fig. 5L). DEG analysis, illustrated by volcano plot, revealed 2305 differentially expressed genes in the F3+ CSC population, including all the GS-signature genes used for qRT-PCR (Fig. 5M, Table S5). GSEA analysis demonstrated enrichment of embryonic stem cell (ESC), AKT, and WNT signaling pathways in the F3+ compartment (Fig. S5K–M), all of which are associated with stem cell biology. Thus, entirely consistent with the mouse CSC assays, among human GBM cells, F3+ CSC enrich for the capacity to serially passage GBM, to retain GBM forming potential upon limiting dilution, and to exhibit stem-like transcriptional profiles.
Independent evaluation of the quiescent human GBM CSC gene signature
To further investigate the generality of our findings, we turned to two recent large GBM single cell sequencing studies (Neftel et al., 2019; Yuan et al., 2018). Neftel et al., reported deep single cell sequencing of over twenty primary GBM at an average of 256 cells per tumor. We integrated data for analysis from twenty adult IDH wild type GBM samples from that study, representing all TCGA GBM classifications (Stuart et al., 2019) (Fig. 6A; 4,458 neoplastic cells). The 118-GS signature was found enriched in a single unsupervised cell cluster (cluster 2 in Fig. 6B) distinct from the proliferative P (M+S phase) signature enriched clusters (clusters 5, 7, 8, in Fig. 6B & Fig. 6C–F, see DEG in Table S6A–B) and the average contribution of the GS cluster was 16.2% with a majority of individual tumor representation ranging from 6% to 26% (Table S6C). Notably, all tumors are represented in the 118-GS signature enriched unsupervised cell cluster (Fig. 6A & Table S6C). We further probed the 20 GBM single cell data for F3 receptor and KI67 mRNA expression. The results demonstrate F3 transcript enrichment in the 118-GS signature cluster (cluster 2) versus KI67 enrichment in proliferative clusters 5, 7, and 8 (Fig. 6G–H), further demonstrating the utility of the 118-GS signature in identifying quiescent CSC and consolidating the generality of F3 association.
Figure 6. The 118-GS signature is enriched in non-proliferative primary GBM unsupervised cell clusters.

(A) Seurat v.3 tSNE depiction of the single cell sequencing data from 20 adult GBM described in Neftel et al., 2019. Each individual tumor cell is represented by a distinct color emphasizing the equivalent distribution throughout the projection. (B) Unsupervised clustering of data in (A) results in segregation of GBM cells into seven distinct clusters that contain representation from each of the 20 GBM. Three wild-type cell clusters were not included. (C) The data in (A) and (B) probed with the conserved 118-GS signature enriches only in cluster 2. (D) tSNE illustration of quiescent (GS) and proliferative cell clusters (P) in (A-C). (E) Heatmaps of the same data with mitotic and S-phase signatures identify clusters 5, 7, & 8 as proliferative. Scales are located at the top left. (F) Pie chart depicts relative proportions of cells enriched for the 118-GS signature (GS, green), proliferative signatures (P, red), and others (grey) in the integrated 20 GBM. (G-H) Violin plots depicting elevated (G) F3 receptor gene expression in GS cell clusters and (H) KI67 mRNA in the proliferative clusters. Horizontal black bars indicate mean values.
In a second study, Yuan et al. generated single cell RNA sequencing data from four primary and two recurrent GBM (Yuan et al., 2018). Analysis of unsupervised clusters for both the primary and recurrent sample data also identified specific cell clusters enriched for the conserved 118-GS signature distinct from the proliferative clusters (Fig. S6A–E1 for primary GBM; Fig. S6F–J1 for recurrent GBM; Table S3C; and Methods). Again, F3 mRNA expression was enriched in the 118-GS signature clusters while KI67 mRNA was enriched in the proliferative clusters (Fig. S6E–E1; & J–J1). In sum these analyses of independently derived GBM single cell data obtained using different technologies demonstrate that diverse human GBM samples (34 in total) contain specific transcriptionally related cell clusters enriched for the quiescent 118-GS signature. Moreover, analysis of the recurrent GBM data indicates that this cell identity is stable and persists following chemotherapy and recurrence (Fig. S6F).
Quiescent CSC evade chemotherapy and become activated
GBM invariably recurs following current standard of care chemotherapy. We examined the status of F3+ GBM CSC following treatment with the DNA alkylating agent temozolomide (TMZ). Following orthotopic transplantation of the same patient derived GBM into independent recipient mice, tumor development was verified and monitored by MRI and mice were grouped randomly for treatment (Fig. S7A–B). Upon completion of the TMZ treatment schedule, mice were sacrificed for tumor analysis (Fig. S7C–D). Tumor cells were counted and TMZ treated GBM samples demonstrated reduced cell numbers (Fig. S7D). Tumor section immunofluorescence further demonstrated the effects of chemotherapy including depletion of tumor cells reflected by sparse DAPI staining and increased cell death as assayed by cleaved caspase-3 (CC3) staining (Fig. 7A–B). The F3+ (GBM CSC) tumor cell population was found elevated in TMZ treated tumors compared to the DMSO group as assayed by FACS (Fig. S7E). qRT-PCR analysis of tumor cells following TMZ treatment showed F3+ cell specific retention of CSC gene profiles (Fig. S7F). These data demonstrate that TMZ effectively targets a substantial number of tumor cells including cycling cells while sparing the quiescent CSC population in human GBM.
Figure 7. Tumor cell dynamics following Temozolomide treatment.

(A-B) Representative IF images of (A) DMSO or (B) TMZ treated mouse brain sections indicate depletion of bulk tumor cells (DAPI) and increased cleaved caspase-3+ (white arrow heads). Scale bar: 40μm. (C-G) tSNE projections of integrated datasets from three tumor samples derived from same patient PDX: two PDX underwent TMZ treatment, and one was untreated. (C) tSNE projection illustrates superimposed individual PDX samples shown in different colors. (D) tSNE of unsupervised gene expression clustering depicts 8 independently colored cell clusters. (E) tSNE depicts in green the cells that surpass the AUCell threshold for enrichment for the 118-GS signature (clusters 0, 2, & 8) with all other cells in grey. Note novel cluster 8 enrichment (see Methods); (F) tSNE depicts in red the cells that surpass the AUCell threshold for enrichment for the S-phase signature (clusters 1 & 6) with all other cells in grey. Note novel cluster 8 enrichment; (G) tSNE depicts integrated tumor cells enriched for the 118-GS (green), mitotic and S-phase (red), Neuron (purple), and Oligodendrocyte (blue) signatures, together with a novel population (cluster 8) enriched for both signatures (orange, P-GS). (H) Table illustrates distribution of 3 GBM samples in each of the unsupervised clusters. Note that in TMZ-treated tumors, all GS and proliferative clusters are elevated (shaded green, orange, and red). The novel P-GS cell population increases >10-fold in TMZ treated samples (shaded orange). GS Sum is the sum of all clusters enriched for the 118-GS signature. P-GS 8 is cluster 8 that has enrichment of both GS and proliferative signatures. P Sum is the sum of all clusters enriched for proliferative signature. (I) Heatmap of 10 DEG for each cell cluster from the 3-sample integrated dataset showing enrichment of CSC genes in both Q-GS and P-GS clusters (white dashed square), and proliferative genes in P-GS, P-M, and P-S clusters (yellow dashed square, see Methods). Rows indicate genes, columns indicate cell clusters. Scale is located at the top right. Selected genes are indicated. See also Figure S7.
To gain a better understanding of the overall effect of TMZ treatment on quiescent GBM CSC, 2000 F3+ tumor cells sorted from a low passage PDX were transplanted into recipient mice and treated with TMZ following tumor development (see Methods). Upon completion of chemotherapy, GBM samples were subjected to 10X single cell sequencing, and the data from the untreated sample and treated samples were merged. Unsupervised cell cluster analysis demonstrated an expansion of the quiescent GS-118 signature cell clusters (clusters 0 & 2), independent proliferative P clusters (clusters 1 & 6), as well as other tumor cell clusters that appeared in the control tumor (clusters 3, 4, & 7; Fig. 7C–F). These results further manifest the multi-lineage potential of quiescent F3+ cells to generate the complexity of single cell unsupervised clusters. A unique tumor cell cluster (cluster 8) emerged only within the chemotherapy treated tumors, which surprisingly showed enrichment for both the quiescent CSC signature and the proliferative signature (cluster P-GS, Fig. 7C–G). This dual signature cell population was not previously observed among the other 34 untreated GBM samples analyzed by scRNA-seq (Fig. 3F, 4A, 6D, S6A & F). Thus, the unique cell P-GS cluster 8 designates a group of CSC cells that in response to chemotherapy, exhibit concerted transition from quiescence to a proliferative state (Fig. 7G–H). Additional DEG analysis verified expression of mitotic genes in this P-GS population, which are typically absent in GS cells (Fig. 7I, Table S7A–B). Thus, TMZ chemotherapy spares quiescent CSC and promotes rapid activation and expansion of quiescent GS clusters through trancription of cell cycle and other proliferation genes.
Discussion
The existence of functional cell hierarchy in GBM has been illustrated in both mouse models and human samples by limiting dilution studies both in vitro and in vivo, by lineage studies, and most recently, by bar-coding lineage tracing experiments (Chen et al., 2012a; Lan et al., 2017; Singh et al., 2004). Additional computationally dominated studies using single cell sequencing have validated GBM heterogeneity. A comprehensive computational study of primary GBM samples concluded that among GBM cells four transcriptionally discernible states exist that can in principle interconvert suggesting a plasticity model rather than hierarchical organization (Neftel et al., 2019; Suva and Tirosh, 2020). The existence of fluid transcriptional cell states may explain much about GBM heterogeneity as influenced by many factors including evolving mutational status and microenvironmental forces. It is noteworthy that each of the four reported transcriptional states examined in that study contain proliferating cells as defined by expression of mitotic and cell cycle genes. Thus, the Neftel plastic transcriptional states must hover and transition independent of associated proliferative gene expression in a subset of cells. Given that our 118-GS quiescent CSC signature is conserved across all human GBM scRNA-seq datasets examined, it appears that just as for the proliferating cell cohort, the quiescent CSC signature and functional state defined here also remains stable and independent of the unrelated transcriptional signatures that identify fluctuating transitional expression states (Neftel et al., 2019; Suva and Tirosh, 2020). Each of our single cell expression analyses identified multiple GBM cell clusters in addition to the quiescent CSC and proliferative ones. This unsurprising manifestation of tumor heterogeneity may identify additional tumor cell states that align with the preceding studies.
Another recent computationally based large scale GBM scRNA-seq investigation predicted, on the basis of gene expression profiles, that tumor hierarchy could be identified but the apical cancer stem cells were defined by proliferative progenitor transcriptional profiles and were designated as responsible for GBM chemoresistance and tumor growth (Couturier et al., 2020). Thus, even with consensus on the existence of cell hierarchy in GBM, the precise nature and properties of the cancer stem cells at the apex have remained beyond direct study. Their detection has instead remained largely reliant on computational inference and surrogate assays.
The present study provides biological and molecular tools that allow direct discovery, isolation, and examination of quiescent GBM CSC both in mice and patient samples. The mouse and human GBM CSC gene expression signatures reliably identify unique transcriptionally related cohorts of quiescent cells in all tumor data sets examined. Both the F3 receptor mRNA and protein are enriched in these cells while absent in the proliferative GBM cell clusters. Although we view the 118-GS signature as a more definitive CSC identifier, the demonstration of unique F3 protein enrichment in quiescent cells in sixteen independent GBM tumors including recurrent samples, underscores the utility of this tool and allowed for isolation of CSC directly from multiple tumors. Core GBM functional CSC properties were well conserved between the genetically engineered spontaneous mouse models and a large cohort of genetically diverse PDX samples. First, the ability to examine CSC directly in multiple tumors from both species by IHC and in fresh isolation, demonstrated their in vivo quiescence and a tight association with a stem-like transcriptional signature. Second, effective enrichment of the CSC away from the remaining tumor cells demonstrated that only the CSC population could effectively form spheres and indefinitely seed new tumors. Third, RNAseq comparison ascribed clear enriched expression of neural stem cell associated genes to the CSC population. Fourth, F3+ sorted cells reconstitute complex single cell transcription tumor heterogeneity including the quiescent GS-118 cluster. Finally, quiescent GBM CSC are resistant to chemotherapy and instead become activated to re-enter the cell cycle and promote tumor growth.
The F3 gene encodes coagulation factor III (CD142; Tissue Factor), a cell surface glycoprotein that functions as the high-affinity receptor for coagulation factor VII (Bogdanov et al., 2003). One study has associated a small fraction of adipocyte lineage progenitors that are CD142+;SCA1+ as exerting a negatively modulatory function on adipogenesis in mouse and human adipose tissue (Schwalie et al., 2018). Another study demonstrated a role in osteosarcoma metastasis (Morrow et al., 2018). Further, analysis of TCGA cancer transcriptome data indicates that high F3 expression has adverse outcomes in many cancers (Unruh and Horbinski, 2020). Thus, as in this study, the F3 protein is found expressed outside the vascular system and may exert functions beyond the coagulation cascade in stem-like and cancer cell populations.
A series of functional screens have been conducted on cultured heterogenous GBM tumor spheres that are often referred to as “glioma stem cells”. Such CRISPR-Cas9 screens have identified genes required for sphere growth and genes that conferred growth fitness (MacLeod et al., 2019; Richards et al., 2021; Toledo et al., 2015). Among our 118-GS signature genes, two fitness genes were coincident DDX17 (Toledo et al., 2015) and SOX2 (Richards et al., 2021).
Quiescent GBM CSC conservation between mouse and among genetically diverse human tumors with different driver mutations will allow for continued prospective isolation and further detailed study. These data also emphasize the conceptual insufficiency of conventional anti-mitotic therapies in GBM and reinforce the need for development of strategies to additionally target quiescent CSC. The discovery of activated CSC upon chemotherapeutic treatment in vivo provides an unprecedented opportunity to investigate their unique features and self-renewal mechanisms in ongoing efforts to find a cure for GBM.
Limitations of study
The utility of large-scale bulk and single cell RNA sequencing technology to query whole tumor tissues for a comprehensive view of different cell types was invaluable in our quest to identify and isolate quiescent glioblastoma stem cells. However, the breadth of tumor diversity is not fully probed in this study. Cancer stem cell populations may have signature variance upon further tumor stratification (Wang et al., 2020). Thus, F3 may not be the ideal tool for CSC identification in every single tumor and moreover whether F3 has direct functional relevance to the CSC remains unclear and awaits further investigation.
STAR METHODS
RESOURCE AVAILABILITY
Lead contact
Further information and requests for resources and reagents should be directed to and will be fulfilled by the Lead Contact, Luis F. Parada (paradal@mskcc.org).
Materials availability
Reagents generated in this study will be made available on request, but we may require a payment and/or a completed Materials Transfer Agreement if there is potential for commercial application.
Data and code availability
All RNA-seq data has been deposited at GEO and will be publicly available as of the date of publication. Accession numbers are listed in the key resources table.
All original code has been deposited at Dataverse and is publicly available as of the date of publication. DOIs are listed in the key resources table.
Any additional information required to reanalyze the data reported in this paper is available from the lead contact upon request.
Key resources table.
| REAGENT or RESOURCE | SOURCE | IDENTIFIER |
|---|---|---|
| Antibodies | ||
| Rabbit anti-Pdgfra | Santa Cruz | Cat#: sc-338; RRID: AB_631064 |
| Goat anti-Nestin | Santa Cruz | Cat#: sc-21248; RRID: AB_2148925 |
| Rabbit anti-Fa2h | Proteintech | Cat#: 15452-1-AP; RRID: AB_2101886 |
| Rabbit anti-Olig2 | Millipore | Cat#: Ab9610; RRID: AB_570666 |
| Rabbit anti-Gfap | Cell Signaling | Cat#: 12389T; RRID: AB_2631098 |
| Rabbit anti-KI67 | Novus | Cat# NB500-170; RRID:AB_1000197 |
| Mouse anti-TF(F3)(H-9) | Santa Cruz | Cat#: sc-374441; RRID: AB_11008609 |
| Mouse anti-CD142(F3) - FITC | Miltenyi Biotec | Cat# 130-098-854, RRID: AB_2655127 |
| Rabbit anti-Cleaved Caspase-3 (Asp175) | Cell Signaling | Cat# 9661, RRID: AB_2341188 |
| Chemicals, Peptides, and Recombinant Proteins | ||
| Tamoxifen | Sigma | Cat#: T5648 |
| EGF | Fisher Scientific | Cat#: PHG0311 |
| bFGF | Gemini | Cat#: 300-113P 50ug |
| iScript cDNA synthesis kit | Biorad | Cat#: 1708890 |
| RNeasy Extraction Kit | Qiagen | Cat#: 74104 |
| Deposited Data | ||
| Neftel et.al., dataset | https://pubmed.ncbi.nlm.nih.gov/31327527/ | |
| Yuan et.al., dataset | https://pubmed.ncbi.nlm.nih.gov/30041684/ | |
| TCGA GBM RNAseq and microarray dataset | Cbioportal: https://www.cbioportal.org | GBM (TCGA 2003) |
| RNA sequencing data generated in this study | This paper | GEO: GSE190129 |
| Codes for 8 PDX data analysis | This paper | https://doi.org/10.7910/DVN/J5MVOR |
| Codes for Neftel et al., data analysis | This paper | https://doi.org/10.7910/DVN/FODWRV |
| Codes for 4 primary GBM data analysis from Yuan et al., | This paper | https://doi.org/10.7910/DVN/SYP8LH |
| Codes for 2 recurrent GBM data analysis from Yuan et al., | This paper | https://doi.org/10.7910/DVN/JXVB7R |
| Experimental Models: human GBM PDX Lines | ||
| PDX180327-1; GBM patient-derived primary tumor xenografts | Established at MSKCC (Brain Tumor Center) | N/A |
| PDX180518-1; GBM patient-derived primary tumor xenografts | Established at MSKCC (Brain Tumor Center) | N/A |
| PDX170911-1; GBM patient-derived primary tumor xenografts | Established at MSKCC (Brain Tumor Center) | N/A |
| PDX160830-1; GBM patient-derived primary tumor xenografts | Established at MSKCC (Brain Tumor Center) | N/A |
| PDX180709-1; GBM patient-derived primary tumor xenografts | Established at MSKCC (Brain Tumor Center) | N/A |
| PDX180911-1; GBM patient-derived primary tumor xenografts | Established at MSKCC (Brain Tumor Center) | N/A |
| PDX160810-1; GBM patient-derived primary tumor xenografts | Established at MSKCC (Brain Tumor Center) | N/A |
| PDX161129-2; GBM patient-derived primary tumor xenografts | Established at MSKCC (Brain Tumor Center) | N/A |
| Experimental Models: Organisms/Strains | ||
| CGD | https://pubmed.ncbi.nlm.nih.gov/33229571/ | N/A |
| Nf1 flox | https://pubmed.ncbi.nlm.nih.gov/11297510/ | N/A |
| Trp53 flox | https://pubmed.ncbi.nlm.nih.gov/15150107/ | N/A |
| Pten flox | https://pubmed.ncbi.nlm.nih.gov/11691952/ | N/A |
| Oligonucleotides | ||
| GAPDH-Forward: TTTGGCTACAGCAACAGGGT | Eton Bioscience | N/A |
| GAPDH-Reverse: CCAGCAGTGAGGGTCTCTCT | Eton Bioscience | N/A |
| F3-Forward: GGAAGAGTACAGACAGCCCG | Eton Bioscience | N/A |
| F3- Reverse: ACCACAAATACCACAGCTCCA | Eton Bioscience | N/A |
| TIMP3-Forward: GGCACGCTGGTCTACACC | Eton Bioscience | N/A |
| TIMP3-Reverse: TGGTACTTGTTGACCTCCAGC | Eton Bioscience | N/A |
| ID3-Forward: GGCTAAGCTGAGTGCCTCTC | Eton Bioscience | N/A |
| ID3-Reverse: AGCTTGCTGGACGACATGAA | Eton Bioscience | N/A |
| APOE-Forward: TTTGGGATTACCTGCGCTGG | Eton Bioscience | N/A |
| APOE-Reverse: TCATGGTCTCGTCCATCAGC | Eton Bioscience | N/A |
| EDNRB-Forward: TCAGTGAAGCCATGTTGATACCA | Eton Bioscience | N/A |
| EDNRB-Reverse: TGGTCCTTGTCTTTGCCCTC | Eton Bioscience | N/A |
| KI67-Forward: ACCAAGCTTTGTGCCTTCAC | Eton Bioscience | N/A |
| KI67-Reverse: AATGCACACTCCACCTGTCC | Eton Bioscience | N/A |
| Software and Algorithms | ||
| GraphPad Prism v.7 | www.graphpad.com | RRID: SCR_002798 |
| Image J | www.imagej.net | RRID: SCR_003070 |
| cBioPortal | www.cBioPortal.org | RRID: SCR_014555 |
| GSEA | http://software.broadinstitute.org/gsea/index.jsp | RRID: SCR_003199 |
| Bioconductor | http://www.bioconductor.org | RRID: SCR_006442 |
| Limma | https://www.bioconductor.org/packages/release/bioc/html/limma.html | RRID: SCR_010943 |
| DESeq2 | https://bioconductor.org/packages/release/bioc/html/DESeq2.html | RRID: SCR_015687 |
| Seurat | https://satijalab.org/seurat/articles/get_started.html | RRID: SCR_016341 |
| AUCell | https://bioconductor.org/packages/release/bioc/html/AUCell.html | RRID: SCR_021327 |
EXPERIMENTAL MODEL AND SUBJECT DETAILS
Mouse studies
All mouse experiments were approved and performed in accordance with the guidelines of the Institutional Animal Care and Research Advisory Committee at the University of Texas Southwestern Medical Center and the Institutional Animal Care and Use Committee of Memorial Sloan Kettering Cancer Center. All mice in this study were generated and maintained as mixed C57Bl and 129 genetic backgrounds, and were housed in individually ventilated cages and had free access to water and food with 12:12 hour light-dark cycle. All mouse studies included both genders in approximately equal proportions. The CGD GFP+ signature was determined using mouse GBM tumors created by Cre mediated recombination of one allele and subsequent loss of heterozygosity of the second allele for the tumor suppressors Nf1, and Trp53, and Pten. Thus, the resultant tumors are derived from a subventricular cell of origin (Alcantara Llaguno et al., 2015).
Mouse primary culture
Fresh mouse tumor tissues were dissected and cultured for doublet and sphere formation analysis with a modified protocol as described (Belenguer et al., 2016; Ferron et al., 2007). Briefly, 200 to 1,000 fresh tumor cells were plated into 96-well plates in serum free medium supplemented with B27 and the growth factors EGF and FGF (Xie et al., 2020). Cultures were counted for doublets within 16–24 hours, and spheres six to fourteen days later.
Human tumor procurement
Low passage patient derived orthotopic xenotransplants (PDX) were procured from the MSKCC Brain Tumor Center collection and were IDH1 wildtype, primary GBM that were previously untreated. Human subjects research was carried out under a MSKCC IRB-approved protocol. Regardless of age, race, gender, or diagnosis, all patients presenting for brain tumor surgery at MSKCC are approached to consent voluntarily that non-essential tissue be utilized for research. Any tissue will be destroyed upon request by the patient at any time as patients are able to remove consent at any time. Specimens for research result from de-bulking surgery and are in excess of that needed for diagnostic purposes. Patient derived samples with an unrelated ID number are deposited to the lab so that no patient identifiers are apparent.
PDX tumors were initiated from patient tumor samples by stereotactic injection of minced fresh (3 uL) patient derived GBM tumors into the striatum of anesthetized female NSG mice brains 3–4 weeks of age at coordinates: −0.5 mm AP, 1.5 mm ML, and 2.5 mm DV with respect to the bregma (N= 3 or 4 mice respectively). In two cases (T7 and T8), dissociated single cells from fresh tumor tissue (2×10⁴ cells in 2uL) were used for injection. Subsequent passages of PDX in murine brain were carried out in NSG or nude mice (male or female) with the same protocol (see Table S2A). PDX T1.1, T2.1, T5.1, T6.1, T7.1, and T8.1 PDX tumors used for 10X scRNA-Seq were directly derived from patient samples (Fig.3C–G, Fig.4, see Table S2). T3.1 and T4.1 tumors used for 10X scRNA-Seq were derived from P1 PDX tissues (Fig.3C–G, Fig.4, see Table S2). Passage 0 PDX tumors T1.1–4 and passage 1 PDX T1.5–10 were derived from patient sample Tumor 1. PDX T1.1 was used for 10X scRNA-Seq (Fig.3C–G, Fig.4). PDX T1.2 and PDX T1.3 were used for qRT-PCR and doublet/sphere formation analysis (Fig. 5C–G). Sorted cells from PDX T1.2 and T2.3 were further used for transplantation assay (Fig. 5H–I & Fig.7C–I), and F3+/F3+ (F3+ cells derived from F3+ cell transplanted PDX), and F3−/F3− (F3 cells derived from F3 cell transplanted PDX) cells were used for secondary transplantation (Fig. 5J–K). Sorted cells from a passage 1 PDX T2.2 were also used for qRT-PCR and doublet/sphere formation (Fig. S5F & G). Passage 1 PDX T5.2 was utilized for qRT-PCR and doublet/sphere formation (S5G1 & G1). PDX T1.5-T1.10 used for DMSO/TMZ treatment were generated from P0 T1.2 and T1.4 tumor (Fig. 7A & S7, see Table S2).
METHOD DETAILS
Histology and Immunohistochemistry
Mice were perfused and fixed in 4% paraformaldehyde, soaked in 30% sucrose, and imbedded in OCT compound (Tissue-Tek). Frozen brain tissues were sectioned (12μm) and stained with antibodies as follows: rabbit anti-Ki67 (Novus, 1:500), mouse anti-F3 (Santa Cruz, 1:100), rabbit anti-Cleaved Caspase-3 (Asp175) (Cell Signaling, 1:400). Immunohistochemistry images were generated with horseradish peroxidase-based standard protocols using Gfap, Olig2, Nestin and Pdgfrα antibodies as previously described (Alcantara Llaguno et al., 2009). DAPI was used to stain the nucleus (ThermoScientific, 1ug/ml). The sections were then imaged with a Zeiss LSM 510 confocal microscopy using Argon 488, He543, and He 633. For Fig. S2C, representative images from four tumors each of GFP+ or GFP− cell transplanted mice were taken, and percentages of Ki67+ cells were quantified to total DAPI+ cells. For Fig. S2G, representative images from CGD tumor cell transplanted mice treated with PBS or diphtheria toxin (two tumors each condition, three images of each tumor) were taken, Ki67+ cells from each image were counted and quantified.
FACS Analysis
DAPI was used to stain the dead cells (ThermoScientific, 1ug/ml). Viable cells were sorted in a FACSAriaII (BD Biosciences) or Bio-Rad S3e Cell Sorter and collected in complete serum-free medium. Sorted cells are cultured in the presence of EGF, FGF (Fig. S1B–F), and PDGFb (Fig. 5D–G, S5G–G1).
Total RNA Extraction and Gene Expression Profile Analysis
Freshly prepared samples were sorted directly into concentrated Trizol LS reagent (Invitrogen 10296028) and submitted to Integrated Genomics Operation facility (MSKCC) for RNA extraction. After RiboGreen quantification and quality control by Agilent BioAnalyzer, total RNA underwent amplification using the SMART-Seq v4 Ultra Low Input RNA Kit (Clonetech catalog # 63488), with 12 cycles of amplification. Amplified cDNA was used to prepare libraries with the KAPA Hyper Prep Kit (Kapa Biosystems KK8504) using 8 cycles of PCR. Samples were barcoded and run on a HiSeq 4000 in a PE50 run, using the HiSeq 3000/4000 SBS Kit (Illumina). An average of 32 million paired reads were generated per sample.
Five mouse tumor (mT) samples (mT2, mT3, mT4, mT5, mT6) had a read two which did not pass quality control by FastQC and these samples were thereby aligned using only one read instead of two. The reads from bulk RNA sequencing were aligned using STAR (Version 2.5.3a) with default settings and compared to the reference mouse mm10 (Ensembl, GRCm38) genome. Using the STAR commands, quantMode and GeneCounts, the counts for each gene were generated by STAR. The R package BiomaRt was utilized to convert the mouse Ensemble gene ID’s into mouse MGI gene symbols. Differential gene expression with log2FoldChange and FDR adjusted P-Values between the final 7 pairs of mouse GBM, GFP+ and GFP−, was determined using DESeq2 (Version 1.30.1) in R (version 4.0.1). One pair of mouse GBM sample was dropped as an outlier after batch effect correction (limma::BatchEffectCorrection, v.3.46.0). PCA plots, and volcano plots of the resultant data were generated in R as well.
GSEA: Gene Set Enrichment Analysis
GSEA (http://software.broadinstitute.org/gsea/index.jsp)(Mootha et al., 2003; Subramanian et al., 2005) was performed on their Java platform according to the instructions, with the C4 (computational gene sets), C5 (GO gene sets), and C6 (oncogenic signatures) gene sets.
Mouse2human Conversion
The CGD signature of 728 genes was converted to 566 human genes with Mouse2human (R package homologene::mouse2human, a wrapper to the NCBI HomoloGene database)(https://www.ncbi.nlm.nih.gov/HomoloGene). Briefly, after conversion of the CGD ensemble mouse gene set into mouse MGI symbol set with biomaRt in R, the 728 gene set was converted to human HGNC symbols using mouse2human in R to yield 566 human genes. The latter converted set of 566 genes was employed for probing human datasets and is hereafter simply referred to as the murine CSC signature.
scRNA-Seq of PDX samples
All PDX analyzed by scRNA-Seq were passage 0 (P0) except Tumor 3 and Tumor 4 which were both passage 2 (P2) (see Table S2). Freshly prepared PDX samples were digested into single cells with the same protocol as described above (Belenguer et al., 2016; Ferron et al., 2007). Mouse cells were depleted from the dissociated PDX cells using the Miltenyi Biotec mouse cell depletion kit (Catalog #130–104-694) according to the manufacturer’s protocol. Viable single human GBM cells were FACS collected based on DAPI− (viable cells) and immediately processed on Chromium™ instrument (10X Genomics). The single-cell RNA-Seq (scRNA-Seq) libraries were prepared following the manual “Single Cell 3’ Reagent Kits v2 User Guide” (CG00052 Rev E) provided by the 10X Genomics. Briefly, FACS-sorted cell suspensions showing viability between 80–97% were encapsulated in microfluidic droplets at a dilution of ~600 cell/μl. This resulted in a recovery of approximately 5,459 single-cells per sample with a multiplet rate being ~3.0%. The cDNA synthesis/barcoding was performed at 53°C for 45 min followed by heat inactivation at 85°C for 5 min. After the reverse transcription step emulsion droplets were broken and barcoded-cDNA was purified with DynaBeads, followed by 12-cycles of PCR-amplification (98 °C for 180 s; [98 °C for 15 s, 67 °C for 20 s, 72 °C for 60 s] × 12-cycles; 72 °C for 60 s). The 50 ng of PCR-amplified barcoded-cDNA was fragmented with the reagents provided in the kit and purified with SPRI beads to obtain avg. fragment size of 600 bp. Next, fragmented DNA was ligated to the sequencing adapter followed by indexing PCR (98 °C for 45 s; [98 °C for 20 s, 54 °C for 30 s, 72 °C for 20 s] × 10 cycles; 72 °C for 60 s). The resulting DNA library was double-size purified (0.6–0.8X) with SPRI beads and sequenced on Illumina NovaSeq platform (R1 – 26 cycles, i7 – 8 cycles, R2 – 96 cycles) resulting in 139–228 million reads per sample (average reads per single-cell being 14,904–41,534 and average reads per transcript 1.70–4.10). The fastq files containing the transcriptome and barcoding metadata were demultiplexed with the SEquence Quality Control (SEQC) pipeline metadata (Azizi et al., 2018) resulting in on average 3,901–11,024 UMIs per cell.
PDX Processing and Seurat Analysis
Each PDX count matrix was analyzed in R (versions 3.4.2 and 4.0.1) with Seurat package (versions 2.3.4 and 4.0.4). All samples were processed with an initial SEQC analysis, and filtered again based on the distributions of number of genes per cell (nGene) and the percentage of mitochondrial genes per cell (percent.mito) as depicted by the visual aids of violin plots. Filtering parameters were chosen to include the main population of cells within the distribution, removing tails and bulges of lower cell counts. All sample data were normalized, log-transformed, and scaled in Seurat. PCA algorithm was used for dimension reduction, with subsequent analysis of standard deviations explained by each principal component. As the result, 12–15 PC dimensions were used to recapitulate the initial data in a lower dimension. Each tumor was analyzed in Seurat by unsupervised method using a shared nearest neighbor (SNN) graph and smart local moving (SLM) modularity optimization-based algorithm. Each PDX sample was analyzed individually with tSNE projections to display the unsupervised clustering in two dimensions. The resolution parameter was set at 0.6. Tumors 3 and 4 each had one cluster excluded for further analyses due to low counts of nGene and nUMI.
Seurat MultiCCA Integration
Integration of the eight PDX sample datasets by Seurat was done with the MultiCCA command which removes the batch effects by integrating cells and samples based on clusters of co-expressed genes, or canonical correlation analysis as described in Butler (Butler et al., 2018). Briefly, clusters of co-expressed genes among different samples were identified, evaluated, and applied to merge the cells. The combined 8 PDX integrated dataset was then filtered to include cells with 1000–5000 nGene and below the 0.075 upper threshold for percent.mito based on the visual aids of violin plots and histograms of nGene and percent.mito. The clustering was performed with the first 10 PC dimensions and the resolution was set at 0.3. Even at resolution 0.6, the GSSC and P clusters were maintained, which indicated the robustness of the unsupervised clustering for these groups. Clusters 6 and 7 were removed from the integrated dataset due to low nGene and nUMI. The final combined dataset of 8 PDX had 30,680 cells, nUMI = 8,612, and nGene= 2,830.
Identification of the “GSSC” group in integrated dataset of eight PDX tumors
To determine the putative population of quiescent cancer stem cells, unsupervised clusters from Seurat were probed for mitotic signature expression and for expression of the murine CSC signature. A heatmap of the mitotic signature expression (Whitfield et al., 2002) for each cluster was generated by heatmap3 to gauge the relative expression of proliferative genes for each cluster. AUCell (Aibar et al., 2017) was performed with the murine CSC signature to distinguish the cluster of cells enriched for putative quiescent cancer stem cells in the top 5% of genes by rank of their expression per cell. AUCell generates an automatic threshold over which the enrichment scores are considered to be enriched for the given signature. In addition, violin plots were generated for the mean murine CSC signature per cluster.
AUCell was also performed on the following signatures: murine SVZ NSC and progenitor signatures generated by bulk RNA sequencing (Xie et al., 2020), a 400 gene human radial glial signature from gestational weeks 16–18 (Pollen et al., 2015), a 49 gene quiescent stem cell signature that was common between hematopoietic, muscle, and hair follicle stem cells (Cheung and Rando, 2013). GSEA confirmed enrichment within the GSSC group of the 566 murine CSC signature, the murine SVZ neural stem cell signature, the human radial glial signature, and the common quiescent stem cell signatures (Fig. S4B–E).
The GSSC group cells within the integrated dataset for each tumor were identified within the original individual tumor datasets in order to assess the level of overlap between the GSSC group designations (individual and integrated, right panels in Fig. 4A). P groups (proliferative groups) were determined by both high expression of the mitotic signature (Whitfield et al., 2002) and discrimination by the dendrogram into distinct clades.
Identification of the P group within the individual tumors.
P groups (proliferative groups) were determined by both high expression of the mitotic signature (Whitfield et al., 2002) and discrimination by the dendrogram into distinct clades. In the case where a low expressing cluster was included in the clade of a high expressing cluster, the low expressing cluster was not included in the P group designation. The other, unspecified neoplastic cell types were considered as any GBM cluster that was neither enriched for CSC signatures nor proliferative signatures.
Bar Plot of the murine CSC Signature in eight PDX dataset
A bar plot of the mean normalized expression counts of the murine CSC signature per cluster of the integrated dataset of eight PDX samples was generated with the normalized counts in Prism 7a using the non-parametric Kruskal-Wallis ANOVA test and Dunn’s multiple comparison test in order to determine if the cluster enriched for the murine CSC signature was significantly higher than the rest of the clusters (Fig. S3E, see Statistics in Methods section below).
Differentially expressed genes (DEG)
The Seurat command FindMarkers was used to determine DEG between the GSSC group and the remaining clusters. Differential genes are calculated between clusters using a Wilcoxon rank sum test, with the parameters min.pct = 0.01, thresh.use = 0.01, logfc.threshold = 0.1. FindConservedMarkers was used to distinguish genes that were differentially expressed in the GSSC group within each of the 8 PDX tumors, generating a common 118 gene GSSC transcriptional signature (hereafter referred to as the 118-GS signature). We used a MaxP test which takes into account the lowest p-value of all the 8 tumors with the threshold set at P<0.05. To confirm the 118-GS signature was truly conserved amongst individual tumors, we performed AUCell on each of the individual 8 PDX tumor datasets and demonstrated its enrichment within each respective PDX GSSC group.
Seurat Integration of 20 adult GBM from Neftel et al., 2019 data
Each of the 20 smart-seq derived adult GBM sample datasets from Neftel et al. (Neftel et al., 2019) was transformed into a Seurat (Version 3.0.2) object with a filter threshold of at least 200 genes per cell. Each Seurat object was then normalized. Anchors of correlated gene sets across tumors were determined by the command FindIntegrationAnchors with the k.filter set at 50 to adjust for the small sample sizes included in the datasets. Integration of these 20 individual datasets was performed by Seurat (Version 3.0.2) with the IntegrateData command, using 30 dimensions and otherwise default settings, which removes the batch effects by integrating cells and samples based on “anchors” as described in Stuart et al., (Stuart et al., 2019). After integration, the dataset contained a mean 5,643 genes per cell. The clustering was performed with the first 10 dimensions and the resolution was set at 0.6. Clusters that were non-neoplastic were excluded from further analysis, as determined in methods similar to Darmanis et al., by both cluster isolation in the tSNE map and cell type specific marker expression (Darmanis et al., 2017). Clusters 3, 6 and 9 were removed from the integrated dataset because they had high expression of the wildtype markers PTPRC (lymphocytes, clusters 3 and 6), and MOG (oligodendrocytes, cluster 9). The final combined dataset of 20 adult GBM had 4,458 neoplastic cells, with a mean of 15,034 molecules of RNA per cell, and a mean of 5,857 genes per cell.
Identification of the “GS” group within the integrated dataset of 20 adult GBM from Neftel et al., 2019 data.
To determine the putative population of quiescent cancer stem cells, unsupervised clusters from Seurat were probed for mitotic signature expression, for S-phase signature expression, and for expression of the 118-GS signature derived from the integrated 8 PDX dataset. A heatmap of the mitotic and S-phase signatures expression (Whitfield et al., 2002) for each cluster was generated by heatmap3 to gauge the relative expression of proliferative genes for each cluster. AUCell (Aibar et al., 2017) was performed with the 118-GS signature to distinguish the cluster of cells enriched for putative quiescent cancer stem cells in the top 5% of genes by rank of their expression per cell. AUCell generates an automatic threshold over which the scores are considered to be enriched for the given signature. To distinguish between the cancer stem cell populations identified by the murine CSC signature or by the human 118-GS signature, “GSSC” and “GS” are used to designate the respective populations.
Differentially expressed genes (DEG) were determined using the FindMarkers command in Seurat for GS cluster 2 vs all other neoplastic clusters. To get DEG for all the clusters, FindAllMarkers command was used. The FDR<0.05 was used as a cutoff threshold for significance and inclusion of DEG (Table S6).
Analysis of Yuan et al. (Yuan et al., 2018) single cell GBM Data
Processing and Seurat Analysis: Supplementary Table 1 from Yuan et al., 2018 lists the GBM tumor types. Included in the list were 4 primary, IDH1 wildtype GBM (samples #’s: 17 (Mesenchymal), 18 (Proneural), 25 (Classical), 48 (Proneural)) and 2 recurrent GBM (#’s 32 (Mesenchymal), 35 (Classical)). Excluded from our analysis was the IDH1 mutant (sample #16) and the grade 3 astrocytoma (sample # 30). Their filtered data was used but filtered again to include all cells with greater than 200 genes per cell. The four primary GBM were integrated together and the 2 recurrent GBM were integrated together with Seurat version 3 for two separate analyses. The identical integration methods used for the analysis of the Neftel data (see above) were employed here except the k.filter was left at the default setting of 200 since the sample sizes were larger in these datasets. Clusters of non-neoplastic cells were removed from the dataset using cell type specific markers and guided by the maps provided in the Yuan et al. manuscript, Figure 1. Clusters that were non-neoplastic were excluded from further analysis, as determined in methods similar to Darmanis et al., by both cluster isolation in the tSNE map and cell type specific marker expression (PTPRC: a leukocyte marker, EGFR: a neoplastic marker, CD34: an endothelial marker, MOG: an Oligodendrocyte marker, STMN2: a neuronal marker, and RGS5: a pericyte marker which we added to the list of markers in order to distinguish certain isolated clusters in the data) (Darmanis et al., 2017).
The combined dataset of 4 primary GBM had 9605 cells, nUMI =2681, and nGene= 1403. All of the 4 different tumors were represented in the GSSC (cluster 1), with a range of 10–30% of each tumor’s cells represented. The combined dataset of 2 recurrent GBM had 3381 cells, nUMI =1504, and nGene= 960. The integrated dataset was probed for the 118-GS signature on a per cell basis using AUCell. Mitotic signature was probed via a heatmap as described above.
Venn Diagrams
All Venn diagrams were constructed with InteractiVenn (Heberle et al., 2015). Briefly, the corresponding gene lists were uploaded and analyzed for overlapped genes with the online tools.
TCGA Classification
First, for each tumor, we calculated the mean expression of each gene across all single cell RNA expression measurements. Next, we used this as input and performed TCGA classification on our eight PDX tumors with 50 gene signatures for each subtype using the single sample gene set enrichment analysis (ssGSEA)-based equivalent distribution resampling classification strategy (1000 permutations) and the R code as provided by Wang et al., (Wang et al., 2017). They had re-calibrated the TCGA classification of GBM into three classes instead of four by discarding the previous Neural subtype. The results are in Table S2B. All of the different TCGA types were present in the GSSC group of the eight PDX data.
qRT-PCR with F3+ sorted samples
Viable cells were sorted directly into concentrated Trizol LS reagent, followed with RNA extraction (Invitrogen 10296028). Reverse Transcription was performed with iScript™ cDNA Synthesis Kit (Biorad 1708891). We then pre-amplify the cDNAs with SsoAdvanced™ PreAmp Supermix (Biorad 1725160). qRT-PCR reactions were performed with SYBR Select Master Mix (Thermo Fisher Scientific 4472918) in an Applied Biosystems QuantStudio Flex6, real time PCR system. The following primers were used (purchased from Eton Biosciences Inc). The expression of each gene was normalized to GAPDH first, then to bulk DAPI− cells for fold change.
Orthotopic Transplantation of F3 Sorted Cells and Magnetic Resonance Imaging (MRI)
Tumor 1 and Tumor 2 PDX passage 0 (T1.2 and T2.2, see Table S2) cells were dissociated and mouse cell depleted (for methods see section for: “scRNA-Seq of PDX samples” above). 4000 sorted cells (DAPI−/viable, F3−, or F3+) were injected stereotactically into the striatum of anesthetized female, 3–4 weeks of age NSG mice brains at coordinates: −0.5 mm AP, 1.5 mm ML, and 2.5 mm DV with respect to the bregma (N= 3, 3, or 4 mice respectively). At day 60 and 78 post injection, whole mouse brains were imaged by MRI (Fig. S5I–J). Mouse brains were imaged on a 9.4-Tesla Biospec scanner (Bruker Biospin Corp., Billerica, MA) with a 12-cm Bruker gradient coil (maximum gradient strength 528 mT/m). A Bruker ID 4 cm quadrature volume coil was used for RF excitation and detection. During imaging sessions mice were anesthetized with 1–2% isoflurane gas in oxygen and were positioned prone in the scanner. First T2-weighted scout images along 3 orthogonal orientations were acquired. Then T2-weighted mouse brain images along the trans-axial orientation were acquired covering the whole brain using the RARE (Rapid Acquisition with Relaxation Enhancement) fast spin-echo sequence with the following acquisition parameters: slice thickness of 0.5 mm, repetition time 2.5 s, echo time, 33 ms, RARE factor 8, and a spatial resolution of 98 × 78 μm. Same methods were used to take images from F3+/F3+ and F3−/F3− mice 97 days after human cell transplantation (Fig. 5K).
Survival Curves
GlioVis (Bowman et al., 2017) was used to analyze the microarray data (HG-U133A) from TCGA on adult GBM, with a cutoff set to compare the highest quartile expression vs. the lowest quartile expression of F3 (Fig. S5H). Kaplan-Meier survival curves were generated using log-rank (Mantel-Cox) test (Fig. 1D, 2A–B, S2D), or Gehan-Breslow-Wilcoxon test (Fig. 5I–J).
RNA bulk sequencing and analysis of F3 sorted GBM PDX samples
RNA extraction and sequencing was performed as above for the mouse GFP+ samples. Ten human GBM PDX samples passed quality control by FastQC and these samples were thereby aligned. The samples included the F3 negative sorted samples (1. F3 negative 2. F3/CD44 double negative 3. F3/CD44 double negative. 4. F3/CD44 double negative) and the F3 positive sorted samples (1. F3 positive 2. F3/CD44 double positive 3. F3/CD44 double positive 4. F3/CD44 double positive 5. F3 positive/CD44 negative 6. F3 positive/CD44 negative). The reads from bulk RNA sequencing were aligned using STAR (Version 2.5.3a) with default settings and compared to the reference human (Ensembl, GRCh37.p13) genome. Using the STAR commands, quantMode and GeneCounts, the counts for each gene were generated by STAR. The R package BiomaRt was utilized to convert the mouse Ensembl gene ID’s into gene symbols. Differential gene expression with log2FoldChange and FDR adjusted P-Values between the 4 F3 negative GBM PDX, and the six F3 positive, was determined using DESeq2 (Version 1.18.1) in R (version 3.4.2). PCA plots, and volcano plots of the resultant data were generated in R as well.
scRNA-Seq analysis of temozolomide treated PDX
For T1, we used Seurat version 3 and anchor integration (Stuart et al., 2019) of the original T1 untreated, and two separate temozolomide (TMZ) treated T1 samples. The filtering parameters for inclusion in the final dataset were cells with gene numbers (nFeature_RNA) >1000 and <7500 and percent mitochondria genes.15 as assessed by violin plots of those parameters. We used 10 dimensions as assessed by elbow plot of the principal components and a resolution of 0.3. After unsupervised clustering, we removed cluster 5 due to low counts of molecules per cell in that cluster. We used AUCell to calculate the enrichment per cell of the 566 human orthologs of the murine CSC signature, the human 118-GS signature, and S-phase cell cycle signature (Whitfield, 2002). We derived 10 differentially expressed genes for each cluster (Table S7B) and produced a heatmap of this in using Prism 7.
Quantification and statistical analysis
The non-parametric Kruskal-Wallis test with Dunn’s multiple comparison test was used in order to determine if the cluster (GSSC) enriched for the murine CSC signature was significantly higher in mean expression of the signature than the rest of the clusters and the mean of all cells (Fig. S3E). The ANOVA number of families was 1, the number of comparisons per family was 6 and Alpha was set at 0.05. The degrees of freedom were 30674, not including the mean sample, or 61353 including the mean sample.
For comparisons of mouse GBM doublets and spheres, we first used the Shapiro-Wilk normality test to prove a Gaussian distribution and adherence to this assumption of the parametric test, before employing a paired analysis, RM one way ANOVA test with Tukey’s multiple comparison test (Fig. S1D–E). For comparison of Ki67+ cells from GFP+ and GFP− cell transplanted tumors, the procedure and parameters were the same but there were N=4 biological replicates (Fig. S2C). For comparison of Ki67+ cells from CGD tumor cell transplanted mice treated with PBS or diphtheria toxin, the procedure and parameters were the same but there were N=6 technical replicates (Fig. S2G). For comparison of human tumor doublet and spheres the procedure and parameters were the same but there were N=5 technical replicates for sample, and each technical replicate represents 1000 cells (Fig. 5D–G & S5G–G1). The non-parametric one-tail Mann-Whitney test was utilized to ascertain that the human tumor F3+ cells were not affected by TMZ treatment, and there were N=3 biological replicates for each condition (Fig. S7E).
For comparisons of pairs of data, we first used the Shapiro-Wilk normality test to prove a Gaussian distribution and adherence to this assumption of the parametric test, before employing a standard two tailed, t-test. All error bars represent standard error of the mean. All such comparison statistics that produced bar plots were performed in Prism 7 (GraphPad).
Supplementary Material
Table S1. Murine CGD-CSC signature. Related to Figure 3. (A) 728 murine CGD-CSC Signature. (B) Converted mouse to human CGD-CSC Signature. (C) Murine CGD GBM sample information.
Table S2. Patient and single cell RNA sequencing data information for 8 Orthotopic PDX. Related to Figure 3. (A) Patient information for 8 Orthotopic PDX. (B) Single cell RNA sequencing data information for 8 Orthotopic PDX.
Table S3. DEG of all Clusters for 8 Orthotopic PDX and gene signatures used to identify different cell types. Related to Figures 3–4. (A) DEG of all Clusters for 8 Orthotopic PDX. (B) Top 50 DEG of all Clusters for 8 Orthotopic PDX. (C) Gene signatures used to identify different cell types.
Table S4. Quantitative analysis for F3+ and Ki67+ cells in 13 primary and 3 recurrent human PDX. Related to Figure 5. (A) Quantitative analysis for F3+ and Ki67+ cells in 13 primary human PDX. (B) Quantitative analysis for F3+ and Ki67+ cells in 3 recurrent human PDX. (C) Summary of quantitative analysis for F3+ and Ki67+ cells.
Table S5. Human Glioblastoma stem cell signature derived from F3 antibody sorted PDX samples. Related to Figure 5. (A) Human Glioblastoma stem cell signature from F3 antibody sorted samples (B) Human F3 sorted sample information.
Table S6. DEG in Neftel-GBM-Smart-Seq Neoplastic Only Dataset. Related to Figure 6. (A) Upregulated DEG in GSSC (Cluster 2) of Neftel neoplastic Only Dataset. (B) Upregulated DEG in all clusters of Neftel neoplastic Only Dataset. (B) Contribution of each tumor within clusters of Neftel neoplastic Only Dataset.
Table S7. Upregulated DEG of Clusters in TMZ Data. Related to Figure 7. (A) Upregulated DEG of all Clusters in TMZ Data. (B) Top 10 DEG of all Clusters in TMZ Data.
Highlights.
Isolation and functional characterization of quiescent glioblastoma cancer stem cells
A 728 murine GBM cancer stem cell signature is enriched in cognate human GBM cells
A 118-gene signature including F3 identifies quiescent human cancer stem cells
Quiescent GBM cancer stem cells become activated upon chemotherapy
Acknowledgements:
The authors are indebted to Linas Mazutis, Dana Pe’er and Lisa Sikkema for valuable advice; Ojasvi Chaudhary for processing 10X samples; the Brain Tumor Center, Jing Li, and Yuliang Liu, for PDX development and maintenance; Phil Gutin for supplying surgical GBM specimens; and members of the Parada lab for helpful discussions. We acknowledge the use of the Integrated Genomics Operation Core, funded by the NCI Cancer Center Support Grant (CCSG, P30 CA08748), Cycle for Survival, and the Marie-Josée and Henry R. Kravis Center for Molecular Oncology. XX was supported by American Brain Tumor Association Basic Research Fellowship in honor of Joel A. Gingras, Jr. LFP received funding from NCI (R35: CA210100 and R01: CA131313; CPRIT; and NIH Center Grant, P30 CA08748). LFP acknowledges the generous support of the Brain Tumor Center Zuckerman Foundation Initiative and the Rory and Howard Myers Family support. This work was further supported by Cancer Research UK, award C9685/A28598.
Footnotes
Declaration of Interests
The authors declare no competing interests.
Publisher's Disclaimer: This is a PDF file of an unedited manuscript that has been accepted for publication. As a service to our customers we are providing this early version of the manuscript. The manuscript will undergo copyediting, typesetting, and review of the resulting proof before it is published in its final form. Please note that during the production process errors may be discovered which could affect the content, and all legal disclaimers that apply to the journal pertain.
REFERENCES
- Aibar S, Gonzalez-Blas CB, Moerman T, Huynh-Thu VA, Imrichova H, Hulselmans G, Rambow F, Marine JC, Geurts P, Aerts J, et al. (2017). SCENIC: single-cell regulatory network inference and clustering. Nat Methods 14, 1083–1086. [DOI] [PMC free article] [PubMed] [Google Scholar]
- Alcantara Llaguno S., Chen J, Kwon CH, Jackson EL, Li Y, Burns DK, Alvarez-Buylla A, and Parada LF (2009). Malignant astrocytomas originate from neural stem/progenitor cells in a somatic tumor suppressor mouse model. Cancer Cell 15, 45–56. [DOI] [PMC free article] [PubMed] [Google Scholar]
- Alcantara Llaguno S, Sun D, Pedraza AM, Vera E, Wang Z, Burns DK, and Parada LF (2019). Cell-of-origin susceptibility to glioblastoma formation declines with neural lineage restriction. Nat Neurosci 22, 545–555. [DOI] [PMC free article] [PubMed] [Google Scholar]
- Alcantara Llaguno SR, Wang Z, Sun D, Chen J, Xu J, Kim E, Hatanpaa KJ, Raisanen JM, Burns DK, Johnson JE, and Parada LF (2015). Adult Lineage-Restricted CNS Progenitors Specify Distinct Glioblastoma Subtypes. Cancer Cell 28, 429–440. [DOI] [PMC free article] [PubMed] [Google Scholar]
- Alvarez-Satta M, Moreno-Cugnon L, and Matheu A (2019). Primary cilium and brain aging: role in neural stem cells, neurodegenerative diseases and glioblastoma. Ageing Res Rev 52, 53–63. [DOI] [PubMed] [Google Scholar]
- Azizi E, Carr AJ, Plitas G, Cornish AE, Konopacki C, Prabhakaran S, Nainys J, Wu K, Kiseliovas V, Setty M, et al. (2018). Single-Cell Map of Diverse Immune Phenotypes in the Breast Tumor Microenvironment. Cell 174, 1293–1308 e1236. [DOI] [PMC free article] [PubMed] [Google Scholar]
- Belenguer G, Domingo-Muelas A, Ferron SR, Morante-Redolat JM, and Farinas I (2016). Isolation, culture and analysis of adult subependymal neural stem cells. Differentiation 91, 28–41. [DOI] [PubMed] [Google Scholar]
- Bhaduri A, Di Lullo E, Jung D, Muller S, Crouch EE, Espinosa CS, Ozawa T, Alvarado B, Spatazza J, Cadwell CR, et al. (2020). Outer Radial Glia-like Cancer Stem Cells Contribute to Heterogeneity of Glioblastoma. Cell Stem Cell 26, 48–63 e46. [DOI] [PMC free article] [PubMed] [Google Scholar]
- Bogdanov VY, Balasubramanian V, Hathcock J, Vele O, Lieb M, and Nemerson Y (2003). Alternatively spliced human tissue factor: a circulating, soluble, thrombogenic protein. Nat Med 9, 458–462. [DOI] [PubMed] [Google Scholar]
- Bowman RL, Wang Q, Carro A, Verhaak RG, and Squatrito M (2017). GlioVis data portal for visualization and analysis of brain tumor expression datasets. Neuro Oncol 19, 139–141. [DOI] [PMC free article] [PubMed] [Google Scholar]
- Butler A, Hoffman P, Smibert P, Papalexi E, and Satija R (2018). Integrating single-cell transcriptomic data across different conditions, technologies, and species. Nat Biotechnol 36, 411–420. [DOI] [PMC free article] [PubMed] [Google Scholar]
- Chen J, Li Y, Yu TS, McKay RM, Burns DK, Kernie SG, and Parada LF (2012a). A restricted cell population propagates glioblastoma growth after chemotherapy. Nature 488, 522–526. [DOI] [PMC free article] [PubMed] [Google Scholar]
- Chen J, McKay RM, and Parada LF (2012b). Malignant glioma: lessons from genomics, mouse models, and stem cells. Cell 149, 36–47. [DOI] [PMC free article] [PubMed] [Google Scholar]
- Cheung TH, and Rando TA (2013). Molecular regulation of stem cell quiescence. Nat Rev Mol Cell Biol 14, 329–340. [DOI] [PMC free article] [PubMed] [Google Scholar]
- Clarke MF, Dick JE, Dirks PB, Eaves CJ, Jamieson CH, Jones DL, Visvader J, Weissman IL, and Wahl GM (2006). Cancer stem cells--perspectives on current status and future directions: AACR Workshop on cancer stem cells. Cancer Res 66, 9339–9344. [DOI] [PubMed] [Google Scholar]
- Couturier CP, Ayyadhury S, Le PU, Nadaf J, Monlong J, Riva G, Allache R, Baig S, Yan X, Bourgey M, et al. (2020). Single-cell RNA-seq reveals that glioblastoma recapitulates a normal neurodevelopmental hierarchy. Nat Commun 11, 3406. [DOI] [PMC free article] [PubMed] [Google Scholar]
- Darmanis S, Sloan SA, Croote D, Mignardi M, Chernikova S, Samghababi P, Zhang Y, Neff N, Kowarsky M, Caneda C, et al. (2017). Single-Cell RNA-Seq Analysis of Infiltrating Neoplastic Cells at the Migrating Front of Human Glioblastoma. Cell Rep 21, 1399–1410. [DOI] [PMC free article] [PubMed] [Google Scholar]
- Dick JE (2008). Stem cell concepts renew cancer research. Blood 112, 4793–4807. [DOI] [PubMed] [Google Scholar]
- Doetsch F, Caille I, Lim DA, Garcia-Verdugo JM, and Alvarez-Buylla A (1999). Subventricular zone astrocytes are neural stem cells in the adult mammalian brain. Cell 97, 703–716. [DOI] [PubMed] [Google Scholar]
- Ferron SR, Andreu-Agullo C, Mira H, Sanchez P, Marques-Torrejon MA, and Farinas I (2007). A combined ex/in vivo assay to detect effects of exogenously added factors in neural stem cells. Nat Protoc 2, 849–859. [DOI] [PubMed] [Google Scholar]
- Gimple RC, Bhargava S, Dixit D, and Rich JN (2019). Glioblastoma stem cells: lessons from the tumor hierarchy in a lethal cancer. Genes Dev 33, 591–609. [DOI] [PMC free article] [PubMed] [Google Scholar]
- Heberle H, Meirelles GV, da Silva FR, Telles GP, and Minghim R (2015). InteractiVenn: a web-based tool for the analysis of sets through Venn diagrams. BMC Bioinformatics 16, 169. [DOI] [PMC free article] [PubMed] [Google Scholar]
- Imayoshi I, Ohtsuka T, Metzger D, Chambon P, and Kageyama R (2006). Temporal regulation of Cre recombinase activity in neural stem cells. Genesis 44, 233–238. [DOI] [PubMed] [Google Scholar]
- Lan X, Jorg DJ, Cavalli FMG, Richards LM, Nguyen LV, Vanner RJ, Guilhamon P, Lee L, Kushida MM, Pellacani D, et al. (2017). Fate mapping of human glioblastoma reveals an invariant stem cell hierarchy. Nature 549, 227–232. [DOI] [PMC free article] [PubMed] [Google Scholar]
- Lasorella A, Benezra R, and Iavarone A (2014). The ID proteins: master regulators of cancer stem cells and tumour aggressiveness. Nat Rev Cancer 14, 77–91. [DOI] [PubMed] [Google Scholar]
- Lee JH, Lee JE, Kahng JY, Kim SH, Park JS, Yoon SJ, Um JY, Kim WK, Lee JK, Park J, et al. (2018). Human glioblastoma arises from subventricular zone cells with low-level driver mutations. Nature 560, 243–247. [DOI] [PubMed] [Google Scholar]
- Li P, Du F, Yuelling LW, Lin T, Muradimova RE, Tricarico R, Wang J, Enikolopov G, Bellacosa A, Wechsler-Reya RJ, and Yang ZJ (2013). A population of Nestin-expressing progenitors in the cerebellum exhibits increased tumorigenicity. Nat Neurosci 16, 1737–1744. [DOI] [PMC free article] [PubMed] [Google Scholar]
- MacLeod G, Bozek DA, Rajakulendran N, Monteiro V, Ahmadi M, Steinhart Z, Kushida MM, Yu H, Coutinho FJ, Cavalli FMG, et al. (2019). Genome-Wide CRISPR-Cas9 Screens Expose Genetic Vulnerabilities and Mechanisms of Temozolomide Sensitivity in Glioblastoma Stem Cells. Cell Rep 27, 971–986 e979. [DOI] [PubMed] [Google Scholar]
- Mignone JL, Kukekov V, Chiang AS, Steindler D, and Enikolopov G (2004). Neural stem and progenitor cells in nestin-GFP transgenic mice. J Comp Neurol 469, 311–324. [DOI] [PubMed] [Google Scholar]
- Monje M, Borniger JC, D’Silva NJ, Deneen B, Dirks PB, Fattahi F, Frenette PS, Garzia L, Gutmann DH, Hanahan D, et al. (2020). Roadmap for the Emerging Field of Cancer Neuroscience. Cell 181, 219–222. [DOI] [PMC free article] [PubMed] [Google Scholar]
- Mootha VK, Lindgren CM, Eriksson KF, Subramanian A, Sihag S, Lehar J, Puigserver P, Carlsson E, Ridderstrale M, Laurila E, et al. (2003). PGC-1alpha-responsive genes involved in oxidative phosphorylation are coordinately downregulated in human diabetes. Nat Genet 34, 267–273. [DOI] [PubMed] [Google Scholar]
- Morrow JJ, Bayles I, Funnell APW, Miller TE, Saiakhova A, Lizardo MM, Bartels CF, Kapteijn MY, Hung S, Mendoza A, et al. (2018). Positively selected enhancer elements endow osteosarcoma cells with metastatic competence. Nat Med 24, 176–185. [DOI] [PMC free article] [PubMed] [Google Scholar]
- Neftel C, Laffy J, Filbin MG, Hara T, Shore ME, Rahme GJ, Richman AR, Silverbush D, Shaw ML, Hebert CM, et al. (2019). An Integrative Model of Cellular States, Plasticity, and Genetics for Glioblastoma. Cell. [DOI] [PMC free article] [PubMed] [Google Scholar]
- Parada LF, Dirks PB, and Wechsler-Reya RJ (2017). Brain Tumor Stem Cells Remain in Play. J Clin Oncol 35, 2428–2431. [DOI] [PMC free article] [PubMed] [Google Scholar]
- Piccirillo SG, Combi R, Cajola L, Patrizi A, Redaelli S, Bentivegna A, Baronchelli S, Maira G, Pollo B, Mangiola A, et al. (2009). Distinct pools of cancer stem-like cells coexist within human glioblastomas and display different tumorigenicity and independent genomic evolution. Oncogene 28, 1807–1811. [DOI] [PubMed] [Google Scholar]
- Pollen AA, Nowakowski TJ, Chen J, Retallack H, Sandoval-Espinosa C, Nicholas CR, Shuga J, Liu SJ, Oldham MC, Diaz A, et al. (2015). Molecular identity of human outer radial glia during cortical development. Cell 163, 55–67. [DOI] [PMC free article] [PubMed] [Google Scholar]
- Prager BC, Xie Q, Bao S, and Rich JN (2019). Cancer Stem Cells: The Architects of the Tumor Ecosystem. Cell Stem Cell 24, 41–53. [DOI] [PMC free article] [PubMed] [Google Scholar]
- Rajakulendran N, Rowland KJ, Selvadurai HJ, Ahmadi M, Park NI, Naumenko S, Dolma S, Ward RJ, So M, Lee L, et al. (2019). Wnt and Notch signaling govern self-renewal and differentiation in a subset of human glioblastoma stem cells. Genes Dev 33, 498–510. [DOI] [PMC free article] [PubMed] [Google Scholar]
- Richards LM, Whitley OKN, MacLeod G, Cavalli FMG, Coutinho FJ, Jaramillo JE, Svergun N, Riverin M, Croucher DC, Kushida M, et al. (2021). Gradient of Developmental and Injury Response transcriptional states defines functional vulnerabilities underpinning glioblastoma heterogeneity. Nat Cancer 2. [DOI] [PubMed] [Google Scholar]
- Schwalie PC, Dong H, Zachara M, Russeil J, Alpern D, Akchiche N, Caprara C, Sun W, Schlaudraff KU, Soldati G, et al. (2018). A stromal cell population that inhibits adipogenesis in mammalian fat depots. Nature 559, 103–108. [DOI] [PubMed] [Google Scholar]
- Singh SK, Hawkins C, Clarke ID, Squire JA, Bayani J, Hide T, Henkelman RM, Cusimano MD, and Dirks PB (2004). Identification of human brain tumour initiating cells. Nature 432, 396–401. [DOI] [PubMed] [Google Scholar]
- Stuart T, Butler A, Hoffman P, Hafemeister C, Papalexi E, Mauck WM 3rd, Hao Y, Stoeckius M, Smibert P, and Satija R (2019). Comprehensive Integration of Single-Cell Data. Cell 177, 1888–1902 e1821. [DOI] [PMC free article] [PubMed] [Google Scholar]
- Subramanian A, Tamayo P, Mootha VK, Mukherjee S, Ebert BL, Gillette MA, Paulovich A, Pomeroy SL, Golub TR, Lander ES, and Mesirov JP (2005). Gene set enrichment analysis: a knowledge-based approach for interpreting genome-wide expression profiles. Proc Natl Acad Sci U S A 102, 15545–15550. [DOI] [PMC free article] [PubMed] [Google Scholar]
- Suva ML, Rheinbay E, Gillespie SM, Patel AP, Wakimoto H, Rabkin SD, Riggi N, Chi AS, Cahill DP, Nahed BV, et al. (2014). Reconstructing and reprogramming the tumor-propagating potential of glioblastoma stem-like cells. Cell 157, 580–594. [DOI] [PMC free article] [PubMed] [Google Scholar]
- Suva ML, and Tirosh I (2020). The Glioma Stem Cell Model in the Era of Single-Cell Genomics. Cancer Cell 37, 630–636. [DOI] [PubMed] [Google Scholar]
- Toledo CM, Ding Y, Hoellerbauer P, Davis RJ, Basom R, Girard EJ, Lee E, Corrin P, Hart T, Bolouri H, et al. (2015). Genome-wide CRISPR-Cas9 Screens Reveal Loss of Redundancy between PKMYT1 and WEE1 in Glioblastoma Stem-like Cells. Cell Reports 13, 2425–2439. [DOI] [PMC free article] [PubMed] [Google Scholar]
- Unruh D, and Horbinski C (2020). Beyond thrombosis: the impact of tissue factor signaling in cancer. J Hematol Oncol 13, 93. [DOI] [PMC free article] [PubMed] [Google Scholar]
- Vanner RJ, Remke M, Gallo M, Selvadurai HJ, Coutinho F, Lee L, Kushida M, Head R, Morrissy S, Zhu X, et al. (2014). Quiescent sox2(+) cells drive hierarchical growth and relapse in sonic hedgehog subgroup medulloblastoma. Cancer Cell 26, 33–47. [DOI] [PMC free article] [PubMed] [Google Scholar]
- Wang Q, Hu B, Hu X, Kim H, Squatrito M, Scarpace L, deCarvalho AC, Lyu S, Li P, Li Y, et al. (2017). Tumor Evolution of Glioma-Intrinsic Gene Expression Subtypes Associates with Immunological Changes in the Microenvironment. Cancer Cell 32, 42–56 e46. [DOI] [PMC free article] [PubMed] [Google Scholar]
- Wang Z, Sun D, Chen YJ, Xie X, Shi Y, Tabar V, Brennan CW, Bale TA, Jayewickreme CD, Laks DR, et al. (2020). Cell Lineage-Based Stratification for Glioblastoma. Cancer Cell 38, 366–379 e368. [DOI] [PMC free article] [PubMed] [Google Scholar]
- Weng Q, Wang J, Wang J, He D, Cheng Z, Zhang F, Verma R, Xu L, Dong X, Liao Y, et al. (2019). Single-Cell Transcriptomics Uncovers Glial Progenitor Diversity and Cell Fate Determinants during Development and Gliomagenesis. Cell Stem Cell 24, 707–723 e708. [DOI] [PMC free article] [PubMed] [Google Scholar]
- Whitfield ML, Sherlock G, Saldanha AJ, Murray JI, Ball CA, Alexander KE, Matese JC, Perou CM, Hurt MM, Brown PO, and Botstein D (2002). Identification of genes periodically expressed in the human cell cycle and their expression in tumors. Mol Biol Cell 13, 1977–2000. [DOI] [PMC free article] [PubMed] [Google Scholar]
- Xie XP, Laks DR, Sun D, Poran A, Laughney AM, Wang Z, Sam J, Belenguer G, Farinas I, Elemento O, et al. (2020). High-resolution mouse subventricular zone stem-cell niche transcriptome reveals features of lineage, anatomy, and aging. Proc Natl Acad Sci U S A 117, 31448–31458. [DOI] [PMC free article] [PubMed] [Google Scholar]
- Yu TS, Zhang G, Liebl DJ, and Kernie SG (2008). Traumatic brain injury-induced hippocampal neurogenesis requires activation of early nestin-expressing progenitors. J Neurosci 28, 12901–12912. [DOI] [PMC free article] [PubMed] [Google Scholar]
- Yuan J, Levitin HM, Frattini V, Bush EC, Boyett DM, Samanamud J, Ceccarelli M, Dovas A, Zanazzi G, Canoll P, et al. (2018). Single-cell transcriptome analysis of lineage diversity in high-grade glioma. Genome Med 10, 57. [DOI] [PMC free article] [PubMed] [Google Scholar]
- Zhang Y, Chen K, Sloan SA, Bennett ML, Scholze AR, O’Keeffe S, Phatnani HP, Guarnieri P, Caneda C, Ruderisch N, et al. (2014). An RNA-sequencing transcriptome and splicing database of glia, neurons, and vascular cells of the cerebral cortex. J Neurosci 34, 11929–11947. [DOI] [PMC free article] [PubMed] [Google Scholar]
- Zhu Y, Guignard F, Zhao D, Liu L, Burns DK, Mason RP, Messing A, and Parada LF (2005). Early inactivation of p53 tumor suppressor gene cooperating with NF1 loss induces malignant astrocytoma. Cancer Cell 8, 119–130. [DOI] [PMC free article] [PubMed] [Google Scholar]
- Zimmerman L, Parr B, Lendahl U, Cunningham M, McKay R, Gavin B, Mann J, Vassileva G, and McMahon A (1994). Independent regulatory elements in the nestin gene direct transgene expression to neural stem cells or muscle precursors. Neuron 12, 11–24. [DOI] [PubMed] [Google Scholar]
Associated Data
This section collects any data citations, data availability statements, or supplementary materials included in this article.
Supplementary Materials
Table S1. Murine CGD-CSC signature. Related to Figure 3. (A) 728 murine CGD-CSC Signature. (B) Converted mouse to human CGD-CSC Signature. (C) Murine CGD GBM sample information.
Table S2. Patient and single cell RNA sequencing data information for 8 Orthotopic PDX. Related to Figure 3. (A) Patient information for 8 Orthotopic PDX. (B) Single cell RNA sequencing data information for 8 Orthotopic PDX.
Table S3. DEG of all Clusters for 8 Orthotopic PDX and gene signatures used to identify different cell types. Related to Figures 3–4. (A) DEG of all Clusters for 8 Orthotopic PDX. (B) Top 50 DEG of all Clusters for 8 Orthotopic PDX. (C) Gene signatures used to identify different cell types.
Table S4. Quantitative analysis for F3+ and Ki67+ cells in 13 primary and 3 recurrent human PDX. Related to Figure 5. (A) Quantitative analysis for F3+ and Ki67+ cells in 13 primary human PDX. (B) Quantitative analysis for F3+ and Ki67+ cells in 3 recurrent human PDX. (C) Summary of quantitative analysis for F3+ and Ki67+ cells.
Table S5. Human Glioblastoma stem cell signature derived from F3 antibody sorted PDX samples. Related to Figure 5. (A) Human Glioblastoma stem cell signature from F3 antibody sorted samples (B) Human F3 sorted sample information.
Table S6. DEG in Neftel-GBM-Smart-Seq Neoplastic Only Dataset. Related to Figure 6. (A) Upregulated DEG in GSSC (Cluster 2) of Neftel neoplastic Only Dataset. (B) Upregulated DEG in all clusters of Neftel neoplastic Only Dataset. (B) Contribution of each tumor within clusters of Neftel neoplastic Only Dataset.
Table S7. Upregulated DEG of Clusters in TMZ Data. Related to Figure 7. (A) Upregulated DEG of all Clusters in TMZ Data. (B) Top 10 DEG of all Clusters in TMZ Data.
Data Availability Statement
All RNA-seq data has been deposited at GEO and will be publicly available as of the date of publication. Accession numbers are listed in the key resources table.
All original code has been deposited at Dataverse and is publicly available as of the date of publication. DOIs are listed in the key resources table.
Any additional information required to reanalyze the data reported in this paper is available from the lead contact upon request.
Key resources table.
| REAGENT or RESOURCE | SOURCE | IDENTIFIER |
|---|---|---|
| Antibodies | ||
| Rabbit anti-Pdgfra | Santa Cruz | Cat#: sc-338; RRID: AB_631064 |
| Goat anti-Nestin | Santa Cruz | Cat#: sc-21248; RRID: AB_2148925 |
| Rabbit anti-Fa2h | Proteintech | Cat#: 15452-1-AP; RRID: AB_2101886 |
| Rabbit anti-Olig2 | Millipore | Cat#: Ab9610; RRID: AB_570666 |
| Rabbit anti-Gfap | Cell Signaling | Cat#: 12389T; RRID: AB_2631098 |
| Rabbit anti-KI67 | Novus | Cat# NB500-170; RRID:AB_1000197 |
| Mouse anti-TF(F3)(H-9) | Santa Cruz | Cat#: sc-374441; RRID: AB_11008609 |
| Mouse anti-CD142(F3) - FITC | Miltenyi Biotec | Cat# 130-098-854, RRID: AB_2655127 |
| Rabbit anti-Cleaved Caspase-3 (Asp175) | Cell Signaling | Cat# 9661, RRID: AB_2341188 |
| Chemicals, Peptides, and Recombinant Proteins | ||
| Tamoxifen | Sigma | Cat#: T5648 |
| EGF | Fisher Scientific | Cat#: PHG0311 |
| bFGF | Gemini | Cat#: 300-113P 50ug |
| iScript cDNA synthesis kit | Biorad | Cat#: 1708890 |
| RNeasy Extraction Kit | Qiagen | Cat#: 74104 |
| Deposited Data | ||
| Neftel et.al., dataset | https://pubmed.ncbi.nlm.nih.gov/31327527/ | |
| Yuan et.al., dataset | https://pubmed.ncbi.nlm.nih.gov/30041684/ | |
| TCGA GBM RNAseq and microarray dataset | Cbioportal: https://www.cbioportal.org | GBM (TCGA 2003) |
| RNA sequencing data generated in this study | This paper | GEO: GSE190129 |
| Codes for 8 PDX data analysis | This paper | https://doi.org/10.7910/DVN/J5MVOR |
| Codes for Neftel et al., data analysis | This paper | https://doi.org/10.7910/DVN/FODWRV |
| Codes for 4 primary GBM data analysis from Yuan et al., | This paper | https://doi.org/10.7910/DVN/SYP8LH |
| Codes for 2 recurrent GBM data analysis from Yuan et al., | This paper | https://doi.org/10.7910/DVN/JXVB7R |
| Experimental Models: human GBM PDX Lines | ||
| PDX180327-1; GBM patient-derived primary tumor xenografts | Established at MSKCC (Brain Tumor Center) | N/A |
| PDX180518-1; GBM patient-derived primary tumor xenografts | Established at MSKCC (Brain Tumor Center) | N/A |
| PDX170911-1; GBM patient-derived primary tumor xenografts | Established at MSKCC (Brain Tumor Center) | N/A |
| PDX160830-1; GBM patient-derived primary tumor xenografts | Established at MSKCC (Brain Tumor Center) | N/A |
| PDX180709-1; GBM patient-derived primary tumor xenografts | Established at MSKCC (Brain Tumor Center) | N/A |
| PDX180911-1; GBM patient-derived primary tumor xenografts | Established at MSKCC (Brain Tumor Center) | N/A |
| PDX160810-1; GBM patient-derived primary tumor xenografts | Established at MSKCC (Brain Tumor Center) | N/A |
| PDX161129-2; GBM patient-derived primary tumor xenografts | Established at MSKCC (Brain Tumor Center) | N/A |
| Experimental Models: Organisms/Strains | ||
| CGD | https://pubmed.ncbi.nlm.nih.gov/33229571/ | N/A |
| Nf1 flox | https://pubmed.ncbi.nlm.nih.gov/11297510/ | N/A |
| Trp53 flox | https://pubmed.ncbi.nlm.nih.gov/15150107/ | N/A |
| Pten flox | https://pubmed.ncbi.nlm.nih.gov/11691952/ | N/A |
| Oligonucleotides | ||
| GAPDH-Forward: TTTGGCTACAGCAACAGGGT | Eton Bioscience | N/A |
| GAPDH-Reverse: CCAGCAGTGAGGGTCTCTCT | Eton Bioscience | N/A |
| F3-Forward: GGAAGAGTACAGACAGCCCG | Eton Bioscience | N/A |
| F3- Reverse: ACCACAAATACCACAGCTCCA | Eton Bioscience | N/A |
| TIMP3-Forward: GGCACGCTGGTCTACACC | Eton Bioscience | N/A |
| TIMP3-Reverse: TGGTACTTGTTGACCTCCAGC | Eton Bioscience | N/A |
| ID3-Forward: GGCTAAGCTGAGTGCCTCTC | Eton Bioscience | N/A |
| ID3-Reverse: AGCTTGCTGGACGACATGAA | Eton Bioscience | N/A |
| APOE-Forward: TTTGGGATTACCTGCGCTGG | Eton Bioscience | N/A |
| APOE-Reverse: TCATGGTCTCGTCCATCAGC | Eton Bioscience | N/A |
| EDNRB-Forward: TCAGTGAAGCCATGTTGATACCA | Eton Bioscience | N/A |
| EDNRB-Reverse: TGGTCCTTGTCTTTGCCCTC | Eton Bioscience | N/A |
| KI67-Forward: ACCAAGCTTTGTGCCTTCAC | Eton Bioscience | N/A |
| KI67-Reverse: AATGCACACTCCACCTGTCC | Eton Bioscience | N/A |
| Software and Algorithms | ||
| GraphPad Prism v.7 | www.graphpad.com | RRID: SCR_002798 |
| Image J | www.imagej.net | RRID: SCR_003070 |
| cBioPortal | www.cBioPortal.org | RRID: SCR_014555 |
| GSEA | http://software.broadinstitute.org/gsea/index.jsp | RRID: SCR_003199 |
| Bioconductor | http://www.bioconductor.org | RRID: SCR_006442 |
| Limma | https://www.bioconductor.org/packages/release/bioc/html/limma.html | RRID: SCR_010943 |
| DESeq2 | https://bioconductor.org/packages/release/bioc/html/DESeq2.html | RRID: SCR_015687 |
| Seurat | https://satijalab.org/seurat/articles/get_started.html | RRID: SCR_016341 |
| AUCell | https://bioconductor.org/packages/release/bioc/html/AUCell.html | RRID: SCR_021327 |