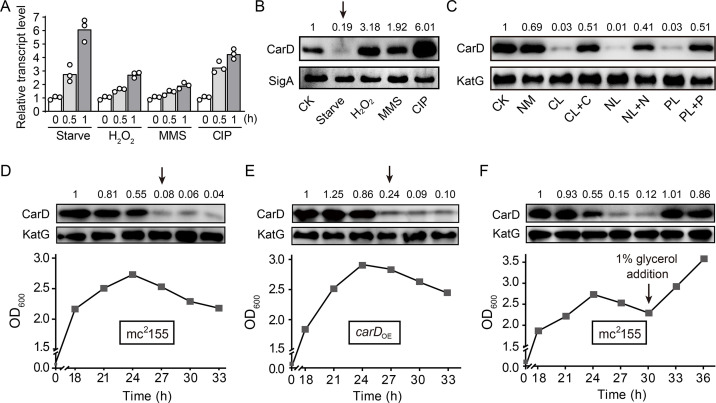
Figure 1. Changes of CarD transcript and protein levels under starvation and genotoxic stress.
(A, B) The transcript and protein levels of CarD, respectively, under different stress conditions. The carD transcript levels in the treated exponential mc2155 cells were measured by qRT-PCR, normalized to the sigA transcript levels, and expressed as the fold change of untreated cells. CK indicates the untreated cells of mc2155. ‘Starve’ means that mc2155 cells were first cultured in the 7H9 medium, and then transferred to phosphate-buffered saline (PBS) for 0.5 or 1 hr. For stimulation experiments, 10 mM H2O2, 0.1% methyl methanesulfonate (MMS), and 10 μg/ml of ciprofloxacin (CIP) were used. Individual data for the three biological replicates are shown in the corresponding columns. Western blot was used to detect the CarD protein levels under the same treatment conditions with SigA serving as the internal reference protein. (C) Protein levels of CarD under distinct starvation conditions. CK indicates the untreated exponential cells; NM indicates the exponential cells transferred into the normal medium for 4 hr; CL, NL, and PL indicate the exponential cells transferred into carbon-, nitrogen-, and phosphorus-limited media for 4 hr, respectively; CL + C, NL + N, and PL + P indicate the starved mc2155 cultures supplemented with the corresponding nutrients for 4 hr. KatG was used as the control in the Western blot experiments. CarD protein levels at the different growth stages in mc2155 (D, F), and carD overexpressing strain (carDOE, panel E). The lower part of the chart shows the respective growth curves with the sampling times. For panels (B–F), the number above each band of the Western blot represents their relative quantitative values, which are normalized with respect to their corresponding loading controls. For panels (B, D, and E), arrows above the Western blot results indicate the sharp decrease in CarD levels under starvation or stationary phase.


