. 2022 Jan 21;11:e67576. doi: 10.7554/eLife.67576

Figure 6. sst1.1 δ-cells convert to Sst1.1+ Ins + bihormonal cells after β-cell destruction and activate cell cycle genes and p53.

(A) Quantification by flow cytometry of GFPhigh/sst1.1 δ-cells before ablation (CTL) and at 3 and 20 dpt showing depletion of sst1.1 δ-cells during regeneration. Cells were isolated from dissected main islets of adult Tg(sst1.1:eGFP); Tg(ins:NTR-P2A-mCherry). Mean ± SD; Kruskal-Wallis test; ns: not significant, **p < 0.005 (see also Figure 6—source data 1). (B) In vivo time lapse of the main islet of a four dpf Tg(sst1.1:eGFP); Tg(ins:NTR-P2A-mCherry) larva following β-cell ablation from 3 to 4 dpf. 3D representation (B) and one z-plane (B’) of the same islet are shown. The arrowheads point at two GFP+ cells (green) that start to express ins:mCherry (red) fluorescence between t0 and t1 (visible in the same z-plane). The white arrowhead points to a strongly fluorescent sst1.1:GFPhigh cell. Images were acquired every 30 min starting from four dpf (96 hpf). (C) Volcano plot showing the significant DE genes over- or underexpressed in 20 dpt bihormonal cells versus CTL GFPhigh/sst1.1 δ-cells (FC >2 < , Padj <0.05). The full list of significant DE genes calculated by DESeq is provided in Figure 6—source data 2. (D) Expression in normalized counts of the sst1.1 and ins genes in CTL GFPhigh/sst1.1 δ-cells and bihormonal cells (bi). Padj are calculated by DESeq. ns: no significant DE between the two conditions, ***** < 0.000005. (E) Top significant KEGG pathways identified among the genes upregulated (in orange) and downregulated (in green) in bihormonal cells compared to CTL GFPhigh/sst1.1 δ-cells. The list of GO terms below FDR 0.25 is given in Figure 6—source data 3, Figure 6—source data 4. (F) Immunofluorescence of PCNA and mCherry on paraffin sections through the main islet of Tg(ins:NTR-P2A-mCherry) adult zebrafish, CTL and regenerated (20 dpt after NFP-mediated ablation), showing PCNA+ nuclei in mCherry+ cells in regenerated islets (confocal images, white arrowheads). (G) Expression of p53 target genes mdm2 and ccng1 mRNA (green) revealed by whole mount in situ hybridization on 6 dpf CTL and ablated Tg(ins:NTR-P2A-mCherry); Tg(sst1.1:GFP) larvae (main islet). Ablation was performed at 3 dpf. Immunodetection of GFP (in red) was revealed following in situ hybridization. White arrowheads point to sst1.1:GFP+ cells expressing mdm2 and ccng1 after ablation.

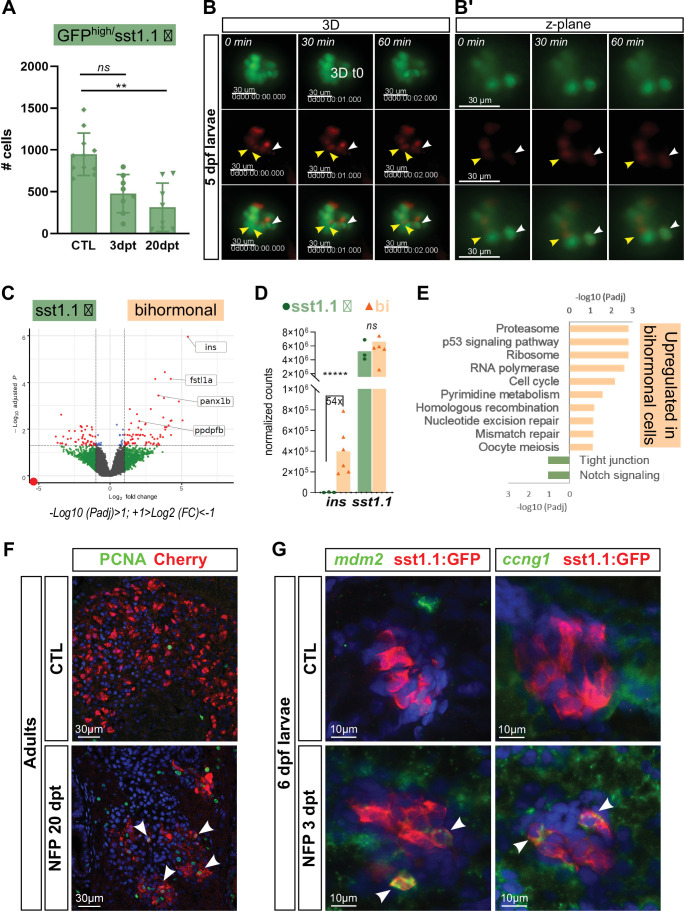
Figure 6—source data 1. sst1.1 delta cell (GFPhigh) quantification.
Figure 6—source data 2. Differentially expressed genes between sst1.1 delta and bihormonal cells.
Figure 6—source data 3. Gene Ontology analysis of genes overexpessed in bihormonal cells.
Figure 6—source data 4. Gene Ontology analysis of genes overexpressed in sst1.1 delta cells.

Figure 6.

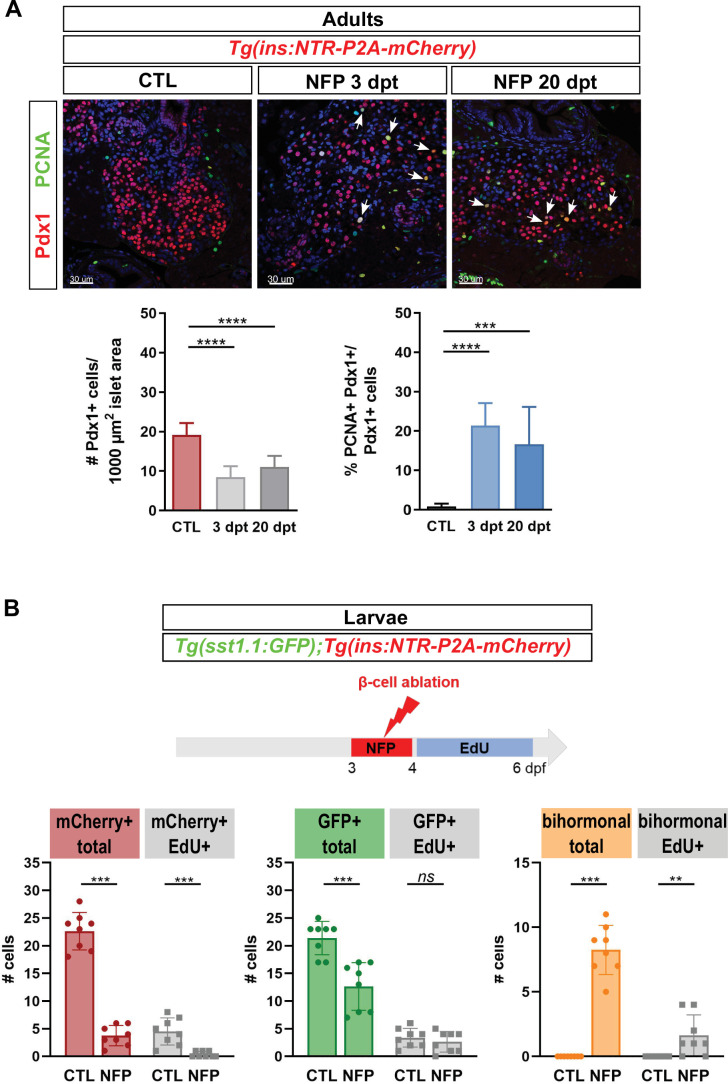
Figure 6—figure supplement 1. Analysis of proliferation in the main islet of adults and larvae during regeneration.

Figure 6—figure supplement 1.

(A) Immunofluorescence of PCNA and Pdx1 on paraffin sections through the main islet of Tg(ins:NTR-P2A-mCherry) adult zebrafish in CTL, 3 dpt and 20 dpt conditions. Double positive PCNA+ Pdx1+ cells are indicated by white arrows (confocal images). Pdx1+ cells comprise β, sst1.1 δ and bihormonal cells. Left graph: Quantification of Pdx1+ cells per islet surface measured on several sections from four to five different islets. Note the decrease of the density of Pdx1+ nuclei at 3 and 20 dpt consistent with the loss of β-cells. p **** < 0.0001; Mean ± SD; One-way ANOVA Kruskal-Wallis test with Dunn’s multiple comparisons test. Right graph: Percentage of Pdx1+ PCNA + cells versus the total number of Pdx1 cells. CTL, 0.9% ± 0.7%; 3 dpt: 18.5% ± 6.8%; 20 dpt, 16.6% ± 9.5%. p *** < 0.001, **** < 0.0001; Mean ± SD; One-way ANOVA Kruskal-Wallis test with Dunn’s multiple comparisons test. (B) EdU incorporation in Tg(ins:NTR-P2A-mCherry); Tg(sst1.1:GFP) larvae. After ablation from 3 to 4 dpf, EdU was administered from 4 until 6 dpf (3 dpt). Monohormonal GFP+ cells and mCherry+ β-cells show basal EdU incorporation at this stage (CTL). After ablation (NFP), most monohormonal mCherry+ β-cells are EdU negative compared to CTL, leading to a reduced ratio of EdU + mCherry + cells versus total mCherry+ cells (20% in CTL to 7% in NFP). Like in adults, monohormonal GFP+ cells decreased in NFP-treated samples. They show variable EdU positivity among larvae (1–6 cells in CTL and 0–5 cells in NFP) and the average ratio of EdU + GFP + versus total GFP+ cells at CTL (16%) and NFP (23%) is not significantly different. Bihormonal cells are detected in the NFP condition (8.23 ± 1.8 cells) and the number of EdU + bihormonal cells ranges from 0 to 4 cells between larvae with an average proportion of 19%. Mean ± SD; ns: not significant; p** < 0.01, *** < 0.001; Mann-Whitney tests.
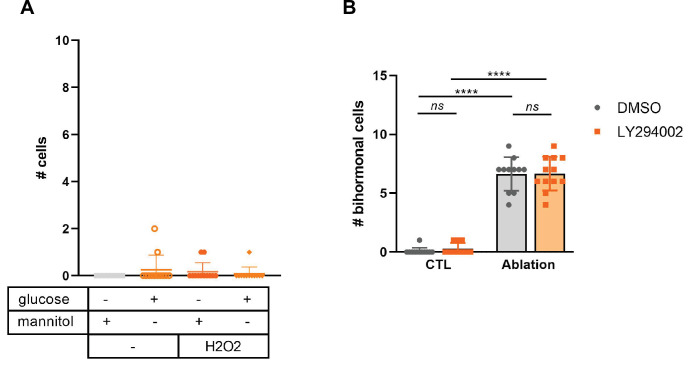
Figure 6—figure supplement 2. Effect on bihormonal cells of different candidate signals linked to the destruction of β-cells.

Figure 6—figure supplement 2.

(A) Bihormonal cell quantification in Tg(ins:NTR-P2A-mCherry); Tg(sst1.1:GFP) larvae exposed for 3 days to 3% D-glucose or mannitol as control, to 10 mM H2O2, or to a combination. mCherry+ GFP + were quantified. (B) β-cell ablation was performed in Tg(ins:NTR-P2A-mCherry); Tg(sst1.1:GFP) larvae from 3 to 4 dpf then the Insulin/PI3K signaling was inhibited by treatment with the PI3K inhibitor LY294002 from 4 to 6 dpf. mCherry+ GFP + were quantified. Mean ± SD; ns: not significant, p**** < 0.0001. Two-way ANOVA test with Tukey’s multiple comparison test.