Abstract
Purpose
This study aimed to investigate functional abnormalities in the brain of patients with neurological adverse effects following COVID-19 (coronavirus disease 2019) vaccination using 18F-FDG PET/MRI and 15O-water PET.
Methods
Eight patients (1 man and 7 women, aged 26–47 years [median age, 36.5 years]) who experienced neurological symptoms after the first COVID-19 vaccination underwent CT, MRI, 18F-FDG PET/MRI, and 15O-water PET of the brain. After 7 days, each patient underwent a follow-up 18F-FDG PET/MRI and 15O-water PET of the brain. Imaging data were analyzed using visual and semiquantitative analyses, which included a cluster subtraction workflow (P = 0.05).
Results
There was no evidence of vascular abnormalities, acute infarction, or hemorrhage on the CT or MRI scans. On the 15O-water PET images, 1 patient had mildly significant decreases in perfusion in the bilateral thalamus and bilateral cerebellum, and another patient showed a diffuse increase in perfusion in the cerebral white matter. The visual and semiquantitative analyses showed hypometabolism in the bilateral parietal lobes in all 8 patients on both the first and follow-up 18F-FDG PET/MRI scans. Metabolic changes in the bilateral cuneus were also observed during the first visit; all patients exhibited neurological symptoms. Moreover, 6 patients showed hypometabolism, and 2 patients showed hypermetabolism.
Conclusion
All regions of metabolic abnormality were part of the fear network model that has been implicated in anxiety. Our study findings support the concepts of and provide evidence for the immunization stress-related response and the biopsychosocial model.
Key Words: 15O-water, COVID-19, FDG, immunization stress-related responses, PET/MRI, stress
The coronavirus disease 2019 (COVID-19) global pandemic was caused by the severe acute respiratory syndrome coronavirus 2 (SARS-CoV-2). Several vaccines have been developed to reduce COVID-19 disease severity and provide protection against infection.1
To date, there have been several reports of postvaccination adverse effects. Common adverse effects include fever, fatigue, pain at the injection site, and neurological symptoms. Commonly reported neurological adverse effects are dizziness, headache, muscle spasms, myalgia, and paresthesia, which are expected to occur as acute, transient effects of vaccination.2,3 These transient neurological effects may be associated with the immunization stress-related response (ISRR), which occurs in response to vaccination stress, and the condition is based on biological, psychological, and social factors.4,5
Nationwide vaccination using the Sinovac inactivated vaccine and the ChAdOx1 nCoV-19 (AstraZeneca) viral vector vaccine against COVID-19 was initiated in Thailand in February 2021.6,7 In Thailand, the first neurological adverse effects were reported in April 2021. Symptoms were primarily paresthesia, weakness, speech difficulty, and face drooping. CT and MRI data of the brain acquired while patients experienced neurological symptoms after the first vaccination did not show any evidence of anatomical abnormality. Nevertheless, such neurological symptoms may affect public confidence in the COVID-19 vaccination program and become an obstacle to reducing disease severity and spread.
The 15O-water PET scan is currently recognized as the reference standard for evaluating cerebral blood flow (CBF).8,9 This study aimed to investigate functional abnormalities in the brain of patients with neurological adverse effects following COVID-19 vaccination using 18F-FDG PET/MRI and 15O-water PET.
PATIENTS AND METHODS
Patients
This retrospective study was approved by the Human Research Ethics Committee of Chulabhorn Research Institute. Before the study, written informed consent was obtained from all participants. Patients who experienced neurological adverse effects after COVID-19 vaccination were enrolled in the study between May 2021 and June 2021.
Procedures
All patients underwent CT, MRI, 18F-FDG PET/MRI, and 15O-water PET of the brain while experiencing neurological symptoms after their first COVID-19 vaccination. Each patient underwent follow-up 18F-FDG PET/MRI and 15O-water PET of the brain (median duration of 6 days; range, 4–7 days). Patients sat in a quiet room with both eyes open without covering their ears before radiotracer administration.
15O-Water PET Brain Imaging
15O-water PET/CT of the brain was performed on a 64-slice Siemens/Biograph vision scanner (Siemens Healthcare GmbH, Erlangen, Germany). 15O-water (800–1000 MBq) was injected (Radiowater Generator; Hidex Oy, Turku, Finland) as an intravenous bolus over 6 seconds, which was then flushed with normal saline. Dynamic acquisition was performed for 7 minutes in 3-dimensional (3D) mode immediately following the injection. A single low-dose CT scan (80 mAs, 120 kV, with care dose 4D quality reference = 70) was performed for attenuation correction. Reconstruction parameters were ultrahigh-definition (HD) PET (point-spread function [PSF] + time of flight [TOF]) method with 8 iterations and 5 subsets, image size 440 × 440 and all-pass filters. PET data were separately reconstructed into 2 datasets. The dynamic dataset was 30 seconds × 1 frame, 5 seconds × 18 frames, 10 seconds × 9 frames, 15 seconds × 10 frames, and 30 seconds × 2 frames. The static dataset was 420 seconds with one frame. Although PET with 15O-water is the criterion standard for the quantification of CBF, it requires measuring the arterial input function, which is an invasive and complicated procedure. Therefore, nonquantitative CBF was used to solve this problem.10,11
18F-FDG PET/MRI
Following 15O-water PET brain imaging, 18F-FDG PET/MRI was performed on a simultaneous PET/MRI 3-T scanner (Siemens Healthcare GmbH) approximately 40 minutes after intravenous injection of 2.59 MBq/kg of 18F-FDG. Single-bed PET dynamic list-mode acquisition was carried out 40 to 50 minutes postinjection, simultaneously with the MRI acquisition. The DIXON high-resolution brain sequence with a voxel size of 1.3 × 1.3 × 2.0 mm, an echo time = 1.28/2.51 milliseconds, and a repetition time = 4.14 milliseconds. A 5-compartment segmentation (air, water, lung, adipose tissue, and bone) postprocessing method was applied for the MRA sequence. Various MRI sequences were applied, which included T1 3D MPRAGE, axial diffusion-weighted imaging with b0 and b1000, axial T2-weighted fluid-attenuated inversion recovery with fat-suppression, 3D magnetic resonance angiography (MRA) with the TOF technique (3D MRA-TOF) of the brain and neck, and axial susceptibility-weighted imaging. An axial T1-weighted (T1W) volumetric interpolated breath-hold examination was performed prior to gadolinium enhancement. The dynamic contrast enhancement MRI to assess brain perfusion was performed with 15 mL of Dotarem at an injection rate of 4 mL/s. This was followed by an axial T1W volumetric interpolated breath-hold examination and a sagittal T1 3D imaging with fat suppression. The brain perfusion MRI dataset was analyzed using the MR Neuro Workflow of the Syngovia workstation (Siemens Healthcare GmbH). The local arterial input function method was used to determine mean transit time, CBF, and cerebral blood volume and to generate a time-to-peak perfusion map. PET data were reconstructed using the following parameters: ordered subset expectation maximization plus PSF (ordered subset expectation maximization + PSF of HD PET) with 6 iterations and 21 subsets, matrix size = 512 × 512, zoom = 2, and an all-pass filter. Blood glucose of all patients was less than 140 mg/dL before 18F-FDG administration (median, 87.5 mg/dL; range, 67–128 mg/dL).
MIM Analysis
Subtraction Analysis
The MIM software neuro subtraction workflow with normalized whole-brain cluster analysis (P = 0.05) of FDG metabolism and 15O-water PET brain perfusion (MIM Software Inc., Cleveland, Ohio) was used to analyze the baseline (follow-up study) and comparison datasets (postvaccination study). The T1W MPRAEG image was fused with the subtracted image for anatomical identification. Differences were determined based on the statistical deviations from the mean difference within the whole brain. Regional differences between the follow-up and first-visit images used a threshold of 2.5 SDs.
Healthy Population Database Comparison Analysis
The healthy population database comparison workflow of 18F-FDG was used to compare the static PET dataset of each patient with the Chulabhorn Hospital normal database, which was generated from 64 healthy subjects. Areas of hypometabolism with a difference greater than 2.5 Z score were visualized using a stereotactic surface projection, normalized by the cerebellum.
Generalized Anxiety Disorder Assessment
Generalized anxiety disorder assessment was performed in all patients using the Generalized Anxiety Disorder 7-item scale (GAD-7), which is a screening tool for anxiety disorders. The GAD-7 score ranges from 0 to 21, and 0–9 = mild anxiety, 10–14 = moderate anxiety, and 15–21 = severe anxiety. Responses were examined by 2 clinical psychologists.
RESULTS
Patients
Eight patients (1 man, 7 women, aged 26–47 years [median age, 36.5 years]) underwent CT, MRI, 18F-FDG PET/MRI, and 15O-water PET of the brain, except 1 patient who did not undergo 15O-water PET because cyclotron was unavailable on the day. Table 1 summarizes the demographic data of the patients.
TABLE 1.
Patient Characteristics
| Characteristics | |
|---|---|
| Sex, n (%) | |
| Female | 7 (88%) |
| Male | 1 (12%) |
| Age, y | |
| Median | 36.5 |
| Range | 26–47 |
| Neurological symptom, n (%) | |
| Paresthesia | 6 (75%) |
| Weakness | 4 (50%) |
| Headache | 3 (38%) |
| Nausea | 3 (38%) |
| Dizziness/drowsiness | 1 (13%) |
| Face drooping | 1 (13%) |
| Muscle spasms | 1 (13%) |
| Dysesthesia | 1 (13%) |
| Blurred vision | 1 (13%) |
| Vaccine, n (%) | |
| Sinovac | 7 (88%) |
| AstraZeneca | 1 (12%) |
| Underlying condition* | |
| None | 4 (50%) |
| Neuropsychological condition | |
| Migraine | 2 (25%) |
| Panic disorder | 1 (13%) |
| Depressive disorder/bipolar disorder | 2 (25%) |
| Allergic rhinitis | 1 (13%) |
*Underlying condition means underlying neuropsychological and other medical conditions.
CT and MRI
There was no evidence of vascular abnormality, acute infarction, or hemorrhage on the CT or MRI scan in any of the patients. One patient had an old lacunar infarction on their MRI. Figure 1 presents a representative case.
FIGURE 1.
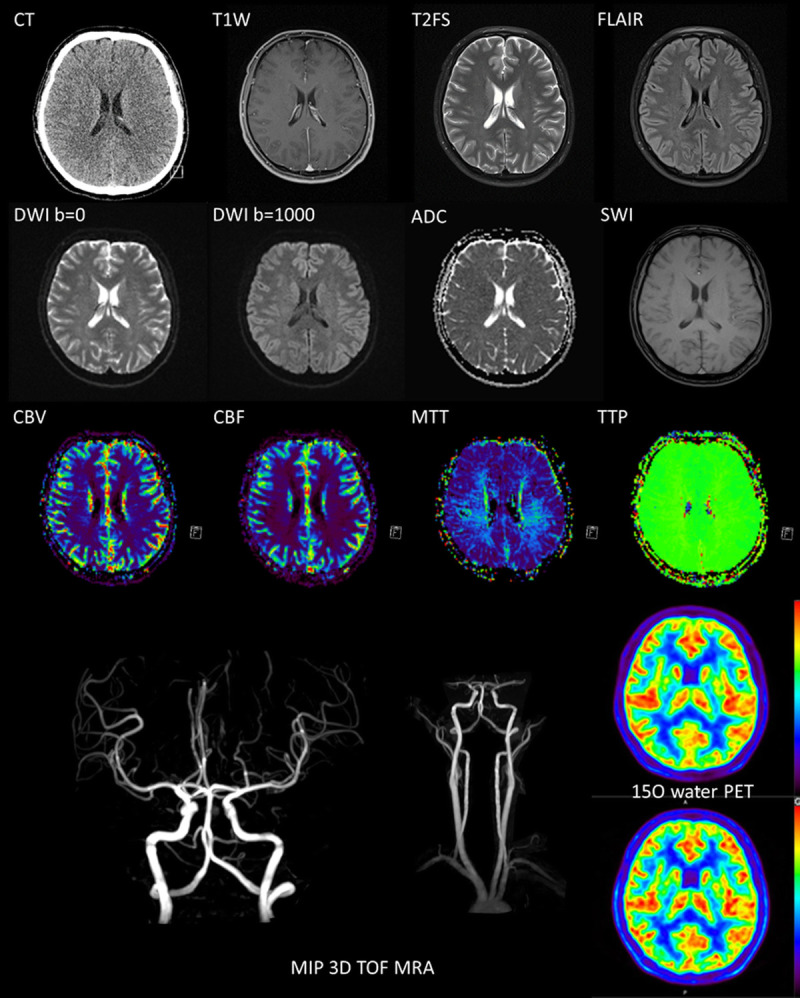
An example case (patient 2) of a normal CT, MRI, MRA, MR perfusion, and 15O-water PET.
15O-Water PET Brain
The 15O-water PET of the brain showed symmetrical cerebral perfusion in all patients. After subtracting the first-visit images from the follow-up images, there were 2 patients (patients 6 and 8) who had significantly increased and decreased perfusion, as described in Figure 2.
FIGURE 2.
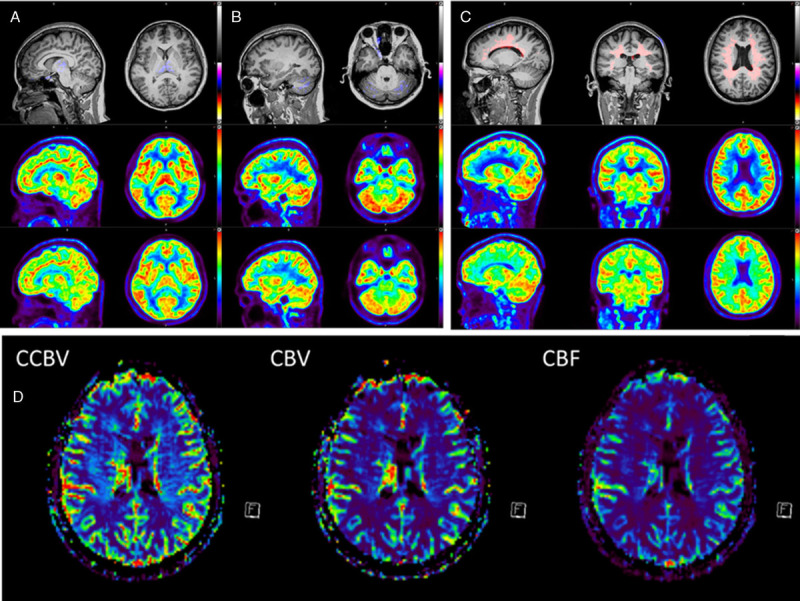
15O-water and cluster subtraction (P = 0.05) images of patients with neurological symptoms for the first visit and follow-up using the MIM software. Mildly significant decreased perfusion in the bilateral thalamus (A) and bilateral cerebellum (B) in patient 6 (C, D) Mildly diffuse increased perfusion in the cerebral white matter of patient 8 was also noted on both the 15O-water and MRI perfusion images.
18F-FDG PET/MRI
The visual analysis showed moderate to marked decreases in metabolism in the bilateral parietal cortex of all 8 patients (Fig. 3). Metabolic changes in the bilateral cuneus were also observed in patients with neurological symptoms during the first visit. Decreased FDG uptake (hypometabolism) was observed in 6 patients and increased FDG uptake (hypermetabolism) was detected in 2 patients (Fig. 4). The subtraction of the first visit FDG PET/MRI scans from the follow-up images revealed no significant change in metabolism in the bilateral occipital region in 3 patients (Table 2), 2 patients showed a significant increase (Table 3), and 3 patients showed a significant decrease (Table 4). Metabolic differences were found only in patients whose neurological symptoms had recovered. Table 5 reveals the semiquantitative data in the occipital region of all patients.
FIGURE 3.
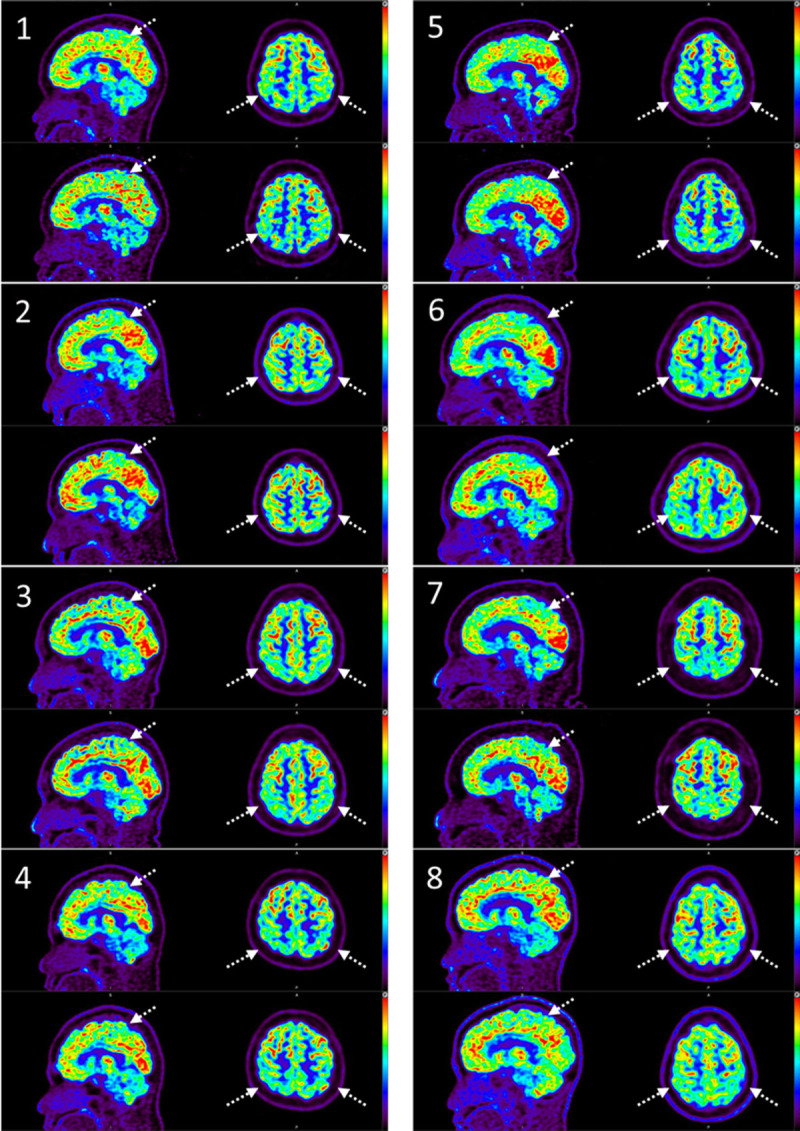
18F-FDG PET/CT sagittal and axial images with the same level of normalized imaging contrast during the first visit (top) and at follow-up (bottom). Areas of hypometabolism were detected in the bilateral parietal lobes in all 8 patients in both the first-visit and follow-up 18F-FDG PET/MRI.
FIGURE 4.
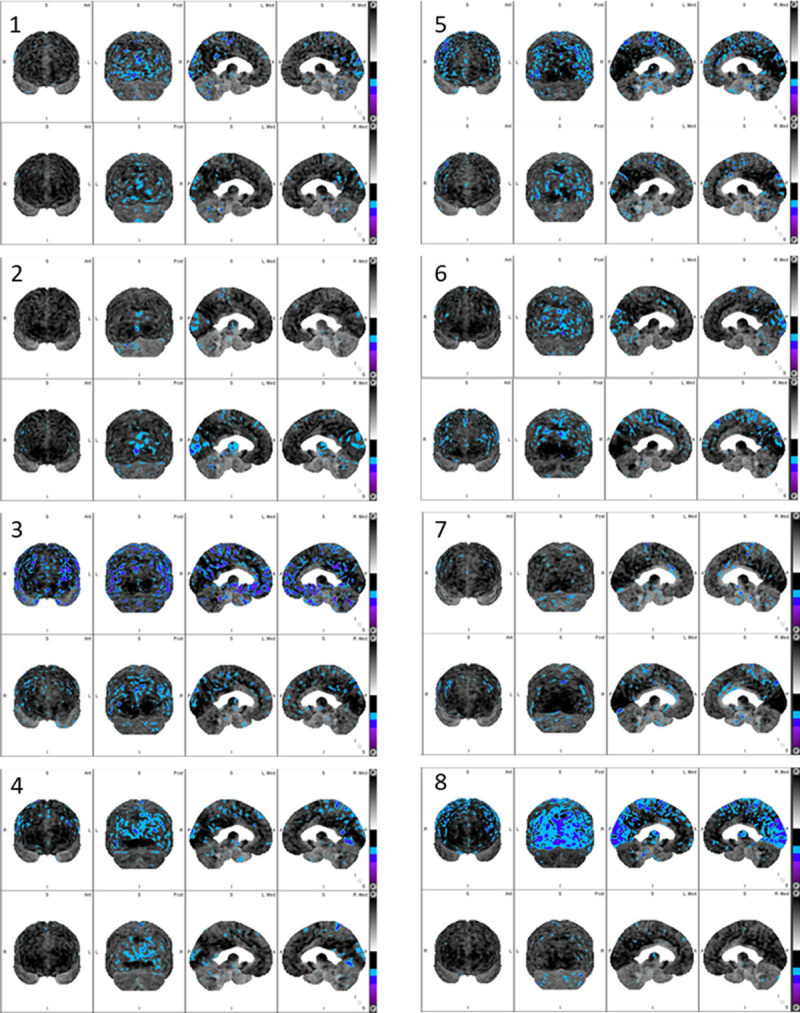
MIM software output image showing the anterior, posterior, and medial 3D stereotactic surface projections normalized by the cerebellum. The SUVr was compared with the Chulabhorn Hospital normal database for FDG uptake (63 healthy volunteers; median age, 65.97 ± 5.77 years; age range, 56–78 years). Areas with a difference of less than 2.5 Z score during the first visit (top) and the follow-up (bottom) are indicated by the color scale. Areas of hypometabolism were detected in the bilateral parietal lobes in all patients in both the first-visit and follow-up 18F-FDG PET/MRI. Metabolic changes in the bilateral cuneus were also observed during the first visit, with decreased FDG uptake (hypometabolism) observed in 6 patients and increased FDG uptake (hypermetabolism) observed in 2 patients (patients 2 and 5). These findings correspond to the raw images.
TABLE 2.
18F-FDG PET/MRI and Cluster Subtraction (P = 0.05) Images Between the First-Visit and Follow-up Images Using the MIM Software (FDG Examination of Patients 1, 3, and 4)
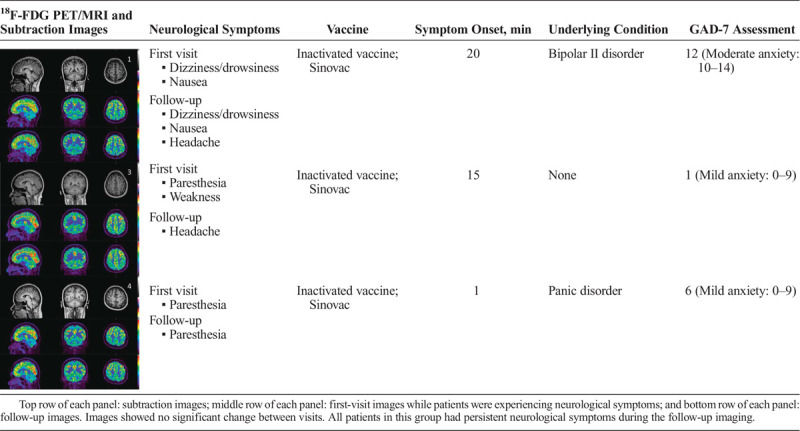
TABLE 3.
18F-FDG PET/MRI and Cluster Subtraction Images Between the First-Visit and Follow-up Images in Patients 2 and 5 Showing Significantly Higher FDG Uptake in the Bilateral Cuneus During the First Visit Compared With Follow-up
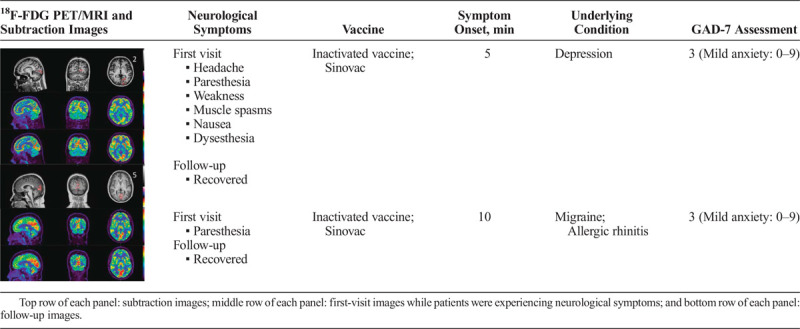
TABLE 4.
18F-FDG PET/MRI and Cluster Subtraction Images Between the First-Visit and Follow-up Images in Patients 2 and 5 Showing Significantly Higher FDG Uptake in the Bilateral Cuneus During the First Visit Compared With Follow-up
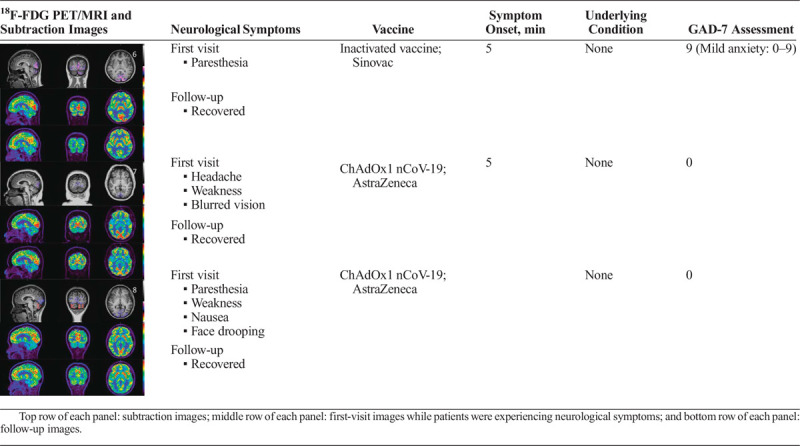
TABLE 5.
Semiquantitative Data
| ID | SUVmean First Visit |
SUVmean Follow-up |
%Change | TLG First Visit |
TLG Follow-up |
%Change | PCNTmean | Integral PCNT | Volume |
|---|---|---|---|---|---|---|---|---|---|
| 1 | No cluster | ||||||||
| 2 | 14.4 | 9.05 | 59.12 | 47.4 | 29.8 | 59.06 | 20.74 | 68.3 | 3.29 |
| 3 | No cluster | ||||||||
| 4 | No cluster | ||||||||
| 5 | 11.28 | 7.73 | 45.92 | 78.25 | 53.64 | 45.88 | 25.11 | 174.28 | 6.94 |
| 6 | 6.62 | 12.48 | 46.96 | 165.53 | 312.51 | 47.03 | 29.91 | 748.83 | 25.02 |
| 7 | 14.77 | 18.02 | 18.04 | 79.46 | 97.37 | 18.39 | 22.53 | 121.73 | 5.38 |
| 8 | 5.76 | 8.57 | 32.79 | 113.74 | 169.25 | 32.80 | 23.86 | 471.46 | 19.76 |
| Median | 11.28 | 9.05 | 45.92 | 79.46 | 97.37 | 45.88 | 23.86 | 174.28 | 6.94 |
| SD | 4.23 | 4.23 | 15.67 | 44.99 | 113.75 | 15.52 | 3.47 | 287.53 | 9.68 |
The median %change of the SUVmean and %change of the SUVmean in the occipital region in patients who showed a significant difference in FDG uptake in this region between the first visit and follow-up were 45.92% ± 15.67% and 45.88% ± 15.52%, respectively. The median integral PCNT, which was calculated by the PCNTmean multiplied by cluster volume, was 174.28 ± 287.53. These values confirm the significant difference in occipital FDG uptake detected by visual analysis.
PCNT, PET autonormalized value subtraction.
DISCUSSION
During the administration of a mass vaccination program, ISRRs may arise, which are characterized by a range of symptoms and signs that occur after vaccination as a stress response. Stress responses are complex and involve a combination of physiological, psychological, and social factors, which are referred to as the biopsychosocial model. The stress response may present with both physical and psychological symptoms that are interconnected.12 Reports of clusters of ISRR may generate public concern and disrupt the immunization program. The risk factors of cluster events and the evidence used to describe these stress responses are important for reassuring the community. Symptoms experienced may include vasovagal reactions and dissociative neurological symptom reactions. Dissociative neurological symptom reactions are more common in women and may take minutes to days to develop after immunization.13,14
There have been reports of clusters of people with acute stroke-like symptoms (paresthesia, weakness, speech difficulty, and face drooping) after receiving the COVID-19 vaccine in several areas of Thailand. However, no anatomical abnormalities were found on CT or MRI.
Our study is the first to report alterations in regional brain glucose metabolism in a group of patients with neurological adverse effects after COVID-19 vaccination. We found no evidence of vascular abnormality, acute infarction, or hemorrhage on the CT or MRI scans. On the 15O-water PET images, 1 patient exhibited a mildly significant decrease in perfusion in the bilateral thalamus and bilateral cerebellum, and another patient showed a diffuse increase in perfusion in the cerebral white matter. These 2 patients showed the greatest change in brain glucose metabolism. The patient with a mildly significant decrease in perfusion in the bilateral thalamus and bilateral cerebellum on the 15O-water PET did not show any abnormalities on their MRI perfusion image, which may indicate minor perfusion changes or nonspecific findings, although thalamus connectome data have suggested an association with anxiety.15,16 However, the diffuse increase in perfusion in the cerebral white matter was observed on both the 15O-water PET and MRI perfusion images. Previous studies have shown that increased cerebral blood volume and CBF can be detected in normal-appearing white matter in patients with inflammatory conditions, such as multiple sclerosis.17
The visual and semiquantitative analyses (i.e., the MIM software analysis) showed lower glucose metabolism in the bilateral parietal lobes in all patients compared with that in the normal population during both the first-visit and follow-up 18F-FDG PET/MRI. Metabolic changes in the bilateral cuneus were also observed during the first visit while patients were experiencing neurological symptoms. Decreased FDG uptake (hypometabolism) was observed in 6 patients, and increased FDG uptake (hypermetabolism) was observed in 2 patients.
The observed regions of metabolic abnormality were part of the fear network model (FNM) and may be related to the hyperactivation of the parietal and occipital regions and the reduced functional connectivity of the parietofrontolimbic regions in electroencephalography-based and task MRI-based networks reported in anxiety disorder patients.18–22 Hypometabolism in the precuneus and cuneus detected using FDG PET/MRI is thought to represent decreased functional connectivity or synaptic dysfunction, which may interfere with the processing and integration of sensory perception information from the somatosensory and visual cortices to the frontolimbic network.18,23 The subtraction images showed significantly lower FDG uptake in the bilateral cuneus in 3 patients, whereas 2 patients exhibited significantly higher FDG uptake in the bilateral cuneus compared with the first-visit study.
Previous data have revealed that regional cerebral hypermetabolism can be observed in hyperactivated patients, but they need not have dysconnectivity.22,24 Moreover, the FNM is associated with disturbances of the autonomic nervous system, which may explain the vasovagal reaction in patients with ISRR.25
The patient characteristics of this study showed that most patients were women (88% [7/8]) and had underlying neuropsychological conditions (50% [4/8]). According to the ISRR synopsis proposed by the World Health Organization, sex is a biological factor facilitating a vasovagal reaction after immunization. Particularly, females are more predisposed than males. Moreover, the prevalence of anxiety disorder in female is significantly with a greater risk than male.26 Overall, our study findings support the concept of and evidence for the ISRR and the biopsychosocial model. In addition, previous studies have shown that underlying neuropsychological conditions are associated with immunity,27–30 which may upregulate or downregulate ISRRs. A comprehensive assessment of immune status and ISRR will provide further insight into this issue.
A recent study on the association between 18F-FDG PET/CT of the brain and neuronal function effects in COVID-19 patients found that the covariance pattern of brain metabolism (a prominent decrease in cortical FDG uptake) correlates strongly with cognitive performance. All COVID-19 vaccines are composed of a part of the virus (SARS-CoV-2), which may be an important factor that influences the alteration of the brain following vaccination.31
We hypothesized that vaccination is a stress, which causes neuroimmunological alteration in the brain. The stress may affect patients' sensory perception via somatosensory and visual cortices located at precuneus and cuneus. The alteration of FDG uptake in the brain detected by FDG PET/MRI is believed to represent abnormal functional connectivity or synaptic dysfunction, depending on the neuroimmunological status. In the meantime, the observed regions of metabolic abnormality are part of the FNM, which could be explained by the copathway between FNM and ISRR networks. The underlying neuropsychological conditions and sex (female) are factors facilitating ISRRs. Therefore, our overall findings in this study support the concept of biopsychosocial model.
Our study was limited by the small number of subjects. In addition, the neurological symptoms after COVID-19 vaccination and the follow-up duration varied across individuals. Nevertheless, our preliminary study results were statistically significant. Furthermore, despite these limitations, our findings suggested that significant metabolic alterations can be detected using 18F-FDG PET/MRI and cerebral perfusion with 15O-water PET of the brain following COVID-19 vaccination, which may be related to neurological symptoms or the ISRR via the FNM and the anxiety network. Further studies in a larger population are needed to confirm the relationship between metabolic and cerebral perfusion changes in this patient group.
CONCLUSION
This study is the first to describe alterations in regional brain glucose metabolism and cerebral perfusion on 15O-water PET images in patients with neurological adverse effects following COVID-19 vaccination. Our semiquantitative and visual analyses revealed significant metabolic changes in bilateral parietal and occipital regions. All regions of metabolic abnormality were part of the FNM that has been implicated in anxiety.
Acknowledgment
The authors thank Sarina Iwabuchi, PhD, from Edanz (www.edanz.com/ac), for editing a draft of this article.
Footnotes
Conflicts of interest and sources of funding: none declared.
Contributor Information
Anchisa Kunawudhi, Email: anchisa.kun@pccms.ac.th.
Chetsadaporn Promteangtrong, Email: chetsadaporn.pro@pccms.ac.th.
Peerapon Kiatkittikul, Email: peerapon.kia@cra.ac.th.
Attapon Jantarato, Email: attapon.jan@pccms.ac.th.
Arthita Choolam, Email: acs.arthita@gmail.com.
Krongkamol Ponglikitmongkol, Email: krongkamol.pon@pccms.ac.th.
Taweegrit Siripongboonsitti, Email: taweegrit.sir@pccms.ac.th.
Tharathorn Kaeowirun, Email: marucaramel@gmail.com.
Chanisa Chotipanich, Email: chanisa.cho@pccms.ac.th.
REFERENCES
- 1.Mehrotra DV Janes HE Fleming TR, et al. Clinical endpoints for evaluating efficacy in COVID-19 vaccine trials. Ann Intern Med. 2021;174:221–228. [DOI] [PMC free article] [PubMed] [Google Scholar]
- 2.Goss AL Samudralwar RD Das RR, et al. ANA investigates: neurological complications of COVID-19 vaccines. Ann Neurol. 2021;89:856–857. [DOI] [PMC free article] [PubMed] [Google Scholar]
- 3.Lu L Xiong W Mu J, et al. The potential neurological effect of the COVID-19 vaccines: a review. Acta Neurol Scand. 2021;144:3–12. [DOI] [PMC free article] [PubMed] [Google Scholar]
- 4.McMurtry CM. Managing immunization stress-related response: a contributor to sustaining trust in vaccines. Can Commun Dis Rep. 2020;46:210–218. [DOI] [PMC free article] [PubMed] [Google Scholar]
- 5.Gold MS MacDonald NE McMurtry CM, et al. Immunization stress-related response—redefining immunization anxiety-related reaction as an adverse event following immunization. Vaccine. 2020;38:3015–3020. [DOI] [PubMed] [Google Scholar]
- 6.Gao Q Bao L Mao H, et al. Development of an inactivated vaccine candidate for SARS-CoV-2. Science. 2020;369:77–81. [DOI] [PMC free article] [PubMed] [Google Scholar]
- 7.Voysey M Clemens SAC Madhi SA, et al. Safety and efficacy of the ChAdOx1 nCoV-19 vaccine (AZD1222) against SARS-CoV-2: an interim analysis of four randomised controlled trials in Brazil, South Africa, and the UK. Lancet. 2021;397:99–111. [DOI] [PMC free article] [PubMed] [Google Scholar]
- 8.Herscovitch P, Markham J, Raichle ME. Brain blood flow measured with intravenous H2(15)O. I. Theory and error analysis. J Nucl Med. 1983;24:782–789. [PubMed] [Google Scholar]
- 9.Raichle ME Martin WR Herscovitch P, et al. Brain blood flow measured with intravenous H2(15)O. II. Implementation and validation. J Nucl Med. 1983;24:790–798. [PubMed] [Google Scholar]
- 10.Ssali T Anazodo UC Thiessen JD, et al. A noninvasive method for quantifying cerebral blood flow by hybrid PET/MRI. J Nucl Med. 2018;59:1329–1334. [DOI] [PubMed] [Google Scholar]
- 11.Zaro-Weber O Moeller-Hartmann W Siegmund D, et al. MRI-based mismatch detection in acute ischemic stroke: optimal PWI maps and thresholds validated with PET. J Cereb Blood Flow Metab. 2017;37:3176–3183. [DOI] [PMC free article] [PubMed] [Google Scholar]
- 12.World Health Organization . Immunization Stress-Related Response: A Manual for Program Managers and Health Professionals to Prevent, Identify and Respond to Stress-Related Responses Following Immunization. World Health Organization; 2019. [Google Scholar]
- 13.Yagi A Ueda Y Egawa-Takata T, et al. Development of an efficient strategy to improve HPV immunization coverage in Japan. BMC Public Health. 2016;16:1013. [DOI] [PMC free article] [PubMed] [Google Scholar]
- 14.Loharikar A Suragh TA MacDonald NE, et al. Anxiety-related adverse events following immunization (AEFI): a systematic review of published clusters of illness. Vaccine. 2018;36:299–305. [DOI] [PMC free article] [PubMed] [Google Scholar]
- 15.Zhang X Li X Steffens DC, et al. Dynamic changes in thalamic connectivity following stress and its association with future depression severity. Brain Behav. 2019;9:e01445. [DOI] [PMC free article] [PubMed] [Google Scholar]
- 16.Kark SM Birnie MT Baram TZ, et al. Functional connectivity of the human paraventricular thalamic nucleus: insights from high field functional MRI. Front Integr Neurosci. 2021;15:662293. [DOI] [PMC free article] [PubMed] [Google Scholar]
- 17.Bester M Forkert ND Stellmann JP, et al. Increased perfusion in Normal appearing white matter in high inflammatory multiple sclerosis patients. PLoS One. 2015;10:e0119356. [DOI] [PMC free article] [PubMed] [Google Scholar]
- 18.Brühl AB Delsignore A Komossa K, et al. Neuroimaging in social anxiety disorder—a meta-analytic review resulting in a new neurofunctional model. Neurosci Biobehav Rev. 2014;47:260–280. [DOI] [PubMed] [Google Scholar]
- 19.Sylvester CM Corbetta M Raichle ME, et al. Functional network dysfunction in anxiety and anxiety disorders. Trends Neurosci. 2012;35:527–535. [DOI] [PMC free article] [PubMed] [Google Scholar]
- 20.Nagai M, Kishi K, Kato S. Insular cortex and neuropsychiatric disorders: a review of recent literature. Eur Psychiatry. 2007;22:387–394. [DOI] [PubMed] [Google Scholar]
- 21.Knyazev GG Savostyanov AN Bocharov AV, et al. Anxiety, depression, and oscillatory dynamics in a social interaction model. Brain Res. 2016;1644:62–69. [DOI] [PubMed] [Google Scholar]
- 22.Lange I Goossens L Bakker J, et al. Functional neuroimaging of associative learning and generalization in specific phobia. Prog Neuropsychopharmacol Biol Psychiatry. 2019;89:275–285. [DOI] [PubMed] [Google Scholar]
- 23.Sala A, Perani D. Brain molecular connectivity in neurodegenerative diseases: recent advances and new perspectives using positron emission tomography. Front Neurosci. 2019;13:617. [DOI] [PMC free article] [PubMed] [Google Scholar]
- 24.Chiaravalloti A Micarelli A Ricci M, et al. Evaluation of task-related brain activity: is there a role for 18F FDG-PET imaging? Biomed Res Int. 2019;2019:4762404–4762410. [DOI] [PMC free article] [PubMed] [Google Scholar]
- 25.Lai C-H. Fear network model in panic disorder: the past and the future. Psychiatry Investig. 2019;16:16–26. [DOI] [PMC free article] [PubMed] [Google Scholar]
- 26.Gater R Tansella M Korten A, et al. Sex differences in the prevalence and detection of depressive and anxiety disorders in general health care settings: report from the World Health Organization collaborative study on psychological problems in general health care. Arch Gen Psychiatry. 1998;55:405–413. [DOI] [PubMed] [Google Scholar]
- 27.Kim Y-K, Jeon SW. Neuroinflammation and the immune-kynurenine pathway in anxiety disorders. Curr Neuropharmacol. 2018;16:574–582. [DOI] [PMC free article] [PubMed] [Google Scholar]
- 28.Michopoulos V Powers A Gillespie CF, et al. Inflammation in fear- and anxiety-based disorders: PTSD, GAD, and beyond. Neuropsychopharmacology. 2017;42:254–270. [DOI] [PMC free article] [PubMed] [Google Scholar]
- 29.Brunoni AR Supasitthumrong T Teixeira AL, et al. Differences in the immune-inflammatory profiles of unipolar and bipolar depression. J Affect Disord. 2020;262:8–15. [DOI] [PubMed] [Google Scholar]
- 30.Cavestro C Ferrero M Mandrino S, et al. Novelty in inflammation and immunomodulation in migraine. Curr Pharm Des. 2019;25:2919–2936. [DOI] [PubMed] [Google Scholar]
- 31.Blazhenets G Schroeter N Bormann T, et al. Slow but evident recovery from neocortical dysfunction and cognitive impairment in a series of chronic COVID-19 patients. J Nucl Med. 2021;62:910–915. [DOI] [PMC free article] [PubMed] [Google Scholar]


